INSURANCE RISK STUDY - Risk - Retirement - Health | Aon · The Insurance Risk Study quantifies the...
16
INSURANCE RISK STUDY Risk Quantification in a Connected World
Transcript of INSURANCE RISK STUDY - Risk - Retirement - Health | Aon · The Insurance Risk Study quantifies the...

INSURANCE RISK STUDYRisk Quantification in a Connected World
2
Rating agencies, regulators and investors today are demanding that insurers provide detailed assessments of their risk tolerance and quantify
the adequacy of their economic capital. To complete such assessments requires a credible baseline for underwriting volatility. In order to
help its clients address these needs Aon Benfield began a detailed study of underwriting volatility in 2003 leading to the Insurance Risk
Study, which is published annually in September. The Study provides our clients with an objective and data-driven set of underwriting
volatility benchmarks by line of business and country as well as correlations by line and country. These benchmarks are a valuable resource
to chief risk officers, actuaries, and other economic capital modeling professionals who seek reliable parameters for their models.
Using the factors in the Study as a complement to existing industry or proprietary frequency and severity curves, insurers can assess the volatility
of their business using the same metrics as catastrophe models. For example, it is possible to estimate the aggregate loss potential over an accident
year, both with and without the impact of the pricing cycle, analogous to catastrophe model aggregate Probable Maximum Losses (PMLs).
Aon Benfield’s Prime/ReTM insurance simulation tool is available to clients to carry out the required calculations. Prime/Re is described on
the last page of this booklet.
The Study quantifies the systemic risk or volatility of each line of business for 17 countries comprising over 75 percent of global premium.
Systemic risk in the Study is the coefficient of variation of loss ratio for a large book of business. Coefficient of variation (CV) is a commonly
used normalized measure of risk defined as the standard deviation divided by the mean. Systemic risk typically comes from non-diversifiable
risk sources such as changing market rate adequacy, unknown prospective frequency and severity trend, weather-related losses, legal reforms
and court decisions, the level of economic activity and other macroeconomic factors. It also includes the risk to smaller and specialty lines
of business caused by a lack of credible data. For many lines of business systemic risk is the major component of underwriting volatility.
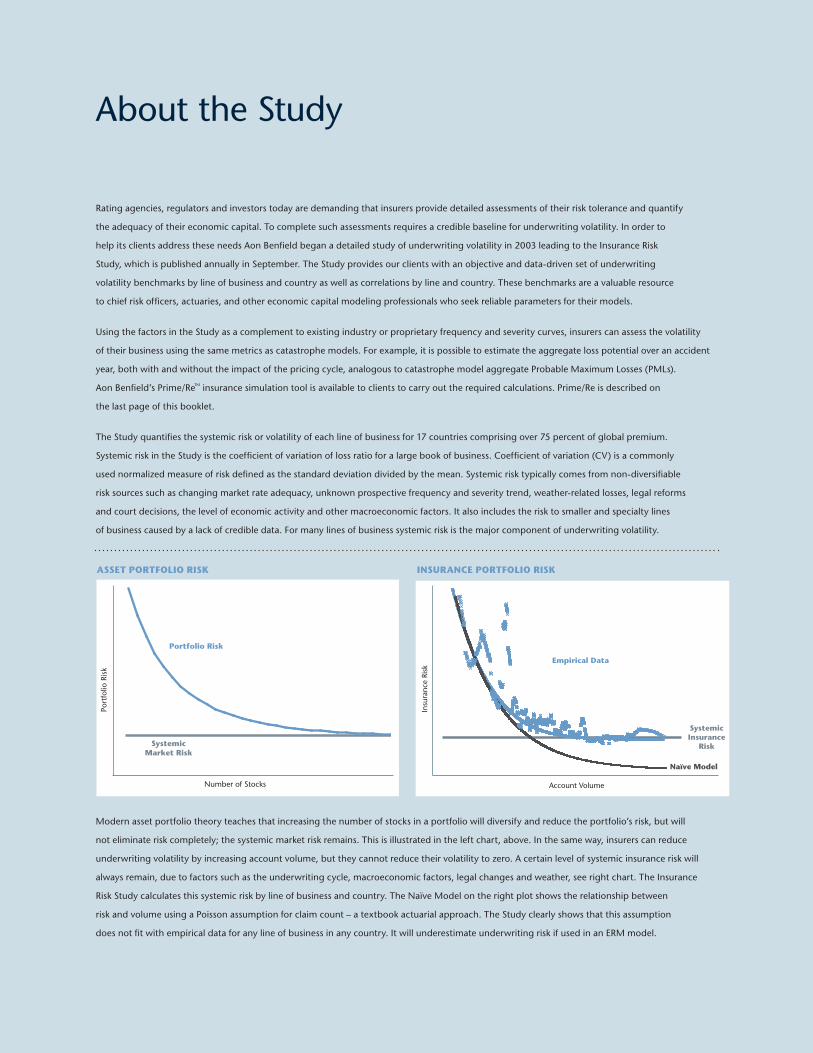
Modern asset portfolio theory teaches that increasing the number of stocks in a portfolio will diversify and reduce the portfolio’s risk, but will
not eliminate risk completely; the systemic market risk remains. This is illustrated in the left chart, above. In the same way, insurers can reduce
underwriting volatility by increasing account volume, but they cannot reduce their volatility to zero. A certain level of systemic insurance risk will
always remain, due to factors such as the underwriting cycle, macroeconomic factors, legal changes and weather, see right chart. The Insurance
Risk Study calculates this systemic risk by line of business and country. The Naïve Model on the right plot shows the relationship between
risk and volume using a Poisson assumption for claim count – a textbook actuarial approach. The Study clearly shows that this assumption
does not fit with empirical data for any line of business in any country. It will underestimate underwriting risk if used in an ERM model.
About the Study
Portfolio Risk
SystemicMarket Risk
Number of Stocks
Port
folio
Ris
k
Account Volume
Insu
ranc
e Ri
sk
SystemicInsurance
Risk
Naïve Model
Empirical Data
Asset portfolio risk insurAnce portfolio risk

3
Aon Benfield Insurance Risk Study
Results from 17 countries comprising >over 75 percent of global premium
Results for eight core lines of business, with >more granular line splits varying by country
Correlations between lines within a country >
Correlations between countries, measuring >an international pricing cycle
Indication of the state of the pricing cycle by country >
Risk in growing and emerging markets is greater >than in established markets, highlighting the need for region-appropriate risk management initiatives.
Commercial lines underwriting risk is >substantial across the Study.
Underwriting risk for personal lines is 10 to 15 >points lower than for commercial lines and is often driven by natural catastrophe risk.
Correlations between lines within a country >vary by country, but are typically moderate to substantial. These correlations can significantly dilute diversification benefits for national writers.
There are strong correlations between countries, >driven by an international pricing cycle. These are especially evident between the major economies. They further dilute diversification benefits for international writers.
Eight of the 12 countries with GDP exceeding >USD 1 trillion, and seven of the G8 countries, have declining insurance premium-to-GDP ratios, indicating a softening pricing environment.
Aon Benfield’s 2008 Insurance Risk Study provides the industry’s leading publicly available set of risk parameters for modeling and benchmarking underwriting risk. The factors in the Study are an essential input for management to accurately quantify and manage underwriting portfolio risk, and to communicate the results credibly with rating agencies, regulators, investors and boards of directors. Additionally, the Study will help companies considering mergers and acquisitions determine post-transaction underwriting risk and optimal capital structures. Our Investment Banking Group professionals work with Aon Benfield actuaries to incorporate our proprietary research into their analysis and structuring advice.
The latest edition of the Study has a greatly expanded scope, including:
2008 key f indings
Highlights of this year’s study include:
The Insurance Risk Study applies sophisticated techniques from risk theory to over 1.5 million data points, spanning 17 countries and 178 different line/country combinations. Data sources include regulatory filings, statistical agents and rating agencies.
4
insurance risk study
Global Risk Parameters
underwriting cycle And insurAnce penetrAtion
In addition to the line of business detail for each country, the 2008 Study also includes an analysis of countries’ insurance penetration as measured by the ratio of gross written premium to GDP. These statistics provide insight into how “insured” countries are and show different levels of insurance penetration for developing versus mature markets. This analysis includes historical premium-to-GDP data from 31 countries.
common themes
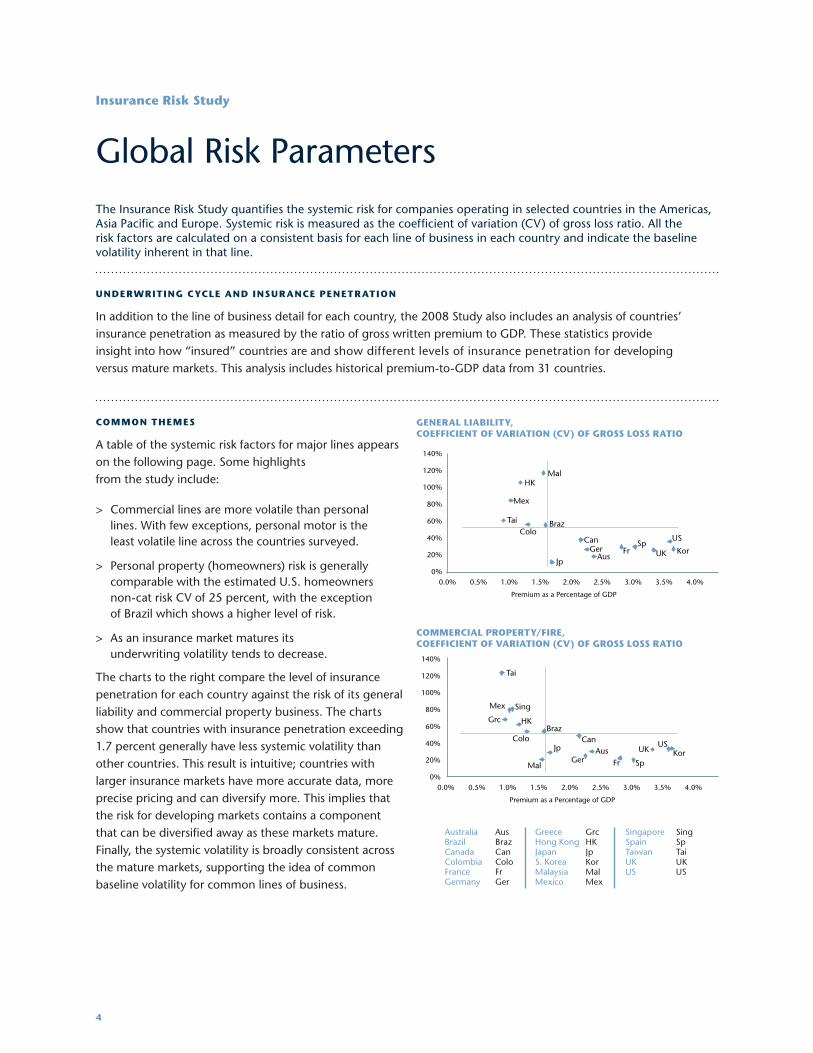
A table of the systemic risk factors for major lines appears on the following page. Some highlights from the study include:
Commercial lines are more volatile than personal >lines. With few exceptions, personal motor is the least volatile line across the countries surveyed.
Personal property (homeowners) risk is generally >comparable with the estimated U.S. homeowners non-cat risk CV of 25 percent, with the exception of Brazil which shows a higher level of risk.
As an insurance market matures its >underwriting volatility tends to decrease.
The charts to the right compare the level of insurance penetration for each country against the risk of its general liability and commercial property business. The charts show that countries with insurance penetration exceeding 1.7 percent generally have less systemic volatility than other countries. This result is intuitive; countries with larger insurance markets have more accurate data, more precise pricing and can diversify more. This implies that the risk for developing markets contains a component that can be diversified away as these markets mature. Finally, the systemic volatility is broadly consistent across the mature markets, supporting the idea of common baseline volatility for common lines of business.
The Insurance Risk Study quantifies the systemic risk for companies operating in selected countries in the Americas, Asia Pacific and Europe. Systemic risk is measured as the coefficient of variation (CV) of gross loss ratio. All the risk factors are calculated on a consistent basis for each line of business in each country and indicate the baseline volatility inherent in that line.
generAl liAbility, coefficient of vAriAtion (cv) of gross loss rAtio
Australia AusBrazil BrazCanada CanColombia ColoFrance FrGermany Ger
Greece GrcHong Kong HKJapan JpS. Korea KorMalaysia MalMexico Mex
Singapore SingSpain SpTaiwan TaiUK UKUS US
commerciAl property/fire, coefficient of vAriAtion (cv) of gross loss rAtio
0%
20%
40%
60%
80%
100%
120%
140%
0.0% 0.5% 1.0% 1.5% 2.0% 2.5% 3.0% 3.5% 4.0%
Premium as a Percentage of GDP
0%
20%
40%
60%
80%
100%
120%
140%
0.0% 0.5% 1.0% 1.5% 2.0% 2.5% 3.0% 3.5% 4.0%
Premium as a Percentage of GDP
US
Mex
ColoCan
Braz
Jp
Tai
Mal
Kor
HK
Aus
SpUKGer Fr
US
Mex
Colo CanBraz
Jp
Tai
Sing
Kor
HK
Aus
Sp
UK
Grc
Ger FrMal
0%
20%
40%
60%
80%
100%
120%
140%
0.0% 0.5% 1.0% 1.5% 2.0% 2.5% 3.0% 3.5% 4.0%
Premium as a Percentage of GDP
0%
20%
40%
60%
80%
100%
120%
140%
0.0% 0.5% 1.0% 1.5% 2.0% 2.5% 3.0% 3.5% 4.0%
Premium as a Percentage of GDP
US
Mex
ColoCan
Braz
Jp
Tai
Mal
Kor
HK
Aus
SpUKGer Fr
US
Mex
Colo CanBraz
Jp
Tai
Sing
Kor
HK
Aus
Sp
UK
Grc
Ger FrMal
5
Aon benfield
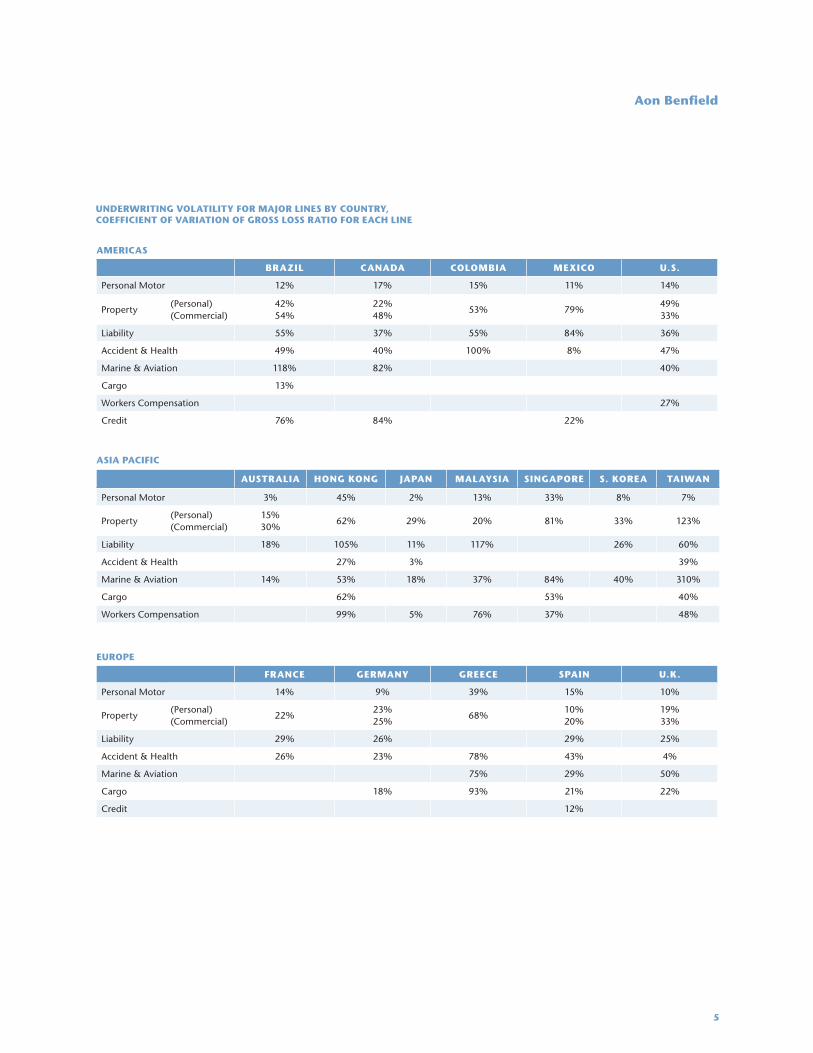
underwriting volAtility for mAJor lines by country, coefficient of vAriAtion of gross loss rAtio for eAch line
AsiA pAcific
AustrAliA hong kong JApAn mAlAysiA singApore s. koreA tAiwAn
Personal Motor 3% 45% 2% 13% 33% 8% 7%
Property(Personal)(Commercial)
15% 30%
62% 29% 20% 81% 33% 123%
Liability 18% 105% 11% 117% 26% 60%
Accident & Health 27% 3% 39%
Marine & Aviation 14% 53% 18% 37% 84% 40% 310%
Cargo 62% 53% 40%
Workers Compensation 99% 5% 76% 37% 48%
europe
frAnce germAny greece spAin u.k.
Personal Motor 14% 9% 39% 15% 10%
Property(Personal)(Commercial)
22%23% 25%
68%10% 20%
19% 33%
Liability 29% 26% 29% 25%
Accident & Health 26% 23% 78% 43% 4%
Marine & Aviation 75% 29% 50%
Cargo 18% 93% 21% 22%
Credit 12%
AmericAs
brAzil cAnAdA colombiA mexico u.s.
Personal Motor 12% 17% 15% 11% 14%
Property(Personal)(Commercial)
42% 54%
22% 48%
53% 79%49% 33%
Liability 55% 37% 55% 84% 36%
Accident & Health 49% 40% 100% 8% 47%
Marine & Aviation 118% 82% 40%
Cargo 13%
Workers Compensation 27%
Credit 76% 84% 22%
6
insurance risk study
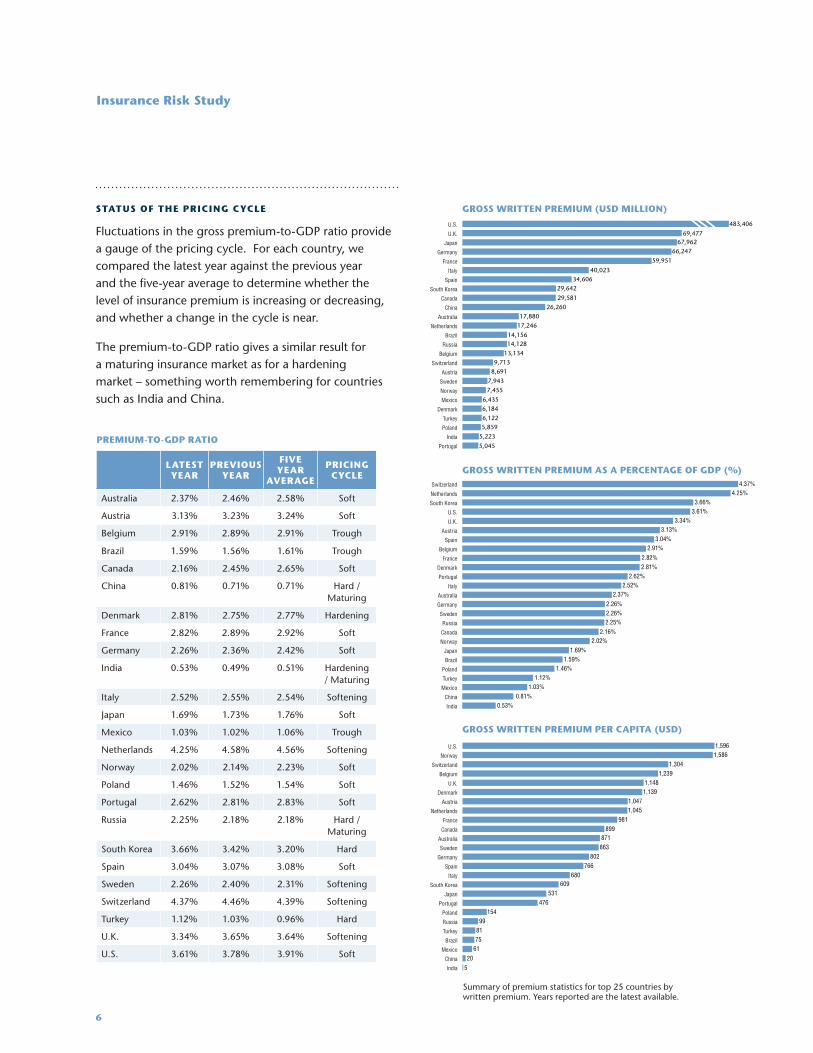
premium-to-gdp rAtio
lAtest yeAr
previous yeAr
five yeAr
AverAge
pricing cycle
Australia 2.37% 2.46% 2.58% Soft
Austria 3.13% 3.23% 3.24% Soft
Belgium 2.91% 2.89% 2.91% Trough
Brazil 1.59% 1.56% 1.61% Trough
Canada 2.16% 2.45% 2.65% Soft
China 0.81% 0.71% 0.71% Hard / Maturing
Denmark 2.81% 2.75% 2.77% Hardening
France 2.82% 2.89% 2.92% Soft
Germany 2.26% 2.36% 2.42% Soft
India 0.53% 0.49% 0.51% Hardening / Maturing
Italy 2.52% 2.55% 2.54% Softening
Japan 1.69% 1.73% 1.76% Soft
Mexico 1.03% 1.02% 1.06% Trough
Netherlands 4.25% 4.58% 4.56% Softening
Norway 2.02% 2.14% 2.23% Soft
Poland 1.46% 1.52% 1.54% Soft
Portugal 2.62% 2.81% 2.83% Soft
Russia 2.25% 2.18% 2.18% Hard / Maturing
South Korea 3.66% 3.42% 3.20% Hard
Spain 3.04% 3.07% 3.08% Soft
Sweden 2.26% 2.40% 2.31% Softening
Switzerland 4.37% 4.46% 4.39% Softening
Turkey 1.12% 1.03% 0.96% Hard
U.K. 3.34% 3.65% 3.64% Softening
U.S. 3.61% 3.78% 3.91% Soft
fpo
stAtus of the pricing cycle
Fluctuations in the gross premium-to-GDP ratio provide a gauge of the pricing cycle. For each country, we compared the latest year against the previous year and the five-year average to determine whether the level of insurance premium is increasing or decreasing, and whether a change in the cycle is near.
The premium-to-GDP ratio gives a similar result for a maturing insurance market as for a hardening market – something worth remembering for countries such as India and China.
0 20000 40000 60000 80000 100000Portugal
India
Poland
Turkey
Denmark
Mexico
Norway
Sweden
Austria
Switzerland
Belgium
Russia
Brazil
Netherlands
Australia
China
Canada
South Korea
Spain
Italy
France
Germany
Japan
U.K.
U.S. 483,406
69,47767,962
66,247
59,951
40,02334,606
29,642
29,58126,260
17,88017,246
14,15614,128
13,1349,713
8,691
7,9437,455
6,4356,184
6,1225,859
5,223
5,045
0 1 2 3 4 5India
China
Mexico
Turkey
Poland
Brazil
Japan
Norway
Canada
Russia
Sweden
Germany
Australia
Italy
Portugal
Denmark
France
Belgium
Spain
Austria
U.K.
U.S.
South Korea
Netherlands
Switzerland 4.37%4.25%
3.66%3.61%
3.34%3.13%
3.04%2.91%
2.82%2.81%
2.62%2.52%
2.37%
2.26%2.26%2.25%
2.16%2.02%
1.69%1.59%
1.46%1.12%
1.03%0.81%
0.53%
0 500 1000 1500 2000India
China
Mexico
Brazil
Turkey
Russia
Poland
Portugal
Japan
South Korea
Italy
Spain
Germany
Sweden
Australia
Canada
France
Netherlands
Austria
Denmark
U.K.
Belgium
Switzerland
Norway
U.S. 1,5961,586
1,3041,239
1,1481,139
1,0471,045
981899
871863
802766
680609
531476
15499
8175
61
205
gross written premium (usd million)
gross written premium As A percentAge of gdp (%)
gross written premium per cApitA (usd)
Summary of premium statistics for top 25 countries by written premium. Years reported are the latest available.
7
Aon benfield
Reserve Riskreserve risk in cApitAl modeling
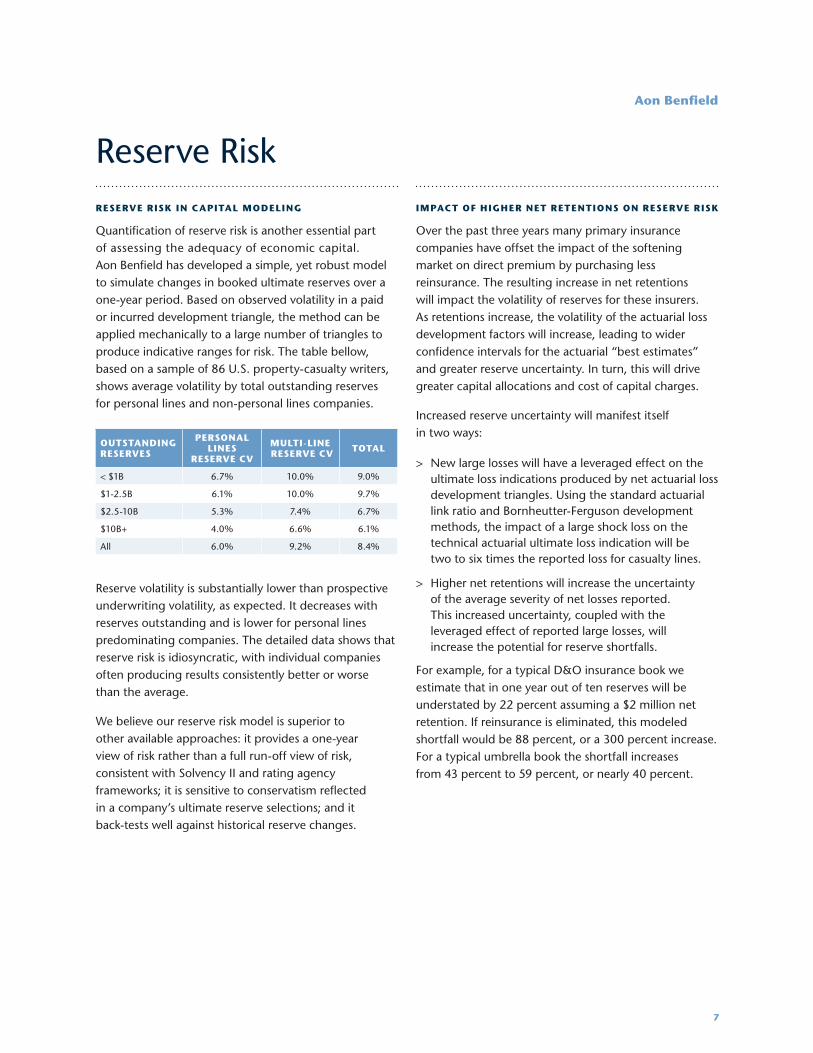
Quantification of reserve risk is another essential part of assessing the adequacy of economic capital. Aon Benfield has developed a simple, yet robust model to simulate changes in booked ultimate reserves over a one-year period. Based on observed volatility in a paid or incurred development triangle, the method can be applied mechanically to a large number of triangles to produce indicative ranges for risk. The table bellow, based on a sample of 86 U.S. property-casualty writers, shows average volatility by total outstanding reserves for personal lines and non-personal lines companies.
Reserve volatility is substantially lower than prospective underwriting volatility, as expected. It decreases with reserves outstanding and is lower for personal lines predominating companies. The detailed data shows that reserve risk is idiosyncratic, with individual companies often producing results consistently better or worse than the average.
We believe our reserve risk model is superior to other available approaches: it provides a one-year view of risk rather than a full run-off view of risk, consistent with Solvency II and rating agency frameworks; it is sensitive to conservatism reflected in a company’s ultimate reserve selections; and it back-tests well against historical reserve changes.
impAct of higher net retentions on reserve risk
Over the past three years many primary insurance companies have offset the impact of the softening market on direct premium by purchasing less reinsurance. The resulting increase in net retentions will impact the volatility of reserves for these insurers. As retentions increase, the volatility of the actuarial loss development factors will increase, leading to wider confidence intervals for the actuarial “best estimates” and greater reserve uncertainty. In turn, this will drive greater capital allocations and cost of capital charges.
Increased reserve uncertainty will manifest itself in two ways:
New large losses will have a leveraged effect on the >ultimate loss indications produced by net actuarial loss development triangles. Using the standard actuarial link ratio and Bornheutter-Ferguson development methods, the impact of a large shock loss on the technical actuarial ultimate loss indication will be two to six times the reported loss for casualty lines.
Higher net retentions will increase the uncertainty >of the average severity of net losses reported. This increased uncertainty, coupled with the leveraged effect of reported large losses, will increase the potential for reserve shortfalls.
For example, for a typical D&O insurance book we estimate that in one year out of ten reserves will be understated by 22 percent assuming a $2 million net retention. If reinsurance is eliminated, this modeled shortfall would be 88 percent, or a 300 percent increase. For a typical umbrella book the shortfall increases from 43 percent to 59 percent, or nearly 40 percent.
outstAnding reserves
personAl lines
reserve cv
multi-line reserve cv totAl
< $1B 6.7% 10.0% 9.0%
$1-2.5B 6.1% 10.0% 9.7%
$2.5-10B 5.3% 7.4% 6.7%
$10B+ 4.0% 6.6% 6.1%
All 6.0% 9.2% 8.4%
8
finAnciAl guArAnty: A blAck swAn event directors & officers (d&o): systemic risk driver
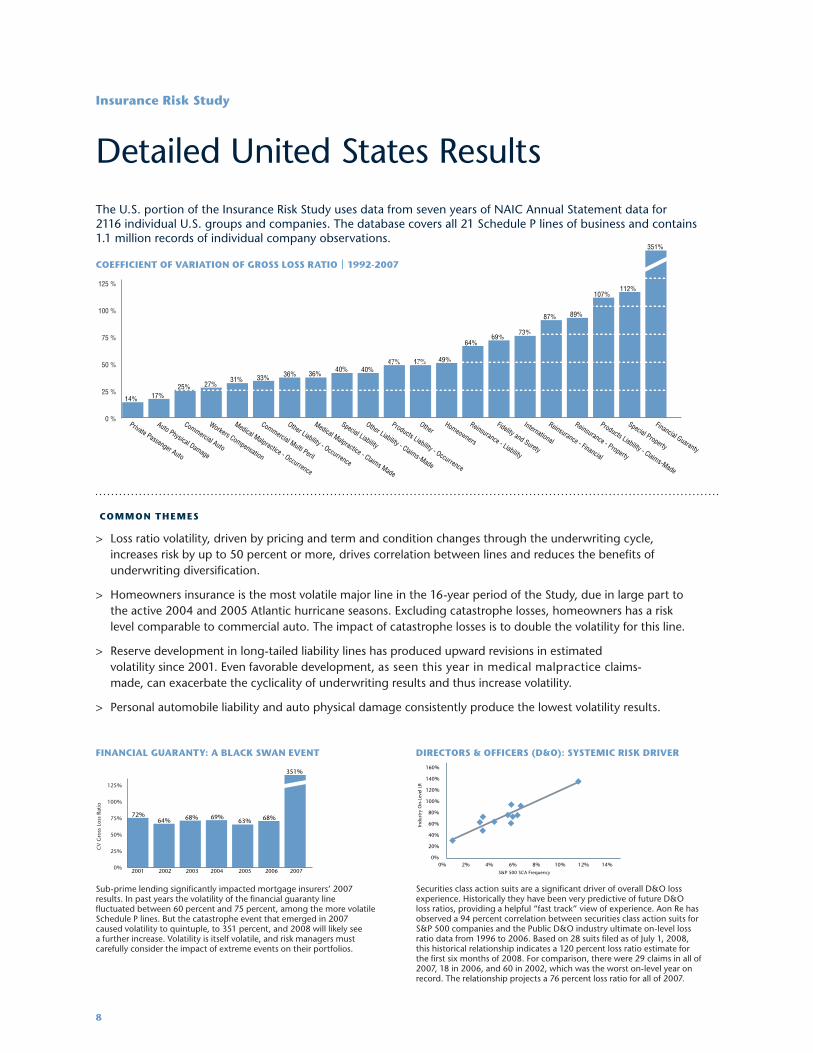
Securities class action suits are a significant driver of overall D&O loss experience. Historically they have been very predictive of future D&O loss ratios, providing a helpful “fast track” view of experience. Aon Re has observed a 94 percent correlation between securities class action suits for S&P 500 companies and the Public D&O industry ultimate on-level loss ratio data from 1996 to 2006. Based on 28 suits filed as of July 1, 2008, this historical relationship indicates a 120 percent loss ratio estimate for the first six months of 2008. For comparison, there were 29 claims in all of 2007, 18 in 2006, and 60 in 2002, which was the worst on-level year on record. The relationship projects a 76 percent loss ratio for all of 2007.
Detailed United States Results
common themes
0 %
25 %
50 %
75 %
100 %
125 %
Private Passenger Auto
Auto Physical Damage
Commercial Auto
Workers Compensation
Medical Malpractice - Occurrence
Commercial Multi Peril
Other Liability - Occurrence
Medical Malpractice - Claims Made
Special Liability
Other Liability - Claims-Made
Products Liability - Occurrence
OtherHomeowners
Reinsurance - Liability
Fidelity and Surety
International
Reinsurance - Financial
Reinsurance - Property
Products Liability - Claims-Made
Special Property
Financial Guaranty
14% 17%25% 27%
31% 33% 36% 36%40% 40%
47% 47% 49%
64%69%
73%
87% 89%
107%112%
351%
coefficient of vAriAtion of gross loss rAtio | 1992-2007
The U.S. portion of the Insurance Risk Study uses data from seven years of NAIC Annual Statement data for 2116 individual U.S. groups and companies. The database covers all 21 Schedule P lines of business and contains 1.1 million records of individual company observations.
0%
20%
40%
60%
80%
100%
120%
140%
160%
0% 2% 4% 6% 8% 10% 12% 14%S&P 500 SCA Frequency
Indu
stry
On-
Leve
l LR
0%
25%
50%
75%
100%
125%
2001 2002 2003 2004 2005 2006 2007
72%64% 68% 69%
63% 68%
351%
CV
Gro
ss L
oss
Ratio
Loss ratio volatility, driven by pricing and term and condition changes through the underwriting cycle, >increases risk by up to 50 percent or more, drives correlation between lines and reduces the benefits of underwriting diversification.
Homeowners insurance is the most volatile major line in the 16-year period of the Study, due in large part to >the active 2004 and 2005 Atlantic hurricane seasons. Excluding catastrophe losses, homeowners has a risk level comparable to commercial auto. The impact of catastrophe losses is to double the volatility for this line.
Reserve development in long-tailed liability lines has produced upward revisions in estimated >volatility since 2001. Even favorable development, as seen this year in medical malpractice claims-made, can exacerbate the cyclicality of underwriting results and thus increase volatility.
Personal automobile liability and auto physical damage consistently produce the lowest volatility results. >
insurance risk study
Sub-prime lending significantly impacted mortgage insurers’ 2007 results. In past years the volatility of the financial guaranty line fluctuated between 60 percent and 75 percent, among the more volatile Schedule P lines. But the catastrophe event that emerged in 2007 caused volatility to quintuple, to 351 percent, and 2008 will likely see a further increase. Volatility is itself volatile, and risk managers must carefully consider the impact of extreme events on their portfolios.
9
Aon benfield
insurAnce risk compAred to stock mArket risk
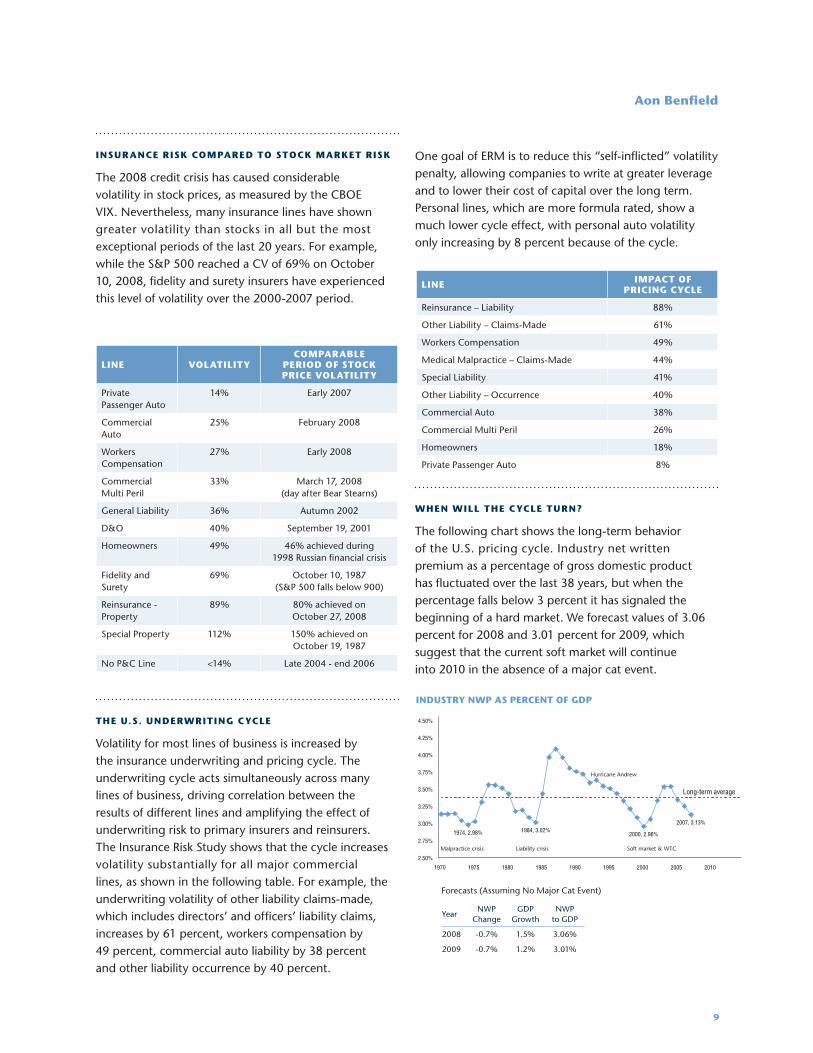
The 2008 credit crisis has caused considerable volatility in stock prices, as measured by the CBOE VIX. Nevertheless, many insurance lines have shown greater volatility than stocks in all but the most exceptional periods of the last 20 years. For example, while the S&P 500 reached a CV of 69% on October 10, 2008, fidelity and surety insurers have experienced this level of volatility over the 2000-2007 period.
the u.s. underwriting cycle
Volatility for most lines of business is increased by the insurance underwriting and pricing cycle. The underwriting cycle acts simultaneously across many lines of business, driving correlation between the results of different lines and amplifying the effect of underwriting risk to primary insurers and reinsurers. The Insurance Risk Study shows that the cycle increases volatility substantially for all major commercial lines, as shown in the following table. For example, the underwriting volatility of other liability claims-made, which includes directors’ and officers’ liability claims, increases by 61 percent, workers compensation by 49 percent, commercial auto liability by 38 percent and other liability occurrence by 40 percent.
One goal of ERM is to reduce this “self-inflicted” volatility penalty, allowing companies to write at greater leverage and to lower their cost of capital over the long term. Personal lines, which are more formula rated, show a much lower cycle effect, with personal auto volatility only increasing by 8 percent because of the cycle.
when will the cycle turn?
The following chart shows the long-term behavior of the U.S. pricing cycle. Industry net written premium as a percentage of gross domestic product has fluctuated over the last 38 years, but when the percentage falls below 3 percent it has signaled the beginning of a hard market. We forecast values of 3.06 percent for 2008 and 3.01 percent for 2009, which suggest that the current soft market will continue into 2010 in the absence of a major cat event.
industry nwp As percent of gdp
line volAtilitycompArAble
period of stock price volAtility
Private Passenger Auto
14% Early 2007
Commercial Auto
25% February 2008
Workers Compensation
27% Early 2008
Commercial Multi Peril
33% March 17, 2008 (day after Bear Stearns)
General Liability 36% Autumn 2002
D&O 40% September 19, 2001
Homeowners 49% 46% achieved during 1998 Russian financial crisis
Fidelity and Surety
69% October 10, 1987 (S&P 500 falls below 900)
Reinsurance - Property
89% 80% achieved on October 27, 2008
Special Property 112% 150% achieved on October 19, 1987
No P&C Line <14% Late 2004 - end 2006
line impAct of pricing cycle
Reinsurance – Liability 88%
Other Liability – Claims-Made 61%
Workers Compensation 49%
Medical Malpractice – Claims-Made 44%
Special Liability 41%
Other Liability – Occurrence 40%
Commercial Auto 38%
Commercial Multi Peril 26%
Homeowners 18%
Private Passenger Auto 8%
YearNWP
ChangeGDP
GrowthNWP
to GDP
2008 -0.7% 1.5% 3.06%
2009 -0.7% 1.2% 3.01%
1974, 2.98% 1984, 3.02%2000, 2.96%
2007, 3.13%
2.50%
2.75%
3.00%
3.25%
3.50%
3.75%
4.00%
4.25%
4.50%
1970 1975 1980 1985 1990 1995 2000 2005 2010
Long-term average
Malpractice crisis Liability crisis Soft market & WTC
Hurricane Andrew
Forecasts (Assuming No Major Cat Event)

10
Correlation and the Pricing CyclecorrelAtion of underwriting results
When modeling aggregate underwriting risk it is impossible to overstate the importance of understanding correlation and dependencies between different lines of business. Modeling is invariably performed using an analysis-synthesis paradigm. In most applications results are more significantly impacted by the correlation and dependency assumptions than by all the detailed assumptions made in the analysis step.
The Study determines correlations between lines within each country and also between countries.
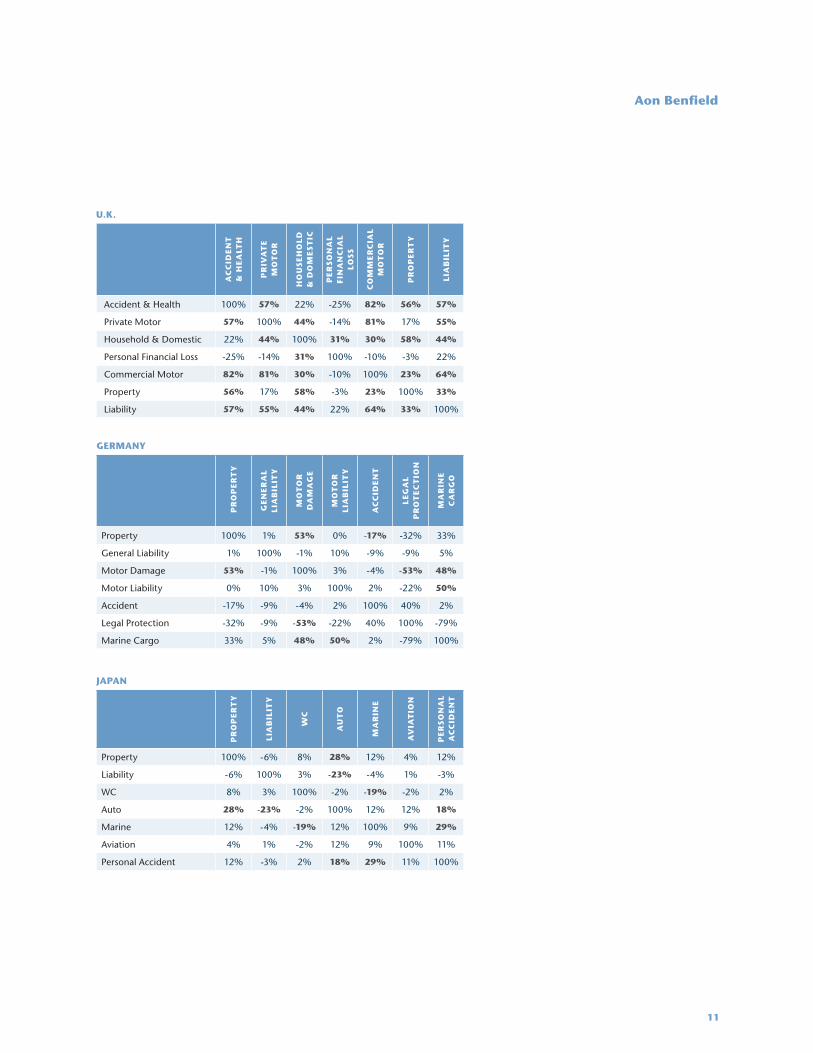
correlAtion between lines
Correlation between lines is computed by examining the results from larger companies that write pairs of lines in the same country. The tables below show a sampling of the results available, for the U.S., U.K., Germany and Japan. In each table the correlations shown in bold are statistically significantly different from zero at the 90 percent confidence level.
u.s.
Ho
me-
o
wn
ers
Per
so
na
l a
uto
li
ab
ilit
y
Co
mm
erC
ial
mu
lti
Per
il
Co
mm
erC
ial
au
to
wo
rk
ers
Co
mP
otH
er
lia
bil
ity
oC
C
Pr
od
uC
ts
lia
bil
ity
oC
C
med
iCa
l m
alP
ra
Cti
Ce
Cm
otH
er
lia
bil
ity
Cm
Homeowners 100% 7% 20% 8% -9% -2% 10% -9% -4%
Personal Auto Liability 7% 100% 25% 28% 31% 30% 27% 31% 37%
Commercial Multi Peril 20% 25% 100% 53% 43% 50% 43% 59% 42%
Commercial Auto 8% 28% 53% 100% 63% 69% 75% 73% 45%
Workers Comp -9% 31% 43% 63% 100% 64% 60% 76% 57%
Other Liability Occ -2% 30% 50% 69% 64% 100% 64% 80% 61%
Products Liability Occ 10% 27% 43% 75% 60% 64% 100% 80% 23%
Medical Malpractice CM -9% 31% 59% 73% 76% 80% 80% 100% 73%
Other Liability CM -4% 37% 42% 45% 57% 61% 23% 73% 100%
insurance risk study
11
Aon benfield
u.k.A
cc
ide
nt
&
he
Alt
h
pr
ivA
te
mo
to
r
ho
us
eh
old
&
do
me
st
ic
pe
rso
nA
l fin
An
ciA
l lo
ss
co
mm
er
ciA
l m
ot
or
pr
op
er
ty
liA
bil
ity
Accident & Health 100% 57% 22% -25% 82% 56% 57%
Private Motor 57% 100% 44% -14% 81% 17% 55%
Household & Domestic 22% 44% 100% 31% 30% 58% 44%
Personal Financial Loss -25% -14% 31% 100% -10% -3% 22%
Commercial Motor 82% 81% 30% -10% 100% 23% 64%
Property 56% 17% 58% -3% 23% 100% 33%
Liability 57% 55% 44% 22% 64% 33% 100%
germAny
pr
op
er
ty
ge
ne
rA
l liA
bil
ity
mo
to
r
dA
mA
ge
mo
to
r
liA
bil
ity
Ac
cid
en
t
leg
Al
pr
ot
ec
tio
n
mA
rin
e c
Ar
go
Property 100% 1% 53% 0% -17% -32% 33%
General Liability 1% 100% -1% 10% -9% -9% 5%
Motor Damage 53% -1% 100% 3% -4% -53% 48%
Motor Liability 0% 10% 3% 100% 2% -22% 50%
Accident -17% -9% -4% 2% 100% 40% 2%
Legal Protection -32% -9% -53% -22% 40% 100% -79%
Marine Cargo 33% 5% 48% 50% 2% -79% 100%
JApAn
pr
op
er
ty
liA
bil
ity
wc
Au
to
mA
rin
e
Av
iAt
ion
pe
rso
nA
l A
cc
ide
nt
Property 100% -6% 8% 28% 12% 4% 12%
Liability -6% 100% 3% -23% -4% 1% -3%
WC 8% 3% 100% -2% -19% -2% 2%
Auto 28% -23% -2% 100% 12% 12% 18%
Marine 12% -4% -19% 12% 100% 9% 29%
Aviation 4% 1% -2% 12% 9% 100% 11%
Personal Accident 12% -3% 2% 18% 29% 11% 100%

12
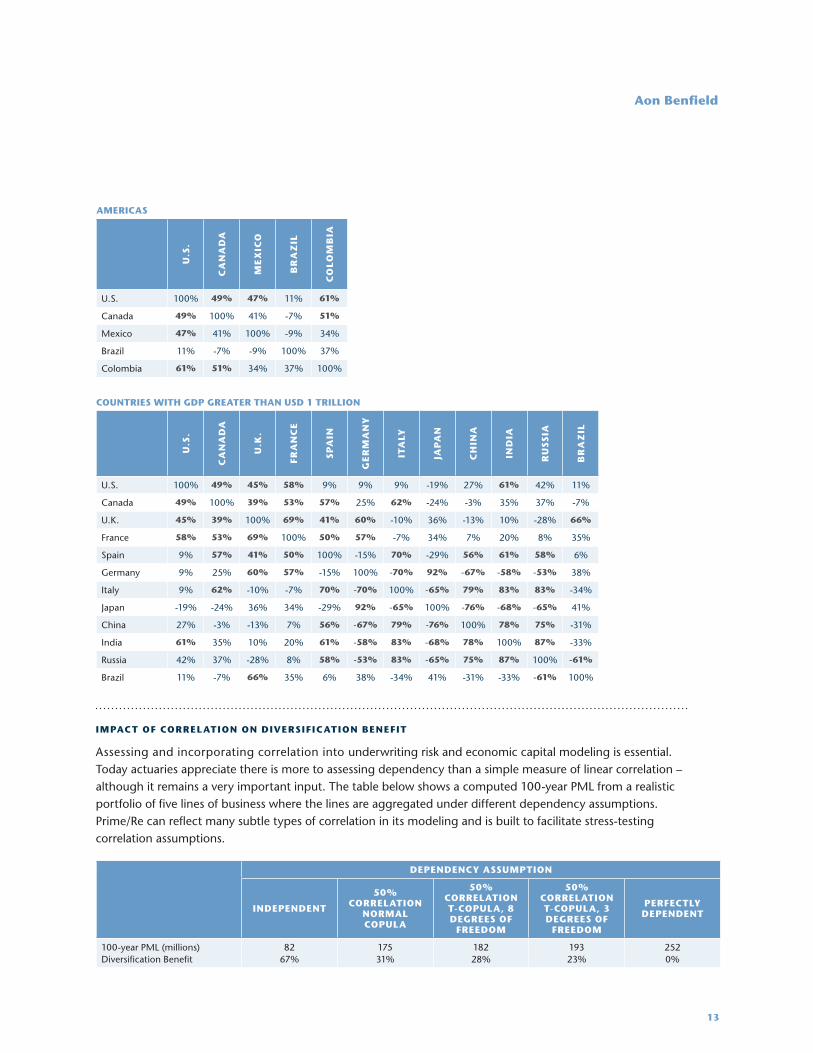
correlAtion between countries
The following tables show underwriting cycle correlation between countries. These are computed using premium-to-GDP ratios as a proxy for overall pricing adequacy. Correlation coefficients in bold are significantly different from zero at the 90 percent confidence level.
europe
Au
st
riA
be
lg
ium
de
nm
Ar
k
fr
An
ce
ge
rm
An
y
gr
eec
e
itA
ly
net
he
rl
An
ds
no
rw
Ay
po
lA
nd
po
rt
ug
Al
sp
Ain
sw
ed
en
sw
itz
er
lA
nd
tu
rk
ey
u.k
.
Austria 100% 70% 0% 86% 85% -59% -56% -13% 88% -80% 15% 13% 25% -27% -68% 77%
Belgium 70% 100% 51% 53% 45% 17% 20% 36% 81% -19% 57% -3% 33% 12% -47% 44%
Denmark 0% 51% 100% 47% -38% 37% 43% 70% -16% 5% 42% 48% 86% 16% 15% 12%
France 86% 53% 47% 100% 57% -25% -7% 36% 59% -67% 37% 50% 61% 21% -34% 69%
Germany 85% 45% -38% 57% 100% -48% -70% -33% 76% -71% 15% -15% -23% -52% -69% 60%
Greece -59% 17% 37% -25% -48% 100% 71% 63% -70% 66% 66% 23% 1% 53% 60% -51%
Italy -56% 20% 43% -7% -70% 71% 100% 87% -56% 54% 52% 70% 43% 85% 73% -10%
Netherlands -13% 36% 70% 36% -33% 63% 87% 100% -34% 12% 73% 73% 61% 66% 58% 3%
Norway 88% 81% -16% 59% 76% -70% -56% -34% 100% -61% -20% -7% 12% -32% -83% 85%
Poland -80% -19% 5% -67% -71% 66% 54% 12% -61% 100% -28% -21% 2% 21% 46% -58%
Portugal 15% 57% 42% 37% 15% 66% 52% 73% -20% -28% 100% 37% 21% 47% 25% -4%
Spain 13% -3% 48% 50% -15% 23% 70% 73% -7% -21% 37% 100% 67% 82% 52% 41%
Sweden 25% 33% 86% 61% -23% 1% 43% 61% 12% 2% 21% 67% 100% 43% 10% 40%
Switzerland -27% 12% 16% 21% -52% 53% 85% 66% -32% 21% 47% 82% 43% 100% 73% 17%
Turkey -68% -47% 15% -34% -69% 60% 73% 58% -83% 46% 25% 52% 10% 73% 100% -34%
U.K. 77% 44% 12% 69% 60% -51% -10% 3% 85% -58% -4% 41% 40% 17% -34% 100%
AsiA pAcific
Au
st
rA
liA
ch
inA
ho
ng
ko
ng
ind
iA
JAp
An
mA
lA
ys
iA
ru
ss
iA
sin
gA
po
re
so
ut
h
ko
re
A
tA
iwA
n
Australia 100% -82% -28% -83% 80% 38% -63% -11% -17% -14%
China -82% 100% 4% 78% -76% -63% 75% -21% 69% -1%
Hong Kong -28% 4% 100% 35% 0% 19% 10% 87% -23% 86%
India -83% 78% 35% 100% -68% -37% 87% 14% 46% 16%
Japan 80% -76% 0% -68% 100% 29% -65% 14% -24% 7%
Malaysia 38% -63% 19% -37% 29% 100% -15% 56% 22% 26%
Russia -63% 75% 10% 87% -65% -15% 100% 2% 74% 16%
Singapore -11% -21% 87% 14% 14% 56% 2% 100% -19% 70%
South Korea -17% 69% -23% 46% -24% 22% 74% -19% 100% -5%
Taiwan -14% -1% 86% 16% 7% 26% 16% 70% -5% 100%
insurance risk study
13
Aon benfield
AmericAs
u.s
.
cA
nA
dA
me
xic
o
br
Az
il
co
lo
mb
iA
U.S. 100% 49% 47% 11% 61%
Canada 49% 100% 41% -7% 51%
Mexico 47% 41% 100% -9% 34%
Brazil 11% -7% -9% 100% 37%
Colombia 61% 51% 34% 37% 100%
countries with gdp greAter thAn usd 1 trillion
u.s
.
cA
nA
dA
u.k
.
fr
An
ce
sp
Ain
ge
rm
An
y
itA
ly
JAp
An
ch
inA
ind
iA
ru
ss
iA
br
Az
il
U.S. 100% 49% 45% 58% 9% 9% 9% -19% 27% 61% 42% 11%
Canada 49% 100% 39% 53% 57% 25% 62% -24% -3% 35% 37% -7%
U.K. 45% 39% 100% 69% 41% 60% -10% 36% -13% 10% -28% 66%
France 58% 53% 69% 100% 50% 57% -7% 34% 7% 20% 8% 35%
Spain 9% 57% 41% 50% 100% -15% 70% -29% 56% 61% 58% 6%
Germany 9% 25% 60% 57% -15% 100% -70% 92% -67% -58% -53% 38%
Italy 9% 62% -10% -7% 70% -70% 100% -65% 79% 83% 83% -34%
Japan -19% -24% 36% 34% -29% 92% -65% 100% -76% -68% -65% 41%
China 27% -3% -13% 7% 56% -67% 79% -76% 100% 78% 75% -31%
India 61% 35% 10% 20% 61% -58% 83% -68% 78% 100% 87% -33%
Russia 42% 37% -28% 8% 58% -53% 83% -65% 75% 87% 100% -61%
Brazil 11% -7% 66% 35% 6% 38% -34% 41% -31% -33% -61% 100%
impAct of correlAtion on diversif icAtion benefit
Assessing and incorporating correlation into underwriting risk and economic capital modeling is essential. Today actuaries appreciate there is more to assessing dependency than a simple measure of linear correlation – although it remains a very important input. The table below shows a computed 100-year PML from a realistic portfolio of five lines of business where the lines are aggregated under different dependency assumptions. Prime/Re can reflect many subtle types of correlation in its modeling and is built to facilitate stress-testing correlation assumptions.
dependency Assumption
independent
50% correlAtion
normAl copulA
50% correlAtion t-copulA, 8 degrees of
freedom
50% correlAtion t-copulA, 3 degrees of
freedom
perfectly dependent
100-year PML (millions) Diversification Benefit
82 67%
175 31%
182 28%
193 23%
252 0%

14
insurance risk study
Aon Benfield Analytics Capital Modeling Capabilities
Aon Benfield Analytics’ team of actuaries, cat modelers,
accountants and rating agency experts works closely
with brokers to provide relevant and timely analysis and
to ensure clients are equipped to make the best possible
risk transfer and risk financing decisions. Technical
experts are involved in all stages of the broking
process, from structuring and coverage evaluation
to submission and placement. We believe this close
integration between analytics and broking allows us to
design and implement the best solutions for clients
Prime/Re and ReMetrica, our award winning Dynamic
Financial Analysis capital modeling software, are
currently used by many of the world’s leading insurance,
reinsurance and actuarial consulting firms. Aon Benfield
Analytics has a global functional alignment, allowing
us to serve clients consistently serve clients. We provide
analysis to global reinsurance clients through our local
offices using a common methodology and approach.
This provides the best possible backup to the global-
local reinsurance purchasing decisions that are
becoming increasingly common in the industry today.
Our analytics are implemented in Prime/Re and
ReMetrica through our award winning Dynamic
Financial Analysis capital modeling software. Our tools
are currently used by many of the world’s leading
insurance, reinsurance and actuarial consulting firms.
Our software is a stand-alone application, developed
and supported by a team of experts, including
actuaries, mathematicians and software developers,
based in London and Chicago. The stochastic
and scenario-based capabilities simulation engine
enables the evaluation of the whole spectrum of
risk financing – whether at the business unit, line of
business, company, or group level. Using our extensive
library of pre-developed components, coupled with
our comprehensive insurance risk parameterization
research, realistic and transparent risk models can be
built quickly for any specific business need. Key client
value features of our capital modeling software include:
fAst And eAsy-to-use
Intuitive model structure interface. >
Provides instantaneous feedback on model >
parameterization, without the need for simulations.
Fast, detailed risk simulation engine. >
Distributed processing to improve simulation speed. >
comprehensive And sophisticAted
Models all types of risk transfer financing: traditional >
and variable feature reinsurance, insurance linked
securities, sidecars, cat bonds, swaps, etc.
Flexible modeling of all types of underlying insurance >
business including ground-up, excess of loss,
large deductible, layered and shared property.
Correlation and dependency through common >
mixing variables and copula methods, including
more flexible extreme tail correlation.
Automatic treatment of attritional losses, >
retaining correlation with larger losses and
incorporating loss ratio uncertainty.
Enhanced loss payout algorithm provides >
systematic pattern uncertainty and fractional,
lump-sum and annuity payouts.
Incorporates results from all commercial >
catastrophe models.
15
sources: A .m. best, Axco
insurAnce informAtion services,
nAic AnnuAl stAtements
(u.s.), fsA returns (uk), bAfin
(germAny), msA reseArch
(cAnAdA), susep (brAzil), hkoci,
insurAnce reseArch institute
( JApAn), koreA finAnciAl
supervisory service, bAnk
negArA mAlAysiA, monetAry
Authority of singApore,
tAiwAn insurAnce institute,
AnnuAl f inAnciAl stAtements.
For more information on the Insurance Risk Study, Prime/Re, ReMetrica, or our analytic capabilities please contact your local Aon Benfield broker or:
Americas stephen mildenhAll
Head of Aon Benfield Analytics, Americas t: +1 312 381 5880 e: [email protected]
InternationalJohn mooreHead of Aon Benfield Analytics, Internationalt: +44 (0) 20 7522 3973e: [email protected]
customizAble And flexible
Aggregates data from other models >
(investments, reserving, life).
Able to import/export large models to/from Microsoft >
Excel and to link to other corporate data systems.
Multi-user capability. >
Customizable to the client’s metrics for >
risk, volatility, and capital benefit.
built- in functionAlity
More than 95 “out of the box” modeling components. >
Multi-year models. >
A.M. Best and S&P current and enhanced >
capital adequacy models.
U.K., French, Canadian, Australian and >
other regulatory capital models.
Capital allocation supporting commonly >
referenced VaR, TVaR, and risk-adjusted
probability based methodologies.
Income statement, balance sheet, and cashflow >
analysis under multiple accounting standards.
Reinsurance risk transfer analysis. >
All common European, London and >
Australian indexation clauses.
Consideration of reinsurer credit default risk. >
Diagnosis and audit tools. >

200 East Randolph Street, Chicago, IL 60601 t: +1.312.381.5300 | f: +1.312.381.0160 | www.aonbenfield.com
Copyright Aon Benfield 2008 | Published by Aon Benfield Marketing and Communications | #1306 – 08/2008