Insurance Risk Study - Aon...
28
Insurance Risk Study Sixth Edition 2011
Transcript of Insurance Risk Study - Aon...

Insurance Risk StudySixth Edition 2011
Insurance Portfolio RiskAsset Portfolio Risk
Contents3 Foreword
4 Global Risk Parameters
6 U.S. Risk Parameters
7 U.S. Reserves
10 Innovations in Crop Insurance Modeling
12 An Optimal Insurer in a Solvency II World
14 Innovations in Hedging
16 Correlation and the Pricing Cycle
18 Macroeconomic Correlation
19 Global Market Review
20 Global Statistics: Motor
21 Global Statistics: Property
22 Global Statistics: Liability
23 Afterword: The Good Risk
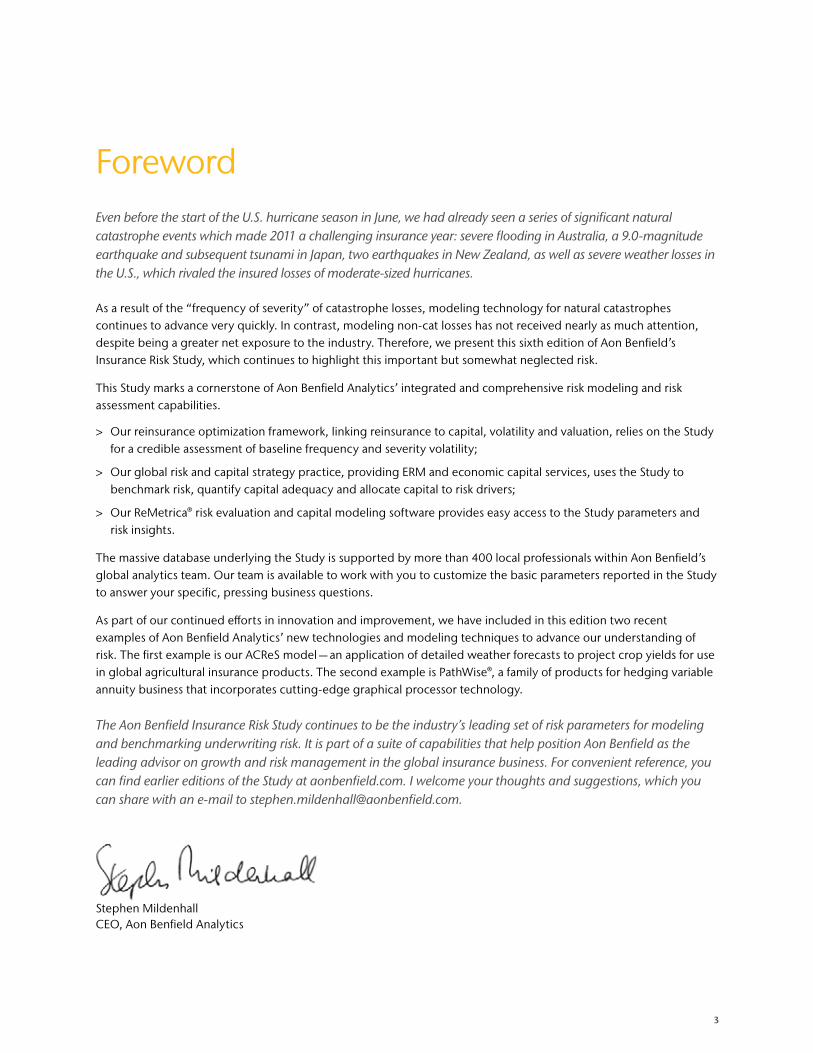
About the StudyRating agencies, regulators and investors today are demanding that insurers provide detailed assessments of their risk tolerance and quantify the adequacy of their economic capital. To complete such assessments requires a credible baseline for underwriting volatility. The Insurance Risk Study provides our clients with an objective and data-driven set of underwriting volatility benchmarks by line of business and country as well as correlations by line and country. These benchmarks are a valuable resource to CROs, actuaries, and other economic capital modeling professionals who seek reliable parameters for their models.
Modern portfolio theory for assets teaches that increasing the number of stocks in a portfolio will diversify and reduce the portfolio’s risk, but will not eliminate risk completely; the systemic market risk remains. This is illustrated in the left chart below. In the same way, insurers can reduce underwriting volatility by increasing account volume, but they cannot reduce their volatility to zero. A certain level of systemic insurance risk will always remain, due to factors such as the underwriting cycle, macroeconomic trends, legal changes and weather (right chart below). The Study calculates this systemic risk by line of business and country. The Naïve Model on the right chart shows the relationship between risk and volume using a Poisson assumption for claim count — a textbook actuarial approach. The Study clearly shows that this assumption does not fit with empirical data for any line of business in any country. It will underestimate underwriting risk if used in an ERM model.
Number of Stocks
Port
folio
Ris
k
Volume
Insu
ranc
e Ri
sk
Portfolio Risk
SystemicMarket Risk
SystemicInsurance
Risk
Naïve Model
3
ForewordEven before the start of the U.S. hurricane season in June, we had already seen a series of significant natural catastrophe events which made 2011 a challenging insurance year: severe flooding in Australia, a 9.0-magnitude earthquake and subsequent tsunami in Japan, two earthquakes in New Zealand, as well as severe weather losses in the U.S., which rivaled the insured losses of moderate-sized hurricanes.
As a result of the “frequency of severity” of catastrophe losses, modeling technology for natural catastrophes continues to advance very quickly. In contrast, modeling non-cat losses has not received nearly as much attention, despite being a greater net exposure to the industry. Therefore, we present this sixth edition of Aon Benfield’s Insurance Risk Study, which continues to highlight this important but somewhat neglected risk.
This Study marks a cornerstone of Aon Benfield Analytics’ integrated and comprehensive risk modeling and risk assessment capabilities.
> Our reinsurance optimization framework, linking reinsurance to capital, volatility and valuation, relies on the Study for a credible assessment of baseline frequency and severity volatility;
> Our global risk and capital strategy practice, providing ERM and economic capital services, uses the Study to benchmark risk, quantify capital adequacy and allocate capital to risk drivers;
> Our ReMetrica® risk evaluation and capital modeling software provides easy access to the Study parameters and risk insights.
The massive database underlying the Study is supported by more than 400 local professionals within Aon Benfield’s global analytics team. Our team is available to work with you to customize the basic parameters reported in the Study to answer your specific, pressing business questions.
As part of our continued efforts in innovation and improvement, we have included in this edition two recent examples of Aon Benfield Analytics’ new technologies and modeling techniques to advance our understanding of risk. The first example is our ACReS model — an application of detailed weather forecasts to project crop yields for use in global agricultural insurance products. The second example is PathWise®, a family of products for hedging variable annuity business that incorporates cutting-edge graphical processor technology.
The Aon Benfield Insurance Risk Study continues to be the industry’s leading set of risk parameters for modeling and benchmarking underwriting risk. It is part of a suite of capabilities that help position Aon Benfield as the leading advisor on growth and risk management in the global insurance business. For convenient reference, you can find earlier editions of the Study at aonbenfield.com. I welcome your thoughts and suggestions, which you can share with an e-mail to [email protected].
Stephen Mildenhall CEO, Aon Benfield Analytics
4
Insurance Risk Study
TaiwanPeru
MexicoBrazil
GreeceSingapore
Hong KongIndonesiaNicaragua
Dominican RepublicColombiaHondurasRomaniaPakistan
ArgentinaU.S.
VietnamEcuador
PolandSouth Korea
HungaryUruguaySlovakia
El SalvadorBolivia
VenezuelaFrance
IndiaChina
PanamaJapan
MalaysiaChile
TurkeyCanada
U.K.Germany
SwitzerlandSpain
AustriaNetherlands
ItalyAustralia
South AfricaDenmark
Israel
NicaraguaGreece
Hong KongPanamaSlovakia
IndonesiaRomania
SingaporeDenmarkEcuador
HondurasPeru
CanadaEl Salvador
U.K.U.S.
ColombiaPoland
VietnamArgentina
MalaysiaDominican Republic
ChinaPakistan
South AfricaVenezuela
NetherlandsBrazilChileItaly
GermanyIndiaSpain
BoliviaMexico
UruguaySwitzerland
Czech RepublicFrance
AustraliaTurkeyAustria
IsraelSouth Korea
TaiwanJapan
Hungary 8%13%14%
16%16%17%18%18%18%19%20%
23%25%26%27%28%29%30%31%32%
35%38%39%40%40%40%
42%42%42%42%43%
45%51%
55%55%56%57%58%
65%64%
69%69%70%
92%96%96%
4%5%
6%7%7%7%8%8%8%8%8%9%9%9%9%10%10%11%11%12%12%12%13%13%14%14%15%15%15%15%15%16%18%18%18%19%20%21%
23%24%25%
28%30%
32%43%
46%58%
Americas Asia Pacific Europe, Middle East & Africa
Motor Property
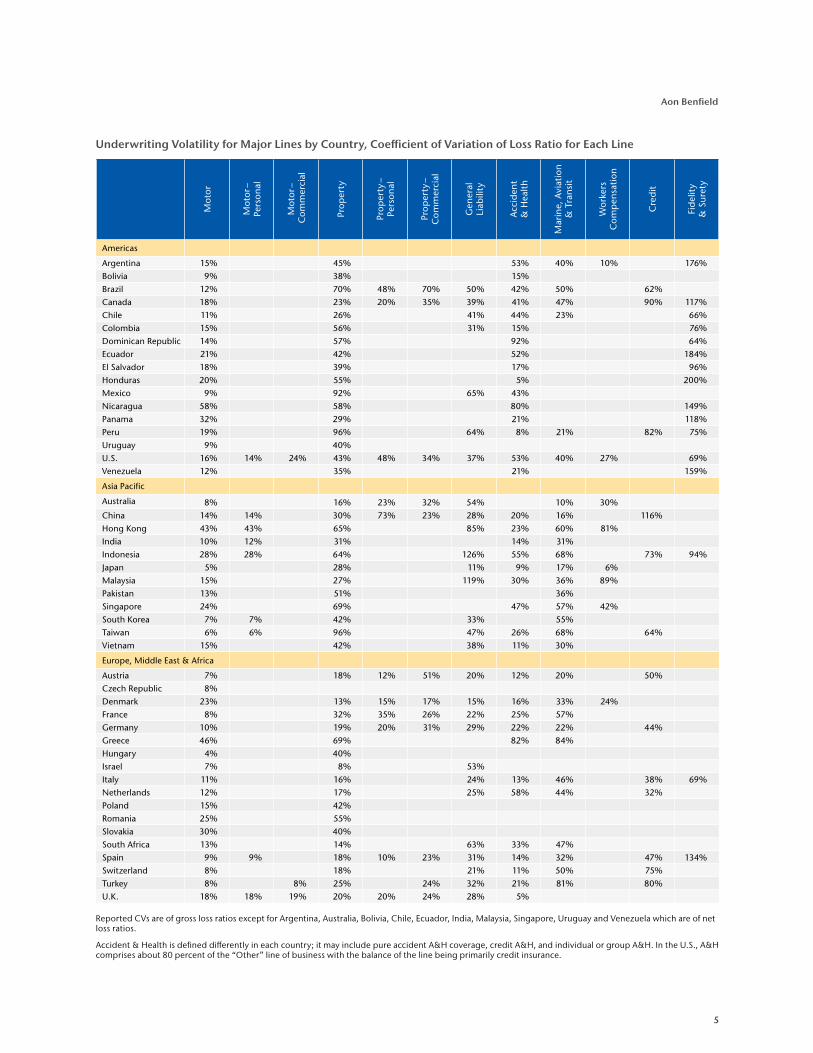
Global Risk ParametersThe 2011 Insurance Risk Study quantifies the systemic risk by line for 47 countries worldwide, representing more than 90 percent of global property casualty premium. Systemic risk in the Study is the coefficient of variation of loss ratio for a large book of business. Coefficient of variation (CV) is a commonly used normalized measure of risk defined as the standard deviation divided by the mean. Systemic risk typically comes from non-diversifiable risk sources such as changing market rate adequacy, unknown prospective frequency and severity trends, weather-related losses, legal reforms and court
decisions, the level of economic activity and other macroeconomic factors. It also includes the risk to smaller and specialty lines of business caused by a lack of credible data. For many lines of business systemic risk is the major component of underwriting volatility.
The systemic risk factors for major lines by region appear on the next page. Detailed charts comparing motor and property risk by country appear below. The factors measure the volatility of gross loss ratios. If gross loss ratios are not available the net loss ratio is used.
Coefficient of Variation of Gross Loss Ratio by Country
5
Aon Benfield
Underwriting Volatility for Major Lines by Country, Coefficient of Variation of Loss Ratio for Each Line
Reported CVs are of gross loss ratios except for Argentina, Australia, Bolivia, Chile, Ecuador, India, Malaysia, Singapore, Uruguay and Venezuela which are of net loss ratios.
Accident & Health is defined differently in each country; it may include pure accident A&H coverage, credit A&H, and individual or group A&H. In the U.S., A&H comprises about 80 percent of the “Other” line of business with the balance of the line being primarily credit insurance.
Mot
or
Mot
or –
Pe
rson
al
Mot
or –
C
omm
erci
al
Prop
erty
Prop
erty
–
Pers
onal
Prop
erty
–
Com
mer
cial
Gen
eral
Li
abili
ty
Acc
iden
t
& H
ealt
h
Mar
ine,
Avi
atio
n
& T
ran
sit
Wor
kers
C
omp
ensa
tion
Cre
dit
Fid
elit
y
& S
uret
y
Americas
Argentina 15% 45% 53% 40% 10% 176%
Bolivia 9% 38% 15%
Brazil 12% 70% 48% 70% 50% 42% 50% 62%
Canada 18% 23% 20% 35% 39% 41% 47% 90% 117%
Chile 11% 26% 41% 44% 23% 66%
Colombia 15% 56% 31% 15% 76%
Dominican Republic 14% 57% 92% 64%
Ecuador 21% 42% 52% 184%
El Salvador 18% 39% 17% 96%
Honduras 20% 55% 5% 200%
Mexico 9% 92% 65% 43%
Nicaragua 58% 58% 80% 149%
Panama 32% 29% 21% 118%
Peru 19% 96% 64% 8% 21% 82% 75%
Uruguay 9% 40%
U.S. 16% 14% 24% 43% 48% 34% 37% 53% 40% 27% 69%
Venezuela 12% 35% 21% 159%
Asia Pacific
Australia 8% 16% 23% 32% 54% 10% 30%
China 14% 14% 30% 73% 23% 28% 20% 16% 116%
Hong Kong 43% 43% 65% 85% 23% 60% 81%
India 10% 12% 31% 14% 31%
Indonesia 28% 28% 64% 126% 55% 68% 73% 94%
Japan 5% 28% 11% 9% 17% 6%
Malaysia 15% 27% 119% 30% 36% 89%
Pakistan 13% 51% 36%
Singapore 24% 69% 47% 57% 42%
South Korea 7% 7% 42% 33% 55%
Taiwan 6% 6% 96% 47% 26% 68% 64%
Vietnam 15% 42% 38% 11% 30%
Europe, Middle East & Africa
Austria 7% 18% 12% 51% 20% 12% 20% 50%
Czech Republic 8%
Denmark 23% 13% 15% 17% 15% 16% 33% 24%
France 8% 32% 35% 26% 22% 25% 57%
Germany 10% 19% 20% 31% 29% 22% 22% 44%
Greece 46% 69% 82% 84%
Hungary 4% 40%
Israel 7% 8% 53%
Italy 11% 16% 24% 13% 46% 38% 69%
Netherlands 12% 17% 25% 58% 44% 32%
Poland 15% 42%
Romania 25% 55%
Slovakia 30% 40%
South Africa 13% 14% 63% 33% 47%
Spain 9% 9% 18% 10% 23% 31% 14% 32% 47% 134%
Switzerland 8% 18% 21% 11% 50% 75%
Turkey 8% 8% 25% 24% 32% 21% 81% 80%
U.K. 18% 18% 19% 20% 20% 24% 28% 5%
6
Insurance Risk Study
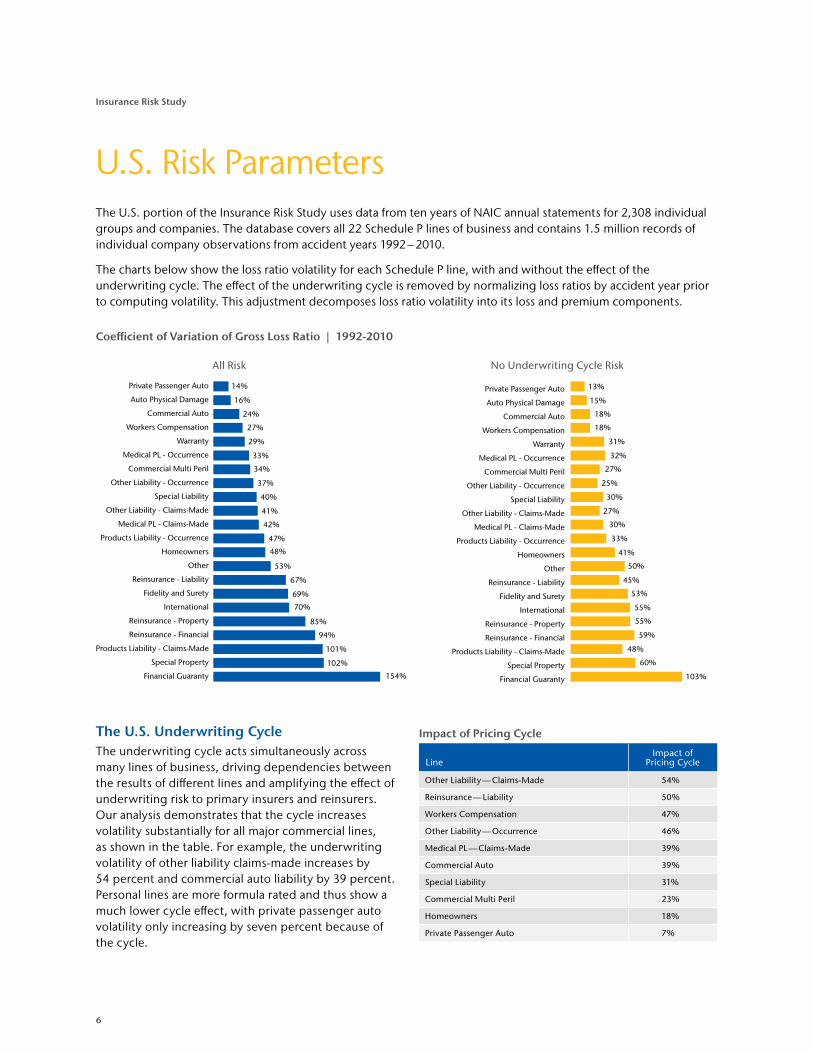
The U.S. Underwriting CycleThe underwriting cycle acts simultaneously across many lines of business, driving dependencies between the results of different lines and amplifying the effect of underwriting risk to primary insurers and reinsurers. Our analysis demonstrates that the cycle increases volatility substantially for all major commercial lines, as shown in the table. For example, the underwriting volatility of other liability claims-made increases by 54 percent and commercial auto liability by 39 percent. Personal lines are more formula rated and thus show a much lower cycle effect, with private passenger auto volatility only increasing by seven percent because of the cycle.
Impact of Pricing Cycle
LineImpact of
Pricing Cycle
Other Liability — Claims-Made 54%
Reinsurance — Liability 50%
Workers Compensation 47%
Other Liability — Occurrence 46%
Medical PL — Claims-Made 39%
Commercial Auto 39%
Special Liability 31%
Commercial Multi Peril 23%
Homeowners 18%
Private Passenger Auto 7%
U.S. Risk ParametersThe U.S. portion of the Insurance Risk Study uses data from ten years of NAIC annual statements for 2,308 individual groups and companies. The database covers all 22 Schedule P lines of business and contains 1.5 million records of individual company observations from accident years 1992 – 2010.
The charts below show the loss ratio volatility for each Schedule P line, with and without the effect of the underwriting cycle. The effect of the underwriting cycle is removed by normalizing loss ratios by accident year prior to computing volatility. This adjustment decomposes loss ratio volatility into its loss and premium components.
14%
16%
24%
27%
29%
33%
34%
37%
40%
41%
42%
47%
48%
53%
67%
69%
70%
85%
94%
101%
102%
154%
13%
15%
18%
18%
31%
32%
27%
25%
30%
27%
30%
33%
41%
50%
45%
53%
55%
55%
59%
48%
60%
103%Financial Guaranty
Special Property
Products Liability - Claims-Made
Reinsurance - Financial
Reinsurance - Property
International
Fidelity and Surety
Reinsurance - Liability
Other
Homeowners
Products Liability - Occurrence
Medical PL - Claims-Made
Other Liability - Claims-Made
Special Liability
Other Liability - Occurrence
Commercial Multi Peril
Medical PL - Occurrence
Warranty
Workers Compensation
Commercial Auto
Auto Physical Damage
Private Passenger Auto
Financial Guaranty
Special Property
Products Liability - Claims-Made
Reinsurance - Financial
Reinsurance - Property
International
Fidelity and Surety
Reinsurance - Liability
Other
Homeowners
Products Liability - Occurrence
Medical PL - Claims-Made
Other Liability - Claims-Made
Special Liability
Other Liability - Occurrence
Commercial Multi Peril
Medical PL - Occurrence
Warranty
Workers Compensation
Commercial Auto
Auto Physical Damage
Private Passenger Auto
Coefficient of Variation of Gross Loss Ratio | 1992-2010
All Risk No Underwriting Cycle Risk
7
Aon Benfield
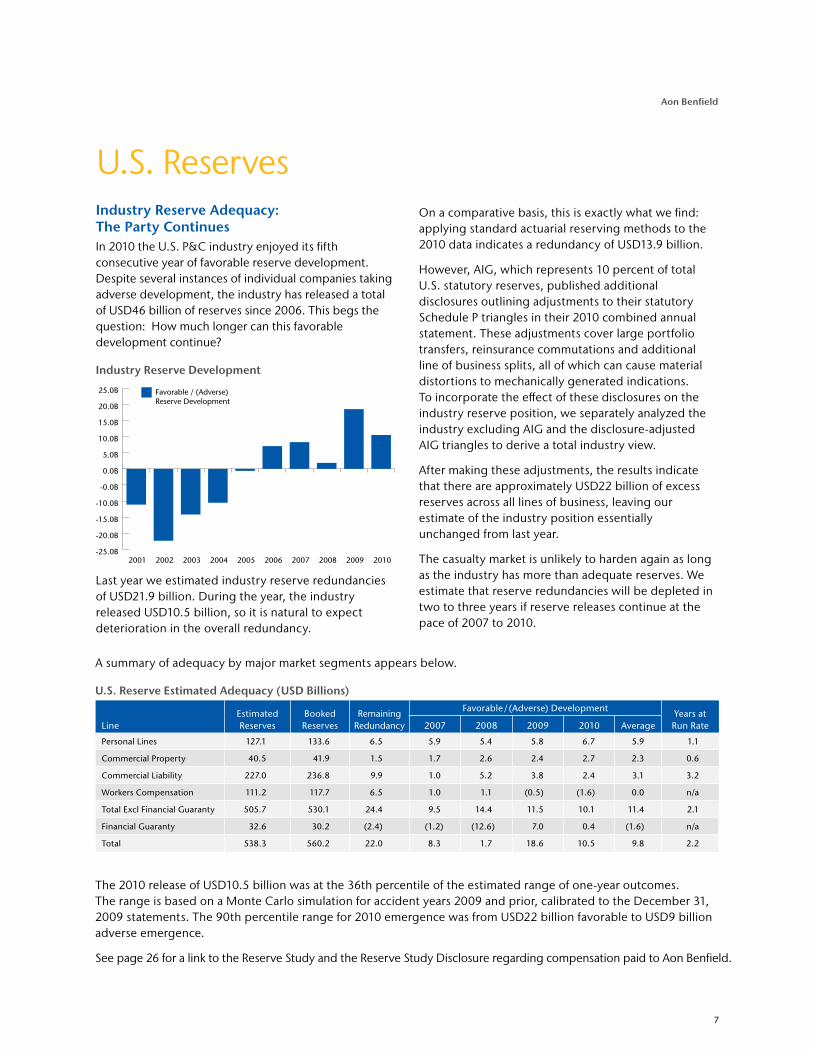
Industry Reserve Adequacy: The Party ContinuesIn 2010 the U.S. P&C industry enjoyed its fifth consecutive year of favorable reserve development. Despite several instances of individual companies taking adverse development, the industry has released a total of USD46 billion of reserves since 2006. This begs the question: How much longer can this favorable development continue?
Industry Reserve Development
Last year we estimated industry reserve redundancies of USD21.9 billion. During the year, the industry released USD10.5 billion, so it is natural to expect deterioration in the overall redundancy.
On a comparative basis, this is exactly what we find: applying standard actuarial reserving methods to the 2010 data indicates a redundancy of USD13.9 billion.
However, AIG, which represents 10 percent of total U.S. statutory reserves, published additional disclosures outlining adjustments to their statutory Schedule P triangles in their 2010 combined annual statement. These adjustments cover large portfolio transfers, reinsurance commutations and additional line of business splits, all of which can cause material distortions to mechanically generated indications. To incorporate the effect of these disclosures on the industry reserve position, we separately analyzed the industry excluding AIG and the disclosure-adjusted AIG triangles to derive a total industry view.
After making these adjustments, the results indicate that there are approximately USD22 billion of excess reserves across all lines of business, leaving our estimate of the industry position essentially unchanged from last year.
The casualty market is unlikely to harden again as long as the industry has more than adequate reserves. We estimate that reserve redundancies will be depleted in two to three years if reserve releases continue at the pace of 2007 to 2010.
-25.0B
-20.0B
-15.0B
-10.0B
-0.0B
0.0B
5.0B
10.0B
15.0B
20.0B
25.0B
2010200920082007200620052004200320022001
Favorable / (Adverse)Reserve Development
U.S. Reserves
A summary of adequacy by major market segments appears below.
U.S. Reserve Estimated Adequacy (USD Billions)
The 2010 release of USD10.5 billion was at the 36th percentile of the estimated range of one-year outcomes. The range is based on a Monte Carlo simulation for accident years 2009 and prior, calibrated to the December 31, 2009 statements. The 90th percentile range for 2010 emergence was from USD22 billion favorable to USD9 billion adverse emergence.
See page 26 for a link to the Reserve Study and the Reserve Study Disclosure regarding compensation paid to Aon Benfield.
LineEstimated Reserves
Booked Reserves
Remaining Redundancy
Favorable / (Adverse) Development Years at Run Rate2007 2008 2009 2010 Average
Personal Lines 127.1 133.6 6.5 5.9 5.4 5.8 6.7 5.9 1.1
Commercial Property 40.5 41.9 1.5 1.7 2.6 2.4 2.7 2.3 0.6
Commercial Liability 227.0 236.8 9.9 1.0 5.2 3.8 2.4 3.1 3.2
Workers Compensation 111.2 117.7 6.5 1.0 1.1 (0.5) (1.6) 0.0 n/a
Total Excl Financial Guaranty 505.7 530.1 24.4 9.5 14.4 11.5 10.1 11.4 2.1
Financial Guaranty 32.6 30.2 (2.4) (1.2) (12.6) 7.0 0.4 (1.6) n/a
Total 538.3 560.2 22.0 8.3 1.7 18.6 10.5 9.8 2.2
8
Insurance Risk Study
Reserve Risk: The Silent KillerDespite the U.S. P&C industry’s recent favorable development and a seemingly redundant reserve position, reserve risk remains one of the largest threats to insurer solvency. According to A.M. Best’s 2011 Impairment Study, 54 percent of insurer impairments from 1969 – 2010 can be attributed to loss reserve deficiencies and rapid growth or inadequate pricing.
Individual accident year development accounts for four of the ten largest U.S. P&C industry events. Combined reserve development on the soft market accident years 1998 – 2001 amounts to USD64 billion: 55 percent more than Katrina, the U.S. industry’s largest natural catastrophe.
The ultimate loss estimate associated with asbestos and environmental claims accounts for the largest U.S. P&C industry loss event at USD117 billion. These losses manifested themselves almost entirely in the form of unforeseen adverse reserve development — suggesting the potential volatility on initial reserve estimates.
Largest U.S. P&C Industry Events (USD Billions)
Event Nominal Loss
Asbestos & Environmental 117.0
Hurricane Katrina 41.1
AY 2000 Development* 22.0
AY 1999 Development* 19.3
September 11th 18.8
Hurricane Andrew 15.5
Northridge Earthquake 12.5
Hurricane Ike 12.5
AY 1998 Development* 12.1
AY 2001 Development* 10.5
* 10 years of development from Schedule P.
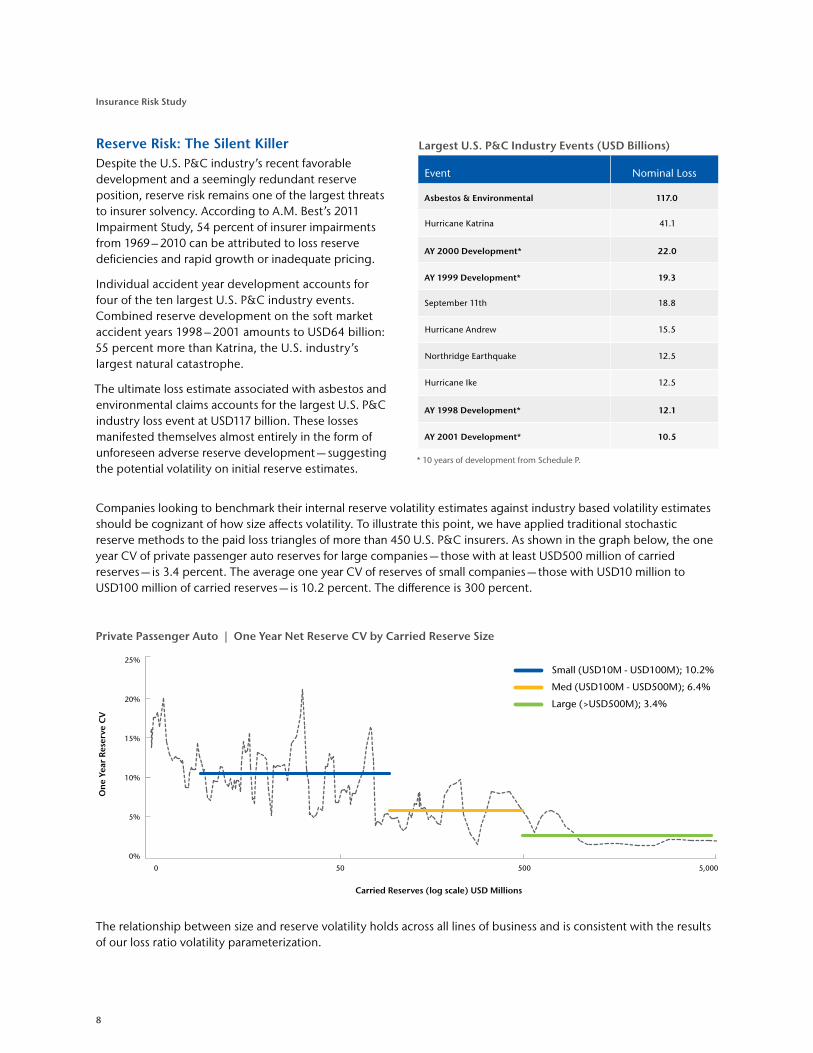
Companies looking to benchmark their internal reserve volatility estimates against industry based volatility estimates should be cognizant of how size affects volatility. To illustrate this point, we have applied traditional stochastic reserve methods to the paid loss triangles of more than 450 U.S. P&C insurers. As shown in the graph below, the one year CV of private passenger auto reserves for large companies — those with at least USD500 million of carried reserves — is 3.4 percent. The average one year CV of reserves of small companies — those with USD10 million to USD100 million of carried reserves — is 10.2 percent. The difference is 300 percent.
Private Passenger Auto | One Year Net Reserve CV by Carried Reserve Size
The relationship between size and reserve volatility holds across all lines of business and is consistent with the results of our loss ratio volatility parameterization.
0%
0 50 500 5,000
5%
10%
15%
20%
25%Small (USD10M - USD100M); 10.2%
Med (USD100M - USD500M); 6.4%
Large (>USD500M); 3.4%
One
Yea
r Re
serv
e C
V
Carried Reserves (log scale) USD Millions
9
Aon Benfield
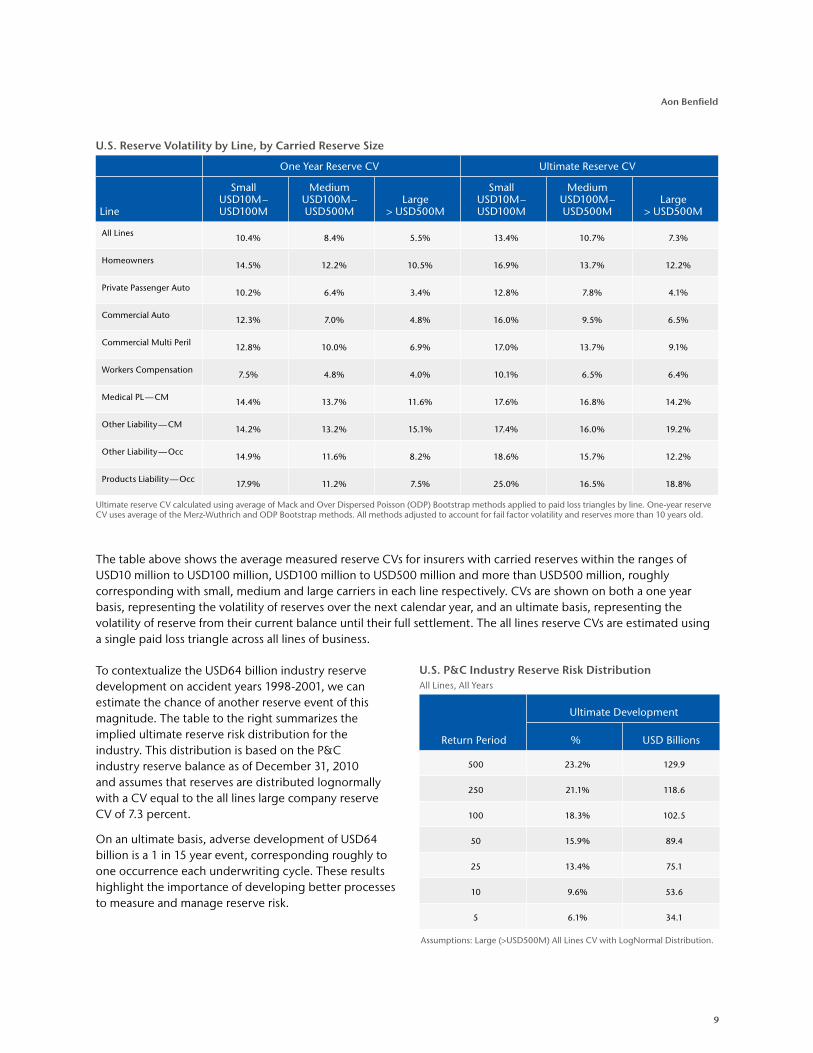
U.S. Reserve Volatility by Line, by Carried Reserve Size
One Year Reserve CV Ultimate Reserve CV
Line
Small USD10M – USD100M
Medium USD100M – USD500M
Large > USD500M
Small USD10M – USD100M
Medium USD100M – USD500M
Large > USD500M
All Lines 10.4% 8.4% 5.5% 13.4% 10.7% 7.3%
Homeowners 14.5% 12.2% 10.5% 16.9% 13.7% 12.2%
Private Passenger Auto 10.2% 6.4% 3.4% 12.8% 7.8% 4.1%
Commercial Auto 12.3% 7.0% 4.8% 16.0% 9.5% 6.5%
Commercial Multi Peril 12.8% 10.0% 6.9% 17.0% 13.7% 9.1%
Workers Compensation 7.5% 4.8% 4.0% 10.1% 6.5% 6.4%
Medical PL — CM 14.4% 13.7% 11.6% 17.6% 16.8% 14.2%
Other Liability — CM 14.2% 13.2% 15.1% 17.4% 16.0% 19.2%
Other Liability — Occ 14.9% 11.6% 8.2% 18.6% 15.7% 12.2%
Products Liability — Occ 17.9% 11.2% 7.5% 25.0% 16.5% 18.8%
Ultimate reserve CV calculated using average of Mack and Over Dispersed Poisson (ODP) Bootstrap methods applied to paid loss triangles by line. One-year reserve CV uses average of the Merz-Wuthrich and ODP Bootstrap methods. All methods adjusted to account for fail factor volatility and reserves more than 10 years old.
The table above shows the average measured reserve CVs for insurers with carried reserves within the ranges of USD10 million to USD100 million, USD100 million to USD500 million and more than USD500 million, roughly corresponding with small, medium and large carriers in each line respectively. CVs are shown on both a one year basis, representing the volatility of reserves over the next calendar year, and an ultimate basis, representing the volatility of reserve from their current balance until their full settlement. The all lines reserve CVs are estimated using a single paid loss triangle across all lines of business.
To contextualize the USD64 billion industry reserve development on accident years 1998-2001, we can estimate the chance of another reserve event of this magnitude. The table to the right summarizes the implied ultimate reserve risk distribution for the industry. This distribution is based on the P&C industry reserve balance as of December 31, 2010 and assumes that reserves are distributed lognormally with a CV equal to the all lines large company reserve CV of 7.3 percent.
On an ultimate basis, adverse development of USD64 billion is a 1 in 15 year event, corresponding roughly to one occurrence each underwriting cycle. These results highlight the importance of developing better processes to measure and manage reserve risk.
U.S. P&C Industry Reserve Risk Distribution All Lines, All Years
Return Period
Ultimate Development
% USD Billions
500 23.2% 129.9
250 21.1% 118.6
100 18.3% 102.5
50 15.9% 89.4
25 13.4% 75.1
10 9.6% 53.6
5 6.1% 34.1
Assumptions: Large (>USD500M) All Lines CV with LogNormal Distribution.
10
Insurance Risk Study
Innovations in Crop Insurance ModelingWorld population growth will continue to increase demand for food, energy and clothing. With emerging middle classes in Asia and elsewhere, consumers are increasing their per capita consumption of staple foods and also consuming larger quantities of meat, dairy products and vegetable oils. These factors contribute to amplified demand for aggregate grains and oilseeds. Meanwhile, U.S. ethanol policy has increased the demand for corn.
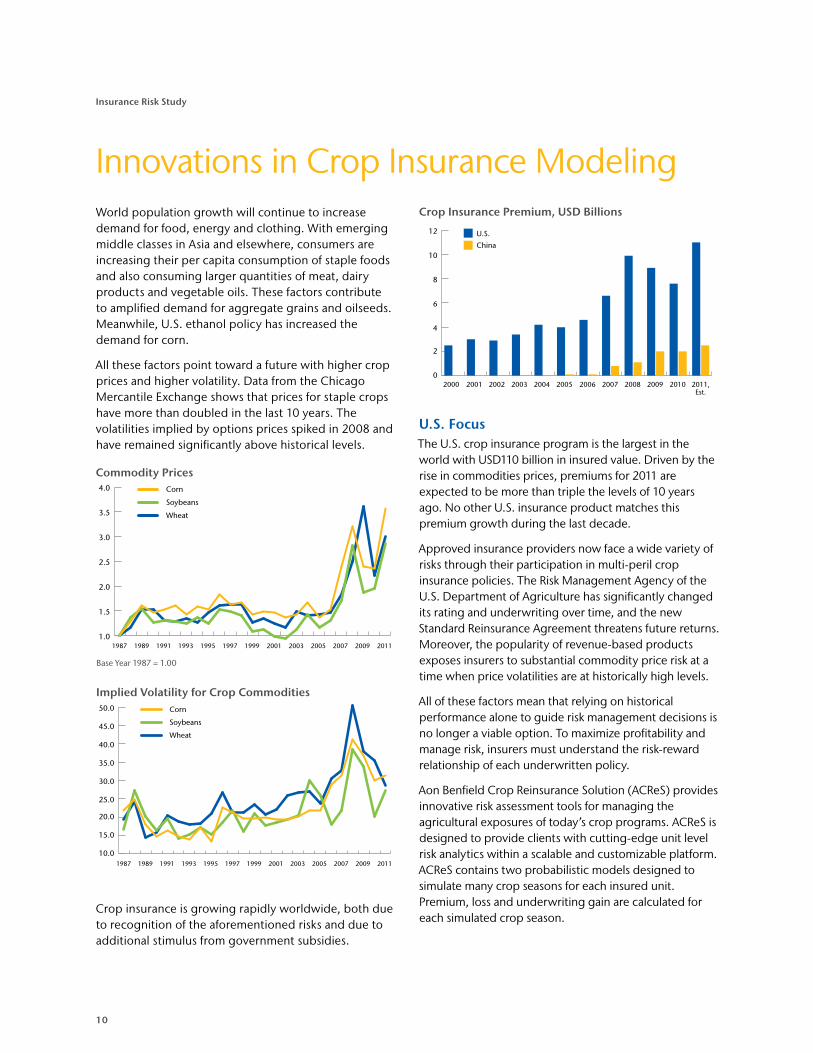
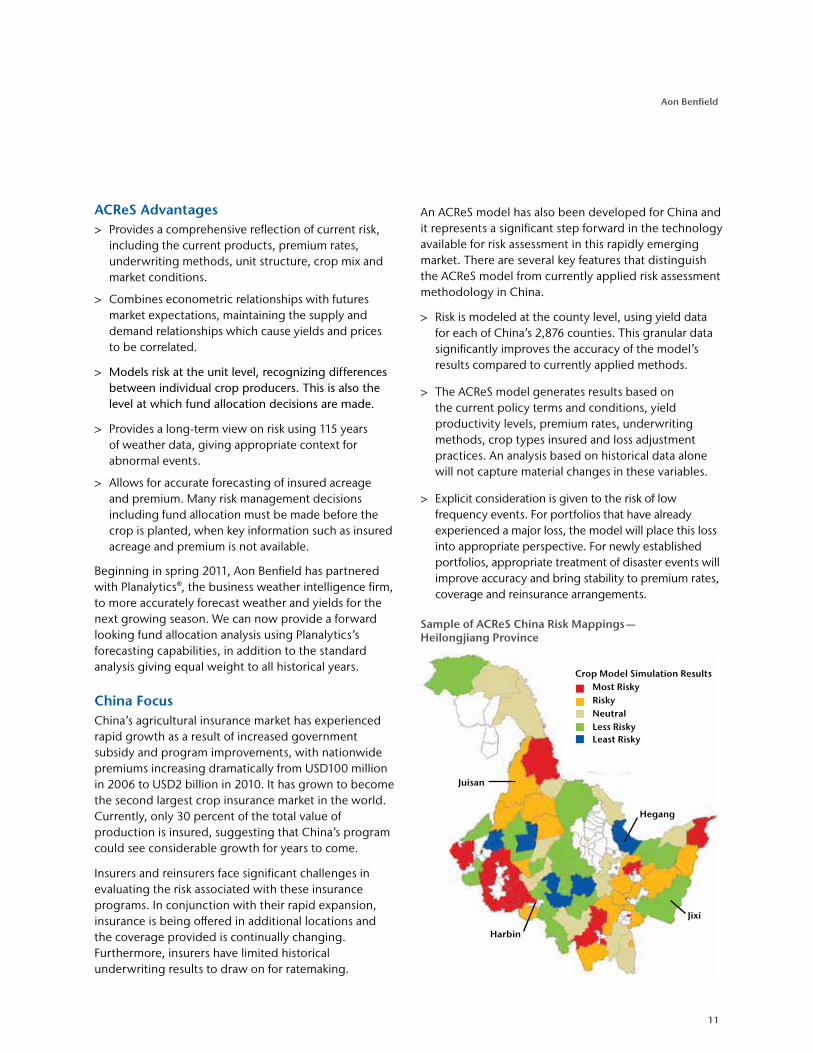
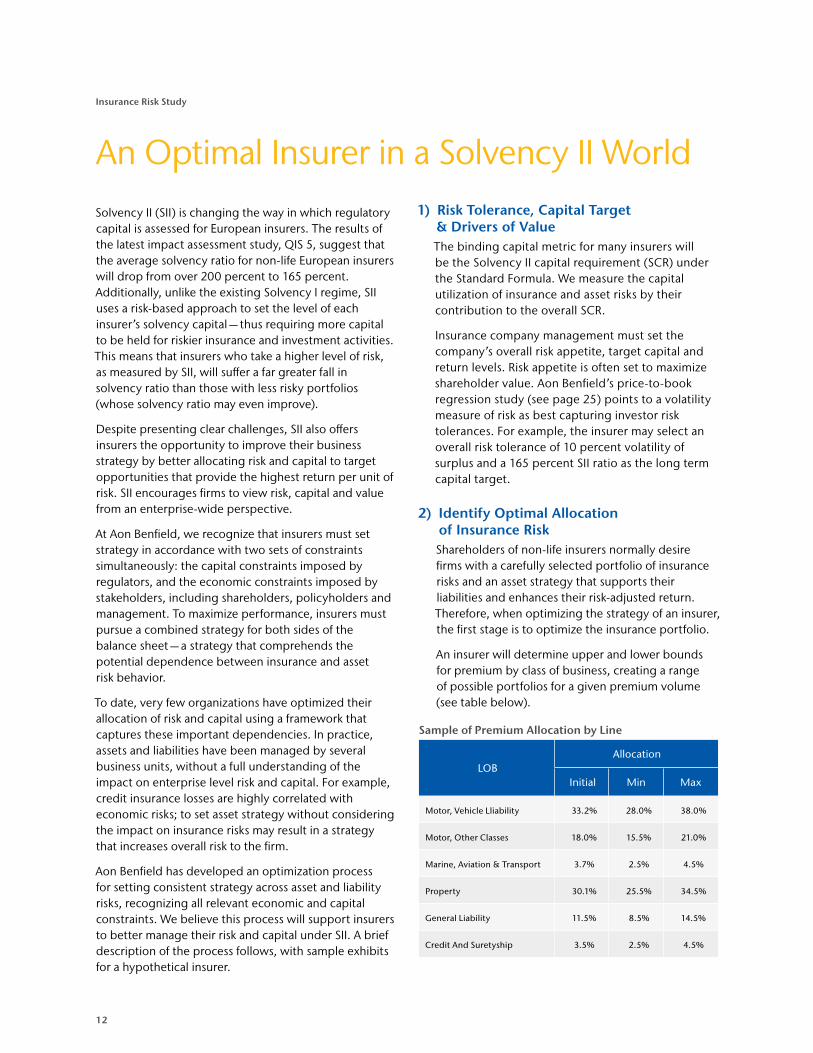
All these factors point toward a future with higher crop prices and higher volatility. Data from the Chicago Mercantile Exchange shows that prices for staple crops have more than doubled in the last 10 years. The volatilities implied by options prices spiked in 2008 and have remained significantly above historical levels.
Commodity Prices
Base Year 1987 = 1.00
Implied Volatility for Crop Commodities
Crop insurance is growing rapidly worldwide, both due to recognition of the aforementioned risks and due to additional stimulus from government subsidies.
Crop Insurance Premium, USD Billions
U.S. FocusThe U.S. crop insurance program is the largest in the world with USD110 billion in insured value. Driven by the rise in commodities prices, premiums for 2011 are expected to be more than triple the levels of 10 years ago. No other U.S. insurance product matches this premium growth during the last decade.
Approved insurance providers now face a wide variety of risks through their participation in multi-peril crop insurance policies. The Risk Management Agency of the U.S. Department of Agriculture has significantly changed its rating and underwriting over time, and the new Standard Reinsurance Agreement threatens future returns. Moreover, the popularity of revenue-based products exposes insurers to substantial commodity price risk at a time when price volatilities are at historically high levels.
All of these factors mean that relying on historical performance alone to guide risk management decisions is no longer a viable option. To maximize profitability and manage risk, insurers must understand the risk-reward relationship of each underwritten policy.
Aon Benfield Crop Reinsurance Solution (ACReS) provides innovative risk assessment tools for managing the agricultural exposures of today’s crop programs. ACReS is designed to provide clients with cutting-edge unit level risk analytics within a scalable and customizable platform. ACReS contains two probabilistic models designed to simulate many crop seasons for each insured unit. Premium, loss and underwriting gain are calculated for each simulated crop season.
1.0
1.5
2.0
2.5
3.0
3.5
4.0
2011200920072005200320011999199719951993199119891987
Corn
Soybeans
Wheat
10.0
15.0
20.0
25.0
30.0
35.0
40.0
45.0
50.0
2011200920072005200320011999199719951993199119891987
Corn
Soybeans
Wheat
0
2
4
6
8
10
12
2011,Est.
20102009200820072006200520042003200220012000
U.S.
China
11
Aon Benfield
ACReS Advantages > Provides a comprehensive reflection of current risk,
including the current products, premium rates, underwriting methods, unit structure, crop mix and market conditions.
> Combines econometric relationships with futures market expectations, maintaining the supply and demand relationships which cause yields and prices to be correlated.
> Models risk at the unit level, recognizing differences between individual crop producers. This is also the level at which fund allocation decisions are made.
> Provides a long-term view on risk using 115 years of weather data, giving appropriate context for abnormal events.
> Allows for accurate forecasting of insured acreage and premium. Many risk management decisions including fund allocation must be made before the crop is planted, when key information such as insured acreage and premium is not available.
Beginning in spring 2011, Aon Benfield has partnered with Planalytics®, the business weather intelligence firm, to more accurately forecast weather and yields for the next growing season. We can now provide a forward looking fund allocation analysis using Planalytics’s forecasting capabilities, in addition to the standard analysis giving equal weight to all historical years.
China FocusChina’s agricultural insurance market has experienced rapid growth as a result of increased government subsidy and program improvements, with nationwide premiums increasing dramatically from USD100 million in 2006 to USD2 billion in 2010. It has grown to become the second largest crop insurance market in the world. Currently, only 30 percent of the total value of production is insured, suggesting that China’s program could see considerable growth for years to come.
Insurers and reinsurers face significant challenges in evaluating the risk associated with these insurance programs. In conjunction with their rapid expansion, insurance is being offered in additional locations and the coverage provided is continually changing. Furthermore, insurers have limited historical underwriting results to draw on for ratemaking.
An ACReS model has also been developed for China and it represents a significant step forward in the technology available for risk assessment in this rapidly emerging market. There are several key features that distinguish the ACReS model from currently applied risk assessment methodology in China.
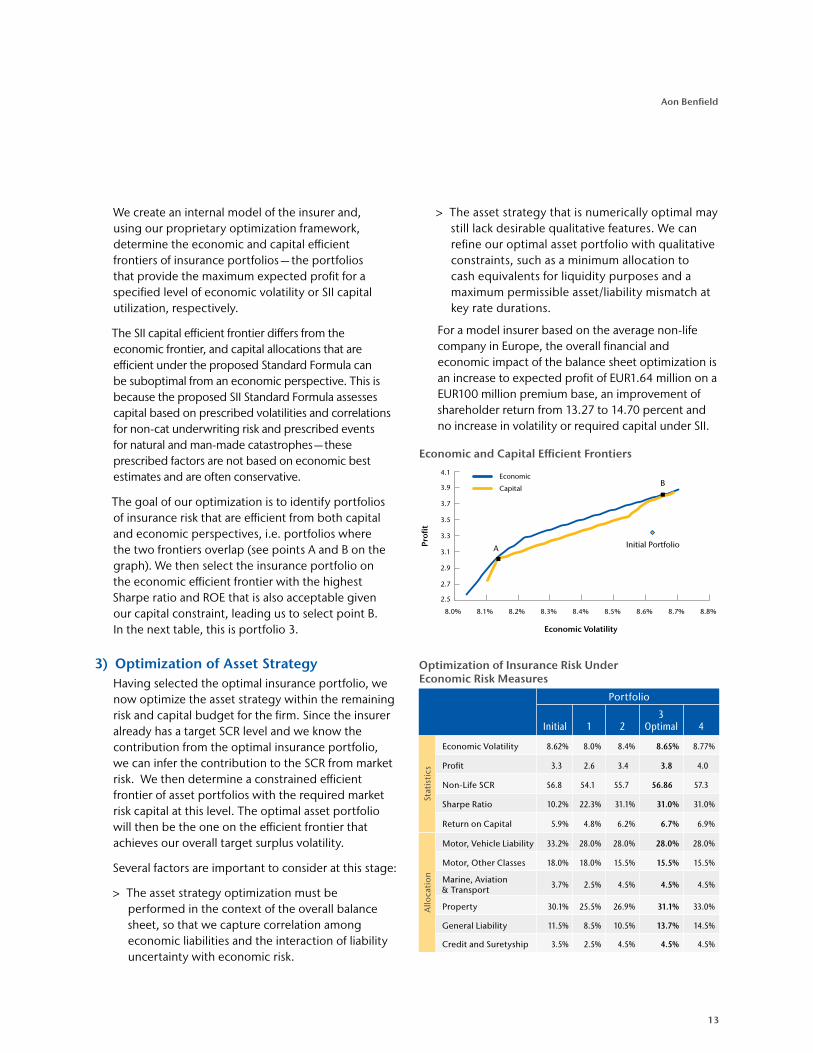
> Risk is modeled at the county level, using yield data for each of China’s 2,876 counties. This granular data significantly improves the accuracy of the model’s results compared to currently applied methods.
> The ACReS model generates results based on the current policy terms and conditions, yield productivity levels, premium rates, underwriting methods, crop types insured and loss adjustment practices. An analysis based on historical data alone will not capture material changes in these variables.
> Explicit consideration is given to the risk of low frequency events. For portfolios that have already experienced a major loss, the model will place this loss into appropriate perspective. For newly established portfolios, appropriate treatment of disaster events will improve accuracy and bring stability to premium rates, coverage and reinsurance arrangements.
Sample of ACReS China Risk Mappings — Heilongjiang Province
Crop Model Simulation Results Most Risky Risky Neutral Less Risky Least Risky
Jixi
Harbin
Juisan
Hegang
12
Insurance Risk Study
An Optimal Insurer in a Solvency II WorldSolvency II (SII) is changing the way in which regulatory capital is assessed for European insurers. The results of the latest impact assessment study, QIS 5, suggest that the average solvency ratio for non-life European insurers will drop from over 200 percent to 165 percent. Additionally, unlike the existing Solvency I regime, SII uses a risk-based approach to set the level of each insurer’s solvency capital — thus requiring more capital to be held for riskier insurance and investment activities. This means that insurers who take a higher level of risk, as measured by SII, will suffer a far greater fall in solvency ratio than those with less risky portfolios (whose solvency ratio may even improve).
Despite presenting clear challenges, SII also offers insurers the opportunity to improve their business strategy by better allocating risk and capital to target opportunities that provide the highest return per unit of risk. SII encourages firms to view risk, capital and value from an enterprise-wide perspective.
At Aon Benfield, we recognize that insurers must set strategy in accordance with two sets of constraints simultaneously: the capital constraints imposed by regulators, and the economic constraints imposed by stakeholders, including shareholders, policyholders and management. To maximize performance, insurers must pursue a combined strategy for both sides of the balance sheet — a strategy that comprehends the potential dependence between insurance and asset risk behavior.
To date, very few organizations have optimized their allocation of risk and capital using a framework that captures these important dependencies. In practice, assets and liabilities have been managed by several business units, without a full understanding of the impact on enterprise level risk and capital. For example, credit insurance losses are highly correlated with economic risks; to set asset strategy without considering the impact on insurance risks may result in a strategy that increases overall risk to the firm.
Aon Benfield has developed an optimization process for setting consistent strategy across asset and liability risks, recognizing all relevant economic and capital constraints. We believe this process will support insurers to better manage their risk and capital under SII. A brief description of the process follows, with sample exhibits for a hypothetical insurer.
1) Risk Tolerance, Capital Target & Drivers of ValueThe binding capital metric for many insurers will be the Solvency II capital requirement (SCR) under the Standard Formula. We measure the capital utilization of insurance and asset risks by their contribution to the overall SCR.
Insurance company management must set the company’s overall risk appetite, target capital and return levels. Risk appetite is often set to maximize shareholder value. Aon Benfield’s price-to-book regression study (see page 25) points to a volatility measure of risk as best capturing investor risk tolerances. For example, the insurer may select an overall risk tolerance of 10 percent volatility of surplus and a 165 percent SII ratio as the long term capital target.
2) Identify Optimal Allocation of Insurance RiskShareholders of non-life insurers normally desire firms with a carefully selected portfolio of insurance risks and an asset strategy that supports their liabilities and enhances their risk-adjusted return. Therefore, when optimizing the strategy of an insurer, the first stage is to optimize the insurance portfolio.
An insurer will determine upper and lower bounds for premium by class of business, creating a range of possible portfolios for a given premium volume (see table below).
Sample of Premium Allocation by Line
LOBAllocation
Initial Min Max
Motor, Vehicle Lliability 33.2% 28.0% 38.0%
Motor, Other Classes 18.0% 15.5% 21.0%
Marine, Aviation & Transport 3.7% 2.5% 4.5%
Property 30.1% 25.5% 34.5%
General Liability 11.5% 8.5% 14.5%
Credit And Suretyship 3.5% 2.5% 4.5%
13
Aon Benfield
We create an internal model of the insurer and, using our proprietary optimization framework, determine the economic and capital efficient frontiers of insurance portfolios — the portfolios that provide the maximum expected profit for a specified level of economic volatility or SII capital utilization, respectively.
The SII capital efficient frontier differs from the economic frontier, and capital allocations that are efficient under the proposed Standard Formula can be suboptimal from an economic perspective. This is because the proposed SII Standard Formula assesses capital based on prescribed volatilities and correlations for non-cat underwriting risk and prescribed events for natural and man-made catastrophes — these prescribed factors are not based on economic best estimates and are often conservative.
The goal of our optimization is to identify portfolios of insurance risk that are efficient from both capital and economic perspectives, i.e. portfolios where the two frontiers overlap (see points A and B on the graph). We then select the insurance portfolio on the economic efficient frontier with the highest Sharpe ratio and ROE that is also acceptable given our capital constraint, leading us to select point B. In the next table, this is portfolio 3.
3) Optimization of Asset StrategyHaving selected the optimal insurance portfolio, we now optimize the asset strategy within the remaining risk and capital budget for the firm. Since the insurer already has a target SCR level and we know the contribution from the optimal insurance portfolio, we can infer the contribution to the SCR from market risk. We then determine a constrained efficient frontier of asset portfolios with the required market risk capital at this level. The optimal asset portfolio will then be the one on the efficient frontier that achieves our overall target surplus volatility.
Several factors are important to consider at this stage:
> The asset strategy optimization must be performed in the context of the overall balance sheet, so that we capture correlation among economic liabilities and the interaction of liability uncertainty with economic risk.
> The asset strategy that is numerically optimal may still lack desirable qualitative features. We can refine our optimal asset portfolio with qualitative constraints, such as a minimum allocation to cash equivalents for liquidity purposes and a maximum permissible asset/liability mismatch at key rate durations.
For a model insurer based on the average non-life company in Europe, the overall financial and economic impact of the balance sheet optimization is an increase to expected profit of EUR1.64 million on a EUR100 million premium base, an improvement of shareholder return from 13.27 to 14.70 percent and no increase in volatility or required capital under SII.
Economic and Capital Efficient Frontiers
Optimization of Insurance Risk Under Economic Risk Measures
Portfolio
Initial 1 23
Optimal 4
Stat
isti
cs
Economic Volatility 8.62% 8.0% 8.4% 8.65% 8.77%
Profit 3.3 2.6 3.4 3.8 4.0
Non-Life SCR 56.8 54.1 55.7 56.86 57.3
Sharpe Ratio 10.2% 22.3% 31.1% 31.0% 31.0%
Return on Capital 5.9% 4.8% 6.2% 6.7% 6.9%
Allo
cati
on
Motor, Vehicle Liability 33.2% 28.0% 28.0% 28.0% 28.0%
Motor, Other Classes 18.0% 18.0% 15.5% 15.5% 15.5%
Marine, Aviation & Transport 3.7% 2.5% 4.5% 4.5% 4.5%
Property 30.1% 25.5% 26.9% 31.1% 33.0%
General Liability 11.5% 8.5% 10.5% 13.7% 14.5%
Credit and Suretyship 3.5% 2.5% 4.5% 4.5% 4.5%
Economic
Capital
Initial Portfolio
B
A
2.5
2.7
2.9
3.1
3.3
3.5
3.7
3.9
4.1
8.0% 8.1% 8.2% 8.3% 8.4% 8.5% 8.6% 8.7% 8.8%
Profi
t
Economic Volatility
14
Insurance Risk Study
Variable Annuity BasicsThe variable annuity (VA) market globally has total deposits of approximately USD2.0 trillion of which roughly USD400 billion have embedded guarantees. The largest VA markets are the U.S. and Japan. A typical guarantee on a VA contract provides a financial guarantee such as a death benefit, living benefit or an income benefit. Insurance companies typically charge policyholders a rider fee of between 60 and 200 basis points of account value for providing these guarantees. The fee is intended to cover the economic cost of the guarantee, which amounts to the cost of replicating the guarantee in the financial market using derivatives and other financial instruments.
In order to properly hedge the embedded market risks in theses guarantees, insurers employ various strategies, including dynamic hedging. For a dynamic hedge to be effective, the underlying assets need to be rebalanced as their market prices change. In practice, however, insurance companies typically set trading tolerances and only rebalance if the risk breaches these tolerances. The main market risk factors affecting the value of VA guarantees are changes in equity markets, changes in interest rates and changes in implied volatility. It is common to refer to these sensitivities as Greeks: Delta for the effect of changes in equity markets, Rho for changes in interest rates and Vega for changes in implied volatility.
To calculate these risk factors on large portfolios representing millions of policyholders, insurers have been required to deploy massive amounts of computing power. Sometimes thousands of processors are used to produce estimates of the risks factors required for hedging. Until recently, the software used to estimate the risk required eight hours or more to produce a range of Greek estimates under various market scenarios. Given the slow runtime, insurers will often run these large computations overnight and use only rough approximations to estimate the risks during the next trading day.
These estimation techniques are prone to substantial errors, which grow larger the more that markets move — just when the greatest accuracy is required. The impact of miscalculating the actual risk can translate into significant gains or losses due to the large quantity of assets used to hedge a VA portfolio. We estimate that North American VA writers lost USD3 billion due to hedge estimation errors during the 2007 – 2009 financial crisis.
Introducing Pathwise®
To help our clients better manage these hedge positions, Aon Benfield’s Annuity Solutions Group developed PathWise, the industry’s fastest VA risk management system. By leveraging the latest technology and employing cutting-edge parallel processing techniques, the Annuity Solutions Group can perform computations which typically take eight hours of runtime in just a few minutes.
What does this mean for risk management? By using PathWise, insurers can substantially reduce the risk profile of their VA exposure by managing their portfolio in real-time. Trading is now based on timely and accurate intraday information about the liabilities and assets rather than being based on yesterday’s information and potentially large estimation errors.
A Case Study in HedgingThe following study compares three dynamic hedging strategies. The first strategy uses information from nightly simulations and, using Taylor approximation techniques, estimates the Greeks at the end of the next day — this is the method used by many insurance companies today. The second strategy uses real-time simulation to calculate Greeks once at the end of the trading day and rebalances once per day. The third strategy uses real-time simulation to calculate Greeks intraday and executes trades based on real-time risk factors.
Innovations in Hedging
15
Aon Benfield
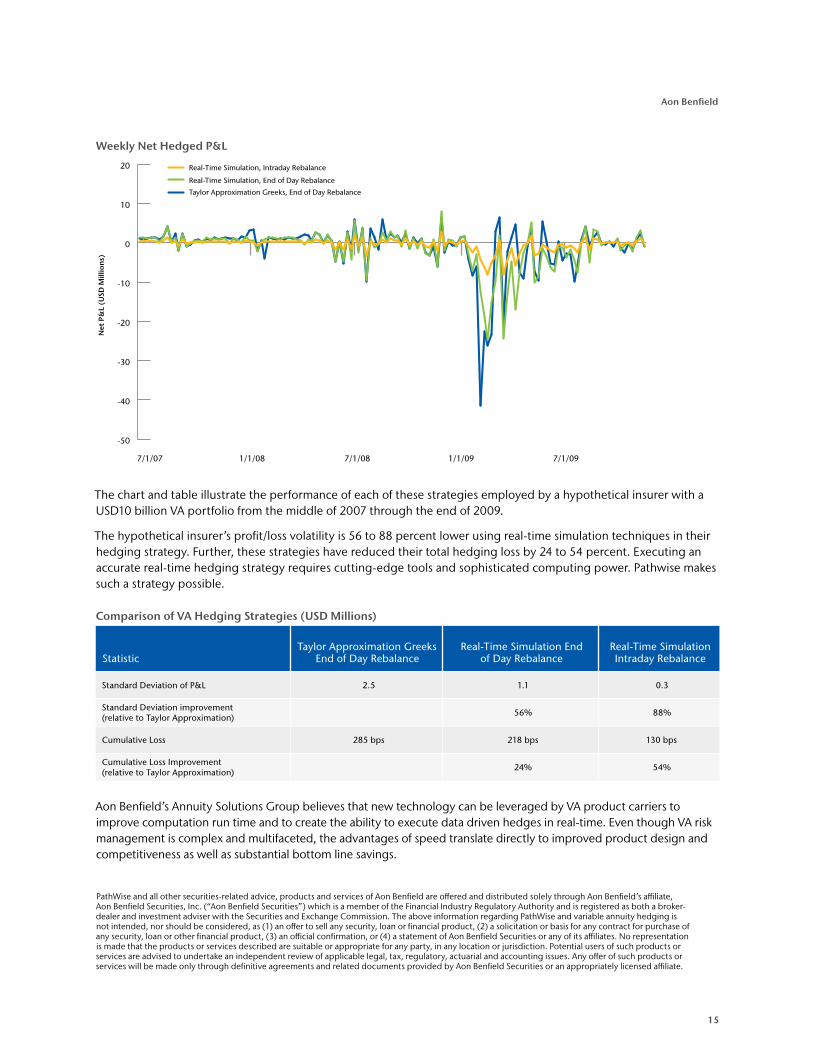
The chart and table illustrate the performance of each of these strategies employed by a hypothetical insurer with a USD10 billion VA portfolio from the middle of 2007 through the end of 2009.
The hypothetical insurer’s profit/loss volatility is 56 to 88 percent lower using real-time simulation techniques in their hedging strategy. Further, these strategies have reduced their total hedging loss by 24 to 54 percent. Executing an accurate real-time hedging strategy requires cutting-edge tools and sophisticated computing power. Pathwise makes such a strategy possible.
Comparison of VA Hedging Strategies (USD Millions)
StatisticTaylor Approximation Greeks
End of Day RebalanceReal-Time Simulation End
of Day RebalanceReal-Time Simulation Intraday Rebalance
Standard Deviation of P&L 2.5 1.1 0.3
Standard Deviation improvement (relative to Taylor Approximation)
56% 88%
Cumulative Loss 285 bps 218 bps 130 bps
Cumulative Loss Improvement (relative to Taylor Approximation)
24% 54%
Aon Benfield’s Annuity Solutions Group believes that new technology can be leveraged by VA product carriers to improve computation run time and to create the ability to execute data driven hedges in real-time. Even though VA risk management is complex and multifaceted, the advantages of speed translate directly to improved product design and competitiveness as well as substantial bottom line savings.
PathWise and all other securities-related advice, products and services of Aon Benfield are offered and distributed solely through Aon Benfield’s affiliate, Aon Benfield Securities, Inc. (“Aon Benfield Securities”) which is a member of the Financial Industry Regulatory Authority and is registered as both a broker-dealer and investment adviser with the Securities and Exchange Commission. The above information regarding PathWise and variable annuity hedging is not intended, nor should be considered, as (1) an offer to sell any security, loan or financial product, (2) a solicitation or basis for any contract for purchase of any security, loan or other financial product, (3) an official confirmation, or (4) a statement of Aon Benfield Securities or any of its affiliates. No representation is made that the products or services described are suitable or appropriate for any party, in any location or jurisdiction. Potential users of such products or services are advised to undertake an independent review of applicable legal, tax, regulatory, actuarial and accounting issues. Any offer of such products or services will be made only through definitive agreements and related documents provided by Aon Benfield Securities or an appropriately licensed affiliate.
Weekly Net Hedged P&L
Real-Time Simulation, Intraday Rebalance
Real-Time Simulation, End of Day Rebalance
Taylor Approximation Greeks, End of Day Rebalance
Net
P&
L (U
SD M
illio
ns)
-50
-40
-30
-20
-10
0
10
20
7/1/091/1/097/1/081/1/087/1/07
16
Insurance Risk Study
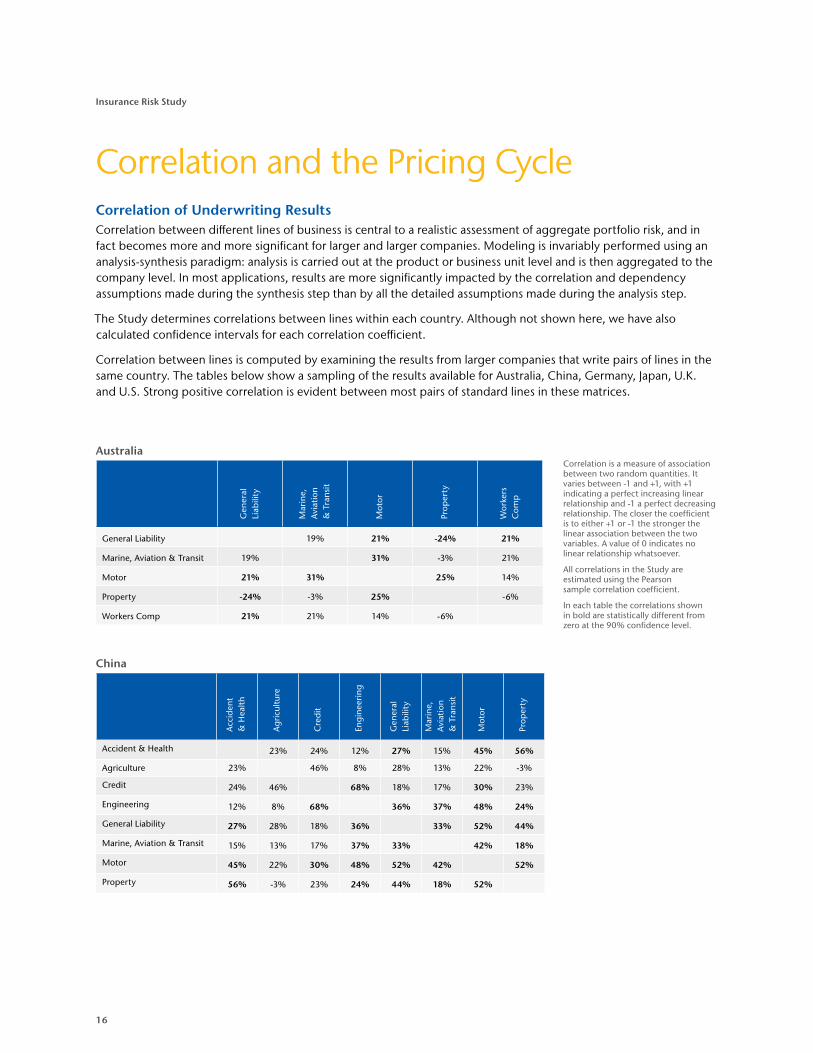
Correlation of Underwriting ResultsCorrelation between different lines of business is central to a realistic assessment of aggregate portfolio risk, and in fact becomes more and more significant for larger and larger companies. Modeling is invariably performed using an analysis-synthesis paradigm: analysis is carried out at the product or business unit level and is then aggregated to the company level. In most applications, results are more significantly impacted by the correlation and dependency assumptions made during the synthesis step than by all the detailed assumptions made during the analysis step.
The Study determines correlations between lines within each country. Although not shown here, we have also calculated confidence intervals for each correlation coefficient.
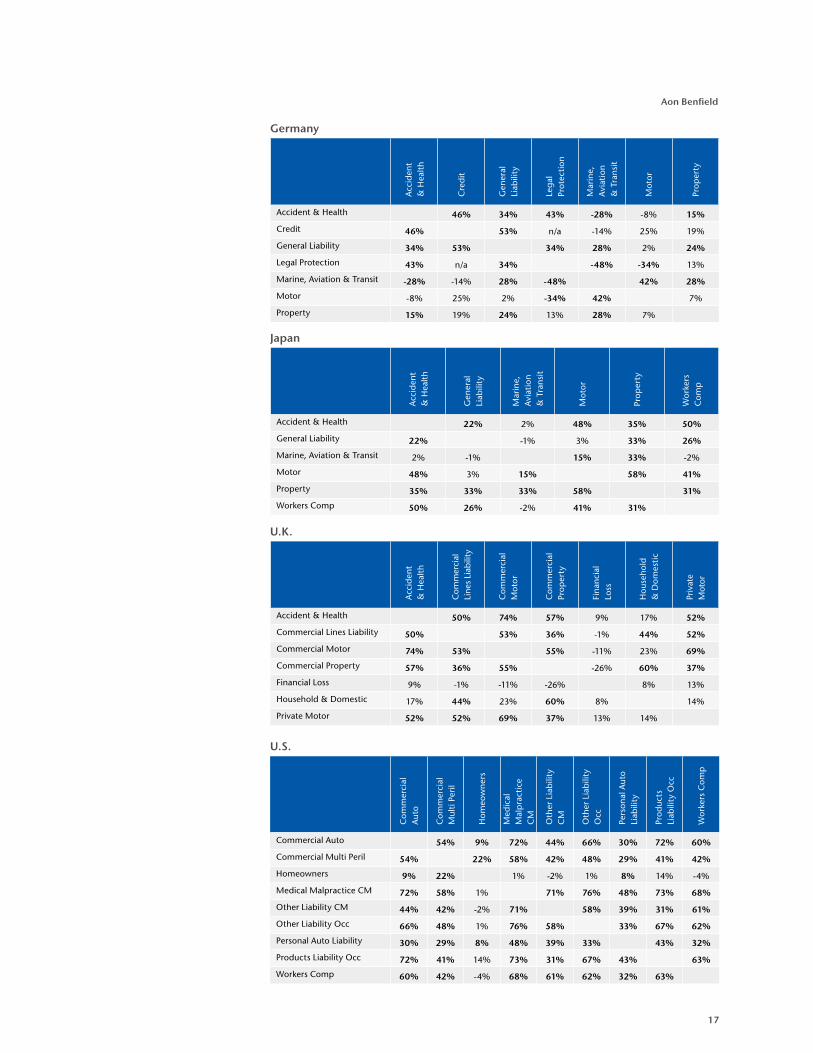
Correlation between lines is computed by examining the results from larger companies that write pairs of lines in the same country. The tables below show a sampling of the results available for Australia, China, Germany, Japan, U.K. and U.S. Strong positive correlation is evident between most pairs of standard lines in these matrices.
Correlation and the Pricing Cycle
China
Acc
iden
t
&H
ealt
h
Ag
ricu
ltur
e
Cre
dit
Eng
inee
rin
g
Gen
eral
Li
abili
ty
Mar
ine,
A
viat
ion
&
Tra
nsit
Mot
or
Prop
erty
Accident&Health 23% 24% 12% 27% 15% 45% 56%
Agriculture 23% 46% 8% 28% 13% 22% -3%
Credit 24% 46% 68% 18% 17% 30% 23%
Engineering 12% 8% 68% 36% 37% 48% 24%
GeneralLiability 27% 28% 18% 36% 33% 52% 44%
Marine,Aviation&Transit 15% 13% 17% 37% 33% 42% 18%
Motor 45% 22% 30% 48% 52% 42% 52%
Property 56% -3% 23% 24% 44% 18% 52%
Australia
Gen
eral
Li
abili
ty
Mar
ine,
A
viat
ion
&
Tra
nsit
Mot
or
Prop
erty
Wor
kers
C
omp
GeneralLiability 19% 21% -24% 21%
Marine,Aviation&Transit 19% 31% -3% 21%
Motor 21% 31% 25% 14%
Property -24% -3% 25% -6%
WorkersComp 21% 21% 14% -6%
Correlationisameasureofassociationbetweentworandomquantities.Itvariesbetween-1and+1,with+1indicatingaperfectincreasinglinearrelationshipand-1aperfectdecreasingrelationship.Thecloserthecoefficientistoeither+1or-1thestrongerthelinearassociationbetweenthetwovariables.Avalueof0indicatesnolinearrelationshipwhatsoever.
AllcorrelationsintheStudyareestimatedusingthePearsonsamplecorrelationcoefficient.
Ineachtablethecorrelationsshowninboldarestatisticallydifferentfromzeroatthe90%confidencelevel.
17
Aon Benfield
U.S.
Com
mer
cial
A
uto
Com
mer
cial
M
ulti
Per
il
Hom
eow
ner
s
Med
ical
M
alp
ract
ice
CM
Oth
er L
iab
ility
C
M
Oth
er L
iab
ility
O
cc
Pers
onal
Aut
o Li
abili
ty
Prod
ucts
Li
abili
ty O
cc
Wor
kers
Com
p
Commercial Auto 54% 9% 72% 44% 66% 30% 72% 60%
Commercial Multi Peril 54% 22% 58% 42% 48% 29% 41% 42%
Homeowners 9% 22% 1% -2% 1% 8% 14% -4%
Medical Malpractice CM 72% 58% 1% 71% 76% 48% 73% 68%
Other Liability CM 44% 42% -2% 71% 58% 39% 31% 61%
Other Liability Occ 66% 48% 1% 76% 58% 33% 67% 62%
Personal Auto Liability 30% 29% 8% 48% 39% 33% 43% 32%
Products Liability Occ 72% 41% 14% 73% 31% 67% 43% 63%
Workers Comp 60% 42% -4% 68% 61% 62% 32% 63%
U.K.
Acc
iden
t
& H
ealt
h
Com
mer
cial
Li
nes
Liab
ility
Com
mer
cial
M
otor
Com
mer
cial
Pr
oper
ty
Fina
ncia
l Lo
ss
Hou
seh
old
& D
omes
tic
Priv
ate
Mot
or
Accident & Health 50% 74% 57% 9% 17% 52%
Commercial Lines Liability 50% 53% 36% -1% 44% 52%
Commercial Motor 74% 53% 55% -11% 23% 69%
Commercial Property 57% 36% 55% -26% 60% 37%
Financial Loss 9% -1% -11% -26% 8% 13%
Household & Domestic 17% 44% 23% 60% 8% 14%
Private Motor 52% 52% 69% 37% 13% 14%
Japan
Acc
iden
t
& H
ealt
h
Gen
eral
Li
abili
ty
Mar
ine,
A
viat
ion
&
Tra
nsit
Mot
or
Prop
erty
Wor
kers
C
omp
Accident & Health 22% 2% 48% 35% 50%
General Liability 22% -1% 3% 33% 26%
Marine, Aviation & Transit 2% -1% 15% 33% -2%
Motor 48% 3% 15% 58% 41%
Property 35% 33% 33% 58% 31%
Workers Comp 50% 26% -2% 41% 31%
Germany
Acc
iden
t
& H
ealt
h
Cre
dit
Gen
eral
Li
abili
ty
Leg
al
Prot
ecti
on
Mar
ine,
A
viat
ion
&
Tra
nsit
Mot
or
Prop
erty
Accident & Health 46% 34% 43% -28% -8% 15%
Credit 46% 53% n/a -14% 25% 19%
General Liability 34% 53% 34% 28% 2% 24%
Legal Protection 43% n/a 34% -48% -34% 13%
Marine, Aviation & Transit -28% -14% 28% -48% 42% 28%
Motor -8% 25% 2% -34% 42% 7%
Property 15% 19% 24% 13% 28% 7%
18
Insurance Risk Study
Macroeconomic Correlations
Infla
tion
(C
PI-U
)
Infla
tion
(PP
I)
GD
P G
row
th
Un
emp
loym
ent
Ch
ang
e
3-M
onth
T-B
ill R
ate
1-3
Year
Tre
asur
ies
AA
A-A
A 3
-5 Y
ear
Spre
ad
BBB
3-5
Yea
r Sp
read
S&P
500
Retu
rns
VIX
Prop
erty
Ret
urns
Inflation (CPI-U) 78% -3% -2% 32% 27% -11% -26% -13% -23% 13%
Inflation (PPI) 78% 4% -7% 30% 9% -4% -20% -7% -22% 12%
GDP Growth -3% 4% -70% -4% 24% -64% -69% 5% -44% 51%
Unemployment Change -2% -7% -70% -2% -25% 62% 76% -1% 57% -49%
3-Month T-Bill Rate 32% 30% -4% -2% 98% -32% -58% -8% -24% 16%
1-3 Year Treasuries 27% 9% 24% -25% 98% -38% -60% 12% -27% 13%
AAA-AA 3-5 Year Spread -11% -4% -64% 62% -32% -38% 85% -42% 62% -63%
BBB 3-5 Year Spread -26% -20% -69% 76% -58% -60% 85% -33% 67% -53%
S&P 500 Returns -13% -7% 5% -1% -8% 12% -42% -33% -50% 9%
VIX -23% -22% -44% 57% -24% -27% 62% 67% -50% -30%
Property Returns 13% 12% 51% -49% 16% 13% -63% -53% 9% -30%
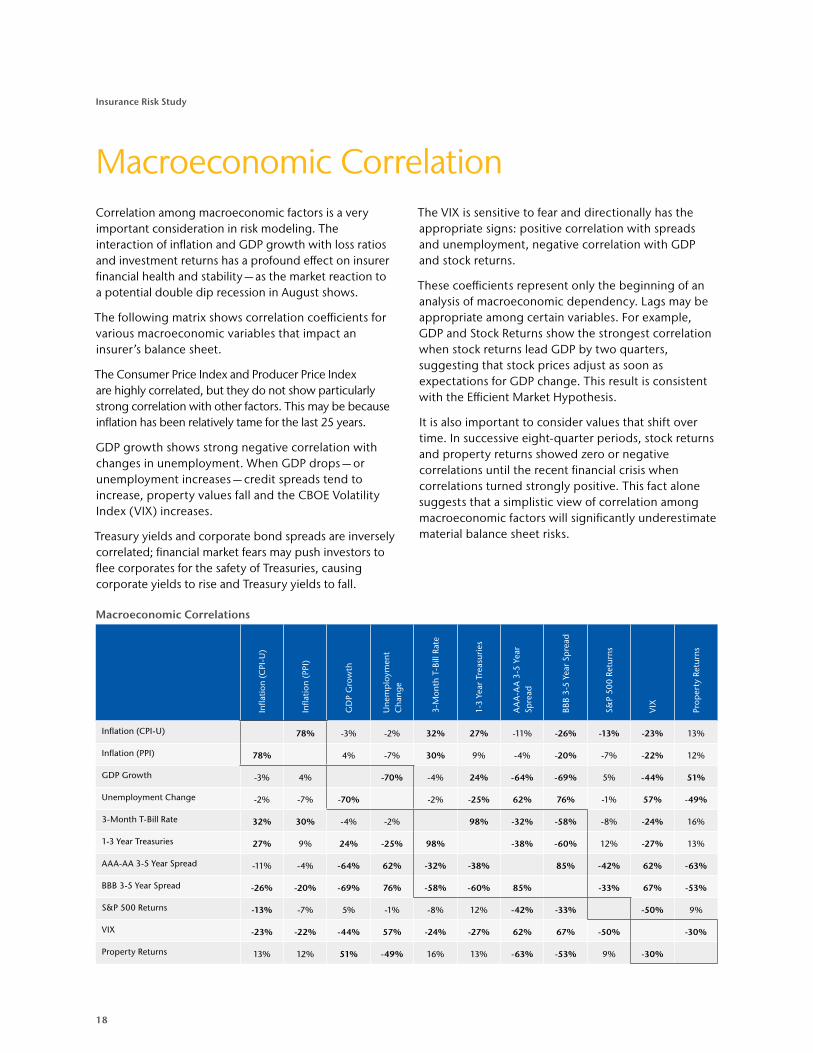
Correlation among macroeconomic factors is a very important consideration in risk modeling. The interaction of inflation and GDP growth with loss ratios and investment returns has a profound effect on insurer financial health and stability — as the market reaction to a potential double dip recession in August shows.
The following matrix shows correlation coefficients for various macroeconomic variables that impact an insurer’s balance sheet.
The Consumer Price Index and Producer Price Index are highly correlated, but they do not show particularly strong correlation with other factors. This may be because inflation has been relatively tame for the last 25 years.
GDP growth shows strong negative correlation with changes in unemployment. When GDP drops — or unemployment increases — credit spreads tend to increase, property values fall and the CBOE Volatility Index (VIX) increases.
Treasury yields and corporate bond spreads are inversely correlated; financial market fears may push investors to flee corporates for the safety of Treasuries, causing corporate yields to rise and Treasury yields to fall.
The VIX is sensitive to fear and directionally has the appropriate signs: positive correlation with spreads and unemployment, negative correlation with GDP and stock returns.
These coefficients represent only the beginning of an analysis of macroeconomic dependency. Lags may be appropriate among certain variables. For example, GDP and Stock Returns show the strongest correlation when stock returns lead GDP by two quarters, suggesting that stock prices adjust as soon as expectations for GDP change. This result is consistent with the Efficient Market Hypothesis.
It is also important to consider values that shift over time. In successive eight-quarter periods, stock returns and property returns showed zero or negative correlations until the recent financial crisis when correlations turned strongly positive. This fact alone suggests that a simplistic view of correlation among macroeconomic factors will significantly underestimate material balance sheet risks.
Macroeconomic Correlation
19
Aon Benfield
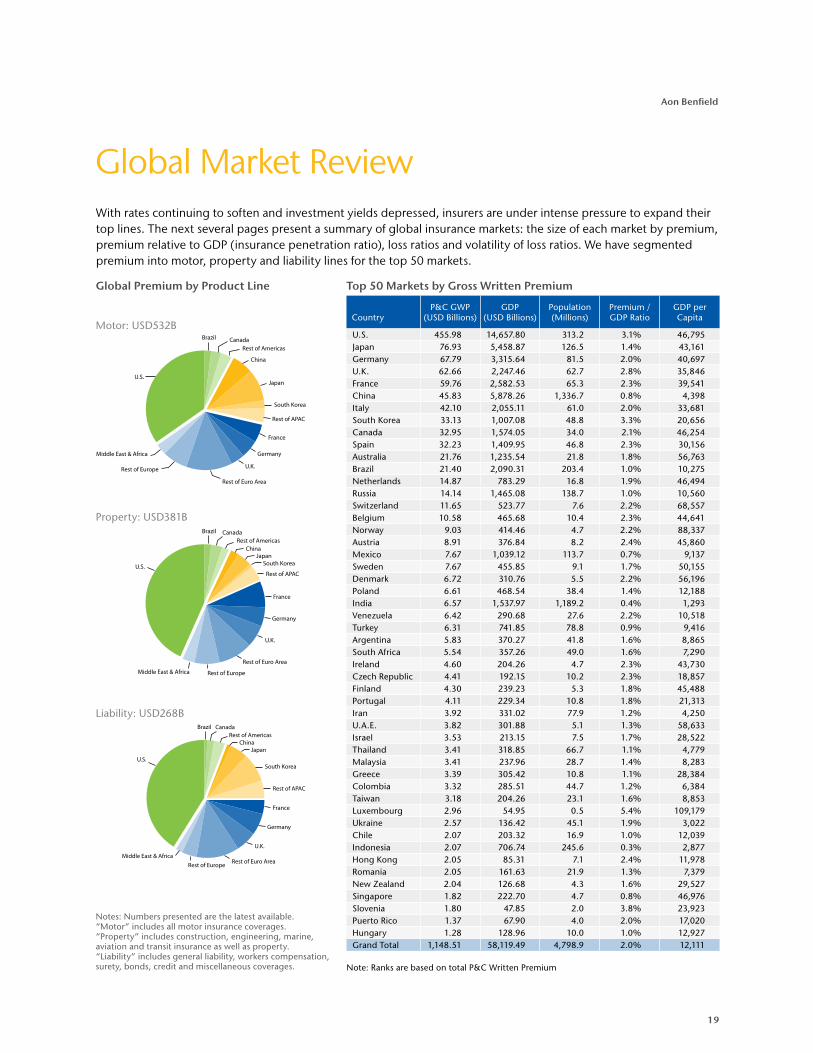
Top 50 Markets by Gross Written Premium
CountryP&C GWP
(USD Billions)GDP
(USD Billions)Population (Millions)
Premium / GDP Ratio
GDP per Capita
U.S. 455.98 14,657.80 313.2 3.1% 46,795 Japan 76.93 5,458.87 126.5 1.4% 43,161 Germany 67.79 3,315.64 81.5 2.0% 40,697 U.K. 62.66 2,247.46 62.7 2.8% 35,846 France 59.76 2,582.53 65.3 2.3% 39,541 China 45.83 5,878.26 1,336.7 0.8% 4,398 Italy 42.10 2,055.11 61.0 2.0% 33,681 South Korea 33.13 1,007.08 48.8 3.3% 20,656 Canada 32.95 1,574.05 34.0 2.1% 46,254 Spain 32.23 1,409.95 46.8 2.3% 30,156 Australia 21.76 1,235.54 21.8 1.8% 56,763 Brazil 21.40 2,090.31 203.4 1.0% 10,275 Netherlands 14.87 783.29 16.8 1.9% 46,494 Russia 14.14 1,465.08 138.7 1.0% 10,560 Switzerland 11.65 523.77 7.6 2.2% 68,557 Belgium 10.58 465.68 10.4 2.3% 44,641 Norway 9.03 414.46 4.7 2.2% 88,337 Austria 8.91 376.84 8.2 2.4% 45,860 Mexico 7.67 1,039.12 113.7 0.7% 9,137 Sweden 7.67 455.85 9.1 1.7% 50,155 Denmark 6.72 310.76 5.5 2.2% 56,196 Poland 6.61 468.54 38.4 1.4% 12,188 India 6.57 1,537.97 1,189.2 0.4% 1,293 Venezuela 6.42 290.68 27.6 2.2% 10,518 Turkey 6.31 741.85 78.8 0.9% 9,416 Argentina 5.83 370.27 41.8 1.6% 8,865 South Africa 5.54 357.26 49.0 1.6% 7,290 Ireland 4.60 204.26 4.7 2.3% 43,730 Czech Republic 4.41 192.15 10.2 2.3% 18,857 Finland 4.30 239.23 5.3 1.8% 45,488 Portugal 4.11 229.34 10.8 1.8% 21,313 Iran 3.92 331.02 77.9 1.2% 4,250 U.A.E. 3.82 301.88 5.1 1.3% 58,633 Israel 3.53 213.15 7.5 1.7% 28,522 Thailand 3.41 318.85 66.7 1.1% 4,779 Malaysia 3.41 237.96 28.7 1.4% 8,283 Greece 3.39 305.42 10.8 1.1% 28,384 Colombia 3.32 285.51 44.7 1.2% 6,384 Taiwan 3.18 204.26 23.1 1.6% 8,853 Luxembourg 2.96 54.95 0.5 5.4% 109,179 Ukraine 2.57 136.42 45.1 1.9% 3,022 Chile 2.07 203.32 16.9 1.0% 12,039 Indonesia 2.07 706.74 245.6 0.3% 2,877 Hong Kong 2.05 85.31 7.1 2.4% 11,978 Romania 2.05 161.63 21.9 1.3% 7,379 New Zealand 2.04 126.68 4.3 1.6% 29,527 Singapore 1.82 222.70 4.7 0.8% 46,976 Slovenia 1.80 47.85 2.0 3.8% 23,923 Puerto Rico 1.37 67.90 4.0 2.0% 17,020 Hungary 1.28 128.96 10.0 1.0% 12,927 Grand Total 1,148.51 58,119.49 4,798.9 2.0% 12,111
U.S.
Middle East & Africa
Rest of Europe
Rest of Euro Area
U.K.
Germany
France
Rest of APAC
South Korea
Japan
China
Rest of AmericasCanadaBrazil
U.S.
Middle East & Africa Rest of Europe
Rest of Euro Area
U.K.
Germany
France
Rest of APAC
South KoreaJapan
ChinaRest of Americas
CanadaBrazil
U.S.
Middle East & AfricaRest of Europe Rest of Euro Area
U.K.
Germany
France
Rest of APAC
South Korea
JapanChina
Rest of AmericasCanadaBrazil
Global Premium by Product Line
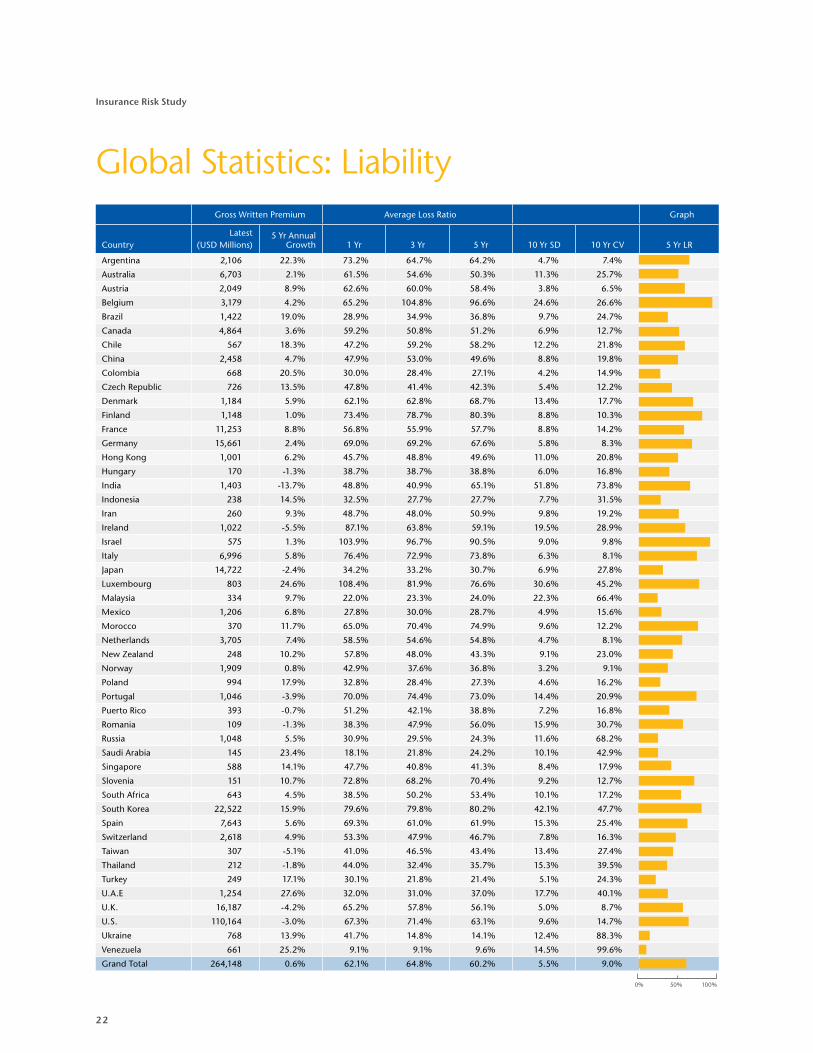
With rates continuing to soften and investment yields depressed, insurers are under intense pressure to expand their top lines. The next several pages present a summary of global insurance markets: the size of each market by premium, premium relative to GDP (insurance penetration ratio), loss ratios and volatility of loss ratios. We have segmented premium into motor, property and liability lines for the top 50 markets.
Global Market Review
Motor: USD532B
Property: USD381B
Liability: USD268B
Note: Ranks are based on total P&C Written Premium
Notes: Numbers presented are the latest available. “Motor” includes all motor insurance coverages. “Property” includes construction, engineering, marine, aviation and transit insurance as well as property. “Liability” includes general liability, workers compensation, surety, bonds, credit and miscellaneous coverages.
20
Insurance Risk Study
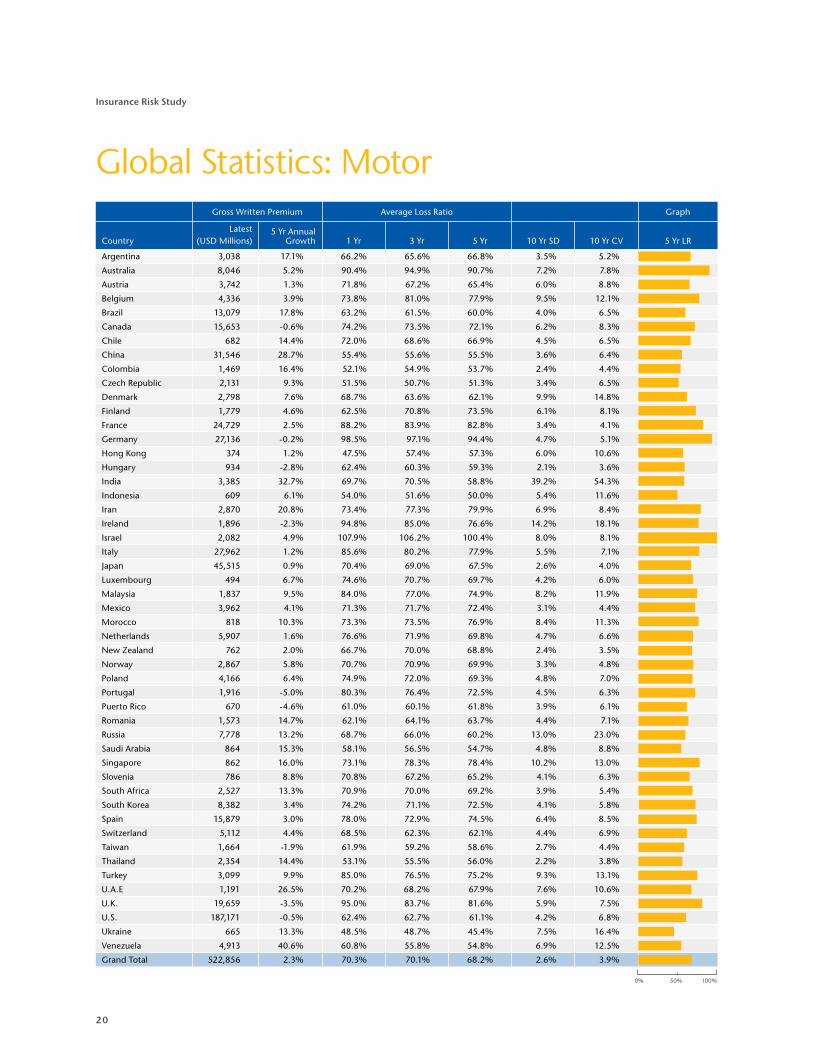
Global Statistics: MotorGross Written Premium Average Loss Ratio Graph
CountryLatest
(USD Millions)5 Yr Annual
Growth 1 Yr 3 Yr 5 Yr 10 Yr SD 10 Yr CV 5 Yr LR
Argentina 3,038 17.1% 66.2% 65.6% 66.8% 3.5% 5.2%
Australia 8,046 5.2% 90.4% 94.9% 90.7% 7.2% 7.8%
Austria 3,742 1.3% 71.8% 67.2% 65.4% 6.0% 8.8%
Belgium 4,336 3.9% 73.8% 81.0% 77.9% 9.5% 12.1%
Brazil 13,079 17.8% 63.2% 61.5% 60.0% 4.0% 6.5%
Canada 15,653 -0.6% 74.2% 73.5% 72.1% 6.2% 8.3%
Chile 682 14.4% 72.0% 68.6% 66.9% 4.5% 6.5%
China 31,546 28.7% 55.4% 55.6% 55.5% 3.6% 6.4%
Colombia 1,469 16.4% 52.1% 54.9% 53.7% 2.4% 4.4%
Czech Republic 2,131 9.3% 51.5% 50.7% 51.3% 3.4% 6.5%
Denmark 2,798 7.6% 68.7% 63.6% 62.1% 9.9% 14.8%
Finland 1,779 4.6% 62.5% 70.8% 73.5% 6.1% 8.1%
France 24,729 2.5% 88.2% 83.9% 82.8% 3.4% 4.1%
Germany 27,136 -0.2% 98.5% 97.1% 94.4% 4.7% 5.1%
Hong Kong 374 1.2% 47.5% 57.4% 57.3% 6.0% 10.6%
Hungary 934 -2.8% 62.4% 60.3% 59.3% 2.1% 3.6%
India 3,385 32.7% 69.7% 70.5% 58.8% 39.2% 54.3%
Indonesia 609 6.1% 54.0% 51.6% 50.0% 5.4% 11.6%
Iran 2,870 20.8% 73.4% 77.3% 79.9% 6.9% 8.4%
Ireland 1,896 -2.3% 94.8% 85.0% 76.6% 14.2% 18.1%
Israel 2,082 4.9% 107.9% 106.2% 100.4% 8.0% 8.1%
Italy 27,962 1.2% 85.6% 80.2% 77.9% 5.5% 7.1%
Japan 45,515 0.9% 70.4% 69.0% 67.5% 2.6% 4.0%
Luxembourg 494 6.7% 74.6% 70.7% 69.7% 4.2% 6.0%
Malaysia 1,837 9.5% 84.0% 77.0% 74.9% 8.2% 11.9%
Mexico 3,962 4.1% 71.3% 71.7% 72.4% 3.1% 4.4%
Morocco 818 10.3% 73.3% 73.5% 76.9% 8.4% 11.3%
Netherlands 5,907 1.6% 76.6% 71.9% 69.8% 4.7% 6.6%
New Zealand 762 2.0% 66.7% 70.0% 68.8% 2.4% 3.5%
Norway 2,867 5.8% 70.7% 70.9% 69.9% 3.3% 4.8%
Poland 4,166 6.4% 74.9% 72.0% 69.3% 4.8% 7.0%
Portugal 1,916 -5.0% 80.3% 76.4% 72.5% 4.5% 6.3%
Puerto Rico 670 -4.6% 61.0% 60.1% 61.8% 3.9% 6.1%
Romania 1,573 14.7% 62.1% 64.1% 63.7% 4.4% 7.1%
Russia 7,778 13.2% 68.7% 66.0% 60.2% 13.0% 23.0%
Saudi Arabia 864 15.3% 58.1% 56.5% 54.7% 4.8% 8.8%
Singapore 862 16.0% 73.1% 78.3% 78.4% 10.2% 13.0%
Slovenia 786 8.8% 70.8% 67.2% 65.2% 4.1% 6.3%
South Africa 2,527 13.3% 70.9% 70.0% 69.2% 3.9% 5.4%
South Korea 8,382 3.4% 74.2% 71.1% 72.5% 4.1% 5.8%
Spain 15,879 3.0% 78.0% 72.9% 74.5% 6.4% 8.5%
Switzerland 5,112 4.4% 68.5% 62.3% 62.1% 4.4% 6.9%
Taiwan 1,664 -1.9% 61.9% 59.2% 58.6% 2.7% 4.4%
Thailand 2,354 14.4% 53.1% 55.5% 56.0% 2.2% 3.8%
Turkey 3,099 9.9% 85.0% 76.5% 75.2% 9.3% 13.1%
U.A.E 1,191 26.5% 70.2% 68.2% 67.9% 7.6% 10.6%
U.K. 19,659 -3.5% 95.0% 83.7% 81.6% 5.9% 7.5%
U.S. 187,171 -0.5% 62.4% 62.7% 61.1% 4.2% 6.8%
Ukraine 665 13.3% 48.5% 48.7% 45.4% 7.5% 16.4%
Venezuela 4,913 40.6% 60.8% 55.8% 54.8% 6.9% 12.5%
Grand Total 522,856 2.3% 70.3% 70.1% 68.2% 2.6% 3.9%
0% 50% 100%
21
Aon Benfield
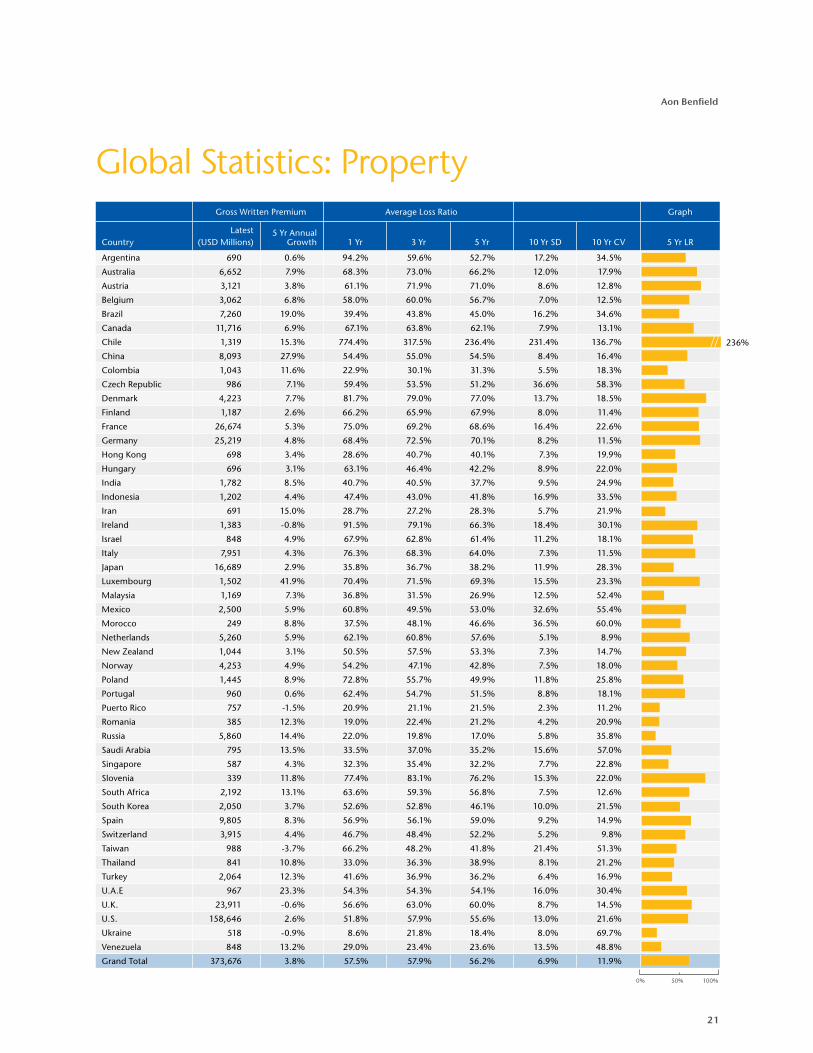
Gross Written Premium Average Loss Ratio Graph
CountryLatest
(USD Millions)5 Yr Annual
Growth 1 Yr 3 Yr 5 Yr 10 Yr SD 10 Yr CV 5 Yr LR
Argentina 690 0.6% 94.2% 59.6% 52.7% 17.2% 34.5%
Australia 6,652 7.9% 68.3% 73.0% 66.2% 12.0% 17.9%
Austria 3,121 3.8% 61.1% 71.9% 71.0% 8.6% 12.8%
Belgium 3,062 6.8% 58.0% 60.0% 56.7% 7.0% 12.5%
Brazil 7,260 19.0% 39.4% 43.8% 45.0% 16.2% 34.6%
Canada 11,716 6.9% 67.1% 63.8% 62.1% 7.9% 13.1%
Chile 1,319 15.3% 774.4% 317.5% 236.4% 231.4% 136.7%
China 8,093 27.9% 54.4% 55.0% 54.5% 8.4% 16.4%
Colombia 1,043 11.6% 22.9% 30.1% 31.3% 5.5% 18.3%
Czech Republic 986 7.1% 59.4% 53.5% 51.2% 36.6% 58.3%
Denmark 4,223 7.7% 81.7% 79.0% 77.0% 13.7% 18.5%
Finland 1,187 2.6% 66.2% 65.9% 67.9% 8.0% 11.4%
France 26,674 5.3% 75.0% 69.2% 68.6% 16.4% 22.6%
Germany 25,219 4.8% 68.4% 72.5% 70.1% 8.2% 11.5%
Hong Kong 698 3.4% 28.6% 40.7% 40.1% 7.3% 19.9%
Hungary 696 3.1% 63.1% 46.4% 42.2% 8.9% 22.0%
India 1,782 8.5% 40.7% 40.5% 37.7% 9.5% 24.9%
Indonesia 1,202 4.4% 47.4% 43.0% 41.8% 16.9% 33.5%
Iran 691 15.0% 28.7% 27.2% 28.3% 5.7% 21.9%
Ireland 1,383 -0.8% 91.5% 79.1% 66.3% 18.4% 30.1%
Israel 848 4.9% 67.9% 62.8% 61.4% 11.2% 18.1%
Italy 7,951 4.3% 76.3% 68.3% 64.0% 7.3% 11.5%
Japan 16,689 2.9% 35.8% 36.7% 38.2% 11.9% 28.3%
Luxembourg 1,502 41.9% 70.4% 71.5% 69.3% 15.5% 23.3%
Malaysia 1,169 7.3% 36.8% 31.5% 26.9% 12.5% 52.4%
Mexico 2,500 5.9% 60.8% 49.5% 53.0% 32.6% 55.4%
Morocco 249 8.8% 37.5% 48.1% 46.6% 36.5% 60.0%
Netherlands 5,260 5.9% 62.1% 60.8% 57.6% 5.1% 8.9%
New Zealand 1,044 3.1% 50.5% 57.5% 53.3% 7.3% 14.7%
Norway 4,253 4.9% 54.2% 47.1% 42.8% 7.5% 18.0%
Poland 1,445 8.9% 72.8% 55.7% 49.9% 11.8% 25.8%
Portugal 960 0.6% 62.4% 54.7% 51.5% 8.8% 18.1%
Puerto Rico 757 -1.5% 20.9% 21.1% 21.5% 2.3% 11.2%
Romania 385 12.3% 19.0% 22.4% 21.2% 4.2% 20.9%
Russia 5,860 14.4% 22.0% 19.8% 17.0% 5.8% 35.8%
Saudi Arabia 795 13.5% 33.5% 37.0% 35.2% 15.6% 57.0%
Singapore 587 4.3% 32.3% 35.4% 32.2% 7.7% 22.8%
Slovenia 339 11.8% 77.4% 83.1% 76.2% 15.3% 22.0%
South Africa 2,192 13.1% 63.6% 59.3% 56.8% 7.5% 12.6%
South Korea 2,050 3.7% 52.6% 52.8% 46.1% 10.0% 21.5%
Spain 9,805 8.3% 56.9% 56.1% 59.0% 9.2% 14.9%
Switzerland 3,915 4.4% 46.7% 48.4% 52.2% 5.2% 9.8%
Taiwan 988 -3.7% 66.2% 48.2% 41.8% 21.4% 51.3%
Thailand 841 10.8% 33.0% 36.3% 38.9% 8.1% 21.2%
Turkey 2,064 12.3% 41.6% 36.9% 36.2% 6.4% 16.9%
U.A.E 967 23.3% 54.3% 54.3% 54.1% 16.0% 30.4%
U.K. 23,911 -0.6% 56.6% 63.0% 60.0% 8.7% 14.5%
U.S. 158,646 2.6% 51.8% 57.9% 55.6% 13.0% 21.6%
Ukraine 518 -0.9% 8.6% 21.8% 18.4% 8.0% 69.7%
Venezuela 848 13.2% 29.0% 23.4% 23.6% 13.5% 48.8%
Grand Total 373,676 3.8% 57.5% 57.9% 56.2% 6.9% 11.9%
Global Statistics: Property
236%
0% 50% 100%
22
Insurance Risk Study
Gross Written Premium Average Loss Ratio Graph
CountryLatest
(USD Millions)5 Yr Annual
Growth 1 Yr 3 Yr 5 Yr 10 Yr SD 10 Yr CV 5 Yr LR
Argentina 2,106 22.3% 73.2% 64.7% 64.2% 4.7% 7.4%
Australia 6,703 2.1% 61.5% 54.6% 50.3% 11.3% 25.7%
Austria 2,049 8.9% 62.6% 60.0% 58.4% 3.8% 6.5%
Belgium 3,179 4.2% 65.2% 104.8% 96.6% 24.6% 26.6%
Brazil 1,422 19.0% 28.9% 34.9% 36.8% 9.7% 24.7%
Canada 4,864 3.6% 59.2% 50.8% 51.2% 6.9% 12.7%
Chile 567 18.3% 47.2% 59.2% 58.2% 12.2% 21.8%
China 2,458 4.7% 47.9% 53.0% 49.6% 8.8% 19.8%
Colombia 668 20.5% 30.0% 28.4% 27.1% 4.2% 14.9%
Czech Republic 726 13.5% 47.8% 41.4% 42.3% 5.4% 12.2%
Denmark 1,184 5.9% 62.1% 62.8% 68.7% 13.4% 17.7%
Finland 1,148 1.0% 73.4% 78.7% 80.3% 8.8% 10.3%
France 11,253 8.8% 56.8% 55.9% 57.7% 8.8% 14.2%
Germany 15,661 2.4% 69.0% 69.2% 67.6% 5.8% 8.3%
Hong Kong 1,001 6.2% 45.7% 48.8% 49.6% 11.0% 20.8%
Hungary 170 -1.3% 38.7% 38.7% 38.8% 6.0% 16.8%
India 1,403 -13.7% 48.8% 40.9% 65.1% 51.8% 73.8%
Indonesia 238 14.5% 32.5% 27.7% 27.7% 7.7% 31.5%
Iran 260 9.3% 48.7% 48.0% 50.9% 9.8% 19.2%
Ireland 1,022 -5.5% 87.1% 63.8% 59.1% 19.5% 28.9%
Israel 575 1.3% 103.9% 96.7% 90.5% 9.0% 9.8%
Italy 6,996 5.8% 76.4% 72.9% 73.8% 6.3% 8.1%
Japan 14,722 -2.4% 34.2% 33.2% 30.7% 6.9% 27.8%
Luxembourg 803 24.6% 108.4% 81.9% 76.6% 30.6% 45.2%
Malaysia 334 9.7% 22.0% 23.3% 24.0% 22.3% 66.4%
Mexico 1,206 6.8% 27.8% 30.0% 28.7% 4.9% 15.6%
Morocco 370 11.7% 65.0% 70.4% 74.9% 9.6% 12.2%
Netherlands 3,705 7.4% 58.5% 54.6% 54.8% 4.7% 8.1%
New Zealand 248 10.2% 57.8% 48.0% 43.3% 9.1% 23.0%
Norway 1,909 0.8% 42.9% 37.6% 36.8% 3.2% 9.1%
Poland 994 17.9% 32.8% 28.4% 27.3% 4.6% 16.2%
Portugal 1,046 -3.9% 70.0% 74.4% 73.0% 14.4% 20.9%
Puerto Rico 393 -0.7% 51.2% 42.1% 38.8% 7.2% 16.8%
Romania 109 -1.3% 38.3% 47.9% 56.0% 15.9% 30.7%
Russia 1,048 5.5% 30.9% 29.5% 24.3% 11.6% 68.2%
Saudi Arabia 145 23.4% 18.1% 21.8% 24.2% 10.1% 42.9%
Singapore 588 14.1% 47.7% 40.8% 41.3% 8.4% 17.9%
Slovenia 151 10.7% 72.8% 68.2% 70.4% 9.2% 12.7%
South Africa 643 4.5% 38.5% 50.2% 53.4% 10.1% 17.2%
South Korea 22,522 15.9% 79.6% 79.8% 80.2% 42.1% 47.7%
Spain 7,643 5.6% 69.3% 61.0% 61.9% 15.3% 25.4%
Switzerland 2,618 4.9% 53.3% 47.9% 46.7% 7.8% 16.3%
Taiwan 307 -5.1% 41.0% 46.5% 43.4% 13.4% 27.4%
Thailand 212 -1.8% 44.0% 32.4% 35.7% 15.3% 39.5%
Turkey 249 17.1% 30.1% 21.8% 21.4% 5.1% 24.3%
U.A.E 1,254 27.6% 32.0% 31.0% 37.0% 17.7% 40.1%
U.K. 16,187 -4.2% 65.2% 57.8% 56.1% 5.0% 8.7%
U.S. 110,164 -3.0% 67.3% 71.4% 63.1% 9.6% 14.7%
Ukraine 768 13.9% 41.7% 14.8% 14.1% 12.4% 88.3%
Venezuela 661 25.2% 9.1% 9.1% 9.6% 14.5% 99.6%
Grand Total 264,148 0.6% 62.1% 64.8% 60.2% 5.5% 9.0%
Global Statistics: Liability
0% 50% 100%
23
Aon Benfield
Afterword: The Good RiskA central character in 1990’s underwriter folklore was the “good risk”. The good risk had many archetypal characteristics in the underwriter’s mind. It had low frequency. It had higher than average persistency. It may have been part of an account that could be rounded out with products from the underwriter’s carrier. It did not have severity potential. Nor was it correlated with other risks through geographic proximity or economic ties. In short, the good risk had characteristics associated, in the conventional wisdom, with long-term profitability. It stood to reason, therefore, that it was worth competing for the good risk. Underwriters competed on price and coverage to win a good risk. And this led to a paradox of insurance: the unprofitable “good risk”.
Since the trough of the last soft market in 1999 – 2000, when unprofitable good risks were common, we have learned a lot about pricing and risk management and have greatly reduced the prevalence of unprofitable good risks. Predictive modeling, in particular, has driven a disciplined approach to underwriting in personal and small commercial lines. But the real lesson of unprofitable good risks is that it is impossible to define a good risk without discussing price. There is a price at which any risk can become a good risk: not necessarily a sellable price, but at least a technical price. Underwriters must know this technical price. It turns out there are also a number of risk management parallels to the unprofitable good risk today.
Defining Risk ToleranceRisk tolerance is a central concept in risk management and something discussed in every presentation on Enterprise Risk Management (ERM). The folklore of risk tolerance is similar to that of the good risk. Tolerances need to be defined. They must be “drilled down” to provide granular guidelines at every level of the organization. Risks must be identified and measured; exposures monitored a nd managed relative to detailed tolerances.
Tolerances are generally set from a tail-centric, solvency perspective: “What is the largest risk I want on the balance sheet that is consistent with the promises I have made to stakeholders — especially to other policyholders?” A risk tolerance is a wall around the balance sheet. Rating agencies and regulators are
rightfully concerned with the position, height and integrity of this wall. But is the risk tolerance wall a good risk management concept for a going concern insurer?
Very often risk tolerance is expressed solely in terms of limits: the organization has a tolerance to lose up to one quarter’s income in a single catastrophe event, for example. But what if the price of catastrophe risk doubled, or tripled? Or if the cost to reinsure cat risk doubled or halved? Does the tolerance stay the same? Do underwriting actions stay the same?
Having defined a risk tolerance in terms of tail risk, management turns to optimization to maximize return for a given tolerance. Economics tells us to compare marginal revenue with marginal cost. For insurance the revenue side of the equation is easy; most companies are price takers and their underwriters have a good idea of the market price available for a given risk. Marginal cost is more difficult. For catastrophe risk, cost of capital becomes a material part of total costs, and is where the difficulties begin. A tail-centric risk tolerance, driven by the 100 or 250 year PML, for example, simply does not “see” smaller risks; they have no impact on the PML. As a result they are not allocated any capital in a marginal approach. At Aon Benfield we have seen two important examples of how this drives real behavior in the industry: global reinsurance pricing and U.S. severe weather pricing.
A feature of global reinsurance pricing is that, for a given probability of attachment and expected loss, it is far more expensive to lay off U.S. wind exposure — the global peak exposure — than it is for Australian or Japanese risks. This feature is a direct result of using a marginal capital allocation approach and a tail-driven capital measure. Reinsurers must use tail-driven capital measures because one of their key constraints is the rating agency catastrophe risk charge, and this is expressed in terms of PMLs. A tail driven capital measure will tend not to allocate much capital to an Australian or Japanese risk. The risks are seen as diversifying, attract a low marginal capital allocation and are written much more cheaply, per unit of volatility transferred, than U.S. risks. Market pricing follows these predictions.
24
Insurance Risk Study
It remains to be seen whether there is any rebalancing in risk loads as a result of the recent international catastrophe risk experience. In part, the fact that U.S. pricing for Aon Benfield clients decreased on average for the June and July 2011 renewals validates the theory: reinsurers did not allocate more capital to the U.S. but they did for the rest of the world.
The second real-world validation comes from our experience building Cat ScoreTM, our proprietary policy-level cat risk pricing tool. Cat Score calculates three components for a cat risk premium: the average annual loss, the cost of reinsurance and an internal cost of capital to support net risk. The average annual loss component is a characteristic of each individual risk and is independent of the company writing the risk. It is generally obtained from a catastrophe risk model.
The other two components are much more interesting. To understand an appropriate allocation of cost of reinsurance, we ran numerous regressions on the full Aon Benfield database of reinsurance contracts. We found that reinsurer risk margins in the U.S. were best predicted by looking at a combination of the volatility of risk transferred and the correlation of that risk with the aggregate U.S. portfolio. There is a cost for ceding risk, but consistent with the marginal tail capital global reinsurance pricing model, it is more expensive in areas that impact reinsurer tail capital measures the most: Florida costs more than the Gulf or Northeast, which in turn cost more than the smaller exposures in the mid-Atlantic. Reinsurers may not individually price using this algorithm, but it fits their collective behavior well.
Our approach to the internal cost of capital to support net risk initially followed the marginal tail risk approach. The result did not allocate capital to smaller exposures, such as Midwest severe weather perils in books with hurricane exposure. This result does not agree with how risk is perceived. Market pricing charges all risks some load, even if the risk had no impact on marginal tail risk. We found that a volatility (standard deviation) driven approach, accounting for correlations within each client book, most closely matched realistic market pricing.
There are two lessons to draw from these experiences. First, reinsurers’ more modern tail-centric methods have not necessarily driven optimal portfolios, and are being re-thought in the light of 2011 catastrophe experience. And second, volatility has a cost regardless of whether it impacts a tail risk measure.1
What do these observations mean for defining a risk tolerance?
Valuation MaximizationJust as the unprofitable good risk ignored pricing, tail risk tolerances ignore volatility and profitability. If risk tolerance is a protective wall around the balance sheet, then we need a gate keeper to weigh each potential policy’s impact on profitability and risk and to decide whether or not it should be placed on the balance sheet. The gate keeper represents risk appetite. Just as pricing adds a new dimension to defining a “good risk”, so risk appetite adds a quantification of the value of writing a risk.
What do investors say about risk in their pricing of insurance company stocks? We have reported on our price-to-book regression study before in this Study. The latest, international, iteration is illustrated on the next page.
1 There are situations where the tail-centric approach is appropriate. One is evaluation of mainframe catastrophe risk programs. These corporate-wideprograms are generally driven by ratings agency or regulator aggregate portfolio tail PML measures and comparing the marginal capital benefit of such a program to its cost is a good decision framework that will lead to appropriate conclusions.
25
Aon Benfield
Price to Book, Prospective ROE Link
No Hit
+1 Hit
Pric
e to
Boo
k Ra
tio
Prospective 2011 ROE
0
0.50
1.00
1.50
2.00
2.50
3.00
3.50
4.00
0.0% 5.0% 10.0% 15.0% 20.0% 25.0% 30.0%
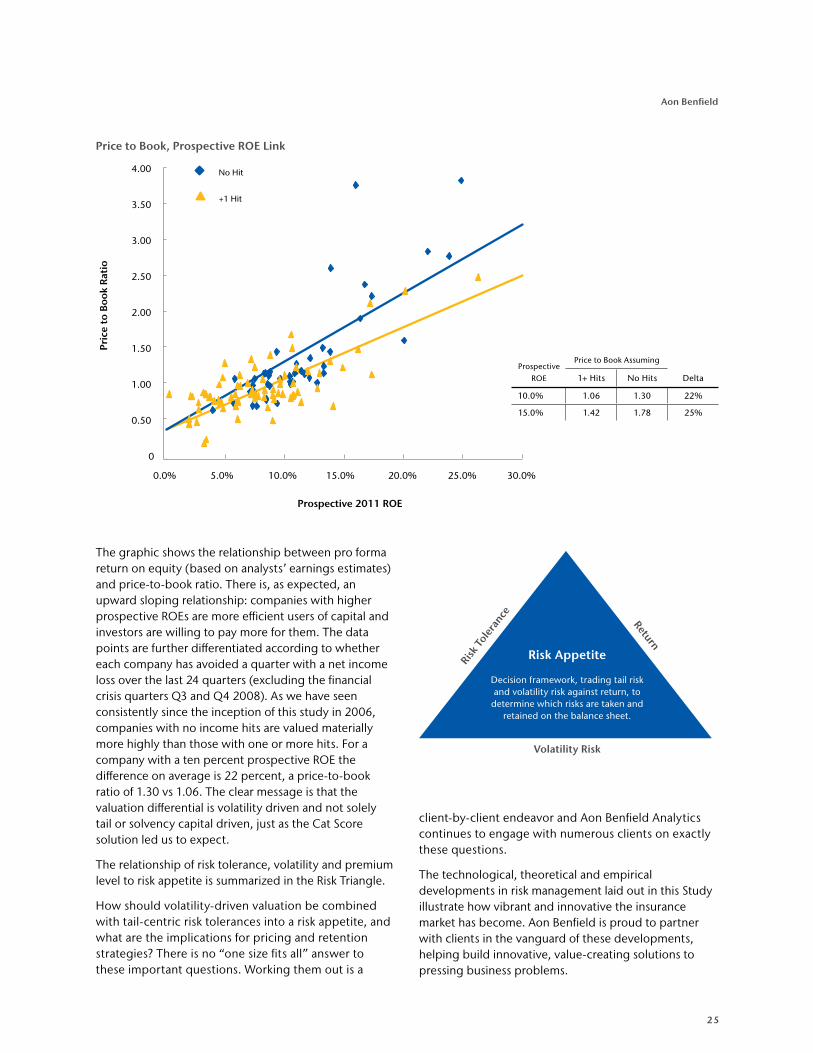
The graphic shows the relationship between pro forma return on equity (based on analysts’ earnings estimates) and price-to-book ratio. There is, as expected, an upward sloping relationship: companies with higher prospective ROEs are more efficient users of capital and investors are willing to pay more for them. The data points are further differentiated according to whether each company has avoided a quarter with a net income loss over the last 24 quarters (excluding the financial crisis quarters Q3 and Q4 2008). As we have seen consistently since the inception of this study in 2006, companies with no income hits are valued materially more highly than those with one or more hits. For a company with a ten percent prospective ROE the difference on average is 22 percent, a price-to-book ratio of 1.30 vs 1.06. The clear message is that the valuation differential is volatility driven and not solely tail or solvency capital driven, just as the Cat Score solution led us to expect.
The relationship of risk tolerance, volatility and premium level to risk appetite is summarized in the Risk Triangle.
How should volatility-driven valuation be combined with tail-centric risk tolerances into a risk appetite, and what are the implications for pricing and retention strategies? There is no “one size fits all” answer to these important questions. Working them out is a
client-by-client endeavor and Aon Benfield Analytics continues to engage with numerous clients on exactly these questions.
The technological, theoretical and empirical developments in risk management laid out in this Study illustrate how vibrant and innovative the insurance market has become. Aon Benfield is proud to partner with clients in the vanguard of these developments, helping build innovative, value-creating solutions to pressing business problems.
Risk Appetite
Decision framework, trading tail risk and volatility risk against return, to
determine which risks are taken and retained on the balance sheet.
Risk
Tole
rance Return
Volatility Risk
Prospective
ROE
Price to Book Assuming
1+ Hits No Hits Delta
10.0% 1.06 1.30 22%
15.0% 1.42 1.78 25%
26
Insurance Risk Study
Sources: A.M. Best, ANIA (Italy), Association of Vietnam Insurers, Axco Insurance Information Services, BaFin (Germany), Banco Central del Uruguay, Bank Negara Malaysia, Bloomberg, Bureau of Economic Analysis (U.S.), Bureau of Labor Statistics (U.S.), CADOAR (Dominican Republic), Cámara de Aseguradores de Venezuela, Chicago Mercantile Exchange, Comisión Nacional de Seguros y Fianzas (Mexico), Comisióncional de Bancos y Seguros de Honduras, Danish FSA, Dirección General de Seguros (Spain), DNB (Denmark), E&Y Annual Statements (Israel), Finma (Switzerland), FMA (Austria), FSA Returns (U.K.), “Handbook on Indian Insurance Statistics” (ed. IDRA), HKOCI (Hong Kong), http://www.bapepam.go.id/perasuransian/index.htm (Indonesia), ICA (Australia), The Insurance Association of Pakistan, ISO PCS, Korea Financial Supervisory Service, Monetary Authority of Singapore, MSA Research Inc. (Canada), Quest Data Report (South Africa), Romanian Insurance Asociation, SNL (U.S.), Standard & Poor’s, “The Statistics of Japanese Non-Life Insurance Business” (ed. Insurance Research Institute), Superintendencia de Banca y Seguros (Peru), Superintendencia de Bancos y Otras Instituciones Financieras de Nicaragua, Superintendencia de Bancos y Seguros (Ecuador), Superintendencia de Pensiones de El Salvador, Superintendencia de Pensiones, Valores y Seguros (Bolivia), Superintendencia de Seguros de la Nación (Argentina), Superintendencia de Seguros Privados (Brazil), Superintendencia de Seguros y Reaseguros de Panama, Superintendencia de Valores y Seguros de Chile, Superintendencia Financiera de Colombia, Taiwan Insurance Institution, Turkish Insurance and Reinsurance Companies Association, Yahoo! Finance, Yearbooks of China’s Insurance, and annual financial statements.
About Aon BenfieldAon Benfield, a division of Aon Corporation (NYSE: AON), is the world’s leading reinsurance intermediary and full-service
capital advisor. We empower our clients to better understand, manage and transfer risk through innovative solutions and
personalized access to all forms of global reinsurance capital across treaty, facultative and capital markets. As a trusted
advocate, we deliver local reach to the world’s markets, an unparalleled investment in innovative analytics, including
catastrophe management, actuarial and rating agency advisory. Through our professionals’ expertise and experience, we
advise clients in making optimal capital choices that will empower results and improve operational effectiveness for their
business. With more than 80 offices in 50 countries, our worldwide client base has access to the broadest portfolio of
integrated capital solutions and services. To learn how Aon Benfield helps empower results, please visit aonbenfield.com.
Reserve Study Disclosure: Section 17(b) of the Securities Act of 1933 requires that any person that publishes a description of a security for a consideration must disclose the character and amount of the consideration. Aon Benfield has received from American International Group, Inc. or its affiliates a consulting fee for various services, of which USD1.0 million is attributable to the U.S. P&C Industry Statutory Reserve Study.
A copy of the Reserve Study can be found at: http://www.aon.com/attachments/reinsurance/201106_analytics_reserve_adequacy_study.pdf
© 2011 Aon Benfield. This document is intended for general information purposes only and should not be construed as advice or opinions on any specific facts or circumstances. The comments in this summary are based upon Aon Benfield’s preliminary analysis of publicly available information. The content of this document is made available on an “as is” basis, without warranty of any kind. Aon Benfield disclaims any legal liability to any person or organization for loss or damage caused by or resulting from any reliance placed on that content. Aon Benfield reserves all rights to the content of this document.
Scan here to access all editions of the Insurance Risk Study.

27
Aon Benfield
Stephen MildenhallChief Executive Officer, Aon Benfield Analytics+1 312 381 [email protected]
Parr SchoolmanRisk & Capital Strategy+1 312 381 [email protected]
Michael McClaneReMetrica U.S.+1 215 751 [email protected]
John MooreHead of Analytics, International+44 (0) 20 7522 [email protected]
Paul MaitlandReMetrica, International +44 (0) 20 7522 [email protected]
For more information on the Insurance Risk Study, ReMetrica®, or our analytic capabilities, please contact your local Aon Benfield broker or:
Americas
Brian Alvers+1 312 381 [email protected]
EMEA & U.K.
Marc Beckers+ 44 (0) 20 7086 [email protected]
Paul Kaye+44 (0) 20 7522 [email protected]
Global Agricultural Practice
Avery Cook+1 312 381 [email protected]
Asia Pacific
Will Gardner+61 2 9650 [email protected]
David Maneval+65 6239 [email protected]
George Attard+65 6239 [email protected]
Annuity Solutions Group
Peter Phillips+1 416 598 [email protected]

200 E Randolph Street Chicago Illinois 60601 t: +1 312 381 5300 | f: +1 312 381 0160 | aonbenfield.com
Copyright Aon Benfield Inc 2011 | #7089 - 08/2011