Insurance Report 2012 - ahli.comahli.com/sites/default/files/Jordanian Insurance Sector Report...
37
Jordanian Insurance Sector Report
-
Upload
nguyendieu -
Category
Documents
-
view
214 -
download
0
Transcript of Insurance Report 2012 - ahli.comahli.com/sites/default/files/Jordanian Insurance Sector Report...

Jordanian Insurance Sector Report

مجموعة االهلي لألسواق املالية واإلستثماراتAhli Capital Markets & Investments Group
Research & Studies Department Corporate Finance DepartmentE-mail: [email protected]: [email protected]
Dislcosure: Please Refer to the important disclaimer at the back of this report Issue Date
Insurance Sectorial Report
2Mar. 2013
Topic Pages
About the Report 3
About the Sector 4
Main Financial Indicators - As of June 2012 5
Sector Financial Statements 9
Underwriting P&L Account 12
Sector Main Statistics 22
Sector Glossary 34
Table of Contents:
مجموعة االهلي لألسواق املالية واإلستثماراتAhli Capital Markets & Investments Group
Dislcosure: Please Refer to the important disclaimer at the back of this report Issue Date
مجموعة االهلي لألسواق املالية واإلستثماراتAhli Capital Markets & Investments Group
Dislcosure: Please Refer to the important disclaimer at the back of this report Issue Date3
Mar. 2013
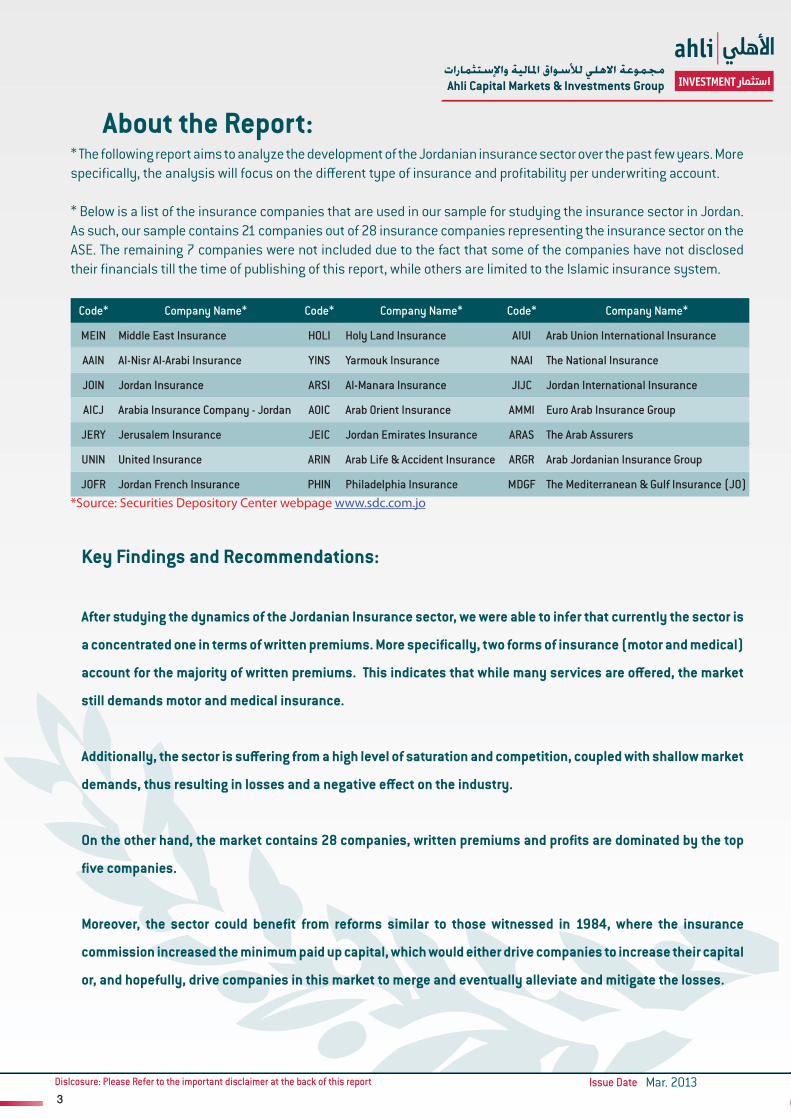
* The following report aims to analyze the development of the Jordanian insurance sector over the past few years. More specifically, the analysis will focus on the different type of insurance and profitability per underwriting account.
* Below is a list of the insurance companies that are used in our sample for studying the insurance sector in Jordan. As such, our sample contains 21 companies out of 28 insurance companies representing the insurance sector on the ASE. The remaining 7 companies were not included due to the fact that some of the companies have not disclosed their financials till the time of publishing of this report, while others are limited to the Islamic insurance system.
Code* Company Name* Code* Company Name* Code* Company Name*
MEIN Middle East Insurance HOLI Holy Land Insurance AIUI Arab Union International Insurance
AAIN Al-Nisr Al-Arabi Insurance YINS Yarmouk Insurance NAAI The National Insurance
JOIN Jordan Insurance ARSI Al-Manara Insurance JIJC Jordan International Insurance
AICJ Arabia Insurance Company - Jordan AOIC Arab Orient Insurance AMMI Euro Arab Insurance Group
JERY Jerusalem Insurance JEIC Jordan Emirates Insurance ARAS The Arab Assurers
UNIN United Insurance ARIN Arab Life & Accident Insurance ARGR Arab Jordanian Insurance Group
JOFR Jordan French Insurance PHIN Philadelphia Insurance MDGF The Mediterranean & Gulf Insurance (JO)*Source: Securities Depository Center webpage www.sdc.com.jo
About the Report:
Key Findings and Recommendations:
After studying the dynamics of the Jordanian Insurance sector, we were able to infer that currently the sector is
a concentrated one in terms of written premiums. More specifically, two forms of insurance (motor and medical)
account for the majority of written premiums. This indicates that while many services are offered, the market
still demands motor and medical insurance.
Additionally, the sector is suffering from a high level of saturation and competition, coupled with shallow market
demands, thus resulting in losses and a negative effect on the industry.
On the other hand, the market contains 28 companies, written premiums and profits are dominated by the top
five companies.
Moreover, the sector could benefit from reforms similar to those witnessed in 1984, where the insurance
commission increased the minimum paid up capital, which would either drive companies to increase their capital
or, and hopefully, drive companies in this market to merge and eventually alleviate and mitigate the losses.
مجموعة االهلي لألسواق املالية واإلستثماراتAhli Capital Markets & Investments Group
Research & Studies Department Corporate Finance DepartmentE-mail: [email protected]: [email protected]
Dislcosure: Please Refer to the important disclaimer at the back of this report Issue Date
Insurance Sectorial Report
4Mar. 2013
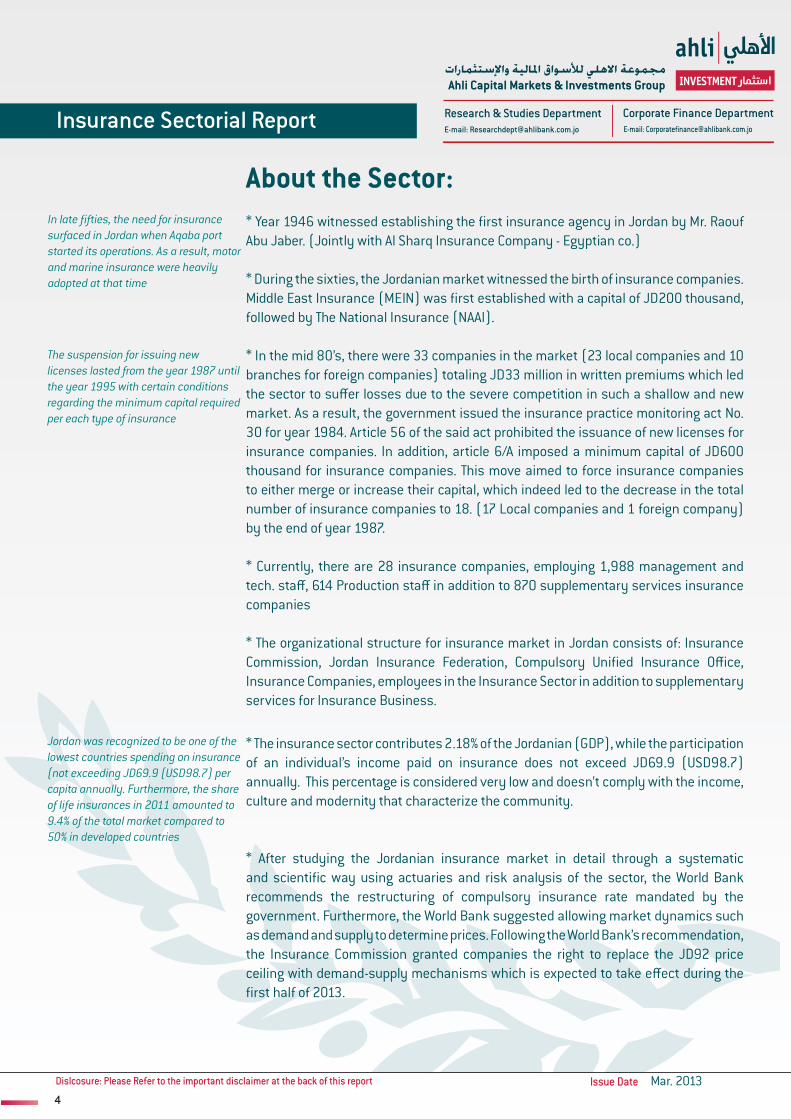
* Year 1946 witnessed establishing the first insurance agency in Jordan by Mr. Raouf Abu Jaber. (Jointly with Al Sharq Insurance Company - Egyptian co.)
* During the sixties, the Jordanian market witnessed the birth of insurance companies. Middle East Insurance (MEIN) was first established with a capital of JD200 thousand, followed by The National Insurance (NAAI).
* In the mid 80’s, there were 33 companies in the market (23 local companies and 10 branches for foreign companies) totaling JD33 million in written premiums which led the sector to suffer losses due to the severe competition in such a shallow and new market. As a result, the government issued the insurance practice monitoring act No. 30 for year 1984. Article 56 of the said act prohibited the issuance of new licenses for insurance companies. In addition, article 6/A imposed a minimum capital of JD600 thousand for insurance companies. This move aimed to force insurance companies to either merge or increase their capital, which indeed led to the decrease in the total number of insurance companies to 18. (17 Local companies and 1 foreign company) by the end of year 1987.
* Currently, there are 28 insurance companies, employing 1,988 management and tech. staff, 614 Production staff in addition to 870 supplementary services insurance companies
* The organizational structure for insurance market in Jordan consists of: Insurance Commission, Jordan Insurance Federation, Compulsory Unified Insurance Office, Insurance Companies, employees in the Insurance Sector in addition to supplementary services for Insurance Business.
* The insurance sector contributes 2.18% of the Jordanian (GDP), while the participation of an individual’s income paid on insurance does not exceed JD69.9 (USD98.7) annually. This percentage is considered very low and doesn’t comply with the income, culture and modernity that characterize the community.
* After studying the Jordanian insurance market in detail through a systematic and scientific way using actuaries and risk analysis of the sector, the World Bank recommends the restructuring of compulsory insurance rate mandated by the government. Furthermore, the World Bank suggested allowing market dynamics such as demand and supply to determine prices. Following the World Bank’s recommendation, the Insurance Commission granted companies the right to replace the JD92 price ceiling with demand-supply mechanisms which is expected to take effect during the first half of 2013.
In late fifties, the need for insurance surfaced in Jordan when Aqaba port started its operations. As a result, motor and marine insurance were heavily adopted at that time
About the Sector:
The suspension for issuing new licenses lasted from the year 1987 until the year 1995 with certain conditions regarding the minimum capital required per each type of insurance
Jordan was recognized to be one of the lowest countries spending on insurance (not exceeding JD69.9 (USD98.7) per capita annually. Furthermore, the share of life insurances in 2011 amounted to 9.4% of the total market compared to 50% in developed countries

مجموعة االهلي لألسواق املالية واإلستثماراتAhli Capital Markets & Investments Group
Dislcosure: Please Refer to the important disclaimer at the back of this report Issue Date
مجموعة االهلي لألسواق املالية واإلستثماراتAhli Capital Markets & Investments Group
Dislcosure: Please Refer to the important disclaimer at the back of this report Issue Date5
Mar. 2013
1- Total Assets:
2- Total Investments:
Main Financial Indicators: As of June 2012
Total Assets - in JD millions
460
480
500
520
540
560
580
2009 2010 2011 Q2-2012
Average Increase 4.46%
Total Assets have grown from JD498.43 million at the end of 2009 to reach JD568.07 million by the end of June 2012 with an average annual increase of 4.46%
Total Investments - in JD millions
322
324
326
328
330
332
334
336
338
2009 2010 2011 Q2-2012
Average decrease 0.85%
Due to the decreased tendency to invest by the insurance companies, the sector’s total investments reached JD327.3 million at the end of June 2012.
مجموعة االهلي لألسواق املالية واإلستثماراتAhli Capital Markets & Investments Group
Dislcosure: Please Refer to the important disclaimer at the back of this report Issue Date6
Mar. 2013
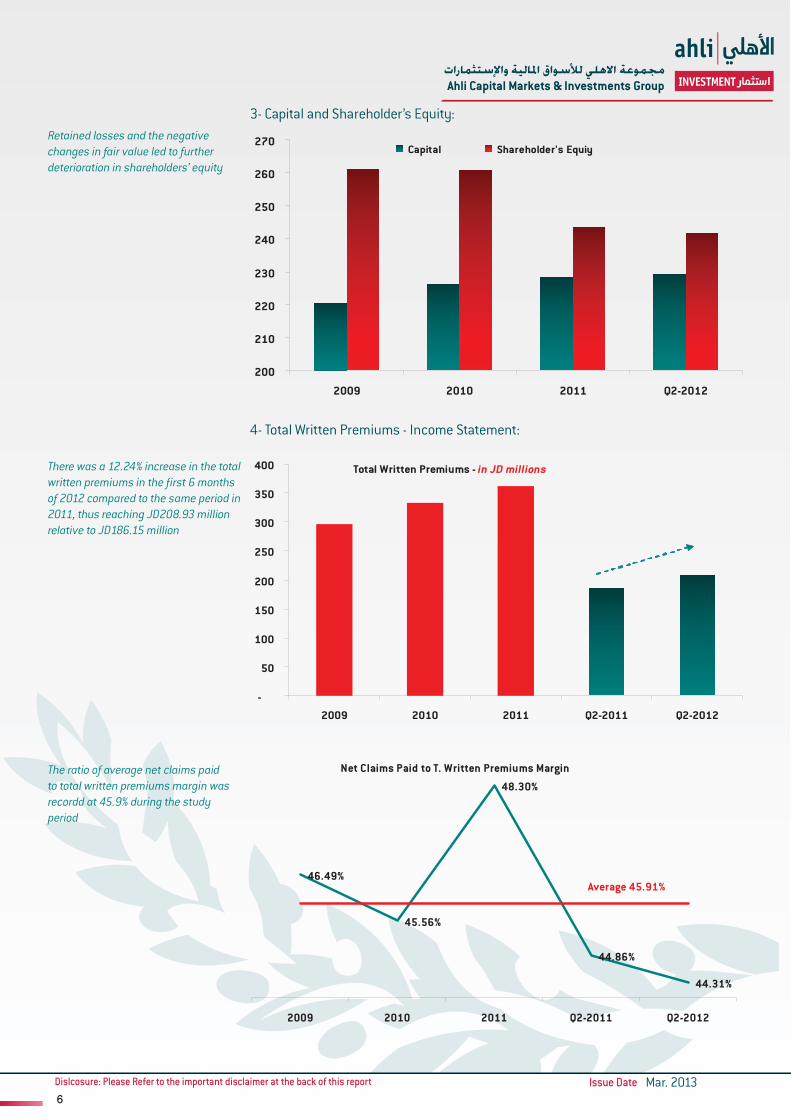
3- Capital and Shareholder’s Equity:
4- Total Written Premiums - Income Statement:
Retained losses and the negative changes in fair value led to further deterioration in shareholders’ equity
There was a 12.24% increase in the total written premiums in the first 6 months of 2012 compared to the same period in 2011, thus reaching JD208.93 million relative to JD186.15 million
The ratio of average net claims paid to total written premiums margin was recordd at 45.9% during the study period
200
210
220
230
240
250
260
270
2009 2010 2011 Q2-2012
Capital Shareholder's Equiy
Total Written Premiums - in JD millions
-
50
100
150
200
250
300
350
400
2009 2010 2011 Q2-2011 Q2-2012
Net Claims Paid to T. Written Premiums Margin
46.49%
45.56%
48.30%
44.86%
44.31%
2009 2010 2011 Q2-2011 Q2-2012
Average 45.91%
مجموعة االهلي لألسواق املالية واإلستثماراتAhli Capital Markets & Investments Group
Dislcosure: Please Refer to the important disclaimer at the back of this report Issue Date7
Mar. 2013
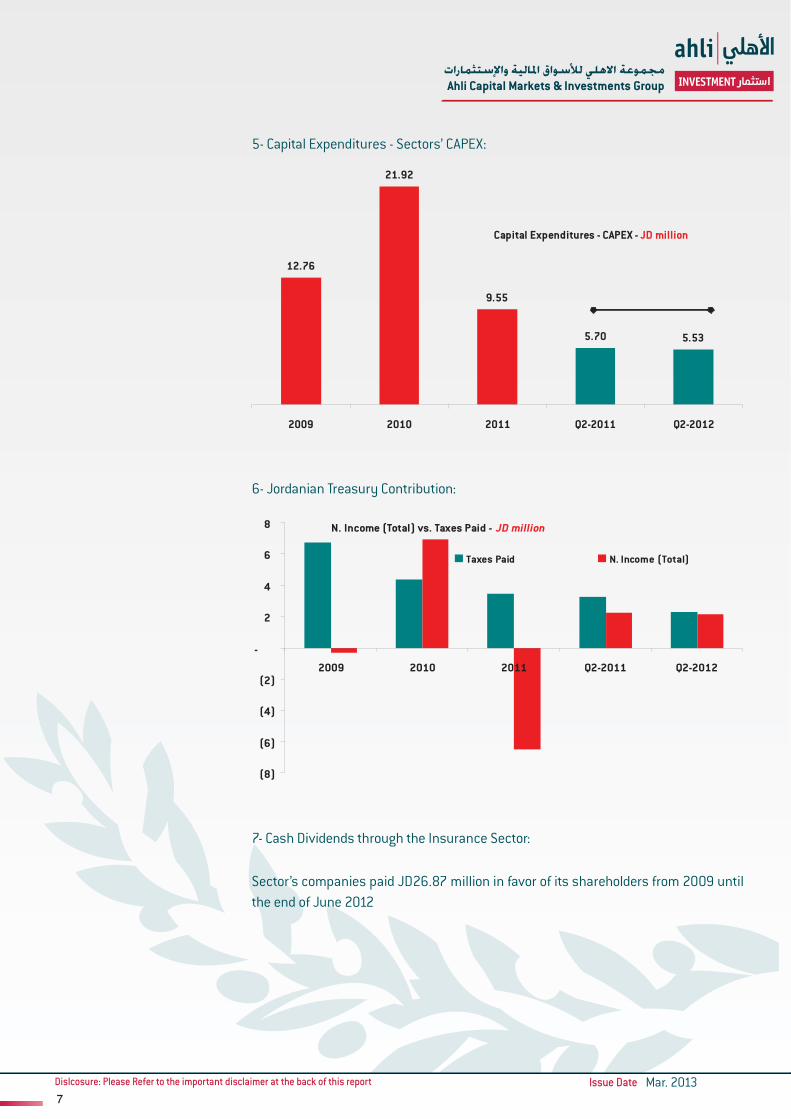
5- Capital Expenditures - Sectors’ CAPEX:
6- Jordanian Treasury Contribution:
7- Cash Dividends through the Insurance Sector:
Sector’s companies paid JD26.87 million in favor of its shareholders from 2009 until the end of June 2012
Capital Expenditures - CAPEX - JD million
12.76
21.92
9.55
5.70 5.53
2009 2010 2011 Q2-2011 Q2-2012
N. Income (Total) vs. Taxes Paid - JD million
(8)
(6)
(4)
(2)
-
2
4
6
8
2009 2010 2011 Q2-2011 Q2-2012
Taxes Paid N. Income (Total)

مجموعة االهلي لألسواق املالية واإلستثماراتAhli Capital Markets & Investments Group
Dislcosure: Please Refer to the important disclaimer at the back of this report Issue Date8
Mar. 2013
40% is the average deposits ratio to total investments during 2009 till the end of June 2012
8- Deposits of the Insurance Sector:
Deposits at Banks - in JD millions
115
120
125
130
135
140
2009 2010 2011 Q2-2012
مجموعة االهلي لألسواق املالية واإلستثماراتAhli Capital Markets & Investments Group
Dislcosure: Please Refer to the important disclaimer at the back of this report Issue Date9
Mar. 2013
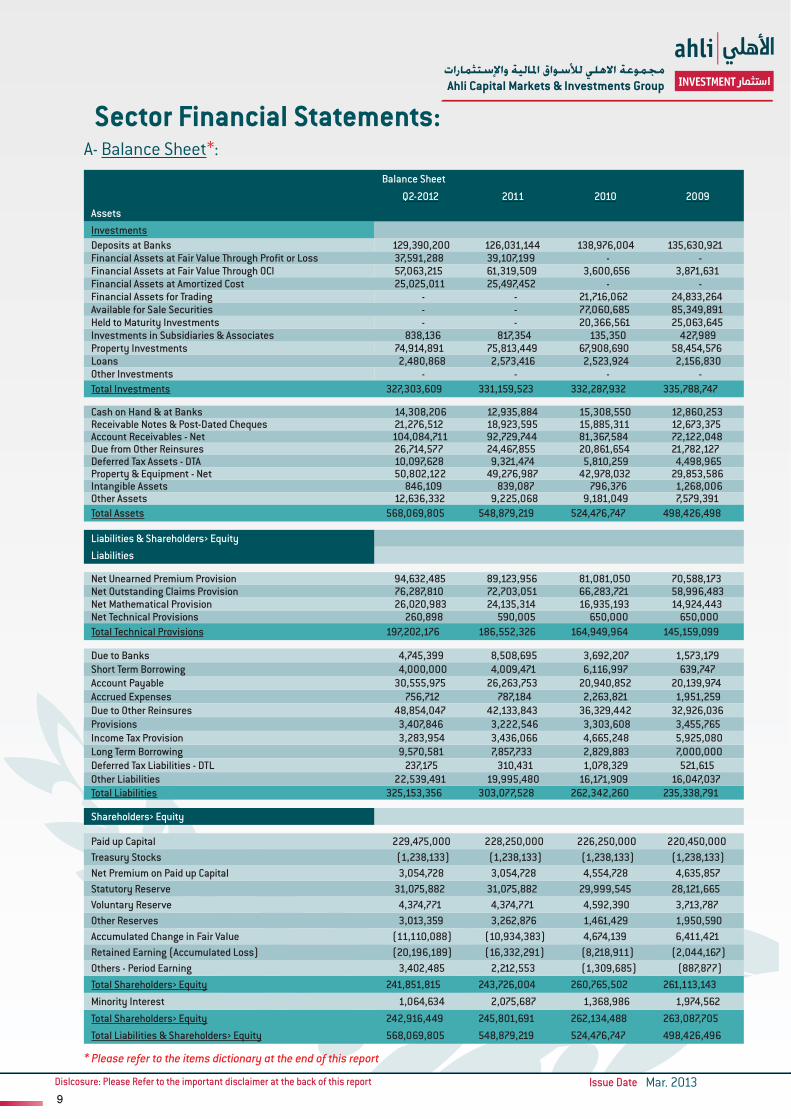
A- Balance Sheet*: Balance Sheet
Q2-2012 2011 2010 2009AssetsInvestmentsDeposits at Banks 129,390,200 126,031,144 138,976,004 135,630,921 Financial Assets at Fair Value Through Profit or Loss 37,591,288 39,107,199 - - Financial Assets at Fair Value Through OCI 57,063,215 61,319,509 3,600,656 3,871,631 Financial Assets at Amortized Cost 25,025,011 25,497,452 - - Financial Assets for Trading - - 21,716,062 24,833,264 Available for Sale Securities - - 77,060,685 85,349,891 Held to Maturity Investments - - 20,366,561 25,063,645 Investments in Subsidiaries & Associates 838,136 817,354 135,350 427,989 Property Investments 74,914,891 75,813,449 67,908,690 58,454,576 Loans 2,480,868 2,573,416 2,523,924 2,156,830 Other Investments - - - - Total Investments 327,303,609 331,159,523 332,287,932 335,788,747
Cash on Hand & at Banks 14,308,206 12,935,884 15,308,550 12,860,253 Receivable Notes & Post-Dated Cheques 21,276,512 18,923,595 15,885,311 12,673,375 Account Receivables - Net 104,084,711 92,729,744 81,367,584 72,122,048 Due from Other Reinsures 26,714,577 24,467,855 20,861,654 21,782,127 Deferred Tax Assets - DTA 10,097,628 9,321,474 5,810,259 4,498,965 Property & Equipment - Net 50,802,122 49,276,987 42,978,032 29,853,586 Intangible Assets 846,109 839,087 796,376 1,268,006 Other Assets 12,636,332 9,225,068 9,181,049 7,579,391 Total Assets 568,069,805 548,879,219 524,476,747 498,426,498
Liabilities & Shareholders› EquityLiabilities
Net Unearned Premium Provision 94,632,485 89,123,956 81,081,050 70,588,173 Net Outstanding Claims Provision 76,287,810 72,703,051 66,283,721 58,996,483 Net Mathematical Provision 26,020,983 24,135,314 16,935,193 14,924,443 Net Technical Provisions 260,898 590,005 650,000 650,000 Total Technical Provisions 197,202,176 186,552,326 164,949,964 145,159,099
Due to Banks 4,745,399 8,508,695 3,692,207 1,573,179 Short Term Borrowing 4,000,000 4,009,471 6,116,997 639,747 Account Payable 30,555,975 26,263,753 20,940,852 20,139,974 Accrued Expenses 756,712 787,184 2,263,821 1,951,259 Due to Other Reinsures 48,854,047 42,133,843 36,329,442 32,926,036 Provisions 3,407,846 3,222,546 3,303,608 3,455,765 Income Tax Provision 3,283,954 3,436,066 4,665,248 5,925,080 Long Term Borrowing 9,570,581 7,857,733 2,829,883 7,000,000 Deferred Tax Liabilities - DTL 237,175 310,431 1,078,329 521,615 Other Liabilities 22,539,491 19,995,480 16,171,909 16,047,037 Total Liabilities 325,153,356 303,077,528 262,342,260 235,338,791
Shareholders› Equity
Paid up Capital 229,475,000 228,250,000 226,250,000 220,450,000 Treasury Stocks (1,238,133) (1,238,133) (1,238,133) (1,238,133)Net Premium on Paid up Capital 3,054,728 3,054,728 4,554,728 4,635,857 Statutory Reserve 31,075,882 31,075,882 29,999,545 28,121,665 Voluntary Reserve 4,374,771 4,374,771 4,592,390 3,713,787 Other Reserves 3,013,359 3,262,876 1,461,429 1,950,590 Accumulated Change in Fair Value (11,110,088) (10,934,383) 4,674,139 6,411,421 Retained Earning (Accumulated Loss) (20,196,189) (16,332,291) (8,218,911) (2,044,167)Others - Period Earning 3,402,485 2,212,553 (1,309,685) (887,877)Total Shareholders› Equity 241,851,815 243,726,004 260,765,502 261,113,143 Minority Interest 1,064,634 2,075,687 1,368,986 1,974,562 Total Shareholders› Equity 242,916,449 245,801,691 262,134,488 263,087,705 Total Liabilities & Shareholders› Equity 568,069,805 548,879,219 524,476,747 498,426,496
* Please refer to the items dictionary at the end of this report
Sector Financial Statements:

مجموعة االهلي لألسواق املالية واإلستثماراتAhli Capital Markets & Investments Group
Dislcosure: Please Refer to the important disclaimer at the back of this report Issue Date10
Mar. 2013
B- Income Statement*:
Income StatementQ2-2012 Q2-2011 2011 2010 2009
RevenuesTotal Written Premiums 208,933,421 186,146,434 361,612,364 333,335,362 296,523,710 Deduct: Reinsurance Share 79,808,993 76,341,724 145,681,970 124,618,750 117,276,174 Net Written Premiums 129,124,428 109,804,710 215,930,394 208,716,612 179,247,536
Net Change in Unearned Premium Provision (12,582,533) (5,664,441) (4,357,231) (10,492,877) (7,216,112)Net Change in Mathematical Provision (1,980,492) (1,539,857) (3,563,378) (2,010,750) (1,691,409)Net Earned Premium Income 114,561,403 102,600,412 208,009,785 196,212,985 170,340,015
Commissions Received 11,257,270 10,336,682 19,769,309 17,576,474 17,219,696 Issuing Fees 8,631,693 6,744,393 13,338,903 12,255,857 11,812,112 Interest Revenues 3,098,547 2,888,780 5,971,798 6,366,149 8,455,280 Gain (Loss) from Financial Assets & Inv. 2,755,750 2,450,516 1,045,010 1,614,039 15,769 Other Revenues 1,524,572 2,387,903 3,524,317 3,414,032 4,510,770 Total Revenues 141,829,235 127,408,686 251,659,122 237,439,536 212,353,642 Cost of Claims
Claims Paid 148,230,714 129,638,872 273,956,392 221,290,977 205,768,123 Maturity & Surrender of Policies 1,020,257 796,882 1,618,975 1,418,322 1,662,878 Deduct: Recoveries 13,775,383 12,683,439 25,905,616 21,749,470 21,370,400 Deduct: Reinsurance Share 42,891,024 34,244,600 74,993,462 49,077,004 48,214,477 Net Claims Paid 92,584,564 83,507,715 174,676,289 151,882,825 137,846,124
Net Change in Outstanding Claims Provision 5,593,061 2,037,594 8,943,656 7,287,244 4,762,056 Allocated Administrative Expenses 20,261,830 19,035,731 38,190,371 35,618,523 33,303,041 Excess of Loss 2,262,485 2,319,407 4,361,257 3,559,479 3,423,166 Acquisition Policies Fees 7,781,062 7,189,780 14,287,298 13,762,532 12,621,928 Other Expenses 1,875,154 1,588,163 3,106,766 3,526,729 2,911,119 Underwriting Profit (Loss) 130,358,156 115,678,389 243,565,637 215,637,332 194,867,434
Employees Expenses 2,985,051 2,863,195 5,622,575 5,219,705 4,799,480 Depreciation 1,487,547 1,170,910 2,545,901 2,064,608 1,908,426 Administrative Expenses 1,622,210 1,527,588 3,074,463 2,898,987 2,893,979 Doubtful Debt Expenses 1,256,910 1,842,468 2,705,273 2,639,759 2,565,304 Doubtful Debt Expenses (Amortized Cost) 75,000 50,000 433,292 259,629 (9,639)Other Provisions 144,280 149,470 70,000 284,541 87,886 Impairment of Property & Equipment - (21,057) 197,474 (109,209) 222 Other Expenses 437,729 249,976 1,125,882 2,060,587 1,946,202 Total Expenses 8,008,727 7,832,550 15,774,860 15,318,606 14,191,860
Share of Profit of Subsidiaries & Associates 55,891 49,573 486,835 2,958,199 (188,692)Net Profit (Loss) Before Tax - EBIT 3,518,243 3,947,320 (7,194,540) 9,441,797 3,105,656
Tax Expense 1,345,088 1,697,527 (679,947) 2,514,707 3,404,759 Net Profit after Tax 2,173,155 2,249,793 (6,514,593) 6,927,090 (299,103)
* Please refer to the items dictionary at the end of this report

مجموعة االهلي لألسواق املالية واإلستثماراتAhli Capital Markets & Investments Group
Dislcosure: Please Refer to the important disclaimer at the back of this report Issue Date11
Mar. 2013
C- Cash Flow Statement:
Cash Flow
Q2-2012 Q2-2011 2011 2010 2009
Earning Before Interest & Taxes - EBIT 4,244,436 3,292,996 (4,050,550) 6,200,319 2,361,793
Taxes Paid 2,318,648 3,242,638 3,449,041 4,373,962 6,764,352
Depreciation Expense 1,204,275 1,309,023 2,301,593 2,380,265 1,870,774
Cash Flow From Operating Activities 13,899,241 (6,812,648) 4,420,093 19,839,279 19,301,019
CAPEX (5,528,926) (5,702,128) (9,553,846) (21,919,259) (12,755,240)
Cash Flow From Investing Activities (8,077,703) 7,080,295 (7,195,172) (7,607,143) (36,958,766)
Cash Dividends (4,605,000) (7,004,387) (7,716,425) (5,247,116) (9,297,329)
Cash Flow From Financing Activities (1,758,945) (4,217,754) (293,930) (4,165,381) (8,946,743)
Net Change in Cash Item 4,062,593 (3,950,107) (3,069,009) 8,066,755 (26,604,490)

مجموعة االهلي لألسواق املالية واإلستثماراتAhli Capital Markets & Investments Group
Dislcosure: Please Refer to the important disclaimer at the back of this report Issue Date12
Mar. 2013
A- Aviation: Income Statement - Aviation
Q2-2011 Q2-2012 2011 2010 2009Written RevenuesDirect Insurance 4,278,937 1,323,129 7,067,885 4,053,883 2,416,319 Reinsurance Accepted 7,236 248,710 (181,034) 641,923 77,421 Total Written Premiums 4,286,173 1,571,839 6,886,851 4,695,806 2,493,740 Deduct:Local Reinsurance Share - - - - 74,936 Foreign Reinsurance Share 1,307,175 1,566,313 6,893,538 4,689,210 2,293,372 Net Written Premiums 2,978,998 5,526 (6,687) 6,596 125,432
Net Earned Premium Income (9,439) 3,049 (5,563) 83,898 87,261 Cost of Claims
Net Claims Paid - - 37,342 - 125,767 Recoveries - - - - - Deduct: Local Reinsurance Share - - - - - Deduct: Foreign Reinsurance Share - - 37,342 - 125,767 Cost of Claims Incurred - - 2,650 (7,400) (3,500)
Commission Received 75,221 84,945 107,754 297,183 99,109 Issuing Fees 36,297 26,409 60,952 19,982 39,199 Total Revenues 99,546 111,575 156,743 390,989 215,213
Commission Paid - 12,405 830 1,138 2,350 Total Expenses 403,818 139,056 741,717 418,447 327,821
Underwriting Profit (Loss) (301,739) (24,653) (581,264) (9,984) (98,852)
Written Premiums: By the end of June 2012, insurance companies accepted JD1.57million in aviation insurance premiums (reinsuring almost 100% of the amount) compared to JD4.29 million aviation insurance premiums recorded during the same period of 2011(reinsuring around 30.5% of the amount), resulting in JD2.98 million in net written premiums.
Net Claims: Eight companies within the sample paid JD37.34 thousand by the end of 2011 with a net cost amounting to JD2.65 thousand, whereas JD125.77 thousand of net claims were paid by the end of 2009 with a negative net cost amounting to JD3.5 thousand.
Commission and Issuing Fees Received: During the period of study, policies issuing fees reached 107.63% of total revenues by the end of 2011, compare to 81.12% recorded by the end of 2010.Commission and issuing fees received to total revenues ratio reached to 99.8% by June 2012 compared to 112.03% reached during the same period of 2011.
Commission Paid: During the first half of 2012, 8 companies paid JD12.4 thousand (8.9% of total expenses), while commissions paid throughout year 2011 and 2010 reached JD830 paid and JD1.14 thousand respectively.
Underwriting Profit: Throughout the study period, this type of underwriting topped JD581.26 thousand by end of year 2011 compared to JD10 thousand recorded by end of year 2010.
Underwriting P&L Account:8 companies of our sample (21 companies) offer Aviation Insurance
Aviation Insurance is one of 2 types of insurance to consistently record losses during the past 3 years

مجموعة االهلي لألسواق املالية واإلستثماراتAhli Capital Markets & Investments Group
Dislcosure: Please Refer to the important disclaimer at the back of this report Issue Date13
Mar. 2013
B- Credit:
Income Statement - Credit
Q2-2011 Q2-2012 2011 2010 2009Written RevenuesDirect Insurance 242,859 108,895 424,513 464,035 607,708 Reinsurance Accepted - - - - - Total Written Premiums 242,859 108,895 424,513 464,035 607,708 Deduct:Local Reinsurance Share - - - - - Foreign Reinsurance Share 64,733 22,251 91,442 118,716 91,568 Net Written Premiums 178,126 86,644 333,071 345,319 516,140
Net Earned Premium Income 227,723 194,639 434,677 790,180 650,054 Cost of Claims
Net Claims Paid 463,210 471,781 911,112 2,093,502 926,168 Recoveries 524,189 405,592 830,749 449,632 198,168 Deduct: Local Reinsurance Share - - - - - Deduct: Foreign Reinsurance Share 51,203 32,143 133,745 592,576 223,445 Cost of Claims Incurred 209,152 35,339 342,671 (66,151) 1,052,035
Commission Received 12,375 3,797 16,852 13,780 13,471 Issuing Fees 84,159 1,861 7,807 28,019 26,794 Total Revenues 401,860 164,200 484,257 432,863 44,015
Commission Paid - - - 126 449 Total Expenses 124,865 29,497 89,628 129,611 117,376
Underwriting Profit (Loss) 369,656 317,152 650,460 767,120 (50,869)
Written Premiums: By the end of June 2012, insurance companies accepted JD109 thousand in credit insurance premiums (reinsuring JD22.3 thousand of the amount) compared to JD242.9 thousand (reinsuring JD64.7 thousand of the amount) recorded during the same period of 2011 which resulted in JD178.13 thousand in a net written premiums.
Net Claims: Three companies within the sample paid JD471.8 thousand by the end of June 2012 with a net cost amounting to JD35.34 thousand, compared to JD463.21 thousands in net claims paid by the end of same period of 2011 with a cost of JD209.2 thousand.
Commission and Issuing Fees Received: An average of JD35.57 thousand in commission and issuing fees received was recorded during 2009 to 2011 that contributed 35.41% of total revenues on average.
Companies accepting this type of insurance received a commission and issuing fees amounting to JD5,658 during the first 6 months of 2012 (3.45% of total revenues) compared to JD96.53 thousands achieved during the same period of 2011 (24.02% of total revenues).
Underwriting Profit: This type of underwriting resulted in a JD50.9 thousand loss during year 2009, yet achieved profits of JD767.1 and JD650.46 by the end of year 2010 and 2011 respectively.
3 companies of our sample (21 companies) offer Credit Insurance
During the period under study, credit insurance recorded the second lowest reinsurance rate lagging only behind motor insurance. This indicate the companies’ apatite towards this form of insurance

مجموعة االهلي لألسواق املالية واإلستثماراتAhli Capital Markets & Investments Group
Dislcosure: Please Refer to the important disclaimer at the back of this report Issue Date14
Mar. 2013
C- Fire & Other Damage to Property:
Income Statement - Fire & Other Damage to Property
Q2-2011 Q2-2012 2011 2010 2009Written RevenuesDirect Insurance 18,173,855 16,447,949 34,882,786 33,811,941 30,127,428 Reinsurance Accepted 5,085,899 4,302,826 8,769,094 9,525,666 9,419,631 Total Written Premiums 23,259,754 20,750,775 43,651,880 43,337,607 39,547,059 Deduct:Local Reinsurance Share 5,739,699 3,821,921 9,290,421 8,929,054 9,695,056 Foreign Reinsurance Share 16,053,775 15,460,678 30,960,151 31,259,517 27,537,592 Net Written Premiums 1,466,280 1,468,176 3,401,308 3,149,036 2,314,411
Net Earned Premium Income 1,467,485 1,332,209 2,760,919 2,498,358 2,268,599 Cost of Claims
Net Claims Paid 6,554,274 4,311,149 17,093,238 8,227,916 9,829,493 Recoveries 156,580 61,087 312,169 608,489 352,353 Deduct: Local Reinsurance Share 368,271 479,158 2,068,349 1,063,450 1,370,332 Deduct: Foreign Reinsurance Share 5,785,223 3,449,895 13,840,499 6,680,619 7,693,319 Cost of Claims Incurred 164,779 372,135 657,219 1,070,864 1,195,929
Commission Received 3,351,083 2,980,658 6,159,616 5,996,785 6,135,818 Issuing Fees 477,525 474,268 1,018,295 889,015 818,596 Total Revenues 4,786,571 4,424,830 9,124,212 8,205,786 7,999,367
Commission Paid 627,855 587,805 1,147,895 1,197,838 1,303,272 Total Expenses 3,325,456 3,040,987 6,656,497 6,438,107 6,105,134
Underwriting Profit (Loss) 1,923,396 1,686,215 2,837,743 2,101,148 2,242,970
Written Premiums: By the end of June 2012, insurance companies accepted JD20.75 million in fire insurance premiums (reinsuring JD19.28 million of the amount) compared to JD23.3 million (reinsuring JD21.8 million of the amount) recorded during the same period of 2011 which resulted in JD1.47 million in a net written premiums.
Net Claims: Twenty companies within the sample paid JD4.31 million by the end of June 2012 with a net cost amounting to JD372 thousand compared to JD6.55 million in net claims paid by the end of the same period of 2011 with a cost of JD164.8 thousand.
Commission and Issuing Fees Received: Commission and issuing fees received to total revenues ratio reached 78.1% by June 2012 compared to 80% recorded during the same period of 2011.
During the period of study, policies issuing fees reached 78.7% of total revenues by the end of 2011, compare to 83.9% recorded by the end of 2010.
Underwriting Profit: This type of underwriting resulted in a profit of JD2.84 million during year 2011 compared to JD2.10 million recorded by end of year 2010.
20 companies of our sample (21 companies) offer Fire & Other Damage to Property Insurance
The company’s heavily depend on foreign reinsures due to large policy values and desire to diversify their portfolios
مجموعة االهلي لألسواق املالية واإلستثماراتAhli Capital Markets & Investments Group
Dislcosure: Please Refer to the important disclaimer at the back of this report Issue Date15
Mar. 2013
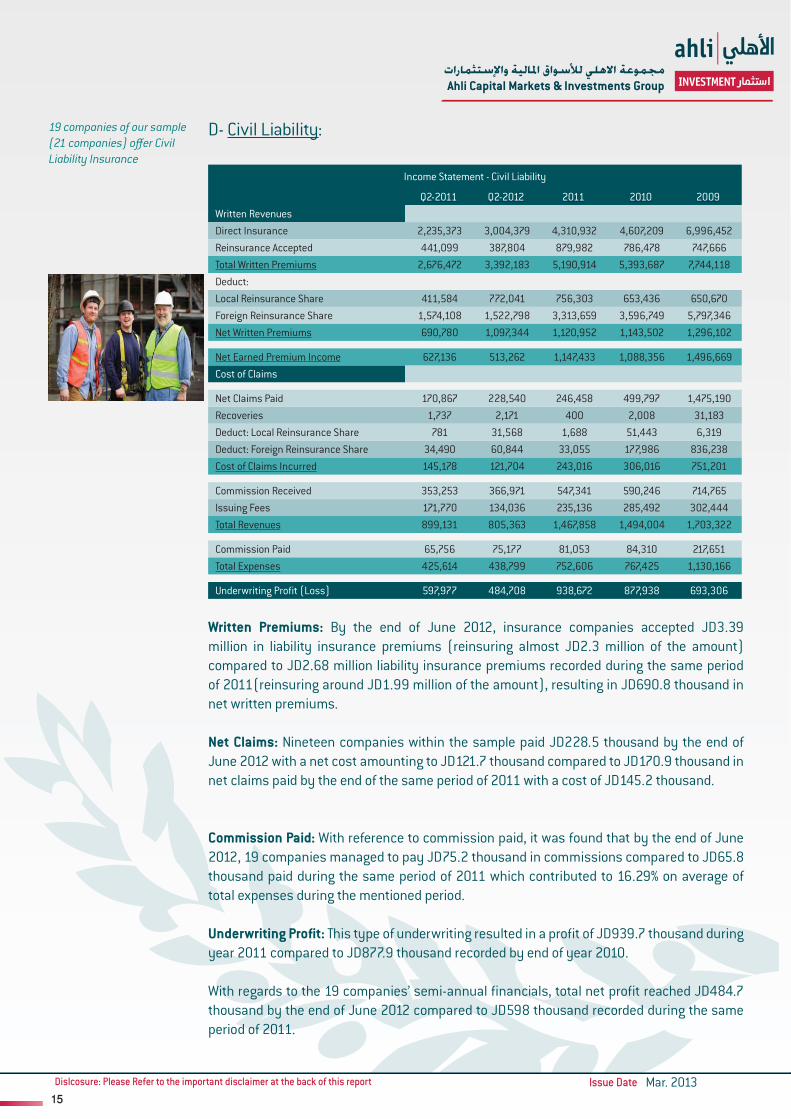
D- Civil Liability:
Income Statement - Civil Liability
Q2-2011 Q2-2012 2011 2010 2009Written RevenuesDirect Insurance 2,235,373 3,004,379 4,310,932 4,607,209 6,996,452 Reinsurance Accepted 441,099 387,804 879,982 786,478 747,666 Total Written Premiums 2,676,472 3,392,183 5,190,914 5,393,687 7,744,118 Deduct:Local Reinsurance Share 411,584 772,041 756,303 653,436 650,670 Foreign Reinsurance Share 1,574,108 1,522,798 3,313,659 3,596,749 5,797,346 Net Written Premiums 690,780 1,097,344 1,120,952 1,143,502 1,296,102
Net Earned Premium Income 627,136 513,262 1,147,433 1,088,356 1,496,669 Cost of Claims
Net Claims Paid 170,867 228,540 246,458 499,797 1,475,190 Recoveries 1,737 2,171 400 2,008 31,183 Deduct: Local Reinsurance Share 781 31,568 1,688 51,443 6,319 Deduct: Foreign Reinsurance Share 34,490 60,844 33,055 177,986 836,238 Cost of Claims Incurred 145,178 121,704 243,016 306,016 751,201
Commission Received 353,253 366,971 547,341 590,246 714,765 Issuing Fees 171,770 134,036 235,136 285,492 302,444 Total Revenues 899,131 805,363 1,467,858 1,494,004 1,703,322
Commission Paid 65,756 75,177 81,053 84,310 217,651 Total Expenses 425,614 438,799 752,606 767,425 1,130,166
Underwriting Profit (Loss) 597,977 484,708 938,672 877,938 693,306
Written Premiums: By the end of June 2012, insurance companies accepted JD3.39 million in liability insurance premiums (reinsuring almost JD2.3 million of the amount) compared to JD2.68 million liability insurance premiums recorded during the same period of 2011(reinsuring around JD1.99 million of the amount), resulting in JD690.8 thousand in net written premiums.
Net Claims: Nineteen companies within the sample paid JD228.5 thousand by the end of June 2012 with a net cost amounting to JD121.7 thousand compared to JD170.9 thousand in net claims paid by the end of the same period of 2011 with a cost of JD145.2 thousand.
Commission Paid: With reference to commission paid, it was found that by the end of June 2012, 19 companies managed to pay JD75.2 thousand in commissions compared to JD65.8 thousand paid during the same period of 2011 which contributed to 16.29% on average of total expenses during the mentioned period.
Underwriting Profit: This type of underwriting resulted in a profit of JD939.7 thousand during year 2011 compared to JD877.9 thousand recorded by end of year 2010.
With regards to the 19 companies’ semi-annual financials, total net profit reached JD484.7 thousand by the end of June 2012 compared to JD598 thousand recorded during the same period of 2011.
19 companies of our sample (21 companies) offer Civil Liability Insurance
مجموعة االهلي لألسواق املالية واإلستثماراتAhli Capital Markets & Investments Group
Dislcosure: Please Refer to the important disclaimer at the back of this report Issue Date16
Mar. 2013
E- Life:
Income Statement - Life
Q2-2011 Q2-2012 2011 2010 2009Written Revenues
Direct Insurance 12,044,831 15,615,210 24,377,220
23,095,343 17,818,760
Reinsurance Accepted 1,207,518 865,555 2,036,739 2,637,506 5,294,913 Total Written Premiums 13,252,349 16,480,765 26,413,959 25,732,849 23,113,673 Deduct:Local Reinsurance Share 727,866 810,437 1,925,656 1,713,905 3,576,481 Foreign Reinsurance Share 5,999,040 6,962,507 11,147,836 10,572,510 9,353,222 Net Written Premiums 6,525,443 8,707,821 13,340,467 13,446,434 10,183,970
Net Earned Premium Income 4,902,083 6,605,081 11,078,846 11,837,018 10,161,961 Cost of Claims
Net Claims Paid 6,326,552 7,076,295 7,995,238 13,693,216 15,611,812 Recoveries 6,824 240 7,324 53,343 8,570 Deduct: Local Reinsurance Share 72,436 1,667 754,242 405,155 304,088 Deduct: Foreign Reinsurance Share 4,545,538 5,196,266 8,846,595 8,526,467 7,021,098 Cost of Claims Incurred 2,521,418 3,018,101 4,826,129 6,170,877 8,335,333
Commission Received 228,038 357,692 575,997 621,320 789,236 Issuing Fees 161,247 501,166 283,401 268,711 379,558 Total Revenues 2,309,143 3,713,565 6,172,390 5,792,118 6,549,862
Commission Paid 702,762 790,389 615,129 735,592 976,002 Total Expenses 2,225,603 3,301,959 5,238,730 5,012,274 4,015,299
Underwriting Profit (Loss) 1,464,885 1,965,278 3,410,584 2,924,633 2,801,334
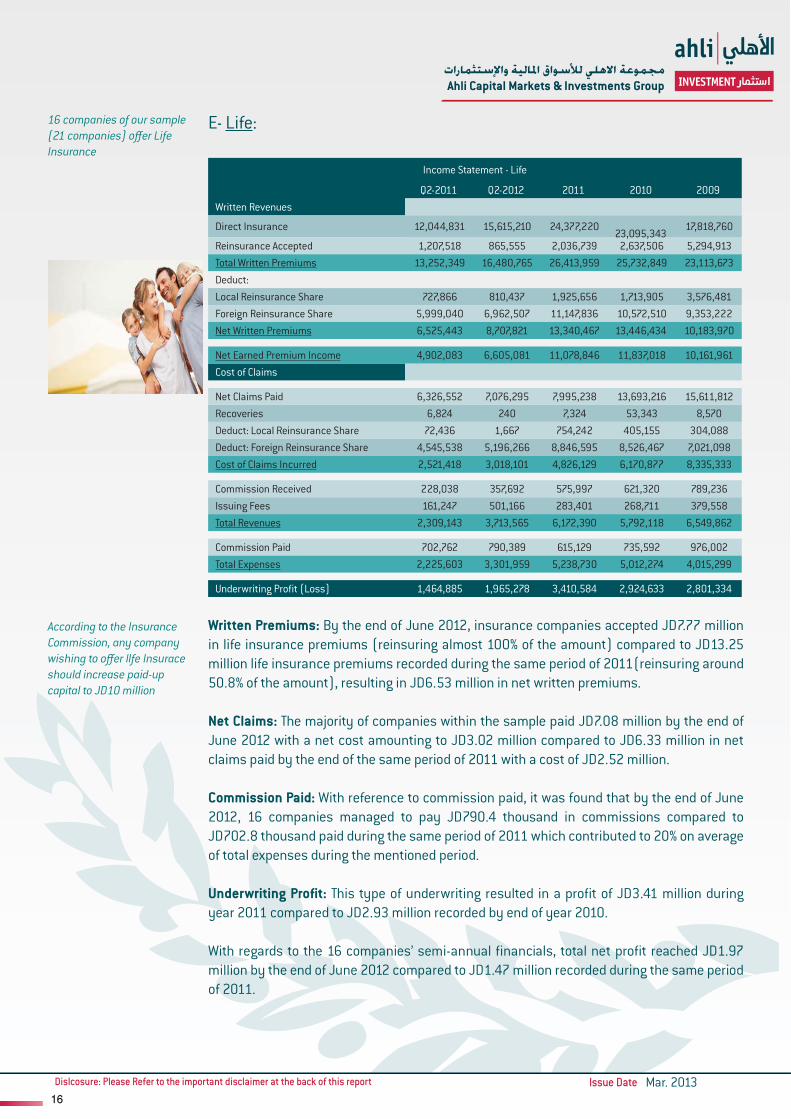
Written Premiums: By the end of June 2012, insurance companies accepted JD7.77 million in life insurance premiums (reinsuring almost 100% of the amount) compared to JD13.25 million life insurance premiums recorded during the same period of 2011(reinsuring around 50.8% of the amount), resulting in JD6.53 million in net written premiums.
Net Claims: The majority of companies within the sample paid JD7.08 million by the end of June 2012 with a net cost amounting to JD3.02 million compared to JD6.33 million in net claims paid by the end of the same period of 2011 with a cost of JD2.52 million.
Commission Paid: With reference to commission paid, it was found that by the end of June 2012, 16 companies managed to pay JD790.4 thousand in commissions compared to JD702.8 thousand paid during the same period of 2011 which contributed to 20% on average of total expenses during the mentioned period.
Underwriting Profit: This type of underwriting resulted in a profit of JD3.41 million during year 2011 compared to JD2.93 million recorded by end of year 2010.
With regards to the 16 companies’ semi-annual financials, total net profit reached JD1.97 million by the end of June 2012 compared to JD1.47 million recorded during the same period of 2011.
16 companies of our sample (21 companies) offer Life Insurance
According to the Insurance Commission, any company wishing to offer Ilfe Insurace should increase paid-up capital to JD10 million

مجموعة االهلي لألسواق املالية واإلستثماراتAhli Capital Markets & Investments Group
Dislcosure: Please Refer to the important disclaimer at the back of this report Issue Date17
Mar. 2013
F- Marine and Transportation:
Income Statement - Marine and Transportation
Q2-2011 Q2-2012 2011 2010 2009Written RevenuesDirect Insurance 10,092,536 10,952,495 19,648,494 18,334,574 17,498,081 Reinsurance Accepted 983,976 1,869,925 2,170,161 1,467,328 1,574,200 Total Written Premiums 11,076,512 12,822,420 21,818,655 19,801,902 19,072,281 Deduct:Local Reinsurance Share 688,334 1,047,160 1,388,661 1,019,982 656,189 Foreign Reinsurance Share 8,824,214 9,549,882 17,290,748 15,700,119 15,429,042 Net Written Premiums 1,563,964 2,225,378 3,139,246 3,081,801 2,987,050
Net Earned Premium Income 1,573,073 1,538,301 3,219,074 2,757,703 3,285,102 Cost of Claims
Net Claims Paid 2,609,264 7,918,905 4,406,749 3,896,912 5,919,155 Recoveries 97,534 65,553 125,602 227,791 220,189 Deduct: Local Reinsurance Share 10,878 8,610 44,460 34,095 697,142 Deduct: Foreign Reinsurance Share 2,164,839 7,538,303 3,458,003 3,006,587 4,259,514 Cost of Claims Incurred 341,095 286,146 561,251 880,627 694,577
Commission Received 2,277,976 2,421,962 4,607,424 4,292,854 4,396,638 Issuing Fees 263,987 309,836 394,821 377,325 372,815 Total Revenues 3,739,663 4,370,950 7,461,881 6,720,269 7,303,515
Commission Paid 372,168 473,589 673,171 658,305 929,587 Total Expenses 1,792,479 1,977,346 3,627,567 3,566,906 3,650,716
Underwriting Profit (Loss) 2,261,059 2,668,612 4,380,115 3,497,378 4,257,553
Written Premiums: By the end of June 2012, insurance companies accepted JD12.8 million in marine and transportation insurance premiums (reinsuring almost JD10.6 million of the amount) compared to JD11.1 million marine and transportation insurance premiums recorded during the same period of 2011(reinsuring around JD9.51 million of the amount), resulting in JD1.56 million in net written premiums.
Net Claims: The majority of companies within the sample paid JD7.08 million by the end of June 2012 with a net cost amounting to JD3.02 million compared to JD6.33 million in net claims paid by the end of the same period of 2011 with a cost of JD2.52 million. Moreover, the majority of the companies were able to transfer on average 84% of their net claims paid burden to either local or foreign reinsurers from 2009 until the end of June 2012. In terms of numbers, the majority of companies paid JD7.92 million in claims whereas JD7.54 million of which was covers by reinsurers (burden ratio of 95.3%) relative to JD2.61 million which was paid during the same period of 2011 whereby JD2.17 million of which was paid by reinsurers (burden ratio of 83.4%).
Commission and Issuing Fees Received: Moving to the commission and issuing fees received, an average of 66.46% of total revenue was recorded between 2009 until the end of June 2012. Furthermore, the majority of the companies received JD2.73 million by the end of June 2012 compared to JD2.54 million received during the same period of 2011.
Underwriting Profit: This underwriting achieved profits of JD2.67 million by the end of June 2012 compared to JD2.26 million recorded during the same period of 2011.
All of our sample (21 companies) offer Marine & Transportation Insurance
As with Fire Insurance, companies’ prefer to reinsure a large portion of its premiums due to high concentration risks associated with large contracts
مجموعة االهلي لألسواق املالية واإلستثماراتAhli Capital Markets & Investments Group
Dislcosure: Please Refer to the important disclaimer at the back of this report Issue Date18
Mar. 2013
G- Medical:
Income Statement - Medical
Q2-2011 Q2-2012 2011 2010 2009Written RevenuesDirect Insurance 45,834,710 60,511,360 86,337,467 68,500,532 64,326,168 Reinsurance Accepted 540,253 426,747 1,021,275 629,461 571,339 Total Written Premiums 46,374,963 60,938,107 87,358,742 69,129,993 64,897,507 Deduct:Local Reinsurance Share 734,987 445,760 1,257,000 624,881 591,280 Foreign Reinsurance Share 22,767,164 28,564,235 43,343,172 6,982,540 24,948,443 Net Written Premiums 22,872,812 31,928,112 42,758,570 41,522,572 39,357,784
Net Earned Premium Income 20,431,018 25,133,614 40,697,926 40,861,139 36,759,990 Cost of Claims
Net Claims Paid 4,864,399 4,965,023 73,820,097 58,572,291 52,038,147 Recoveries 578,314 568,323 1,379,852 993,097 830,852 Deduct: Local Reinsurance Share 223,721 448,866 616,452 576,766 326,090 Deduct: Foreign Reinsurance Share 16,654,473 21,571,593 36,251,926 21,018,422 18,290,574 Cost of Claims Incurred 17,405,072 23,574,191 36,273,541 36,172,636 34,071,056
Commission Received 3,014,998 3,986,874 5,883,805 4,066,829 3,588,443 Issuing Fees 1,835,065 2,517,227 3,633,820 3,028,449 2,865,602 Total Revenues 7,299,460 7,650,398 12,786,187 9,864,995 8,387,417
Commission Paid 943,602 1,201,278 1,679,866 1,433,847 1,707,256 Total Expenses 6,230,612 7,647,885 11,355,998 9,774,124 8,902,999
Underwriting Profit (Loss) 1,783,941 511,363 2,827,902 2,369,146 790,078
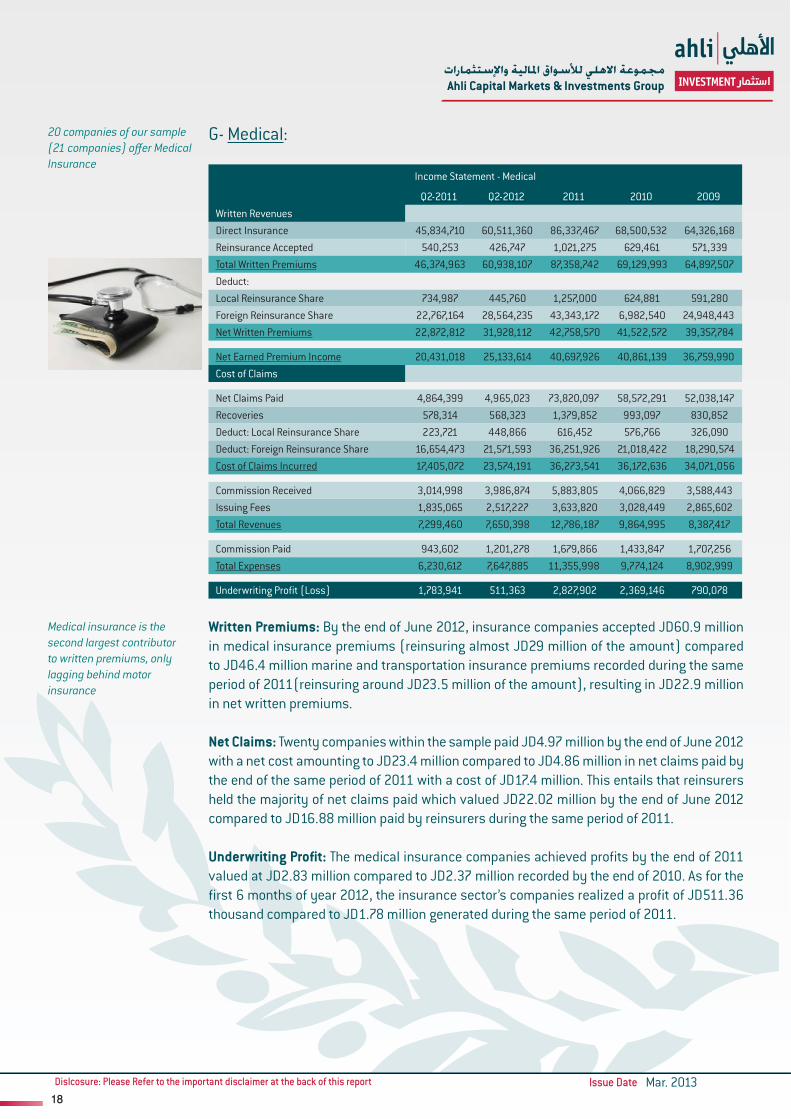
Written Premiums: By the end of June 2012, insurance companies accepted JD60.9 million in medical insurance premiums (reinsuring almost JD29 million of the amount) compared to JD46.4 million marine and transportation insurance premiums recorded during the same period of 2011(reinsuring around JD23.5 million of the amount), resulting in JD22.9 million in net written premiums.
Net Claims: Twenty companies within the sample paid JD4.97 million by the end of June 2012 with a net cost amounting to JD23.4 million compared to JD4.86 million in net claims paid by the end of the same period of 2011 with a cost of JD17.4 million. This entails that reinsurers held the majority of net claims paid which valued JD22.02 million by the end of June 2012 compared to JD16.88 million paid by reinsurers during the same period of 2011.
Underwriting Profit: The medical insurance companies achieved profits by the end of 2011 valued at JD2.83 million compared to JD2.37 million recorded by the end of 2010. As for the first 6 months of year 2012, the insurance sector’s companies realized a profit of JD511.36 thousand compared to JD1.78 million generated during the same period of 2011.
20 companies of our sample (21 companies) offer Medical Insurance
Medical insurance is the second largest contributor to written premiums, only lagging behind motor insurance
مجموعة االهلي لألسواق املالية واإلستثماراتAhli Capital Markets & Investments Group
Dislcosure: Please Refer to the important disclaimer at the back of this report Issue Date19
Mar. 2013
H- Motor:
Income Statement - Motor
Q2-2011 Q2-2012 2011 2010 2009Written RevenuesDirect Insurance 72,916,505 83,013,753 143,949,301 140,734,130 116,852,956 Reinsurance Accepted 6,675,277 4,485,722 15,435,707 12,919,138 11,243,985 Total Written Premiums 79,591,782 87,499,475 159,385,008 153,653,268 128,096,941 Deduct:Local Reinsurance Share 4,933,982 3,944,210 10,076,318 9,778,074 8,027,348 Foreign Reinsurance Share 53,947 70,517 86,818 88,643 540,835 Net Written Premiums 74,603,853 83,484,748 149,221,872 143,786,551 119,528,758
Net Earned Premium Income 70,533,473 77,739,105 135,324,559 138,543,559 115,817,736 Cost of Claims
Net Claims Paid 76,895,431 81,124,513 158,742,422 136,923,784 121,902,314 Recoveries 10,722,305 11,714,048 21,432,015 19,523,609 18,349,381 Deduct: Local Reinsurance Share 2,417,898 2,086,207 4,805,170 4,300,867 3,061,050 Deduct: Foreign Reinsurance Share 1,997,959 1,751,062 3,682,996 3,270,186 2,743,814 Cost of Claims Incurred 63,944,810 71,202,811 139,245,415 115,037,238 99,433,538
Commission Received 149,612 100,730 282,201 375,381 519,959 Issuing Fees 2,942,338 3,915,453 6,372,215 6,140,139 5,655,000 Total Revenues 10,289,212 10,883,760 11,968,132 22,994,211 18,020,557
Commission Paid 3,808,014 4,227,702 6,616,006 6,282,011 6,787,998 Total Expenses 14,513,128 15,198,198 29,701,055 28,496,287 26,268,573
Underwriting Profit (Loss) (3,303,335) (3,882,670) (15,259,684) (791,785) (2,776,724)
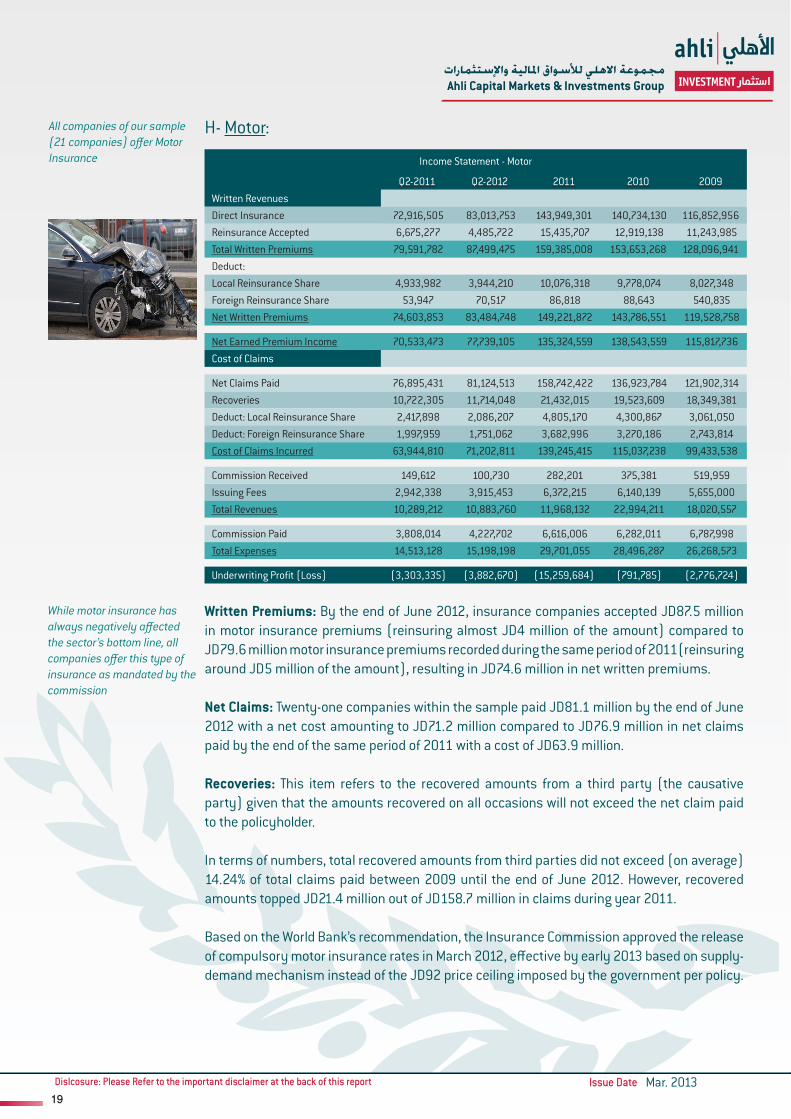
Written Premiums: By the end of June 2012, insurance companies accepted JD87.5 million in motor insurance premiums (reinsuring almost JD4 million of the amount) compared to JD79.6 million motor insurance premiums recorded during the same period of 2011(reinsuring around JD5 million of the amount), resulting in JD74.6 million in net written premiums.
Net Claims: Twenty-one companies within the sample paid JD81.1 million by the end of June 2012 with a net cost amounting to JD71.2 million compared to JD76.9 million in net claims paid by the end of the same period of 2011 with a cost of JD63.9 million.
Recoveries: This item refers to the recovered amounts from a third party (the causative party) given that the amounts recovered on all occasions will not exceed the net claim paid to the policyholder.
In terms of numbers, total recovered amounts from third parties did not exceed (on average) 14.24% of total claims paid between 2009 until the end of June 2012. However, recovered amounts topped JD21.4 million out of JD158.7 million in claims during year 2011.
Based on the World Bank’s recommendation, the Insurance Commission approved the release of compulsory motor insurance rates in March 2012, effective by early 2013 based on supply-demand mechanism instead of the JD92 price ceiling imposed by the government per policy.
All companies of our sample (21 companies) offer Motor Insurance
While motor insurance has always negatively affected the sector’s bottom line, all companies offer this type of insurance as mandated by the commission
مجموعة االهلي لألسواق املالية واإلستثماراتAhli Capital Markets & Investments Group
Dislcosure: Please Refer to the important disclaimer at the back of this report Issue Date20
Mar. 2013
I- Other Insurance:
Income Statement - Other
Q2-2011 Q2-2012 2011 2010 2009Written RevenuesDirect Insurance 4,231,831 4,877,624 8,002,743 7,950,832 7,275,636 Reinsurance Accepted 705,698 425,498 924,655 2,081,211 1,335,652 Total Written Premiums 4,937,529 5,303,122 8,927,398 10,032,043 8,611,288 Deduct:Local Reinsurance Share 412,075 615,479 1,053,539 1,428,233 812,794 Foreign Reinsurance Share 2,799,415 3,119,750 4,737,191 5,151,400 5,641,389 Net Written Premiums 1,726,039 1,567,893 3,136,668 3,452,410 2,157,105
Net Earned Premium Income 1,652,900 1,578,203 3,141,913 3,156,955 1,770,193 Cost of Claims
Net Claims Paid 1,234,048 1,012,196 2,258,764 2,112,746 2,395,786 Recoveries 5,806 862 5,146 7,416 15,444 Deduct: Local Reinsurance Share 30,250 200,156 76,015 244,171 180,426 Deduct: Foreign Reinsurance Share 323,391 124,092 678,942 909,624 1,805,671 Cost of Claims Incurred 819,256 760,141 1,439,230 996,938 630,121
Commission Received 560,489 650,084 967,043 869,064 791,965 Issuing Fees 177,962 171,277 311,411 315,746 323,224 Total Revenues 1,409,792 1,597,978 2,602,601 2,451,693 1,932,458
Commission Paid 331,537 142,268 596,406 782,459 476,220 Total Expenses 1,009,721 775,371 1,847,764 2,152,357 1,509,593
Underwriting Profit (Loss) 589,074 912,760 1,220,856 1,177,223 751,102
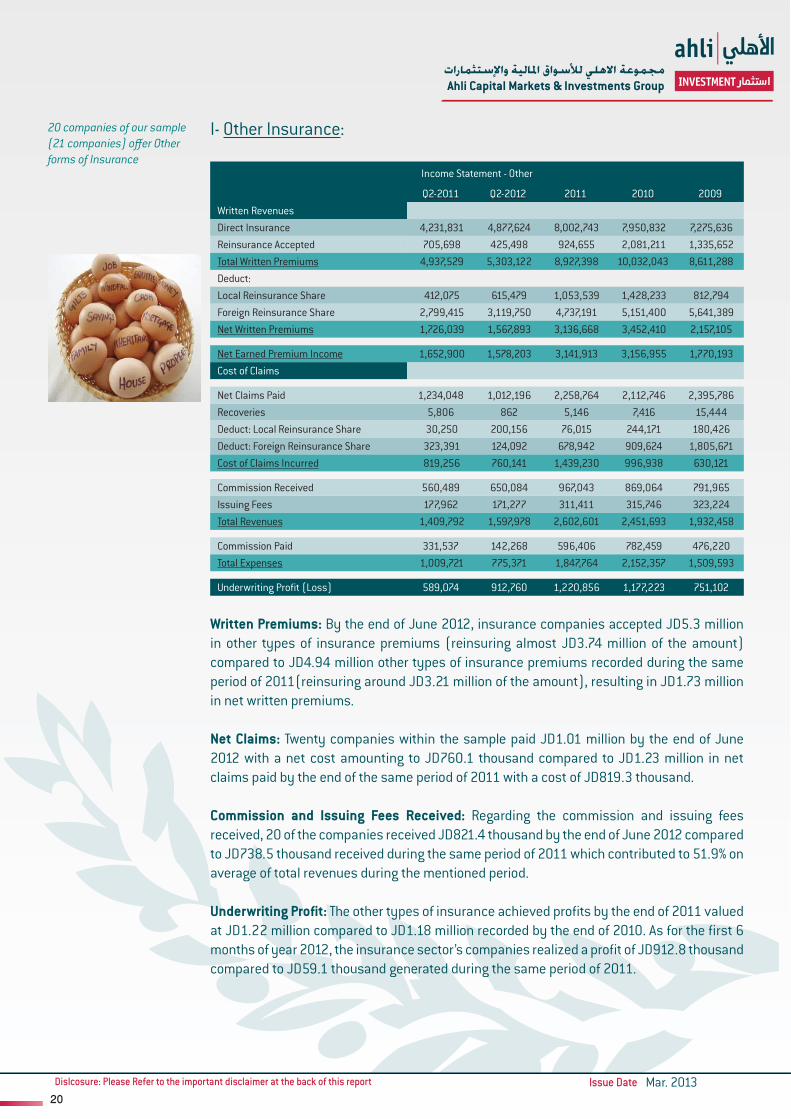
Written Premiums: By the end of June 2012, insurance companies accepted JD5.3 million in other types of insurance premiums (reinsuring almost JD3.74 million of the amount) compared to JD4.94 million other types of insurance premiums recorded during the same period of 2011(reinsuring around JD3.21 million of the amount), resulting in JD1.73 million in net written premiums.
Net Claims: Twenty companies within the sample paid JD1.01 million by the end of June 2012 with a net cost amounting to JD760.1 thousand compared to JD1.23 million in net claims paid by the end of the same period of 2011 with a cost of JD819.3 thousand.
Commission and Issuing Fees Received: Regarding the commission and issuing fees received, 20 of the companies received JD821.4 thousand by the end of June 2012 compared to JD738.5 thousand received during the same period of 2011 which contributed to 51.9% on average of total revenues during the mentioned period.
Underwriting Profit: The other types of insurance achieved profits by the end of 2011 valued at JD1.22 million compared to JD1.18 million recorded by the end of 2010. As for the first 6 months of year 2012, the insurance sector’s companies realized a profit of JD912.8 thousand compared to JD59.1 thousand generated during the same period of 2011.
20 companies of our sample (21 companies) offer Other forms of Insurance

مجموعة االهلي لألسواق املالية واإلستثماراتAhli Capital Markets & Investments Group
Dislcosure: Please Refer to the important disclaimer at the back of this report Issue Date21
Mar. 2013
J- Total Underwritings:
Income Statement - Total Underwritings
Q2-2011 Q2-2012 2011 2010 2009Written RevenuesDirect Insurance 170,051,437 195,854,794 329,001,341 301,552,479 263,919,508 Reinsurance Accepted 15,646,956 13,012,787 31,056,579 30,688,711 30,264,807 Total Written Premiums 185,698,393 208,867,581 360,057,920 332,241,190 294,184,315 Deduct:Local Reinsurance Share 13,648,527 11,457,008 25,747,898 24,147,565 24,084,754 Foreign Reinsurance Share 59,443,571 66,838,931 117,864,555 98,159,404 91,632,809 Net Written Premiums 112,606,295 130,571,642 216,445,467 209,934,221 178,466,752
Net Earned Premium Income 101,405,452 114,637,463 197,799,784 201,617,166 172,297,565 Cost of Claims
Net Claims Paid 129,118,045 147,108,402 265,511,420 226,020,164 210,223,832 Recoveries 12,093,289 12,817,876 24,093,257 21,865,385 20,006,140 Deduct: Local Reinsurance Share 3,124,235 3,256,232 8,366,376 6,675,947 5,945,447 Deduct: Foreign Reinsurance Share 31,557,116 39,724,198 66,963,103 44,182,467 42,999,440 Cost of Claims Incurred 85,550,760 99,370,568 183,591,122 160,561,645 146,160,290
Commission Received 10,023,045 10,953,713 19,148,033 17,123,442 17,049,404 Issuing Fees 6,150,350 8,051,533 12,317,858 11,352,878 10,783,232 Total Revenues 31,234,378 33,722,619 52,224,261 58,346,928 52,155,726
Commission Paid 6,851,694 7,510,613 11,410,356 11,175,626 12,400,785 Total Expenses 30,051,296 32,549,098 60,011,562 56,755,538 52,027,677
Underwriting Profit (Loss) 5,384,914 4,638,765 425,384 12,912,817 8,609,898
By the end of June 2012, insurance companies (based on the mentioned above aggregate P&L) accepted JD208.9 million for all types of insurance premiums (reinsuring almost JD78.3 million of the amount) compared to JD170.1 million other types of insurance premiums recorded during the same period of 2011(reinsuring around JD112.6 million of the amount), resulting in JD1.73 million in net written premiums.
On average, 26.1% of total claims paid were covered by either local or foreign reinsurers between 2009 until the end of June 2012.

مجموعة االهلي لألسواق املالية واإلستثماراتAhli Capital Markets & Investments Group
Dislcosure: Please Refer to the important disclaimer at the back of this report Issue Date22
Mar. 2013
Sector Main Statistics
مجموعة االهلي لألسواق املالية واإلستثماراتAhli Capital Markets & Investments Group
Dislcosure: Please Refer to the important disclaimer at the back of this report Issue Date23
Mar. 2013
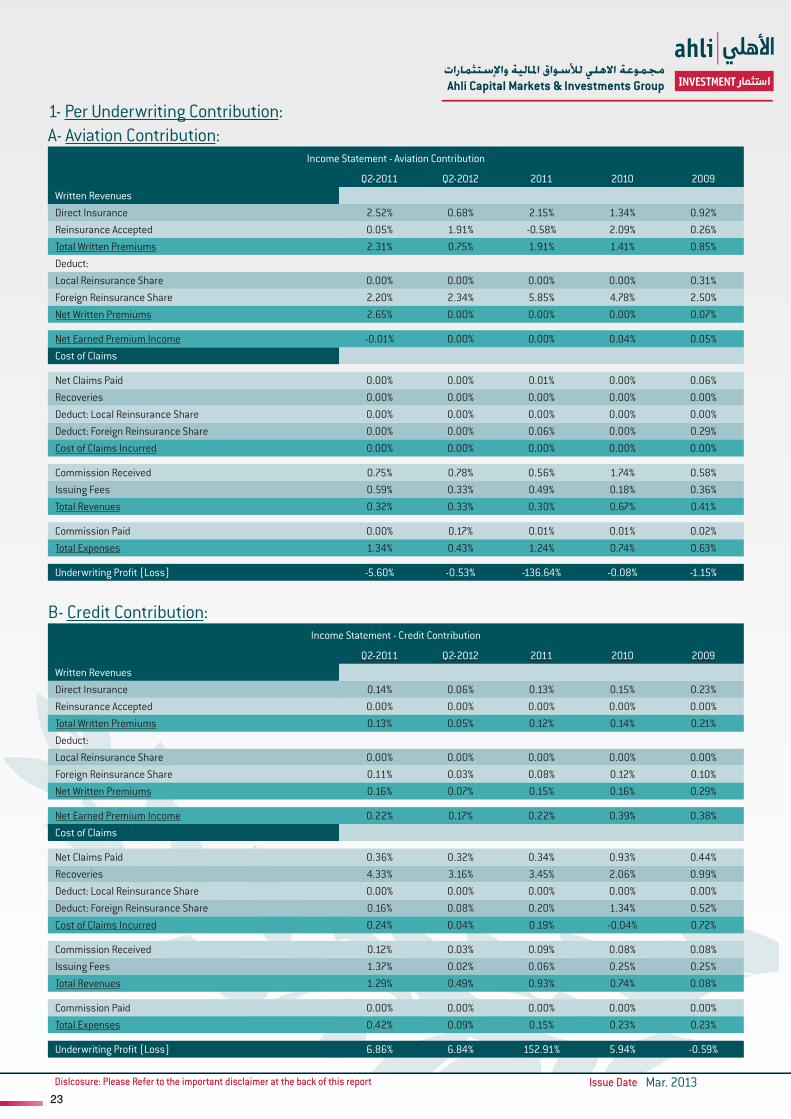
1- Per Underwriting Contribution:A- Aviation Contribution:
Income Statement - Aviation Contribution
Q2-2011 Q2-2012 2011 2010 2009Written RevenuesDirect Insurance 2.52% 0.68% 2.15% 1.34% 0.92%Reinsurance Accepted 0.05% 1.91% -0.58% 2.09% 0.26%Total Written Premiums 2.31% 0.75% 1.91% 1.41% 0.85%Deduct:Local Reinsurance Share 0.00% 0.00% 0.00% 0.00% 0.31%Foreign Reinsurance Share 2.20% 2.34% 5.85% 4.78% 2.50%Net Written Premiums 2.65% 0.00% 0.00% 0.00% 0.07%
Net Earned Premium Income -0.01% 0.00% 0.00% 0.04% 0.05%Cost of Claims
Net Claims Paid 0.00% 0.00% 0.01% 0.00% 0.06%Recoveries 0.00% 0.00% 0.00% 0.00% 0.00%Deduct: Local Reinsurance Share 0.00% 0.00% 0.00% 0.00% 0.00%Deduct: Foreign Reinsurance Share 0.00% 0.00% 0.06% 0.00% 0.29%Cost of Claims Incurred 0.00% 0.00% 0.00% 0.00% 0.00%
Commission Received 0.75% 0.78% 0.56% 1.74% 0.58%Issuing Fees 0.59% 0.33% 0.49% 0.18% 0.36%Total Revenues 0.32% 0.33% 0.30% 0.67% 0.41%
Commission Paid 0.00% 0.17% 0.01% 0.01% 0.02%Total Expenses 1.34% 0.43% 1.24% 0.74% 0.63%
Underwriting Profit (Loss) -5.60% -0.53% -136.64% -0.08% -1.15%
B- Credit Contribution:Income Statement - Credit Contribution
Q2-2011 Q2-2012 2011 2010 2009Written RevenuesDirect Insurance 0.14% 0.06% 0.13% 0.15% 0.23%Reinsurance Accepted 0.00% 0.00% 0.00% 0.00% 0.00%Total Written Premiums 0.13% 0.05% 0.12% 0.14% 0.21%Deduct:Local Reinsurance Share 0.00% 0.00% 0.00% 0.00% 0.00%Foreign Reinsurance Share 0.11% 0.03% 0.08% 0.12% 0.10%Net Written Premiums 0.16% 0.07% 0.15% 0.16% 0.29%
Net Earned Premium Income 0.22% 0.17% 0.22% 0.39% 0.38%Cost of Claims
Net Claims Paid 0.36% 0.32% 0.34% 0.93% 0.44%Recoveries 4.33% 3.16% 3.45% 2.06% 0.99%Deduct: Local Reinsurance Share 0.00% 0.00% 0.00% 0.00% 0.00%Deduct: Foreign Reinsurance Share 0.16% 0.08% 0.20% 1.34% 0.52%Cost of Claims Incurred 0.24% 0.04% 0.19% -0.04% 0.72%
Commission Received 0.12% 0.03% 0.09% 0.08% 0.08%Issuing Fees 1.37% 0.02% 0.06% 0.25% 0.25%Total Revenues 1.29% 0.49% 0.93% 0.74% 0.08%
Commission Paid 0.00% 0.00% 0.00% 0.00% 0.00%Total Expenses 0.42% 0.09% 0.15% 0.23% 0.23%
Underwriting Profit (Loss) 6.86% 6.84% 152.91% 5.94% -0.59%
مجموعة االهلي لألسواق املالية واإلستثماراتAhli Capital Markets & Investments Group
Dislcosure: Please Refer to the important disclaimer at the back of this report Issue Date24
Mar. 2013
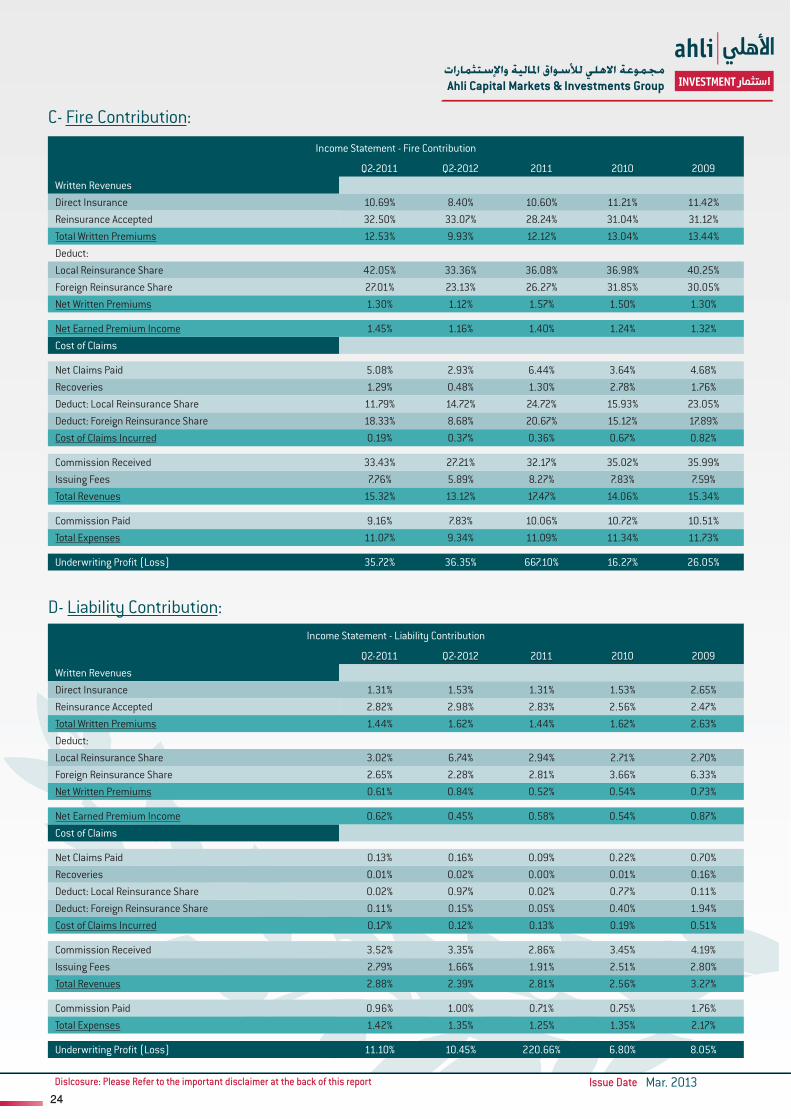
C- Fire Contribution:
Income Statement - Fire Contribution
Q2-2011 Q2-2012 2011 2010 2009Written RevenuesDirect Insurance 10.69% 8.40% 10.60% 11.21% 11.42%Reinsurance Accepted 32.50% 33.07% 28.24% 31.04% 31.12%Total Written Premiums 12.53% 9.93% 12.12% 13.04% 13.44%Deduct:Local Reinsurance Share 42.05% 33.36% 36.08% 36.98% 40.25%Foreign Reinsurance Share 27.01% 23.13% 26.27% 31.85% 30.05%Net Written Premiums 1.30% 1.12% 1.57% 1.50% 1.30%
Net Earned Premium Income 1.45% 1.16% 1.40% 1.24% 1.32%Cost of Claims
Net Claims Paid 5.08% 2.93% 6.44% 3.64% 4.68%Recoveries 1.29% 0.48% 1.30% 2.78% 1.76%Deduct: Local Reinsurance Share 11.79% 14.72% 24.72% 15.93% 23.05%Deduct: Foreign Reinsurance Share 18.33% 8.68% 20.67% 15.12% 17.89%Cost of Claims Incurred 0.19% 0.37% 0.36% 0.67% 0.82%
Commission Received 33.43% 27.21% 32.17% 35.02% 35.99%Issuing Fees 7.76% 5.89% 8.27% 7.83% 7.59%Total Revenues 15.32% 13.12% 17.47% 14.06% 15.34%
Commission Paid 9.16% 7.83% 10.06% 10.72% 10.51%Total Expenses 11.07% 9.34% 11.09% 11.34% 11.73%
Underwriting Profit (Loss) 35.72% 36.35% 667.10% 16.27% 26.05%
D- Liability Contribution:Income Statement - Liability Contribution
Q2-2011 Q2-2012 2011 2010 2009Written RevenuesDirect Insurance 1.31% 1.53% 1.31% 1.53% 2.65%Reinsurance Accepted 2.82% 2.98% 2.83% 2.56% 2.47%Total Written Premiums 1.44% 1.62% 1.44% 1.62% 2.63%Deduct:Local Reinsurance Share 3.02% 6.74% 2.94% 2.71% 2.70%Foreign Reinsurance Share 2.65% 2.28% 2.81% 3.66% 6.33%Net Written Premiums 0.61% 0.84% 0.52% 0.54% 0.73%
Net Earned Premium Income 0.62% 0.45% 0.58% 0.54% 0.87%Cost of Claims
Net Claims Paid 0.13% 0.16% 0.09% 0.22% 0.70%Recoveries 0.01% 0.02% 0.00% 0.01% 0.16%Deduct: Local Reinsurance Share 0.02% 0.97% 0.02% 0.77% 0.11%Deduct: Foreign Reinsurance Share 0.11% 0.15% 0.05% 0.40% 1.94%Cost of Claims Incurred 0.17% 0.12% 0.13% 0.19% 0.51%
Commission Received 3.52% 3.35% 2.86% 3.45% 4.19%Issuing Fees 2.79% 1.66% 1.91% 2.51% 2.80%Total Revenues 2.88% 2.39% 2.81% 2.56% 3.27%
Commission Paid 0.96% 1.00% 0.71% 0.75% 1.76%Total Expenses 1.42% 1.35% 1.25% 1.35% 2.17%
Underwriting Profit (Loss) 11.10% 10.45% 220.66% 6.80% 8.05%
مجموعة االهلي لألسواق املالية واإلستثماراتAhli Capital Markets & Investments Group
Dislcosure: Please Refer to the important disclaimer at the back of this report Issue Date25
Mar. 2013
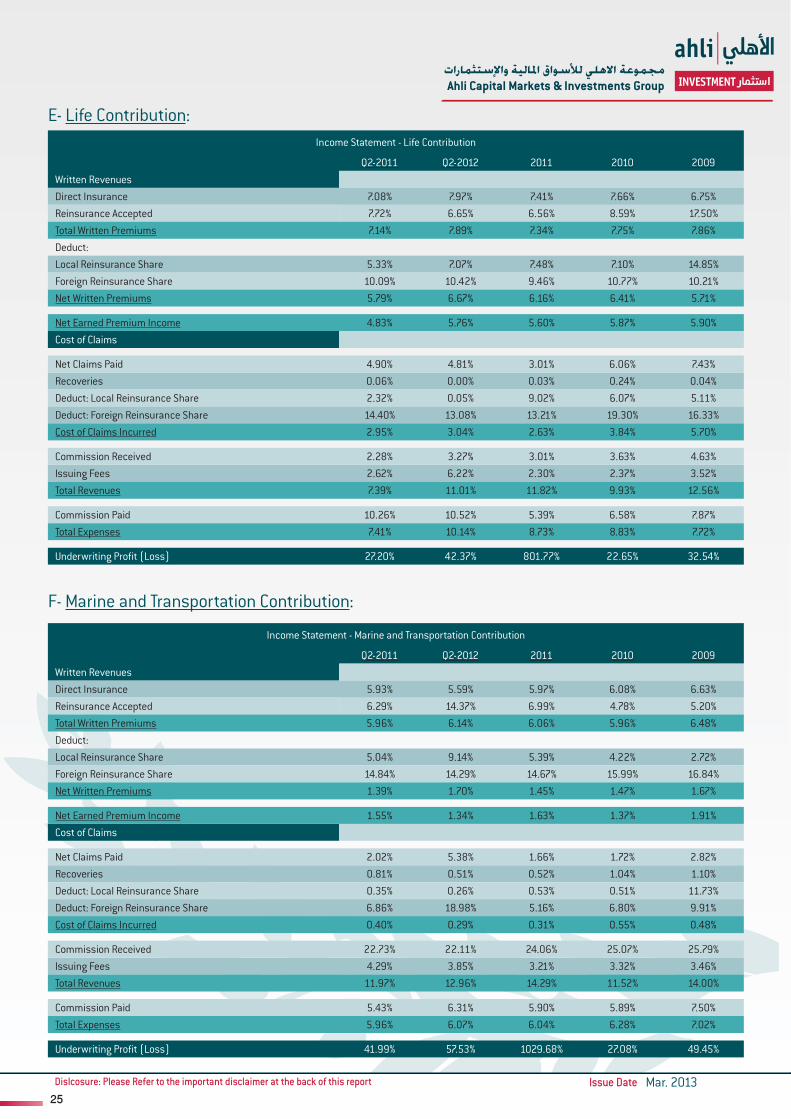
E- Life Contribution:Income Statement - Life Contribution
Q2-2011 Q2-2012 2011 2010 2009Written RevenuesDirect Insurance 7.08% 7.97% 7.41% 7.66% 6.75%Reinsurance Accepted 7.72% 6.65% 6.56% 8.59% 17.50%Total Written Premiums 7.14% 7.89% 7.34% 7.75% 7.86%Deduct:Local Reinsurance Share 5.33% 7.07% 7.48% 7.10% 14.85%Foreign Reinsurance Share 10.09% 10.42% 9.46% 10.77% 10.21%Net Written Premiums 5.79% 6.67% 6.16% 6.41% 5.71%
Net Earned Premium Income 4.83% 5.76% 5.60% 5.87% 5.90%Cost of Claims
Net Claims Paid 4.90% 4.81% 3.01% 6.06% 7.43%Recoveries 0.06% 0.00% 0.03% 0.24% 0.04%Deduct: Local Reinsurance Share 2.32% 0.05% 9.02% 6.07% 5.11%Deduct: Foreign Reinsurance Share 14.40% 13.08% 13.21% 19.30% 16.33%Cost of Claims Incurred 2.95% 3.04% 2.63% 3.84% 5.70%
Commission Received 2.28% 3.27% 3.01% 3.63% 4.63%Issuing Fees 2.62% 6.22% 2.30% 2.37% 3.52%Total Revenues 7.39% 11.01% 11.82% 9.93% 12.56%
Commission Paid 10.26% 10.52% 5.39% 6.58% 7.87%Total Expenses 7.41% 10.14% 8.73% 8.83% 7.72%
Underwriting Profit (Loss) 27.20% 42.37% 801.77% 22.65% 32.54%
F- Marine and Transportation Contribution:
Income Statement - Marine and Transportation Contribution
Q2-2011 Q2-2012 2011 2010 2009Written RevenuesDirect Insurance 5.93% 5.59% 5.97% 6.08% 6.63%Reinsurance Accepted 6.29% 14.37% 6.99% 4.78% 5.20%Total Written Premiums 5.96% 6.14% 6.06% 5.96% 6.48%Deduct:Local Reinsurance Share 5.04% 9.14% 5.39% 4.22% 2.72%Foreign Reinsurance Share 14.84% 14.29% 14.67% 15.99% 16.84%Net Written Premiums 1.39% 1.70% 1.45% 1.47% 1.67%
Net Earned Premium Income 1.55% 1.34% 1.63% 1.37% 1.91%Cost of Claims
Net Claims Paid 2.02% 5.38% 1.66% 1.72% 2.82%Recoveries 0.81% 0.51% 0.52% 1.04% 1.10%Deduct: Local Reinsurance Share 0.35% 0.26% 0.53% 0.51% 11.73%Deduct: Foreign Reinsurance Share 6.86% 18.98% 5.16% 6.80% 9.91%Cost of Claims Incurred 0.40% 0.29% 0.31% 0.55% 0.48%
Commission Received 22.73% 22.11% 24.06% 25.07% 25.79%Issuing Fees 4.29% 3.85% 3.21% 3.32% 3.46%Total Revenues 11.97% 12.96% 14.29% 11.52% 14.00%
Commission Paid 5.43% 6.31% 5.90% 5.89% 7.50%Total Expenses 5.96% 6.07% 6.04% 6.28% 7.02%
Underwriting Profit (Loss) 41.99% 57.53% 1029.68% 27.08% 49.45%
مجموعة االهلي لألسواق املالية واإلستثماراتAhli Capital Markets & Investments Group
Dislcosure: Please Refer to the important disclaimer at the back of this report Issue Date26
Mar. 2013
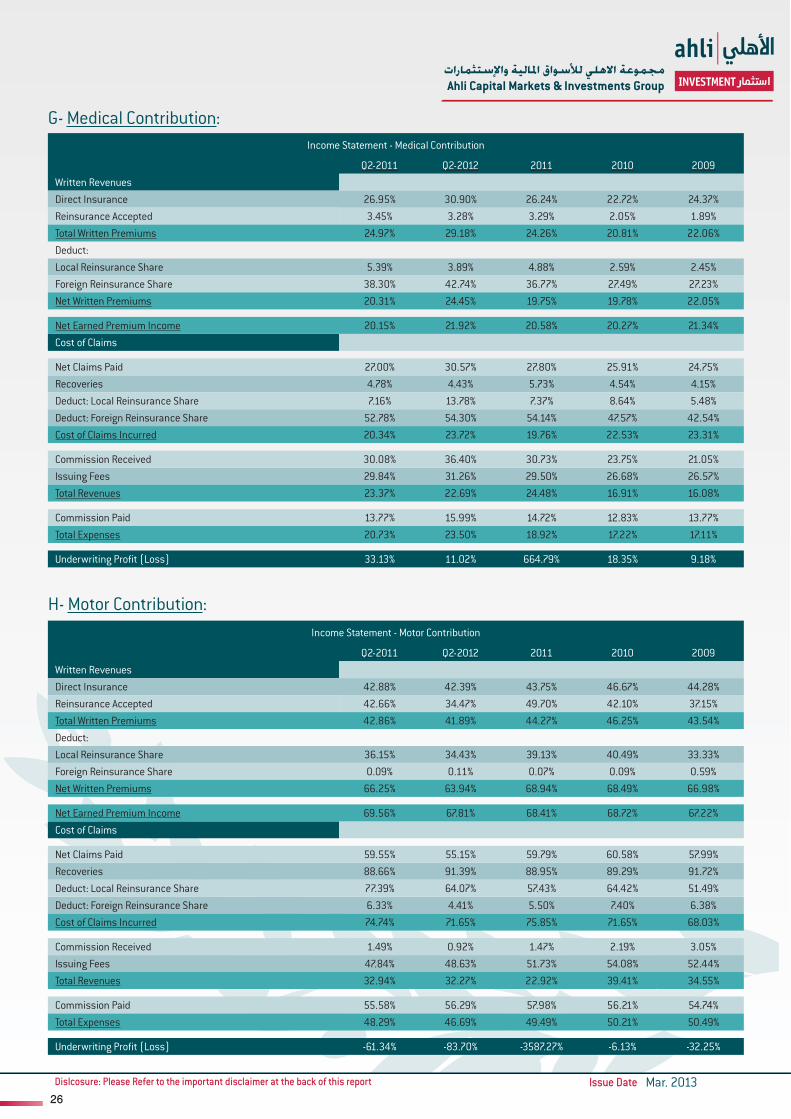
G- Medical Contribution:Income Statement - Medical Contribution
Q2-2011 Q2-2012 2011 2010 2009Written RevenuesDirect Insurance 26.95% 30.90% 26.24% 22.72% 24.37%Reinsurance Accepted 3.45% 3.28% 3.29% 2.05% 1.89%Total Written Premiums 24.97% 29.18% 24.26% 20.81% 22.06%Deduct:Local Reinsurance Share 5.39% 3.89% 4.88% 2.59% 2.45%Foreign Reinsurance Share 38.30% 42.74% 36.77% 27.49% 27.23%Net Written Premiums 20.31% 24.45% 19.75% 19.78% 22.05%
Net Earned Premium Income 20.15% 21.92% 20.58% 20.27% 21.34%Cost of Claims
Net Claims Paid 27.00% 30.57% 27.80% 25.91% 24.75%Recoveries 4.78% 4.43% 5.73% 4.54% 4.15%Deduct: Local Reinsurance Share 7.16% 13.78% 7.37% 8.64% 5.48%Deduct: Foreign Reinsurance Share 52.78% 54.30% 54.14% 47.57% 42.54%Cost of Claims Incurred 20.34% 23.72% 19.76% 22.53% 23.31%
Commission Received 30.08% 36.40% 30.73% 23.75% 21.05%Issuing Fees 29.84% 31.26% 29.50% 26.68% 26.57%Total Revenues 23.37% 22.69% 24.48% 16.91% 16.08%
Commission Paid 13.77% 15.99% 14.72% 12.83% 13.77%Total Expenses 20.73% 23.50% 18.92% 17.22% 17.11%
Underwriting Profit (Loss) 33.13% 11.02% 664.79% 18.35% 9.18%
H- Motor Contribution:Income Statement - Motor Contribution
Q2-2011 Q2-2012 2011 2010 2009Written RevenuesDirect Insurance 42.88% 42.39% 43.75% 46.67% 44.28%Reinsurance Accepted 42.66% 34.47% 49.70% 42.10% 37.15%Total Written Premiums 42.86% 41.89% 44.27% 46.25% 43.54%Deduct:Local Reinsurance Share 36.15% 34.43% 39.13% 40.49% 33.33%Foreign Reinsurance Share 0.09% 0.11% 0.07% 0.09% 0.59%Net Written Premiums 66.25% 63.94% 68.94% 68.49% 66.98%
Net Earned Premium Income 69.56% 67.81% 68.41% 68.72% 67.22%Cost of Claims
Net Claims Paid 59.55% 55.15% 59.79% 60.58% 57.99%Recoveries 88.66% 91.39% 88.95% 89.29% 91.72%Deduct: Local Reinsurance Share 77.39% 64.07% 57.43% 64.42% 51.49%Deduct: Foreign Reinsurance Share 6.33% 4.41% 5.50% 7.40% 6.38%Cost of Claims Incurred 74.74% 71.65% 75.85% 71.65% 68.03%
Commission Received 1.49% 0.92% 1.47% 2.19% 3.05%Issuing Fees 47.84% 48.63% 51.73% 54.08% 52.44%Total Revenues 32.94% 32.27% 22.92% 39.41% 34.55%
Commission Paid 55.58% 56.29% 57.98% 56.21% 54.74%Total Expenses 48.29% 46.69% 49.49% 50.21% 50.49%
Underwriting Profit (Loss) -61.34% -83.70% -3587.27% -6.13% -32.25%
مجموعة االهلي لألسواق املالية واإلستثماراتAhli Capital Markets & Investments Group
Dislcosure: Please Refer to the important disclaimer at the back of this report Issue Date27
Mar. 2013
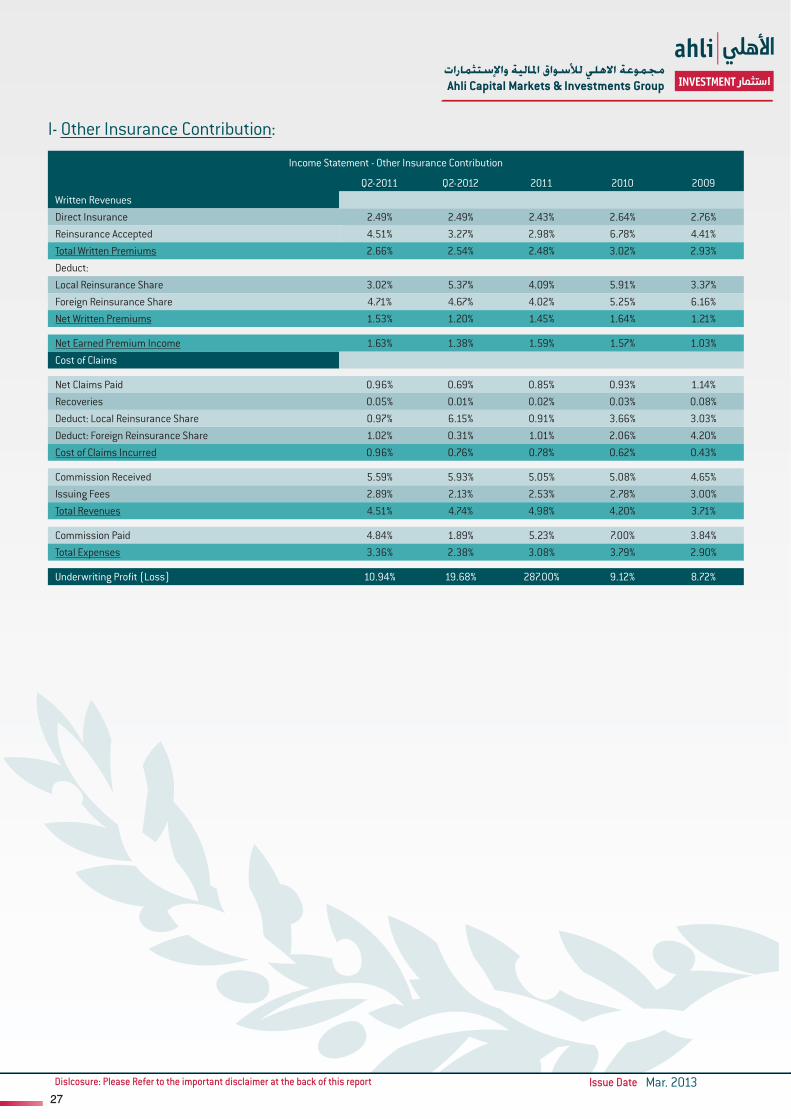
I- Other Insurance Contribution:
Income Statement - Other Insurance Contribution
Q2-2011 Q2-2012 2011 2010 2009Written RevenuesDirect Insurance 2.49% 2.49% 2.43% 2.64% 2.76%Reinsurance Accepted 4.51% 3.27% 2.98% 6.78% 4.41%Total Written Premiums 2.66% 2.54% 2.48% 3.02% 2.93%Deduct:Local Reinsurance Share 3.02% 5.37% 4.09% 5.91% 3.37%Foreign Reinsurance Share 4.71% 4.67% 4.02% 5.25% 6.16%Net Written Premiums 1.53% 1.20% 1.45% 1.64% 1.21%
Net Earned Premium Income 1.63% 1.38% 1.59% 1.57% 1.03%Cost of Claims
Net Claims Paid 0.96% 0.69% 0.85% 0.93% 1.14%Recoveries 0.05% 0.01% 0.02% 0.03% 0.08%Deduct: Local Reinsurance Share 0.97% 6.15% 0.91% 3.66% 3.03%Deduct: Foreign Reinsurance Share 1.02% 0.31% 1.01% 2.06% 4.20%Cost of Claims Incurred 0.96% 0.76% 0.78% 0.62% 0.43%
Commission Received 5.59% 5.93% 5.05% 5.08% 4.65%Issuing Fees 2.89% 2.13% 2.53% 2.78% 3.00%Total Revenues 4.51% 4.74% 4.98% 4.20% 3.71%
Commission Paid 4.84% 1.89% 5.23% 7.00% 3.84%Total Expenses 3.36% 2.38% 3.08% 3.79% 2.90%
Underwriting Profit (Loss) 10.94% 19.68% 287.00% 9.12% 8.72%
مجموعة االهلي لألسواق املالية واإلستثماراتAhli Capital Markets & Investments Group
Dislcosure: Please Refer to the important disclaimer at the back of this report Issue Date28
Mar. 2013
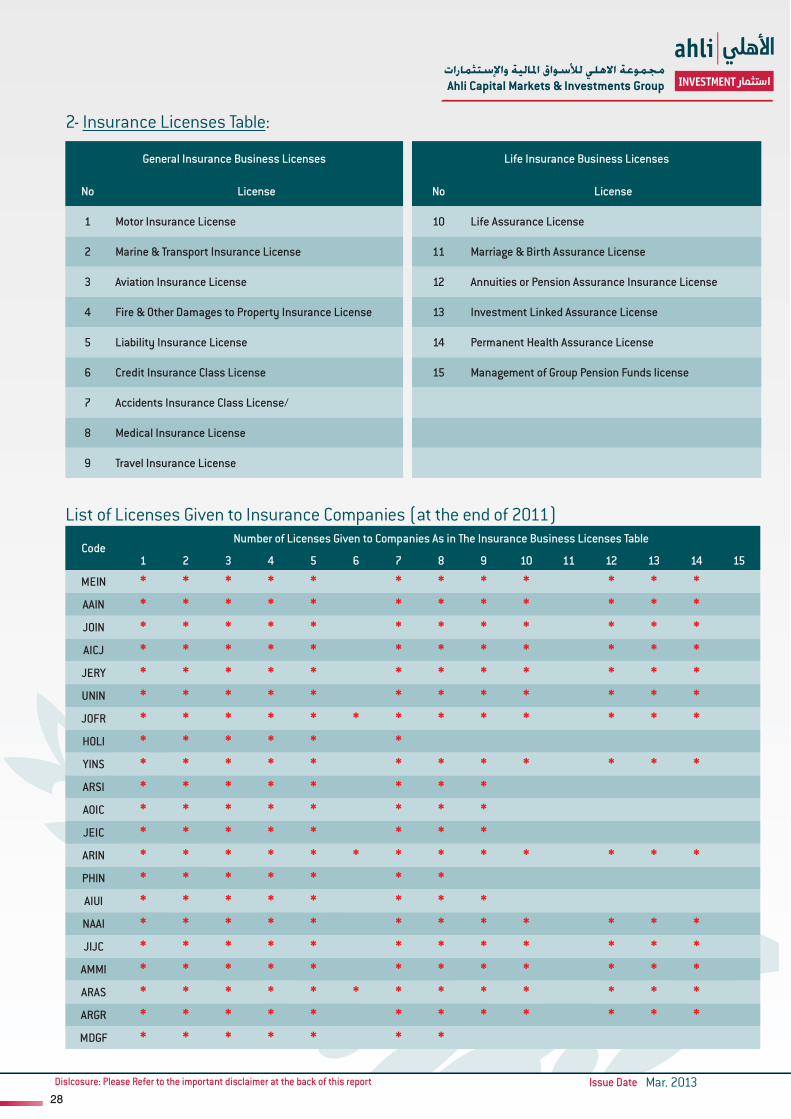
2- Insurance Licenses Table:
General Insurance Business Licenses Life Insurance Business Licenses
No License No License
1 Motor Insurance License 10 Life Assurance License
2 Marine & Transport Insurance License 11 Marriage & Birth Assurance License
3 Aviation Insurance License 12 Annuities or Pension Assurance Insurance License
4 Fire & Other Damages to Property Insurance License 13 Investment Linked Assurance License
5 Liability Insurance License 14 Permanent Health Assurance License
6 Credit Insurance Class License 15 Management of Group Pension Funds license
7 Accidents Insurance Class License/
8 Medical Insurance License
9 Travel Insurance License
List of Licenses Given to Insurance Companies (at the end of 2011)
CodeNumber of Licenses Given to Companies As in The Insurance Business Licenses Table
1 2 3 4 5 6 7 8 9 10 11 12 13 14 15
MEIN * * * * * * * * * * * *AAIN * * * * * * * * * * * *JOIN * * * * * * * * * * * *AICJ * * * * * * * * * * * *JERY * * * * * * * * * * * *UNIN * * * * * * * * * * * *JOFR * * * * * * * * * * * * *HOLI * * * * * *YINS * * * * * * * * * * * *ARSI * * * * * * * *AOIC * * * * * * * *JEIC * * * * * * * *ARIN * * * * * * * * * * * * *PHIN * * * * * * *AIUI * * * * * * * *NAAI * * * * * * * * * * * *JIJC * * * * * * * * * * * *
AMMI * * * * * * * * * * * *ARAS * * * * * * * * * * * * *ARGR * * * * * * * * * * * *MDGF * * * * * * *
مجموعة االهلي لألسواق املالية واإلستثماراتAhli Capital Markets & Investments Group
Dislcosure: Please Refer to the important disclaimer at the back of this report Issue Date29
Mar. 2013
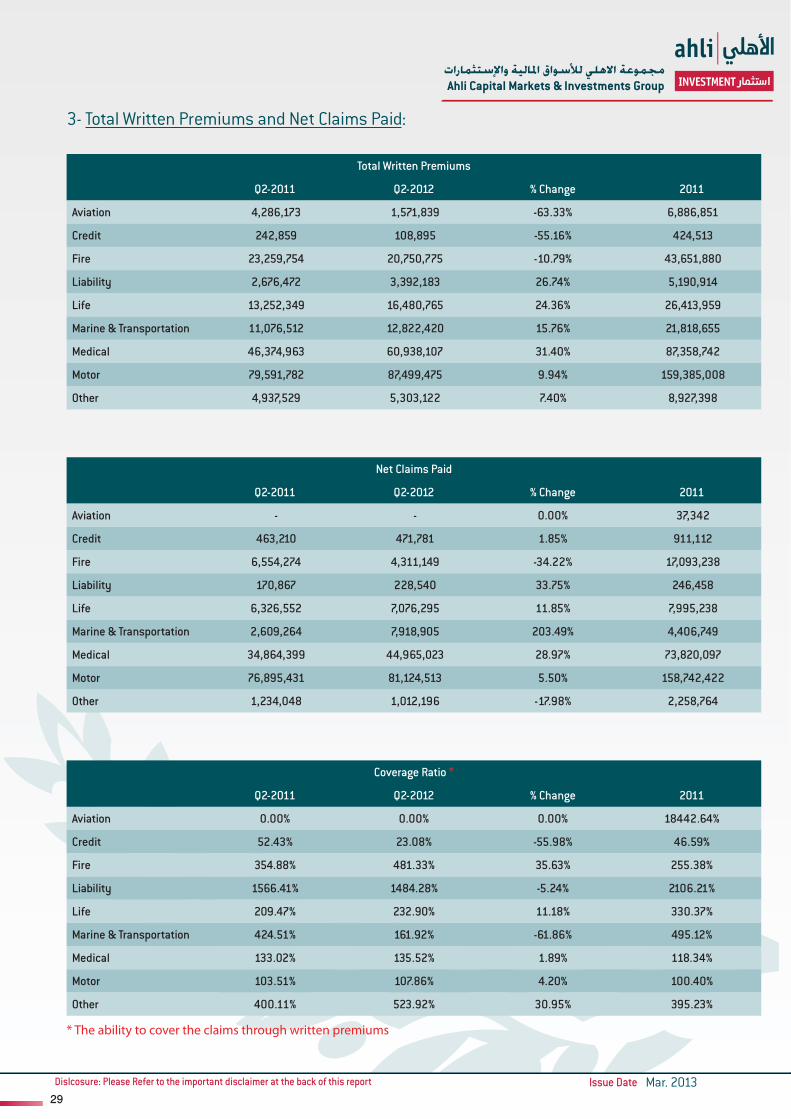
3- Total Written Premiums and Net Claims Paid:
Total Written Premiums
Q2-2011 Q2-2012 % Change 2011
Aviation 4,286,173 1,571,839 -63.33% 6,886,851
Credit 242,859 108,895 -55.16% 424,513
Fire 23,259,754 20,750,775 -10.79% 43,651,880
Liability 2,676,472 3,392,183 26.74% 5,190,914
Life 13,252,349 16,480,765 24.36% 26,413,959
Marine & Transportation 11,076,512 12,822,420 15.76% 21,818,655
Medical 46,374,963 60,938,107 31.40% 87,358,742
Motor 79,591,782 87,499,475 9.94% 159,385,008
Other 4,937,529 5,303,122 7.40% 8,927,398
Net Claims Paid
Q2-2011 Q2-2012 % Change 2011
Aviation - - 0.00% 37,342
Credit 463,210 471,781 1.85% 911,112
Fire 6,554,274 4,311,149 -34.22% 17,093,238
Liability 170,867 228,540 33.75% 246,458
Life 6,326,552 7,076,295 11.85% 7,995,238
Marine & Transportation 2,609,264 7,918,905 203.49% 4,406,749
Medical 34,864,399 44,965,023 28.97% 73,820,097
Motor 76,895,431 81,124,513 5.50% 158,742,422
Other 1,234,048 1,012,196 -17.98% 2,258,764
Coverage Ratio *
Q2-2011 Q2-2012 % Change 2011
Aviation 0.00% 0.00% 0.00% 18442.64%
Credit 52.43% 23.08% -55.98% 46.59%
Fire 354.88% 481.33% 35.63% 255.38%
Liability 1566.41% 1484.28% -5.24% 2106.21%
Life 209.47% 232.90% 11.18% 330.37%
Marine & Transportation 424.51% 161.92% -61.86% 495.12%
Medical 133.02% 135.52% 1.89% 118.34%
Motor 103.51% 107.86% 4.20% 100.40%
Other 400.11% 523.92% 30.95% 395.23%
* The ability to cover the claims through written premiums
مجموعة االهلي لألسواق املالية واإلستثماراتAhli Capital Markets & Investments Group
Dislcosure: Please Refer to the important disclaimer at the back of this report Issue Date30
Mar. 2013
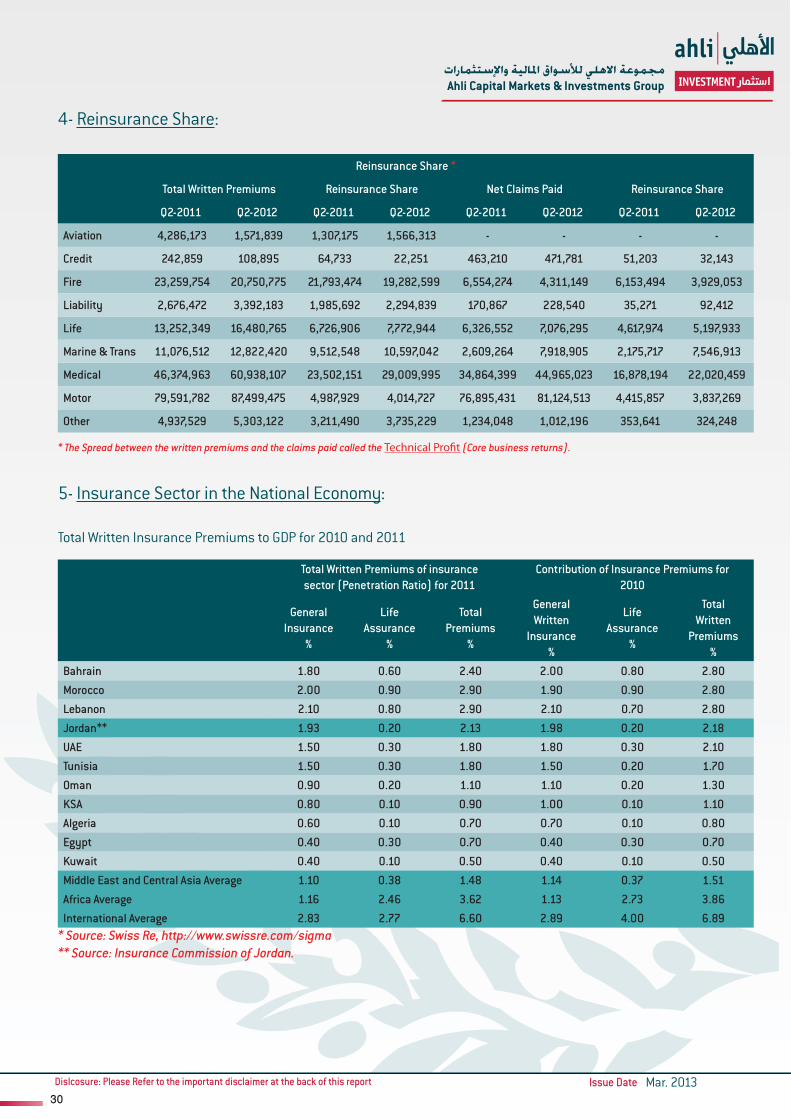
4- Reinsurance Share:
Reinsurance Share *
Total Written Premiums Reinsurance Share Net Claims Paid Reinsurance Share
Q2-2011 Q2-2012 Q2-2011 Q2-2012 Q2-2011 Q2-2012 Q2-2011 Q2-2012
Aviation 4,286,173 1,571,839 1,307,175 1,566,313 - - - -
Credit 242,859 108,895 64,733 22,251 463,210 471,781 51,203 32,143
Fire 23,259,754 20,750,775 21,793,474 19,282,599 6,554,274 4,311,149 6,153,494 3,929,053
Liability 2,676,472 3,392,183 1,985,692 2,294,839 170,867 228,540 35,271 92,412
Life 13,252,349 16,480,765 6,726,906 7,772,944 6,326,552 7,076,295 4,617,974 5,197,933
Marine & Trans 11,076,512 12,822,420 9,512,548 10,597,042 2,609,264 7,918,905 2,175,717 7,546,913
Medical 46,374,963 60,938,107 23,502,151 29,009,995 34,864,399 44,965,023 16,878,194 22,020,459
Motor 79,591,782 87,499,475 4,987,929 4,014,727 76,895,431 81,124,513 4,415,857 3,837,269
Other 4,937,529 5,303,122 3,211,490 3,735,229 1,234,048 1,012,196 353,641 324,248
* The Spread between the written premiums and the claims paid called the Technical Profit (Core business returns).
5- Insurance Sector in the National Economy:
Total Written Insurance Premiums to GDP for 2010 and 2011
Total Written Premiums of insurancesector (Penetration Ratio) for 2011
Contribution of Insurance Premiums for2010
GeneralInsurance
%
LifeAssurance
%
TotalPremiums
%
GeneralWritten
Insurance%
LifeAssurance
%
TotalWritten
Premiums%
Bahrain 1.80 0.60 2.40 2.00 0.80 2.80Morocco 2.00 0.90 2.90 1.90 0.90 2.80Lebanon 2.10 0.80 2.90 2.10 0.70 2.80Jordan** 1.93 0.20 2.13 1.98 0.20 2.18UAE 1.50 0.30 1.80 1.80 0.30 2.10Tunisia 1.50 0.30 1.80 1.50 0.20 1.70Oman 0.90 0.20 1.10 1.10 0.20 1.30KSA 0.80 0.10 0.90 1.00 0.10 1.10Algeria 0.60 0.10 0.70 0.70 0.10 0.80Egypt 0.40 0.30 0.70 0.40 0.30 0.70Kuwait 0.40 0.10 0.50 0.40 0.10 0.50Middle East and Central Asia Average 1.10 0.38 1.48 1.14 0.37 1.51Africa Average 1.16 2.46 3.62 1.13 2.73 3.86International Average 2.83 2.77 6.60 2.89 4.00 6.89
* Source: Swiss Re, http://www.swissre.com/sigma** Source: Insurance Commission of Jordan.
مجموعة االهلي لألسواق املالية واإلستثماراتAhli Capital Markets & Investments Group
Dislcosure: Please Refer to the important disclaimer at the back of this report Issue Date31
Mar. 2013
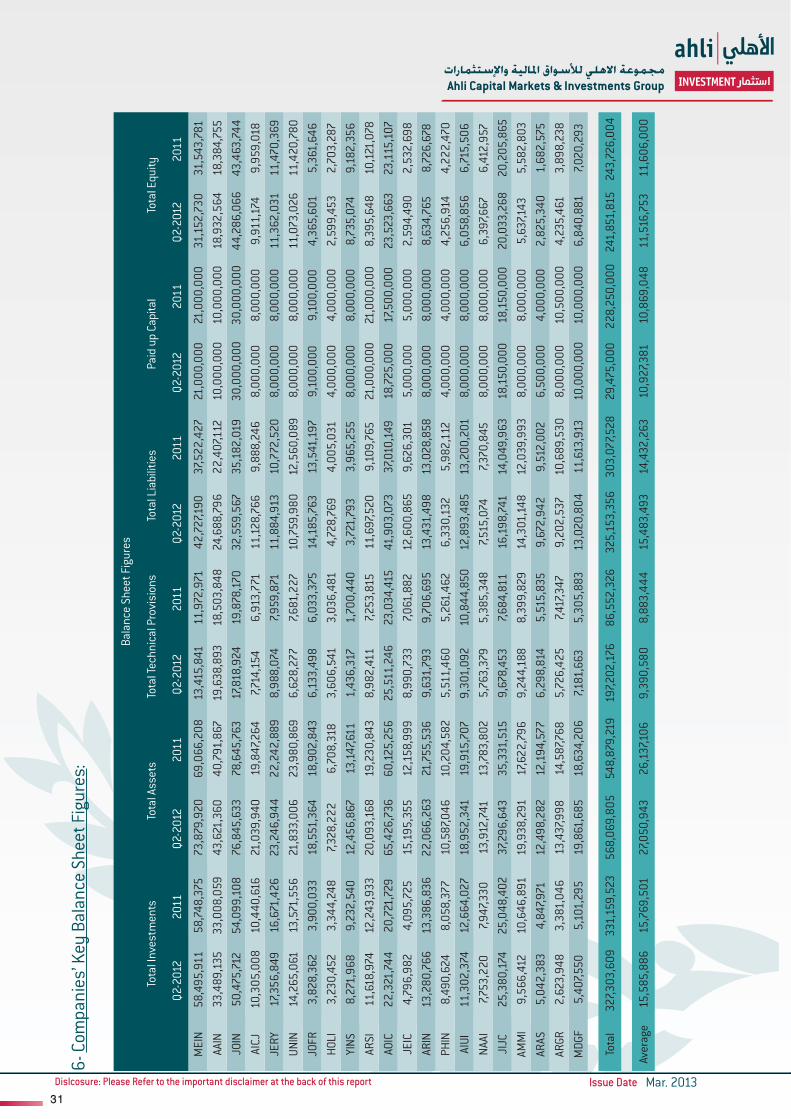
6- C
ompa
nies
’ Key
Bal
ance
She
et F
igur
es:
Bala
nce
Shee
t Fig
ures
Tota
l Inv
estm
ents
Tota
l Ass
ets
Tota
l Tec
hnic
al P
rovi
sion
sTo
tal L
iabi
litie
sPa
id u
p Ca
pita
lTo
tal E
quity
Q2-2
012
2011
Q2-2
012
2011
Q2-2
012
2011
Q2-2
012
2011
Q2-2
012
2011
Q2-2
012
2011
MEI
N 5
8,49
5,91
1 5
8,74
8,37
5 7
3,87
9,92
0 6
9,06
6,20
8 1
3,41
5,84
1 1
1,97
2,97
1 4
2,72
7,190
3
7,522
,427
21
,000
,000
21
,000
,000
3
1,15
2,73
0 3
1,54
3,78
1 AA
IN 3
3,48
9,13
5 3
3,00
8,05
9 4
3,62
1,36
0 4
0,79
1,86
7 1
9,63
8,89
3 1
8,50
3,84
8 2
4,68
8,79
6 2
2,40
7,112
1
0,00
0,00
0 1
0,00
0,00
0 1
8,93
2,56
4 1
8,38
4,75
5 JO
IN 5
0,47
5,71
2 5
4,09
9,10
8 7
6,84
5,63
3 7
8,64
5,76
3 1
7,818
,924
1
9,87
8,17
0 3
2,55
9,56
7 3
5,18
2,01
9 3
0,00
0,00
0 3
0,00
0,00
0 4
4,28
6,06
6 4
3,46
3,74
4 AI
CJ 1
0,30
5,00
8 1
0,44
0,61
6 21
,039
,940
1
9,84
7,264
7,
714,
154
6,9
13,7
71
11,
128,
766
9,8
88,2
46
8,0
00,0
00
8,0
00,0
00
9,9
11,17
4 9
,959
,018
JE
RY 1
7,356
,849
1
6,67
1,42
6 2
3,24
6,94
4 2
2,24
2,88
9 8
,988
,074
7,
959,
871
11,
884,
913
10,
772,
520
8,0
00,0
00
8,0
00,0
00
11,
362,
031
11,
470,
369
UNIN
14,
265,
061
13,
571,
556
21,8
33,0
06
23,
980,
869
6,6
28,2
77
7,68
1,22
7 1
0,75
9,98
0 1
2,56
0,08
9 8
,000
,000
8
,000
,000
1
1,07
3,02
6 1
1,42
0,78
0 JO
FR 3
,828
,362
3
,900
,033
1
8,55
1,36
4 1
8,90
2,84
3 6
,133
,498
6
,033
,375
1
4,18
5,76
3 1
3,54
1,19
7 9
,100
,000
9
,100
,000
4
,365
,601
5
,361
,646
HO
LI 3
,230
,452
3
,344
,248
7,
328,
222
6,7
08,3
18
3,6
06,5
41
3,0
36,4
81
4,7
28,7
69
4,0
05,0
31
4,0
00,0
00
4,0
00,0
00
2,5
99,4
53
2,7
03,2
87
YINS
8,2
71,9
68
9,2
32,5
40
12,
456,
867
13,
147,6
11
1,4
36,3
17
1,7
00,4
40
3,7
21,7
93
3,9
65,2
55
8,0
00,0
00
8,0
00,0
00
8,7
35,0
74
9,1
82,3
56
ARSI
11,
618,
974
12,
243,
933
20,
093,
168
19,
230,
843
8,9
82,4
11
7,25
3,81
5 1
1,69
7,520
9
,109
,765
21
,000
,000
21
,000
,000
8
,395
,648
1
0,12
1,07
8 AO
IC 2
2,32
1,74
4 2
0,72
1,72
9 6
5,42
6,73
6 6
0,12
5,25
6 2
5,51
1,24
6 2
3,03
4,41
5 4
1,90
3,07
3 3
7,010
,149
1
8,72
5,00
0 1
7,500
,000
2
3,52
3,66
3 2
3,11
5,10
7 JE
IC 4
,796
,982
4
,095
,725
1
5,19
5,35
5 1
2,15
8,99
9 8
,990
,733
7,
061,
882
12,
600,
865
9,6
26,3
01
5,0
00,0
00
5,0
00,0
00
2,5
94,4
90
2,5
32,6
98
ARIN
13,
280,
766
13,
386,
836
22,
066,
263
21,7
55,5
36
9,6
31,7
93
9,7
06,6
95
13,
431,
498
13,
028,
858
8,0
00,0
00
8,0
00,0
00
8,6
34,7
65
8,7
26,6
78
PHIN
8,4
90,6
24
8,0
58,3
77
10,
587,0
46
10,
204,
582
5,5
11,4
60
5,2
61,4
62
6,3
30,1
32
5,9
82,1
12
4,0
00,0
00
4,0
00,0
00
4,2
56,9
14
4,2
22,4
70
AIUI
11,
302,
374
12,
664,
027
18,
952,
341
19,
915,
707
9,3
01,0
92
10,
844,
850
12,
893,
485
13,
200,
201
8,0
00,0
00
8,0
00,0
00
6,0
58,8
56
6,71
5,50
6 NA
AI 7,
753,
220
7,94
7,330
1
3,91
2,74
1 1
3,78
3,80
2 5
,763
,379
5
,385
,348
7,
515,
074
7,37
0,84
5 8
,000
,000
8
,000
,000
6
,397
,667
6
,412
,957
JI
JC 2
5,38
0,17
4 2
5,04
8,40
2 3
7,296
,643
3
5,33
1,51
5 9
,678
,453
7,
684,
811
16,
198,
741
14,
049,
963
18,
150,
000
18,
150,
000
20,
033,
268
20,
205,
865
AMM
I 9
,566
,412
1
0,64
6,89
1 1
9,93
8,29
1 1
7,622
,796
9
,244
,188
8
,399
,829
1
4,30
1,14
8 1
2,03
9,99
3 8
,000
,000
8
,000
,000
5
,637
,143
5
,582
,803
AR
AS 5
,042
,383
4
,847
,971
1
2,49
8,28
2 1
2,19
4,57
7 6
,298
,814
5
,515
,835
9
,672
,942
9
,512
,002
6
,500
,000
4
,000
,000
2
,825
,340
1
,682
,575
AR
GR 2
,623
,948
3
,381
,046
1
3,43
7,998
1
4,58
7,768
5
,726
,425
7,
417,3
47
9,2
02,5
37
10,
689,
530
8,0
00,0
00
10,
500,
000
4,2
35,4
61
3,8
98,2
38
MDG
F 5
,407
,550
5
,101
,295
1
9,86
1,68
5 1
8,63
4,20
6 7,
181,
663
5,3
05,8
83
13,
020,
804
11,
613,
913
10,
000,
000
10,
000,
000
6,8
40,8
81
7,02
0,29
3
Tota
l32
7,303
,609
3
31,1
59,5
23
568
,069
,805
5
48,8
79,2
19
197
,202
,176
86,
552,
326
325
,153
,356
3
03,0
77,5
28
29,
475,
000
228,
250,
000
241,
851,
815
243,
726,
004
Aver
age
15,
585,
886
15,
769,
501
27,0
50,9
43
26,
137,1
06
9,3
90,5
80
8,8
83,4
44
15,
483,
493
14,
432,
263
10,
927,3
81
10,
869,
048
11,
516,
753
11,
606,
000

مجموعة االهلي لألسواق املالية واإلستثماراتAhli Capital Markets & Investments Group
Dislcosure: Please Refer to the important disclaimer at the back of this report Issue Date32
Mar. 2013
7- Sectors’ Expected Net Profits:
Net Profit after Tax Est. *
Q2-2011 Q2-2012 2011 2012
MEIN 568,899 1,165,198 748,508 1,344,807
AAIN 554,595 836,363 762,992 1,044,760
JOIN 3,126,245 1,866,357 2,335,262 1,075,374
AICJ 91,737 187,770 55,309 151,342
JERY 380,221 451,662 839,080 910,521
UNIN 45,618 345,172 273,517 573,071
JOFR (637,738) (922,320) (756,710) (1,041,292)HOLI (441,941) (103,834) (242,951) 95,156
YINS 13,319 (447,282) 155,589 (305,012)
ARSI (1,051,308) (1,671,167) (2,752,840) (3,372,699)
AOIC 1,899,850 1,283,556 3,157,410 2,541,116
JEIC 20,464 63,960 (2,945,845) (2,902,349)ARIN (233,975) 103,317 (244,691) 92,601 PHIN 127,418 78,172 (148,890) (198,136)AIUI (326,975) (656,650) (2,825,841) (3,155,516)NAAI 146,712 11,126 (624,953) (760,539)JIJC 53,842 (191,092) (923,066) (1,168,000)
AMMI (1,443,694) 54,340 (2,870,537) (1,372,503)
ARAS 870,847 207,519 707,379 44,051
ARGR (456,334) (337,214) 592,758 711,878
MDGF (1,058,009) (151,798) (1,806,073) (899,862)
Total 2,249,793 2,173,155 (6,514,593) (6,591,231)* Estimated for the year 2012

مجموعة االهلي لألسواق املالية واإلستثماراتAhli Capital Markets & Investments Group
Dislcosure: Please Refer to the important disclaimer at the back of this report Issue Date33
Mar. 2013
8- S
ecto
rs’ K
ey R
atio
s:
Key
ratio
s
Inve
stm
ents
to A
sset
sAs
sets
to E
quiti
esLi
abili
ties
to E
quiti
esEP
S (J
Ds)
BVPS
(JDs
)RO
ARO
E
Q2-2
012
2011
Q2-2
012
2011
Q2-2
012
2011
Q2-2
012
2011
Q2-2
012
2011
Q2-2
012
2011
Q2-2
012
2011
MEI
N79
.18%
85.0
6%23
7.15%
218.
95%
137%
119%
0.06
0.04
1.48
1.50
1.82
%1.
08%
4.32
%2.
37%
AAIN
76.7
7%80
.92%
230.
40%
221.
88%
130%
122%
0.10
0.08
1.89
1.84
2.40
%1.
87%
5.52
%4.
15%
JOIN
65.6
8%68
.79%
173.
52%
180.
95%
74%
81%
0.04
0.08
1.48
1.45
1.40
%2.
97%
2.43
%5.
37%
AICJ
48.9
8%52
.60%
212.
29%
199.
29%
112%
99%
0.02
0.01
1.24
1.24
0.72
%0.
28%
1.53
%0.
56%
JERY
74.6
6%74
.95%
204.
60%
193.
92%
105%
94%
0.11
0.10
1.42
1.43
3.92
%3.
77%
8.01
%7.3
2%UN
IN65
.34%
56.5
9%19
7.17%
209.
98%
97%
110%
0.07
0.03
1.38
1.43
2.62
%1.
14%
5.18
%2.
39%
JOFR
20.6
4%20
.63%
424.
94%
352.
56%
325%
253%
-0.1
1-0
.08
0.48
0.59
-5.6
1%-4
.00%
-23.
85%
-14.1
1%HO
LI44
.08%
49.8
5%28
1.91
%24
8.15
%18
2%14
8%0.
02-0
.06
0.65
0.68
1.30
%-3
.62%
3.66
%-8
.99%
YINS
66.4
0%70
.22%
142.
61%
143.
18%
43%
43%
-0.0
40.
021.
091.
15-2
.45%
1.18
%-3
.49%
1.69
%AR
SI57
.83%
63.6
7%23
9.33
%19
0.01
%13
9%90
%-0
.16
-0.1
30.
400.
48-1
6.79
%-14
.31%
-40.
17%
-27.2
0%AO
IC34
.12%
34.4
6%27
8.13
%26
0.11
%17
8%16
0%0.
140.
181.
261.
323.
88%
5.25
%10
.80%
13.6
6%JE
IC31
.57%
33.6
8%58
5.68
%48
0.08
%48
6%38
0%-0
.58
-0.5
90.
520.
51-1
9.10
%-2
4.23
%-1
11.8
7%-1
16.3
1%AR
IN60
.19%
61.5
3%25
5.55
%24
9.30
%15
6%14
9%0.
01-0
.03
1.08
1.09
0.42
%-1
.12%
1.07
%-2
.80%
PHIN
80.2
0%78
.97%
248.
70%
241.
67%
149%
142%
-0.0
5-0
.04
1.06
1.06
-1.8
7%-1
.46%
-4.6
5%-3
.53%
AIUI
59.6
4%63
.59%
312.
80%
296.
56%
213%
197%
-0.3
9-0
.35
0.76
0.84
-16.
65%
-14.1
9%-5
2.08
%-4
2.08
%NA
AI55
.73%
57.6
6%21
7.47%
214.
94%
117%
115%
-0.1
0-0
.08
0.80
0.80
-5.4
7%-4
.53%
-11.
89%
-9.7
5%JI
JC68
.05%
70.9
0%18
6.17
%17
4.86
%81
%70
%-0
.06
-0.0
51.
101.
11-3
.13%
-2.6
1%-5
.83%
-4.5
7%AM
MI
47.9
8%60
.42%
353.
69%
315.
66%
254%
216%
-0.17
-0.3
60.
700.
70-6
.88%
-16.
29%
-24.
35%
-51.
42%
ARAS
40.3
4%39
.76%
442.
36%
724.
76%
342%
565%
0.01
0.18
0.43
0.42
0.35
%5.
80%
1.56
%42
.04%
ARGR
19.5
3%23
.18%
317.2
7%37
4.21
%21
7%27
4%0.
090.
060.
530.
375.
30%
4.06
%16
.81%
15.2
1%M
DGF
27.2
3%27
.38%
290.
34%
265.
43%
190%
165%
-0.0
9-0
.18
0.68
0.70
-4.5
3%-9
.69%
-13.1
5%-2
5.73
%
مجموعة االهلي لألسواق املالية واإلستثماراتAhli Capital Markets & Investments Group
Dislcosure: Please Refer to the important disclaimer at the back of this report Issue Date34
Mar. 2013
Sector Glossary ** source: Jordan Insurance Federation
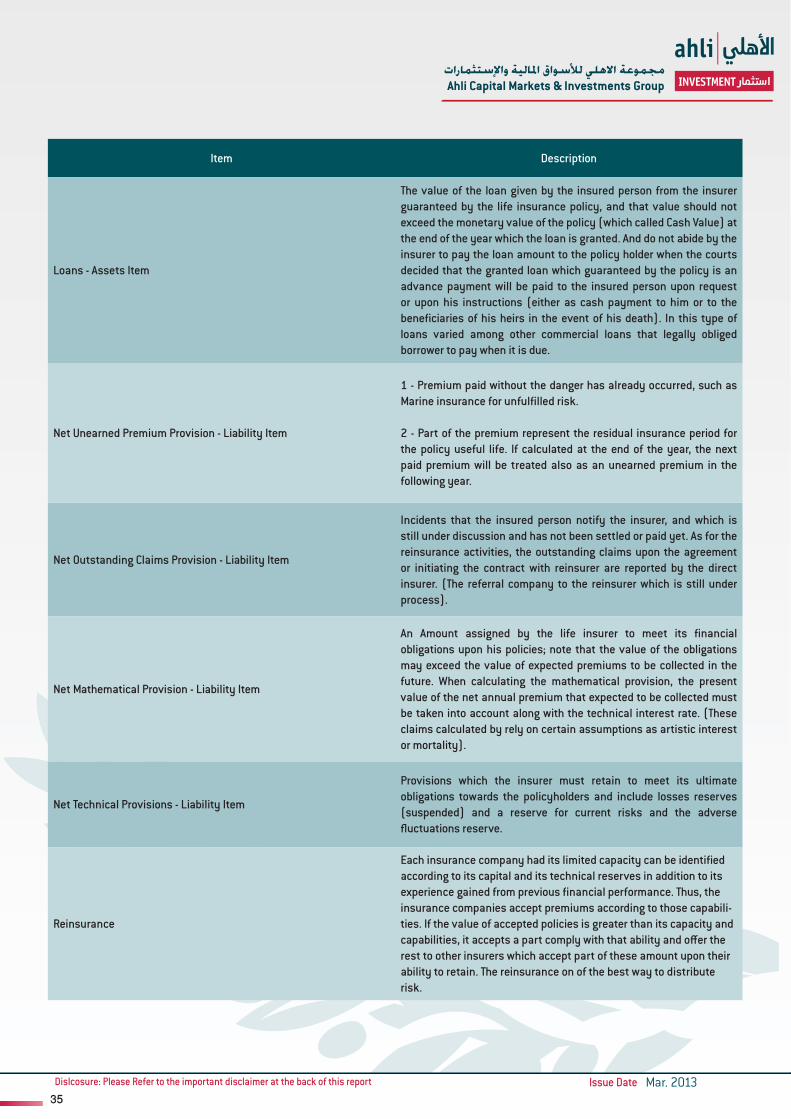
مجموعة االهلي لألسواق املالية واإلستثماراتAhli Capital Markets & Investments Group
Dislcosure: Please Refer to the important disclaimer at the back of this report Issue Date35
Mar. 2013
Item Description
Loans - Assets Item
The value of the loan given by the insured person from the insurer guaranteed by the life insurance policy, and that value should not exceed the monetary value of the policy (which called Cash Value) at the end of the year which the loan is granted. And do not abide by the insurer to pay the loan amount to the policy holder when the courts decided that the granted loan which guaranteed by the policy is an advance payment will be paid to the insured person upon request or upon his instructions (either as cash payment to him or to the beneficiaries of his heirs in the event of his death). In this type of loans varied among other commercial loans that legally obliged borrower to pay when it is due.
Net Unearned Premium Provision - Liability Item
1 - Premium paid without the danger has already occurred, such as Marine insurance for unfulfilled risk.
2 - Part of the premium represent the residual insurance period for the policy useful life. If calculated at the end of the year, the next paid premium will be treated also as an unearned premium in the following year.
Net Outstanding Claims Provision - Liability Item
Incidents that the insured person notify the insurer, and which is still under discussion and has not been settled or paid yet. As for the reinsurance activities, the outstanding claims upon the agreement or initiating the contract with reinsurer are reported by the direct insurer. (The referral company to the reinsurer which is still under process).
Net Mathematical Provision - Liability Item
An Amount assigned by the life insurer to meet its financial obligations upon his policies; note that the value of the obligations may exceed the value of expected premiums to be collected in the future. When calculating the mathematical provision, the present value of the net annual premium that expected to be collected must be taken into account along with the technical interest rate. (These claims calculated by rely on certain assumptions as artistic interest or mortality).
Net Technical Provisions - Liability Item
Provisions which the insurer must retain to meet its ultimate obligations towards the policyholders and include losses reserves (suspended) and a reserve for current risks and the adverse fluctuations reserve.
Reinsurance
Each insurance company had its limited capacity can be identified according to its capital and its technical reserves in addition to its experience gained from previous financial performance. Thus, the insurance companies accept premiums according to those capabili-ties. If the value of accepted policies is greater than its capacity and capabilities, it accepts a part comply with that ability and offer the rest to other insurers which accept part of these amount upon their ability to retain. The reinsurance on of the best way to distribute risk.
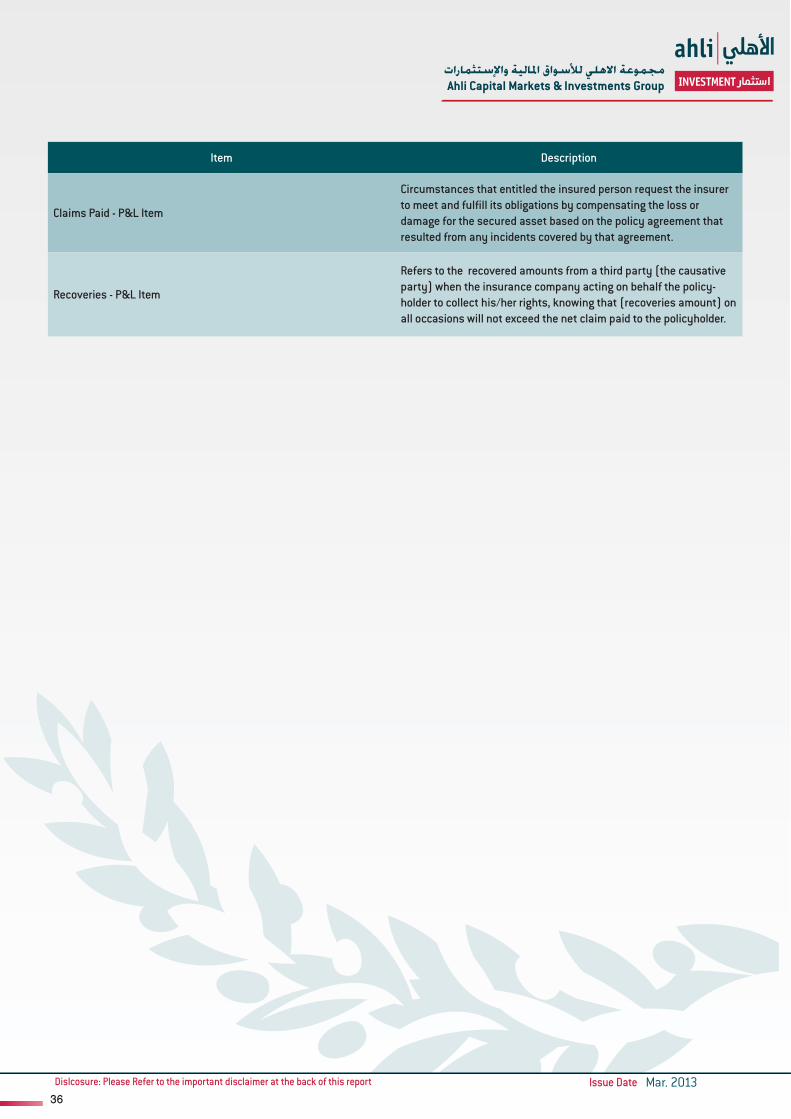
مجموعة االهلي لألسواق املالية واإلستثماراتAhli Capital Markets & Investments Group
Dislcosure: Please Refer to the important disclaimer at the back of this report Issue Date36
Mar. 2013
Item Description
Claims Paid - P&L Item
Circumstances that entitled the insured person request the insurer to meet and fulfill its obligations by compensating the loss or damage for the secured asset based on the policy agreement that resulted from any incidents covered by that agreement.
Recoveries - P&L Item
Refers to the recovered amounts from a third party (the causative party) when the insurance company acting on behalf the policy-holder to collect his/her rights, knowing that (recoveries amount) on all occasions will not exceed the net claim paid to the policyholder.
مجموعة االهلي لألسواق املالية واإلستثماراتAhli Capital Markets & Investments Group
Dislcosure: Please Refer to the important disclaimer at the back of this report Issue Date37
Mar. 2013
Disclaimer:
The financial data contained in this report has been obtained from sources considered by Jordan Ahli Bank to be reliable in all material respects. However, the accuracy, fairness and completeness thereof are not guaranteed by Jordan Ahli Bank and its employees and its third-party suppliers shall have no liability for errors or omissions with respect to the service or its delivery, regardless of the cause or source of such error or omission. This is not an invitation to buy or sell stocks or any debt instruments traded and/or not traded in Amman Stock Exchange (ASE). The Purpose of this report is to provide information and analysis related to the sector and assists readers to obtain information to support their decisions. The reader should not make any investment decision solely based on the information contained in this report and he/she should consult with his/her investment advisor before investing. This report is a copyright of Jordan Ahli Bank and should not be reproduced or redistributed partially or fully in away shape or manner without the express written consent of the Jordan Ahli Bank. www.ahli.com
Contact Us:
Lina N. Bakhit Deputy C.E.O./ Deputy G.M E-mail: [email protected]
Tel.: 4649529 Research & Studies Department
Majed Hejab Rabe Al-Bataineh - Dept. Head Executive Manager E-mail: [email protected] Tel.:5689861/2 / 5689857
Ahli Brokerage Company E-mail: [email protected] Tel.:5624362
E-mail: [email protected].: 5689854 / Ext: 17
Murad HijazeenE-mail: [email protected].: 5689854 / Ext: 28