Insurance Companies and the Growth of Corporate Loans'
66
Insurance Companies and the Growth of Corporate Loans' Securitization Fulvia Fringuellotti | João A. C. Santos NO. 975 AUGUST 2021
Transcript of Insurance Companies and the Growth of Corporate Loans'

Insurance Companies and the Growth of Corporate Loans' Securitization Fulvia Fringuellotti | João A. C. Santos
NO. 975 AUGUST 2021
Insurance Companies and the Growth of Corporate Loans' Securitization Fulvia Fringuellotti and João A. C. Santos Federal Reserve Bank of New York Staff Reports, no. 975 August 2021 JEL classification: G11, G20, G22
Abstract
We show that insurance companies have almost nonupled their investments in collateralized loan obligations (CLOs) in the post-crisis period, reaching total holdings of $125 billion in 2019. The growth in CLOs’ investments has far outpaced that of loans and corporate bonds, and was characterized by a strong preference for mezzanine tranches rated investment grade over triple-A rated tranches. We document that these phenomena reflect a search for yield behavior. Conditional on capital charges, insurance companies invest more heavily in bonds and CLO tranches with higher yields. Preferences for CLO tranches derived from tranches’ higher yields relative to bonds with the same rating, and increased following the 2010 capital regulatory reform, resulting in insurance companies holding more than 40 percent of mezzanine tranches outstanding in 2019. In the process, insurance companies created the demand for the risky tranches that are critical to the CLO issuance. Key words: insurance companies, CLOs, regulatory arbitrage, corporate loans, securitization _________________ Fringuellotti: Federal Reserve Bank of New York (email: [email protected]). Santos: Santos: Federal Reserve Bank of New York, Nova School of Business and Economics (email: [email protected]). The authors thank seminar participants at the University of Zurich for very helpful comments and suggestions. This paper presents preliminary findings and is being distributed to economists and other interested readers solely to stimulate discussion and elicit comments. The views expressed in this paper are those of the author(s) and do not necessarily reflect the position of the Federal Reserve Bank of New York or the Federal Reserve System. Any errors or omissions are the responsibility of the author(s).
To view the authors’ disclosure statements, visit https://www.newyorkfed.org/research/staff_reports/sr975.html.

1 Introduction
There has been an extraordinary growth of collateralized loan obligations (CLOs) over
the last decade. U.S. CLO issuance increased by a factor of thirteen in the post crisis-
decade, with the volume outstanding CLOs more than doubling and reaching almost
$647B by 2019 (Figure 1-2).1 This growth has caught the attention of researchers who
have investigated its impact on such things as the cost and risk of corporate loans, the
amplification of credit cycles, and the stability of the financial system.2
However, to date little attention has been devoted to the drivers of that phe-
nomenon. That is the subject of this paper. We are particularly interested in under-
standing the role that insurance companies have played in the growth of corporate loans’
securitization and identify the key factors behind that role.
We begin by analysing the investment behavior of insurance companies towards
fixed-income securities related to non-financial corporate debt. We focus on investments
in CLO tranches, corporate bonds and bank loans. We document that insurance com-
panies have almost nonupled their CLO holdings in the last decade, reaching $125B in
2019. The growth in CLO investments has far outpaced that of loans and corporate
bonds, and was characterized by a preference for mezzanine tranches (Aa, A or Baa
rated) over triple-A tranches. Insurers’ proclivity towards CLOs vis-a-vis other secu-
rities, and towards mezzanine tranches rated investment grade within the CLO asset
class, reflect a search for yield behavior.
Similar to Becker and Ivashina (2015), we argue that insurers’ incentives to reach
for yield stem from the capital adequacy regulation’s coarse treatment of risk. In contrast
1Figures estimated on data from Moody’s Analytics Structured Finance Portal. Similar figures are reportedfor the time period 2003-2018 by (NAIC, 2018b) and SFIMA at https://www.sifma.org/resources/research/
us-fixed-income-securities-statistics/. Our figures underestimate the 2019 values because our data ends in Novem-ber 2019.
2Researchers have investigated the impact of corporate loan securitization on the risk and cost of bank loans (Wangand Xia, 2010; Shivdasani and Wang, 2011; Benmelech et al., 2012; Nadauld and Weisbach, 2012; Bord and Santos, 2015);amplification of credit cycles (Ivashina and Scharfstein, 2010), and and the risk to financial stability (IMF, 2020; BoE,2019; FSB, 2019; Ivashina and Vallee, 2020; SEC, 2020).
1

to Becker and Ivashina (2015), we show those incentives also arise from the regulation’s
similar treatment of corporate bonds and CLO tranches and are more prevalent in CLO
investments. Specifically, capital requirements for asset risk associated to fixed income
investments are defined for six macro buckets of securities’ credit quality named “NAIC
designations” (NAIC, 2018a, 2020). Insurers assign a NAIC designation (and the as-
sociated risk-based capital charge) to each investments according to a mapping from
credit ratings. For example, a security rated triple-A, Aa or A falls into the NAIC 1
designation (i.e., the NAIC bucket corresponding to the highest credit quality), whereas
a security rated Baa is designated as NAIC 2. While the NAIC 1 category is mapped
to three notches of credit rating (Aaa, Aa and A), all the other NAIC buckets are asso-
ciated only to one rating class. This implies that asset holdings falling into the NAIC 1
designation are characterized by a significantly marked heterogeneity in terms of credit
risk, albeit requiring the same amount of regulatory capital. In light of this discontin-
uous structure of capital requirements for asset risk, we conjecture that, conditional on
the NAIC designation bucket, insurance companies invest more heavily in assets with
higher yields.
The monotonic relationship between asset risk and cost of capital implied by the
rating-based mapping was partially altered in 2010, when the National Association of
Insurance Commissioners (NAIC) enacted a regulatory change of capital requirements
for CLO holdings. That change was part of a broader reform initiated in 2009 and
focused on mortgage-backed securities (MBS) as well, which aimed at providing capital
relief to the insurance sector amid the massive wave of downgrades on asset-backed
securities during the financial crisis (Becker et al., 2021; NAIC, 2021). The new capital
regime for CLO investments remained effective until the reporting year 2018 and was
eventually repealed in 2019. In essence, the reform allowed insurance companies to report
CLO tranches purchased at discount or highly impaired in a lower NAIC category than
that implied by the rating-based mapping. The scope of this rule was broad, as it
2

encompassed both legacy and new investments in CLOs, potentially affecting insurers’
investment behavior. We, thus, hypothesize that, conditional on the capital charge,
insurance companies’ incentives to invest in higher yielding CLO tranches increased
after the 2010 regulatory reform.
In contrast to bank capital regulation which treats corporate bonds differently
from CLO tranches, the capital regulatory framework of insurance companies does not
distinguish between these securities (perhaps with the exception of the modified regime
we discuss above). Yet, as we document, CLO mezzanine tranches, other than the triple-
A tranche, tend to carry higher yields than corporate bonds with the same credit rating.
This gives us our third hypothesis that insurance companies have a preference for CLOs’
mezzanine tranches over corporate bonds with the same credit rating.
Insurance companies’ preference for the CLO mezzanine tranches together with
their growing importance in this segment of the CLO market likely played a role in the
rise of the CLO issuance we observed in the last decade. This is our last hypothesis.
In particular, we investigate whether CLO deals in which insurance companies invest
more heavily are characterized by a larger fraction of mezzanine tranches. Mezzanine
tranches are critical for CLOs because their junior position allows for the production of
triple-A tranches. However, in contrast with the latter which are sought by banks, there
is far less demand for mezzanine tranches. This is because bank capital regulation treats
triple-A tranches favorably while at the same time taxes heavily banks’ investments in
all of the other CLO tranches.
We use granular data on insurers’ fixed income holdings at the security-company-
year level to investigate if insurance companies hold a larger share of securities offering
a higher yield within a NAIC designation bucket (once having accounted for asset size,
maturity date and insurer’s conditions). We restrict our sample to CLO tranches and
corporate bonds for which we have information on issuance and outstanding amounts
3

throughout their lifetime.3 In addition, since the balance of CLOs might vary over time
due to refinancing or principal amortization once the reinvestment period has ended, we
consider only first-time investments of each insurance company in a given security.
In line with our prediction, we find that insurance companies invest more heavily
in securities with higher yields within a NAIC designation bucket. An increase in the
yield by one standard deviation implies an increase in the insurer’s holding share by
14 basis points, which corresponds to an additional investment of $93 million for the
median security in portfolio. Moreover, insurance companies search for yield primarily
within the CLO asset class, which is characterized by a higher dispersion of yields.
We next explore a potential heterogeneity in insurers’ investment behavior over
time periods and across firm attributes. We document that insurance companies search
for yield both in the pre-crisis period, when interest rates were relatively high, and in
the post-crisis period, when interest rates were close to the zero lower bound, whereas
they did not invest significantly more in higher yielding securities during the financial
crisis. Overall, this suggests that insurers’ propensity to search for yield is stronger
in periods of economic expansion, regardless of the level of interest rates. However, in
terms of magnitude, the phenomenon is more pronounced in the post-crisis decade than
the pre-crisis period, pointing to a higher risk-taking in an environment of contained
interest rates compared to a context of relatively high interest rates. Consistent with
our second hypothesis, insurers’ search for yield within the CLO asset class increased
during the years the 2010 regulatory reform was in place.
With regards to firm attributes, we find that, conditional on the capital require-
ment bucket, lowly capitalized insurers hold higher fractions of high yielding securities,
consistent with their higher risk-shifting incentives (Jensen and Meckling, 1976). We
also find that among property and casualty (P&C) insurers, those highly affected by the
devastating natural disasters of 2017 (as captured by the yearly change in net income)
3This information is not available for corporate loans in our sample.
4

are more prone to search for yield vis-a-vis lowly affected companies in that year.
In the second part of our empirical analysis, we document how insurers’ search
for yield behavior translated into a preference for CLO over corporate bond investments.
To this end, we focus the attention on securities rated investment grade which account
for most of the assets in portfolio. We first show that, on average, the yield on new
investments by insurance companies in CLOs is significantly higher than the yield on new
investments in corporate bonds with the same rating. In addition, the yields differential
widens for decreasing levels of credit quality, as captured by the assets’ ratings. These
patterns map to insurers’ investment preferences in a one-to-one fashion. We find that
insurance companies purchase a larger portion of CLO tranches compared to corporate
bonds with the same rating and this behavior is more pronounced for the lower rating
classes. We extend our analysis to directly link the share of a security (CLO or corporate
bond) held by insurance companies and the difference in yields between the two asset
classes. We show that insurance companies purchase a larger portion of CLO tranches
compared to corporate bonds with the same rating the larger is the ratio of the average
yield on insurers’ investments in CLOs to the average yield of insurers’ investments in
corporate bonds for each specific rating-year combination.
We explore how insurers’ preference for CLOs over corporate bonds evolved over
time. We find that, in the pre-crisis period, when CLOs carried roughly the same or
even a lower yield than corporate bonds, insurance companies purchased a lower portion
of CLO tranches compared to corporate bonds with the same rating. But when the
yields on CLOs became significantly higher than the yields on corporate bonds during
the financial crisis and especially in the post-crisis decade, insurance companies changed
their investment behavior exhibiting a marked preference for CLOs over corporate bonds
with the same rating. As an alternative approach to explore the preference of insurers
for CLOs vis-a-vis corporate bonds, we focus the attention on a different metric, namely
the amount of insurers’ CLO holdings as a percentage of the total new investments in
5

CLOs and corporate bonds. We show that insurance companies allocate a larger share
of their portfolio to CLO tranches the larger is the yields differential between CLOs and
corporate bonds.
In the third part of our empirical analysis, we study the implications of insurance
companies’ search for yield for the CLO market. We show that, while insurers’ market
share of corporate bonds decreased somewhat from 2003 to 2019, that of CLOs almost
quintupled over the same time period. Importantly, that increase was mostly driven by
mezzanine tranches rated investment grade (Aa, A or Baa rated), whose market share
increased by a factor of eight (from 5% in 2009 to 44% in 2019). This phenomenon was
particularly pronounced for A rated tranches, with insurance companies holding more
than 50% of their outstanding volume at year-end 2019. Our investigation of the role
of insurance companies on the design of CLO deals shows that deals in which insurance
companies have larger investments do have larger mezzanine tranches rated investment
grade.
We complement our analysis presenting some evidence that speaks to the direc-
tion of causation. We show that the positive correlation between the share of a CLO
deal held by insurance companies and the size of the mezzanine tranches (rated Aa, A
or Baa) relative to the deal is larger for as long as the 2010 regulatory reform was in
place. Additionally, we find that CLO deals with higher insurance companies’ invest-
ments are more likely to be refinanced. Overall, this adds support to our thesis that
insurance companies’ preference for CLOs played a role in the growth of corporate loan
secularization over the last decade.
Our paper is most closely related to the literature on insurance companies’ search
for yield by arbitraging regulation, including Becker and Ivashina (2015), Becker et al.
(2021) and Liu (2019).4 Becker and Ivashina (2015) document how capital regulation
4Studies looking at banks’ risk-taking incentives due to regulatory arbitrage include Kroszner and Strahan (2011);Acharya and Steffen (2015); Karolyi and Taboada (2015); Boyson et al. (2016); Demyanyk and Loutskina (2016); Boyerand Kempf (2020); Buchak et al. (2020).
6

applied to insurers’ bond holdings generates incentives to invest in higher yielding cor-
porate bonds conditional on a NAIC designation bucket. We show that such incentives
extend beyond corporate bonds also affecting investments in CLO tranches, as well as
the portfolio allocation between these two asset classes. More importantly, we document
that insurers’ search for yield is more pronounced within the CLO space compared to
corporate bonds and that, over time, insurers’ bias towards higher yielding CLOs has
had an impact on the design of CLO deals. Our results unveil an important role played
by insurance companies as investors in the CLO market, potentially contributing to the
expansion of corporate loan securitization observed in the last decade.
Becker et al. (2021) study the effect of the 2009-2010 regulatory reform of capi-
tal requirements for investments in mortgage-backed securities on insurance companies’
propensity to purchase and hold these assets. We show that, while the extension of the
scope of the reform to CLO holdings reinforced insurers’ incentives to search for yield
within the CLO asset class, these incentives are at work even prior to the reform and
depend crucially on the rating-based framework of capital requirements. In addition,
our work takes one step forward exploring how insurers’ appetite for CLOs affected the
design of corporate loan securitization.
Exploiting a change in state laws that legalized in-state financial reinsurance
veichles, Liu (2019) investigates how a decrease in insurers’ cost of equity affects their
underwriting growth and investment risk. Our work explores, instead, insurers’ search for
yield incentives conditional on the capital requirement (and, hence, the cost of capital)
associated to a given security held in portfolio.
Additionally, our paper is related to the literature on the growth of securitization,
in particular corporate loan securitization (Ivashina and Scharfstein, 2010; Wang and
Xia, 2010; Shivdasani and Wang, 2011; Benmelech et al., 2012; Nadauld and Weisbach,
2012; Bord and Santos, 2015; Ivashina and Vallee, 2020). To the best of our knowledge,
7

ours is the first paper studying the role of insurance companies as investors in CLOs.5
We show that, as of 2019, insurance companies account for about half of the investor
base of CLO mezzanine tranches rated investment grade, contributing substantially to
the demand of mezzanine tranches which is crucial in the origination process of CLOs
as it allows for the creation of the highly sought triple-A tranches.
Lastly, our paper is related to the literature on the search for yield incentives
during protracted periods of low interest rates. Most of the studies so far, including
Peydro and Maddaloni (2011), Jimenez et al. (2014), Ioannidou et al. (2015), Dell’Ariccia
et al. (2017), and Paligorova and Santos (2017) focused on banks. Our paper adds to
this literature by uncovering a link between low interest rates and insurance companies’
search for yield.
The rest of our paper is organized as follows. Section 2 describes the capital
regulation applicable to insurance companies’ investments in CLOs and corporate bonds,
including the changes introduced in the 2010 regulatory reform. That section also lays
out the hypotheses we investigate. Section 3 describes our data sources and characterizes
our sample. Section 4 presents the results of our investigation of insurance companies’
search for yield in the CLO and corporate bond markets. Section 5 discusses how
insurers’ search for yield behavior translated into a preference for CLO tranches over
corporate bonds. Section 6 presents evidence from the CLO market from insurance
companies’ preference for CLOs over corporate bonds. Section 7 concludes the paper.
2 Hypotheses: Insurance Companies’ Preferences for CLOs
2.1 Insurance Companies’ Investments Over Time
Insurance companies are known for investing heavily in corporate bonds (Becker and
Ivashina, 2015). They have also been known for investing in syndicated corporate loans,
5Foley-Fisher et al. (2020) document the increasing participation of insurance companies as CLO issuers through theiraffiliated asset managers. Our focus, instead, is on insurance companies’ participation in the CLO market as investors.
8

particularly on term loans (Bord and Santos, 2012). What is perhaps less understood
is their increasing preference for CLOs (NAIC, 2018b), particularly in the post Great
Recession era (Figure 3). Between 2009 and 2019, insurance companies’ investments
in corporate bonds went from $1,143B to $1,784B, corresponding to a 56% increase.
During that same period of time, their investments in corporate loans went from $18B
to $42B, a 132% increase. In the case of CLOs, their investments went from $13B to
$125B, a 863% increase.6
The increase in insurance companies’ CLO investments is remarkable in many
ways. Back in 2009, CLO investments were much lower than corporate bond invest-
ments, but they were comparable to loan investments. Yet, over the decade that followed
CLO investments’ growth was more than six times larger than loan investments’. Fur-
ther, insurance companies showed a clear preference for the mezzanine tranches (rated
Aa, A or Baa) over the safest triple-A rated tranches (Figure 5). In 2011, 56% of in-
surance companies’ CLO investments were in triple-A rated tranches while 40% were in
mezzanine tranches.7 By 2019, the former had declined to 44% while the latter had risen
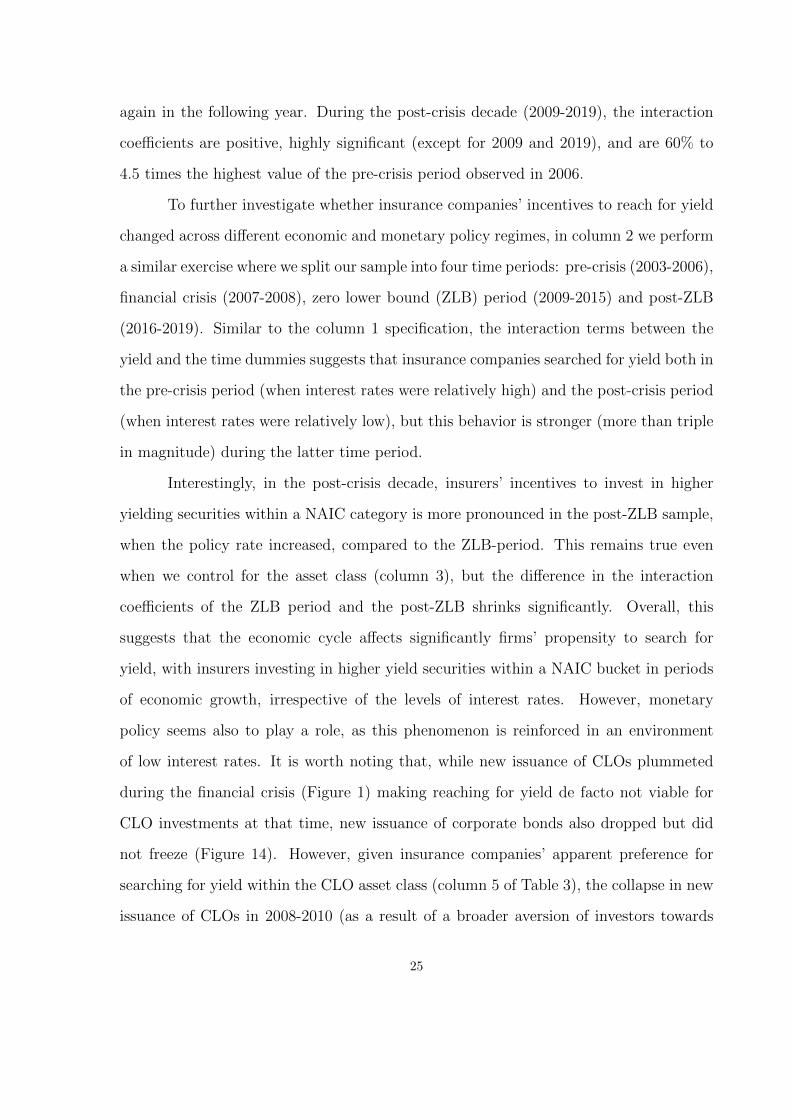
to 52%. For comparison, over the same time period the rating composition of insurance
companies’ bond investments remained mostly unchanged, with 80% invested in bonds
rated single A or Baa (Figure 4).8
The growing preference for mezzanine tranches does not appear to be solely due
to changes in the relative yields. In the post-crisis decade, yields on bonds held by
insurers declined across all rating categories (Figure 6). In contrast, yields remained
flat for CLO tranches rated investment grade and increased for the riskiest tranches
(Figure 7). While this difference may explain insurance companies’ relative preference
6Figures are calculated by aggregating the par-value of insurers’ investments in bonds, loans and CLOs. For reference,NAIC (2018b) reports that insurance companies’ CLO exposure in 2018 was $122B, which is somewhat higher than ourestimate for that year ($113B). It is worth noting, though, that we consider CLOs issued in USD only.
7The sharp drop and rebound in the share of triple-A tranches in 2008-11 reflect rating downgrades during the financialcrisis and subsequent upgrades.
8Limited availability of information on credit ratings assigned to bank loans prevents us from decomposing the timeseries of loan investments across rating categories.
9

for CLO tranches over corporate bonds it does not explain their growing preference for
CLOs’ mezzanine tranches. As we will show in Section 4, the driver for this preference is
insurance companies’ capital regulation. Further, as we will argue in Section 6, insurance
companies’ preference for CLOs’ mezzanine tranches was a critical factor for the post-
Great Recession growth in the securitization of corporation loans.
2.2 Insurance Companies’ Capital Regulation
Capital adequacy is the cornerstone of solvency regulation for insurance companies.
While the U.S. insurance industry is regulated at the state level, regulatory capital
requirements are harmonized across states thanks to NAIC’s coordination role.9 All
states have adopted the risk-based capital framework designed by the NAIC and first
implemented in the early 1990s. Similar to bank capital regulation, that framework
defines a minimum amount of capital that insurance companies must maintain in relation
to their size and risk profile, and specifies a series of actions that will be implemented
against non-compliers. The risk-based capital regime is intended to limit risk-taking of
insurers and provide a safety buffer to policyholders and bondholders against insolvency.
The risk-based capital requirement, denoted “authorized control level” (ACL)
risk-based capital, is calculated as a function of insurers’ exposures to different types
of risk. Broadly speaking, the framework classifies risks into three macro categories:
asset risk, underwriting risk, and all other business risk. Subcategories of those risks
depend on the the specific type of insurer, implying that the capital formula slightly
differs across the three main lines of business, i.e. life, P&C, and health. Importantly,
the current regulatory framework sets the required capital at the legal entity level (and
not at the consolidated level).10
9The NAIC is an organization governed by the chief insurance regulators from the 50 states, the District of Columbiaand the five U.S. territories. State regulators coordinate through the NAIC to define common standards, conduct peerreview, and oversee the insurance industry.
10NAIC created a “Group Capital Calculation Working Group” that is currently developing a capital requirement tobe applied at the group level.
10

The assessment of insurers’ solvency conditions is based on the “risk-based capital
ratio” — the ratio of “total adjusted capital” (which is essentially the insurer statutory
capital and surplus) to the ACL risk-based capital. A capital shortage may trigger four
levels of regulatory actions, which are progressively more severe for decreasing values of
the risk-based capital ratio. For example, if total adjusted capital falls below 200% of
the risk-based capital requirement, this indicates the company breached the “company
action level” (CAL) and is required to submit a plan to restore its level of capitalization.
Important for us are the capital requirements for asset risk associated to fixed
income investments, including corporate bonds, loans and CLOs. These are calculated
as a weighted sum of the book value of fixed income investments, with weights equal to
a risk-based capital charge that captures the credit risk of each asset. The risk-based
capital charge is defined for six different buckets of assets’ credit quality named “NAIC
designations” (NAIC, 2018a, 2020). A NAIC 1 designation corresponds to securities
with the highest credit quality, whereas a NAIC 6 designation corresponds to securities
with the lowest credit quality. Insurance companies assign a NAIC designation (and
the associated risk-based capital charge) to fixed income investments according to a
mapping from credit ratings (Table 1). For example, securities rated Aaa, Aa or A
receive the NAIC 1 designation and are subject to a (post-tax) risk-based capital charge
of 0.3%. This means that for an investment of $100 in a NAIC 1 security, an insurance
company must hold $0.3 in equity capital. Lower credit ratings are associated with higher
NAIC designations and risk-based capital weights.11 While the NAIC 1 designation is
mapped to three different credit ratings (Aaa, Aa, A), all of the other NAIC categories
are associated to a unique rating. This design implies that insurance companies are
required to set aside the same amount of regulatory capital for a subset of investments
exposing them to different levels of credit risk.
With regards to the book value of an asset, it corresponds to “amortized cost” for
11Post-tax risk-based capital charges for NAIC designations 2 through 6 differ slightly across insurers’ lines of business.
11

NAIC 1-5 holdings of life insurers and NAIC 1-2 holdings of P&C and health insurers,
unless the asset is impaired. Amortized cost means that the purchase premium or
discount is amortized throughout the life of the investment. The book value corresponds,
instead, to the lower between the amortized cost and the fair value for NAIC 6 assets
of life insurers and NAIC 3-6 of P&C and health insurers. Securities that are not
temporarily impaired should be reported at fair value.
The mapping presented in Table 1 remained unchanged and was applied during
the time period considered in our study (2003-2019), except for CLOs and mortgage
backed securities (MBS) which were subject to a different regime from 2010 to 2018
and from 2009, respectively. In 2009, the NAIC changed the capital requirements for
investments in residential MBS to provide some relief to the insurance industry which
was negatively affected by the wave of downgrades in MBS during the subprime crisis
(Becker et al., 2021; NAIC, 2021). The new regulation was extended to commercial MBS
and CLO investments in 2010 (Foley-Fisher et al., 2020), but the calculation of capital
requirements for CLOs and MBS under the new regime were substantially different
(NAIC, 2017).
The new framework allowed insurers to assign CLO tranches purchased at dis-
count or highly impaired a lower NAIC designation than the designation implied by the
rating-based system of Table 1. Specifically, insurers could adopt the following multi-
step process (named “modified filing exempt”, MFE):
1. convert the credit rating of a CLO tranche into a NAIC designation according to the
mapping of Table 1. If the conversion results in a NAIC 1 or a NAIC 6 designation,
assign this class of risk.
2. It the conversion results in a NAIC 2-5 category, compare the ratio book value ×
100/par value to the breakpoints of Table 2 to determine the “initial NAIC desig-
nation”. If this corresponds to NAIC 1-5, assign this class of risk. For example,
suppose that the credit rating conversion delivers a NAIC 2. This designation may
12

be replaced with a NAIC 1 if the book value is lower than 97.88% of the investment’s
par value.
3. If the initial designation obtained in the previous step is NAIC 6, then compare
the ratio min(book value, fair value) × 100/par value to the pricing matrix of Table
2 and assign the final designation accordingly.
This multi-step process was applied until the reporting year 2018 (NAIC, 2019). Starting
in 2019, the ratings-based approach of Table 1 was restored.
As we will discuss in section 3, insurance companies submit to the NAIC annual
statement filings reporting information on asset holdings, including book value, par value
and NAIC designation of each security in the portfolio. As per statutory guidelines,
the NAIC designation of CLOs determined according to points 2 and 3 of the MFE
process must be reported with the suffix “AM”. While a NAIC designation including
this substring does not automatically signal an exception to the baseline rating mapping
for the NAIC 2-6 categories, all NAIC 1 designations including the “AM” suffix identify
tranches whose credit rating would not translate into a NAIC 1. This means that, for the
NAIC 1 category, we are able to exactly identify the volume of CLOs reported based on
the 2010 reform. Figure shows that the percentage of NAIC 1 CLO investments subject
to the MFE process is different from zero during the time period where the reform was in
place (2010-2019) and reaches its peak of 15% in 2015. As a complementary exercise, we
look at the percentage of NAIC 1 CLO holdings that have a rating different from Aaa,
Aa or A. This metrics shows a very similar pattern to the one of the previous measures,
and the two almost perfectly overlap starting in 2013. This suggests that insurance
companies exploited the regulatory reform to reduce capital charges associated with
their CLO investments.
13

2.3 Hypotheses
The risk-based capital regulation of the insurance sector implies that investments are
associated to a higher cost of capital for increasing levels of risks. However, due to the
six-bucket designation system, the relationship between asset risk and cost of capital is a
step function and, hence, not strictly increasing. Similar to Becker and Ivashina (2015),
this leads us to conjecture that, given the same risk-based capital charge, insurers have
incentives to maximize the return on their investments, i.e., to search for yield.
Hypothesis 1: Insurance companies have an incentive to invest in higher yielding secu-
rities (CLO tranches and bonds) within a NAIC designation bucket.
The modified regulatory regime applied to CLOs in 2010-2018 altered the mono-
tonic relationship between asset risk and cost of capital implied by the rating-based
mapping. This is especially true for the risky tranches that are more likely to be down-
graded, bear a loss, or be purchased at discount. In fact, there is a positive probability
that these tranches are assigned a lower NAIC designation than the designation they
would receive based on the rating mapping. Importantly, since the regulatory reform
applied to both legacy and new investments in CLOs, we predict the reform affected the
behavior of insurers on new investments. We, thus, formulate the following additional
hypothesis.
Hypothesis 2: Insurance companies’ incentives to invest in higher yielding CLO tranches
within a NAIC designation bucket increased after the 2010 regulatory reform.
The capital regulatory framework of insurance companies does not distinguish
CLO tranches from corporate bonds with the same rating (perhaps with the exception
of the modified regime we discuss above). However, as we document, CLO tranches,
other than the triple-A tranche, tend to carry higher yields than corporate bonds with
the same credit rating. This gives us our third hypothesis.
14

Hypothesis 3: Insurance companies have a preference for CLO mezzanine tranches (those
rated Aa, A and Baa) over corporate bonds with the same credit rating.
We focus on mezzanine tranches above investment grade because insurance companies
usually do not invest in below-grade rated securities (Figure 4 and Figure 5).
Insurance companies’ preference for the CLO mezzanine tranches together with
their growing importance in the CLO market and the fact that banks, the other major
investor in this market, have strong disincentives to invest in CLO tranches that are not
rated triple-A, gives us our last hypothesis about the impact of insurance companies in
the CLO market.
Hypothesis 4: CLO deals in which insurance companies invest more heavily are charac-
terized by a larger fraction of mezzanine tranches above investment grade.
We test these four hypotheses in the next three sections.
3 Data Sources and Sample Characterization
3.1 Data Sources
Our main data source for this project is “Schedule D-Part 1” of the annual financial
statement filings of life, P&C and health insurance companies submitted to the NAIC
during 2003-2019 and retrieved from SNL Financial. That schedule includes informa-
tion at the security level on virtually all fixed-income holdings of insurance companies
(government and corporate bonds, bank loans, MBS, CLOs and other structured securi-
ties) as of December 31 of each year. The schedule reports for each security investment:
the par value, book value, purchase cost, nominal interest rate, effective yield, NAIC
designation, purchase date, and maturity date.
Schedule D-Part 1 is organized in subsections by types of issuers (e.g., gov-
ernment, industrial and miscellaneous, parent, subsidiaries and affiliates) and different
15

macro-classes of assets (e.g., issuer obligations, RMBS, CMBS, other loan-backed and
structured securities). Given Schedule D does not identify the types of assets we are
interested in (CLOs, corporate bonds, and bank loans), we rely on a suite of matching
exercises and textual analysis.12 In particular, we identify CLO holdings via CUSIP
matching and fuzzy matching using historical data on CLO tranches from Moody’s An-
alytics Structured Finance Portal. We identify corporate bonds via CUSIP matching
using data from Mergent Fixed Income Securities Database (FISD). Finally, we identify
corporate loans via textual analysis, as well as CUSIP matching and fuzzy matching
combining data on syndicated loans from DealScan and Loan Syndications and Trading
Association (LSTA), loan funds’ holdings from Lipper and Morningstar, and loans in
the collateral pool of CLO tranches from Moody’s Analytics Structured Finance Portal.
We conduct fuzzy matches to identify CLO and loan holdings by insurance com-
panies using the denomination and maturity date of the asset. The reason why we also
carry out a textual analysis (beside CUSIP matching) to identify CLO tranches and
corporate loans is because CUSIP identifiers are not always available in all data sources
for these securities, especially for corporate loans. We follow a conservative approach
discarding CUSIP matches in which the maturity date of the asset and the issuer name
do not correspond in the pair of matching data sets. In addition, we check that all
insurers’ holdings identified as CLO tranches, corporate bonds and corporate loans do
not fall into other asset classes using textual analysis and CUSIP matches with data
from Capital IQ.
Of the three asset categories we consider, corporate loans are the ones that pose
the biggest challenges because they often lack a unique identifier across different data
sets/providers. However, a simple exercise using the 2018 and 2019 bank-loan sub-
sections of Schedule D-Part 1 mentioned above shows that our approach allows us to
identify 99.9% of the corporate loans held by insurance companies in those two years.
12The only exception are corporate loans for the years of 2018 and 2019 which are reported in two separate subsectionsnamed “bank loans issued” and “bank loans acquired”.
16

This leads us to believe that our approach to identify the various asset classes is reliable.
We complement our data set on insurance companies’ asset holdings with data
on CLO tranches, corporate bonds, and insurers’ financial conditions. We get historical
data on the offering amount, outstanding balance, maturity or expiration date, and credit
ratings disclosed in CLOs Trustee reports from Moody’s Analytics Structured Finance
Portal. We only associate the aforementioned list of variables to tranches identified via
CUSIP matching to make sure that we assign them correctly. This is a minor limitation
as CLO tranches obtained by matching the CUSIP identifiers represent 99.8% of all
insurers’ holdings identified as CLOs. There are two important caveats related to data
obtained by Moody’s Analytics Structured Finance Portal. First, information on CLO
tranches is available up to beginning of November 2019. As a result, that data source
does not cover the full year of 2019. Second, we have the entire rating history of CLOs
only for a subset of tranches that are rated by Moody’s (63% of all CLO tranches in our
sample). Information on credit ratings is available only at issuance for CLO tranches
evaluated by other rating agencies (Standard’s & Poors and Fitch). We, thus, assume
that those tranches do not experience a change in credit rating and we keep the rating
assigned at issuance throughout their lifetime. This is a reasonable assumption as we
observe a change in rating bucket (e.g., from Aaa to Aa) only for 16% of tranches rated
by Moody’s and most of the changes relate to downgrades and subsequent upgrades
occurred in 2009 and 2011. This is consistent with Griffin and Nickerson (2021), who
documents that credit agency actions on CLO tranches are very limited even during the
covid-19 shock.
We get data on the offering amount at issuance, outstanding volume and credit
ratings of corporate bonds from Mergent Fixed Income Securities Database (FISD) and
Moody’s. Since we have limited information on outstanding volumes and credit ratings
of corporate loans, we focus our investigation on insurance companies’ investments in
CLOs and corporate bonds. Finally, we obtain information on the balance sheet and
17

income statement of insurance companies from SNL financial.
Finally, we get data on the structure of CLO deals from Moody’s Analytics
Structured Finance Portal which we use in section 6 to investigate the implications of
insurance companies’ preference for CLO mezzanine tranches.
3.2 Sample Characterization
Our sample comes from the fixed-income holdings of 5,685 life, P&C and health insurance
companies between 2003 and 2019. The full portfolio of securities of these companies over
that time period contains 16,620,911 observations. Life and P&C insurers each account
for about 45% of these observations, whereas health insurance companies account for
the remaining 11% observations. After we restrict to investments in CLOs, corporate
bonds and loans, we are left with 6,572,218 observations of which 129,440 are in CLOs,
6,272,915 are in corporate bonds, and 169,863 are in loans. Finally, after we aggregate
investments that insurance companies report in the same security in a given year we are
left with 6,434,425 observations of which 128,917 are in CLOs, 6,135,645 are in bonds
and 169,863 are in loans.13
In the econometric analysis presented in section 4 and section 5, we restrict our
sample to first-time investments of insurers in CLOs and corporate bonds, i.e., for each
insurance company-security pair we keep only the observations corresponding to the year
in which the original purchase of the asset took place. We do this because insurance
companies make most of their investments when securities are first issued. Also, recall
that we drop from the analysis loan investments because we do not have comprehensive
information on loan ratings. This leaves us with a panel of 1,714,609 observations, with
57,507 pertaining to CLO investments and 1,657,102 pertaining to corporate bonds.
Lastly, we use two data sets to investigate the impact of insurance companies’
13We aggregate these observations at the security-company-year level by summing up the par value, book value andactual cost of the investments, averaging the nominal interest rate, and calculating a size-weighted average of the effectiveyield with weights equal to the par value of each investment.
18

preference for CLOs on the design of CLO deals that we report in section 6. The
first data set includes information on CLO deals at issuance. The second data set
contains information on outstanding balance and refinancing of CLO deals throughout
their lifetime. The former is a cross section of 2,327 CLO deals issued between 2003 and
2019, whilst the latter is a panel of 15,289 (annual) observations covering the same set
of deals.
4 Insurance Companies’ Search for Yield
In this section, we begin by investigating insurance companies’ incentives to invest in
higher yielding securities (CLO tranches and bonds) within a NAIC designation bucket
(Hypothesis 1). Next, we investigate how those incentives varied over time to ascertain
both the potential role of low interest rates and the 2010 regulatory reform (Hypothesis
2) on insurance companies’ search for yield incentives. Following this, we investigate the
heterogeneity of these incentives depending on insurance companies’ capitalization and
their exposure to losses triggered by large natural disasters.
4.1 Insurance Companies’ Preference for higher yielding securities
We start our empirical analysis of Hypothesis 1, which states that insurance companies
have the incentive to invest in the higher yielding CLO tranches and bonds within a
NAIC designation bucket, with a graphical inspection of insurance companies’ invest-
ment choices. To this end, we restrict our sample to first-time investments of each
insurance company in a given security (CLO tranche or corporate bond).14 Figure 10
shows the time series of insurers’ new CLOs holdings that fall into the highest credit
quality designation (NAIC 1) as a percentage of the total volume outstanding of these
tranches based on percentiles of the distribution of CLOs yields for each year. Yields
14This is important because the share of a CLO tranche that an insurance company owns may vary not only due tochanges in the invested amount but also because of refinancing or changes in the outstanding balance of the CLO (e.g.,amortization of principal).
19

represent the effective rate of return on the investment in a given security as reported
by the insurance company.
In line with our hypothesis, there is a clear preference for the riskiest tranches
within NAIC 1 (those with yields above the 66th percentile) throughout the sample
period, with the exception of the financial crisis where all yields are squeezed at their
minimum levels. Interestingly, the search for yield behavior of insurance companies in
CLOs pertaining to the NAIC 1 bucket is very pronounced both in the pre-crisis period,
when interest rates were relatively high, and in the post-crisis period, when short-term
interest rates were close to the zero lower bound. In 2003-2006, the market share of CLO
tranches with yields above the the 66th percentile is 25 to 40 percentage points higher
than that of tranches with yields in the bottom tercile, whilst from 2011 onwards the gap
between the extreme buckets ranges from 10 to 35 percentage points. The compression
of the three market shares in 2007-2010 is hardly surprising in light of the CLO market
freeze observed during the financial crisis (Figure 1). Note that the three market shares
experience a drop in 2019, after the regulatory reform of 2010 was repealed.
We obtain a very similar picture when we look at tranche ratings rather than
yields (Figure 11). In this case, the market share of the two mezzanine tranches in
NAIC 1, that is those rated Aa and single A, is consistently above that of triple-A
tranches throughout the sample period, except for the financial crisis when the three
market shares overlap.
When we replicate this exercise for the corporate bonds, the evidence seems to
suggest that insurance companies’ reach for yield within the NAIC 1 bucket is more
prevalent within CLOs than bonds (Figure 12-12). As we noted above, the market share
of CLO tranches with yields above the 66th percentile is 10 to 40 percentage points
higher than that of tranches with yields in the bottom tercile throughout our sample
period. By contrast, the difference in the market share of corporate bonds with yields
above the the 66th percentile and yields below the 33th percentile does not exceed 10
20

percentage points. Also, it seems that in both asset classes, and in line with Becker
and Ivashina (2015), insurers are more prone to search for yield in periods of economic
growth.
We, next, test more formally our Hypothesis 1 by estimating the following base-
line econometric model:
Holdingssct × 100
Outstanding amountst=α + β1Yieldsct + β2Time to maturitysct
+ β3Outstanding amountst + µNAIC designation,t
+ µc,t + µa(s) + µl(c) + ε
(1)
where the dependent variable is the amount held by insurance company c in security s
in year t when the insurer makes its first investment in that security, Holdingssct, as a
percentage of the volume outstanding of security s at year-end t, Outstanding amountst.
The key variable of interest is Yieldsct, the effective yield of security s reported by
company c in year t. We expect the coefficient on this variable, β1, to be positive, in
line with the premise that insurers invest more heavily in securities offering higher yields
within a NAIC category.
We attempt to identify that effect controlling for the time to maturity of the
security in years (as reported by the insurance company), Time to maturitysct, and the
volume outstanding of security s at issuance, Outstanding amounts, which allow us to
disentangle search for yield from time and issue size preferences of insurance compa-
nies. Importantly, we include NAIC designation-year fixed effects, µNAIC designation,t, to
investigate reach for yield within each bucket of risk-based capital charges. Finally,
we saturate our econometric model with company-year fixed effects, µc,t, to control for
company-specific time varying and time invariant conditions that may affect its incen-
tives to invest in a given security, type of asset (CLO or corporate bond) fixed effects,
µa(s), to account for asset-specific characteristics that may affect insurers’ preference for
a security class, and line of business fixed effects, µl(c), to control for differences in the
21

business model and regulation of life, P&C and health insurance companies which may
impact their investment choices. Standard errors are clustered at the company level and
year level (two-way clustering).15
Table 3 reports the results of our estimation of model 1. The first column reports
the estimates of our baseline model. In line with our priors, the coefficient on Yieldst
is positive and highly statistically significant, corroborating the hypothesis that insur-
ance companies invest more in securities with higher yields within a NAIC designation
bucket. In terms of magnitude, an increase in the yield by one standard deviation (2.14
percentage points in the subsample where this regression is estimated) implies an in-
crease in the holding share of insurers by 14 basis points, which is somewhat above the
median holding share (0.12). The median outstanding volume of CLOs and corporate
bonds in portfolio in the subsample where we estimate the model is $650 million. Thus,
a 14 basis points increase in the holding share of an insurer corresponds to an additional
investment of $93 million for the median security in portfolio. Looking at the control
variables, we observe a negative and statistically significant coefficient for the outstand-
ing amount, in line with the idea that insurance companies hold a lower fraction of an
asset the larger is its size.
In columns 2 and 3 we replace company-year fixed effects with a set of variables
capturing company characteristics that may affect insurers’ incentives to invest in a
given security. These include size (natural logarithm of total admitted assets), ROE
(net income to total adjusted capital), capital ratio (total adjusted capital to total
admitted assets), and either CAL risk-based capital ratio (column 2) or ACL risk-based
capital ratio (column 3).16 While the ACL risk-based capital ratio captures the distance
from the minimum capital requirement that insurance companies must comply with
to run their business, the CAL risk-based capital ratio captures the distance from the
15We select the proper clustering level following Petersen (2009), Cameron et al. (2011), and Cameron and Miller (2015).
16Similar to Koijen and Yogo (2015), we use total adjusted capital as a measure of insurers’ equity.
22

first capital threshold that triggers oversight actions from insurance regulators. It is
worth noting that we lose 37,462 observations (out of 1,691,393) in columns 2 and 3
due to missing information on financial metrics for some insurers that are covered in
the holding data starting in 2019 but are not covered in the SNL Financial’s balance
sheet and income statements data.17 For this reason, we use as baseline model the
econometric specification including company-time fixed effects rather than firm controls.
Irrespective of the risk-based capital ratio used, the yield’s coefficient is very close to that
of the baseline regression but somewhat larger. In addition, the positive and statistically
significant coefficient of size and the two risk-based capital ratios suggest that insurers’
holding share of CLOs and corporate bonds positively correlates with firm size and level
of capitalization.
Column 4 extends our baseline specification to include issuer fixed effects to
account for insurance companies’ preference towards certain issuers. These fixed effects
are largely collinear with the security type fixed effects, as no CLO issuer is also a
corporate bond issuer and vice versa. Thus, not surprisingly, this regression delivers
results which are virtually the same to those of the baseline model.
Finally, in column 5 we take a first look at insurers’ relative incentives to search
for yield differ across the CLOs and corporate bonds within each NAIC bucket. The
coefficient of CLO dummy suggests that, ceteris paribus, insurance companies hold a
higher share of CLO tranches compared to corporate bonds. Importantly, and in line
with the patterns observed in Figure 10 and Figure 12, the search for yield behavior
of insurers appears to be more pronounced within the CLO asset class. This is not
surprising if we note, for example, that the yields of CLO tranches are much more
disperse than the yields of corporate bonds in the NAIC 1 designation bucket hereby
creating better opportunities to search for yield (Figure 6 and Figure 7).
The positive and statistically significant coefficient of the interaction term be-
17These companies began to submit their financial filings with life insurers in 2019.
23

tween the yield and the CLO dummy indicates that a one standard deviation increase
in the yield (2.14 percentage points in the subsample where this regression is estimated)
implies an increase in the holding share of CLO tranches in a given NAIC bucket that
is 2.38 percentage points higher than that of corporate bonds. These results are in line
with our Hypotheses 3 that insurance companies have a preference for CLOs over cor-
porate bonds with the same credit rating. We investigate this hypothesis more directly
at the end of this section.
Overall, the results from this part of our analysis confirm Hypothesis 1 that
the design of the insurance sector’s capital regulation for asset risk with discontinuous
buckets of capital charges generates incentives for insurers to search for yield both in
the CLO and corporate bond market segments.
4.2 Heterogeneity over Time
We next explore possible differences in insurers’ search for yield over time. This is
important because our sample period (2003-2019) encompasses a protracted period of low
interest rates, which has been linked to increased risk-taking by the banking industry.18
It also overlaps with the 2010 regulatory reform, which, following our Hypothesis 2,
made it easier for insurance companies to search for yield in the CLO market segment.
The results of our investigation on the heterogeneity of the effects over time are reported
in Table 4.
Column 1 of Table 4 extends the baseline model to include the interaction between
asset yield and year dummies. For the sake of readability, we report the simple slopes
of the yield for each time period. The interaction coefficients are broadly positive and
statistically significant in the pre-crisis period (2003-2006), with the exception of 2004
and 2005. The interaction is still positive and significant at the early stage of the
financial crisis in 2007, but it turns negative in the midst of the crisis in 2008, to revert
18See, for example, Altunbas et al. (2014), Peydro and Maddaloni (2011), Dell’Ariccia et al. (2017), Jimenez et al.(2014), Ioannidou et al. (2015) and Paligorova and Santos (2019).
24
again in the following year. During the post-crisis decade (2009-2019), the interaction
coefficients are positive, highly significant (except for 2009 and 2019), and are 60% to
4.5 times the highest value of the pre-crisis period observed in 2006.
To further investigate whether insurance companies’ incentives to reach for yield
changed across different economic and monetary policy regimes, in column 2 we perform
a similar exercise where we split our sample into four time periods: pre-crisis (2003-2006),
financial crisis (2007-2008), zero lower bound (ZLB) period (2009-2015) and post-ZLB
(2016-2019). Similar to the column 1 specification, the interaction terms between the
yield and the time dummies suggests that insurance companies searched for yield both in
the pre-crisis period (when interest rates were relatively high) and the post-crisis period
(when interest rates were relatively low), but this behavior is stronger (more than triple
in magnitude) during the latter time period.
Interestingly, in the post-crisis decade, insurers’ incentives to invest in higher
yielding securities within a NAIC category is more pronounced in the post-ZLB sample,
when the policy rate increased, compared to the ZLB-period. This remains true even
when we control for the asset class (column 3), but the difference in the interaction
coefficients of the ZLB period and the post-ZLB shrinks significantly. Overall, this
suggests that the economic cycle affects significantly firms’ propensity to search for
yield, with insurers investing in higher yield securities within a NAIC bucket in periods
of economic growth, irrespective of the levels of interest rates. However, monetary
policy seems also to play a role, as this phenomenon is reinforced in an environment
of low interest rates. It is worth noting that, while new issuance of CLOs plummeted
during the financial crisis (Figure 1) making reaching for yield de facto not viable for
CLO investments at that time, new issuance of corporate bonds also dropped but did
not freeze (Figure 14). However, given insurance companies’ apparent preference for
searching for yield within the CLO asset class (column 5 of Table 3), the collapse in new
issuance of CLOs in 2008-2010 (as a result of a broader aversion of investors towards
25

asset-backed securities) might be the key driver behind insurers’ vanished propensity to
invest in higher yield securities during the financial crisis.
Finally, we test our second hypothesis, namely that insurers’ incentives to reach
for yield within the CLO asset class is stronger for as long as the regulatory reform of
2010 was in place (i.e., 2010-2018). To this end we include a triple interaction between
the yield, the CLO dummy and a dummy equal to one if the year falls into the 2010-
2018 time period and zero otherwise. As we can see from column 6, the coefficient of
the triple interaction is large, positive and statistically significant. Thus, consistently
with our prediction, following the 2010 regulatory reform which allowed (under certain
conditions) insurers to assign CLOs purchased at discount a lower NAIC designation
than the designation implied by the rating-based system, insurance companies increased
their investments in CLOs relative to bonds within NAIC buckets.
4.3 Heterogeneity across Insurance Companies
Our next tests explore the heterogeneity in insurers’ search for yield behavior across firm
attributes. We begin by considering insurance companies’ capitalization. In the banking
literature, well capitalized banks are believed to be less prone to take on risk. Repullo
(2000) shows this link in a model where capital is used as a cushion against adverse
contingencies, and Jimenez et al. (2014) and Dell’Ariccia et al. (2017) find evidence
consistent with this insight. Therefore, we expect stronger evidence of search for yield
among insurers with a low level of capitalization.19 Columns 1 through 3 of Table 5
report the results for three different measures of capital. Column 1 considers insurance
companies’ level of capitalization as captured by the capital ratio; column 2 uses the CAL
RBC ratio, and column 3 relies on the ACL RBC ratio. Irrespective of the capitalization
metric adopted, we find that insurance companies with a lower capital ratio or closer to
19Of course this builds on the assumption that the banking insight applies to insurance companies. It is also worthnoting that, even within the banking industry, there are different views on the impact of capital on banks’ risk takingincentives. For example, Rochet (1992) shows that well-capitalized banks are less risk-averse when capital is more costlythan other funding sources, giving rise to a typical moral hazard problem.
26

the minimum capital requirements are more prone to search for yield.
Our next test on the search for yield heterogeneity across firms focuses on P&C
companies, which is the category of insurers that are affected by particularly adverse
events related to weather and climate disasters during our sample. Figure 15 shows
the time series of nationwide property damage from federally-designed disasters from
1964 to 2018. During the last two decades, major disasters occurred in 2005, when
hurricane Katrina caused large-scale devastation in the Gulf Coast region, and in 2017,
which saw a devastating hurricane season with hurricanes Harvey, Irma and Maria and
an unprecedented break out of wildfires in Northern California. The aggregate value of
nationwide property damage peaked exactly in 2005 and 2017, reaching almost $100B
in both years and implying significant insured losses.
We, thus, investigate if P&C insurers that were hard hit by disaster events, as
captured by the yearly change in their net income, were more aggressive searching for
yield in 2005 and 2017 vis-a-vis less affected companies. The idea behind this conjecture
is that insurers experiencing higher losses on their policies may try to boost their net
income by investing in securities offering higher returns. To this end, we generate a
dummy variable equal to one if the change in net income of a P&C insurer in a given year
is below the median (henceforth abridged “below median dummy”) and zero otherwise
and we interact this variable with the effective yield and a time dummy for 2005 and
2017, respectively. The results of this investigation is reported in column 5 of Table 5.
We find that there is not a significant difference in the investment behavior of
insurance companies whose change in net income is below and above the median through-
out the sample period, with the exception of 2005 and 2017 when below median firms
had significant higher incentives to search for yield compared to above median firms.
Specifically, while the interaction between the yield and the below median dummy is not
statistically significant, the triple interactions of the yield, the below median dummy,
and the time dummies for 2005 and 2017 are both positive and significant. Since the
27

coefficient of the triple interaction of 2017 is more than twice that of 2005, this suggests
the search for yield in response to the increase in insured losses due to catastrophic
events was much stronger in 2017 than 2005.
A natural question that arises from these findings is whether hard hit P&Cs
changed their investment behavior only temporarily or in a persistent way. We perform
this exercise separately for 2005 and 2017 by estimating a regression model on the
subsample of P&C insurers whose yearly change in net income is below the median in
2005 (column 6) and 2017 (column 7), respectively. In each specification, we interact
the yield with a time dummy corresponding to the year of the event (2005 or 2017)
and a time dummy indicating the post-event period. In the specific case of the analysis
focused on the 2005 natural disaster, we limit the sample to the period prior to the
financial crisis (2003-2006) to eliminate this confounding factor. Both interaction terms
are not statistically significant in column 6, suggesting that P&C highly affected by
the devastating effects of hurricane Katrina did not change their investment behavior
over time. We find different results on column 7 which focuses on the 2017 losses. The
coefficient of the yield is positive but not statistically significant, and the interaction
coefficient of the yield with the post-2017 dummy is also insignificant. However, the
interaction coefficient of the yield with the 2017 time dummy is positive and statistically
significant. This means that P&C insurers highly affected by the devastating events of
2017 invested significantly more in higher yielding securities within a NAIC bucket only
in that year, but this increased search for yield behavior did not persist over time.
This finding corroborates our previous results on low-capital adding support to
our evidence that insurance companies seek to exploit the design of their capital reg-
ulation taking on more risk in search for yield. Thus far, we focused on documenting
insurance companies’ search for yield through their investments in both corporate bonds
and CLO tranches. In the next section, we go a step further and investigate whether
regulation tilted insurance companies’ preference for searching for yield using CLOs over
28

corporate bonds (Hypothesis 3).
5 Insurance Companies’ Preference for CLOs over Bonds
As discussed in Section 2, capital requirements for asset risk applied to insurance com-
panies treat CLO and corporate bond investments alike. While the regulatory reform of
2010-2018 partially modified the assignment of CLO tranches to a NAIC designation, it
has always been the case that corporate bonds and CLOs falling into the same NAIC
bucket are subject the same capital requirement.
Figure 8 shows that the average yield on insurers’ investments in CLOs is system-
atically higher than the yield on insurers’ investments in corporate bonds for all rating
categories, except the triple-A, starting in 2005. In addition, as noted earlier, insurance
companies hold mainly investment grade CLOs and corporate bonds (Figure 4 and Fig-
ure 5). This lead us to our third hypothesis, namely that insurance companies have a
preference for CLO mezzanine tranches rated Baa and above over corporate bonds with
the same credit rating.
We explore this prediction, starting with a granular comparison of yields on CLO
tranches and corporate bonds. To this end, we estimate the following type of model:
Yieldsct =α + β1dummy CLOs + β2Time to maturitysct
+ β3Outstanding amountst + µRating,t
+ µc,t + µl(c) + ε
(2)
where Y ieldsct is the yield of security s reported by company c at time t and µRating,t
stands for rating-year fixed effects. We estimate the model on the subsample of insurers’
first time investments in CLO tranches and corporate bonds rated Aaa, Aa, A and
Baa. Column 1 of Table 6 reports the estimate of this regression. We find a positive
and statistically significant coefficient for the CLO dummy, suggesting that, on average,
29

the yield on insurers’ new investments in CLOs is 0.7 percentage points higher than the
yield on new investments in corporate bonds with the same rating. When we interact the
CLO dummy with the rating, we find that the difference in yields between the two asset
classes is statistically significant only for securities rated Aa and below. Importantly,
this difference increases monotonically from 0.5 percentage points for the Aa rating class
to 1.6 percentage points for the Baa rating class.
We, next, explore the implications of that difference in yields on insurers’ prefer-
ence for CLOs vis-a-vis corporate bonds by estimating the following econometric speci-
fication:
Holdingscst × 100
Outstanding amountst=α + β1dummy CLOs + β2Time to maturityst
+ β3Outstanding amountst + µRating,t
+ µc,t + µl(c) + ε
(3)
where the dependent variable is the amount held by insurer c in the security s and at
time t (when the insurer makes its first investment in the security) as a percentage of
the volume outstanding of the security in that year. Columns 3-7 of Table 6 show the
results of this exercise. The large and highly significant coefficient of the CLO dummy
in model 3 confirms that insurance companies have a strong preference for CLOs over
corporate bonds with the same credit rating. Consistent with the evidence presented in
column 2, this preference increases with risk, as the difference in yields between CLOs
and corporate bonds widens. In the next three specifications, we test if there is any
heterogeneity in the investment behavior of insurance companies depending on their
level of capitalization by interacting the CLO dummy with the capital ratio, the CAL
risk-based capital ratio and the ACL risk-based capital ratio, respectively. The estimates
of all these three models suggest that less capitalized insurers have a strong preference
for CLOs vis-a-vis corporate bonds within the same rating category, in line with the
idea that higher leverage brings stronger incentives to search for yield.
30

We next relate insurance companies’ preference for CLOs over corporate bonds
to the difference in yields between the two asset classes more directly. To that end, we
construct a ratio of the average yield on insurers’ investments in CLOs to the average
yield of insurers’ investments in corporate bonds for each rating-year pair (henceforth
abridged “yields ratio”). Then, we extend model 3 by interacting the CLO dummy
with the yields ratio. Column 8 of Table 6 reports the result of this econometric model.
The interaction between the yields ratio and the CLO dummy is positive and statisti-
cally significant, suggesting that insurance companies purchase a larger portion of CLO
tranches compared to corporate bonds the larger is the difference between the yields on
CLOs investments and the yields on corporate bonds investments within a given rating
class. In columns 9-11 we further extend the analysis to include the triple interaction of
the CLO dummy with the yields ratio and the variables capturing firm capitalization.
While the simple capital ratio does not imply any differential effect, we find that firms
closer to the minimum capital requirements are more sensitive to the yields ratio when
deciding the extent of their investments in CLO tranches and corporate bonds.
The analysis presented so far is cross-sectional in nature, as all the models of
Table 6 (except those exploring the heterogeneity across firms based on their level of
capitalization) include insurer-year fixed effects. In this sense, the study conducted up
to this point sheds light on the preference for CLOs over corporate bonds by a given
insurance company in a specific year and within a certain rating class. As a natural
extension, we would like to explore the time series dimension of this phenomenon, as-
sessing how insurance companies’ preference for CLOs over corporate bonds has evolved
over time. However, the granular dataset at the firm-security-year level is not ideal for
this purpose. An important caveat to bear in mind is that the composition of insurance
companies investing in CLOs has changed significantly throughout our sample period.
In 2003-2008, only 4% of insurers invested in CLOs, whereas in the post-crisis decade
31

this percentage jumps to 26%.20 Also, the average percentage of a CLO tranche held by
an insurer moved from 22% in 2003-2008 to 10% in 2009-2019. This means that, in the
post-crisis decade, a larger number of insurance companies competed to invest in the
CLOs space and, as a result, firms ended up holding a lower portion of individual CLO
tranches compared to what they did in the time period 2003-2008. At the same time,
though, we also observe that insurance companies invested in a much wider set of CLO
tranches in the post-crisis decade compared to the 2003-2008 period (17% versus 52%
of the total number of tranches outstanding, respectively).
The proper way to gauge insurers’ preference for CLOs over corporate bonds
over time requires an analysis at a more aggregate level, i.e., at the insurer-asset class-
rating-year level. To that end, we construct this a dataset aggregating up the granular
data at the company-security-year level, so that we can calculate the volume of insurers’
first-time investments in CLOs (or corporate bonds) as a percentage of the total volume
outstanding of these securities with a given rating category and a specific year.21 We,
then, estimate the following model:
Holdingsarct × 100
Outstanding amountart=α + β1dummy CLOa + β2Time to maturityarct
+ β3Outstanding amountart +X ′ctβ4X ′ctβ4X ′ctβ4 + µr
+ µc + µl(c) + ε
(4)
where the dependent variable is the amount of first-time investments by company c in the
asset class a (CLO tranches or corporate bonds) with rating r in year t as a percentage
of the total volume outstanding of the asset class with that rating in that year. The
key variable of interest is the CLO dummy variable dummy CLOa. Time to maturityarct
is the average time-to-maturity of all new investments by insurer c in the asset class a
20Differently, all insurance companies invested in corporate bonds in both time periods.
21By construction, this dataset includes observations pertaining to insurers’ “zero investments” in a given asset class-rating category. For example, if a company does not hold any CLO tranche rated Baa in a given year, the percentage ofBaa-rated CLOs held by that company in that year is reported with a value of zero.
32

with rating r in year t, X ′ctX ′ctX ′ct is a set of firm controls, and µr(a) stands for rating fixed
effect.
The results of this exercise are shown in Table 7. Column 1 reports the estimates
of model 4. As expected, the coefficient of the CLO dummy is positive and statistically
significant, confirming that insurance companies purchase a larger fraction of CLOs
compared to corporate bonds. In the next two specifications, we saturate the model
with year fixed effects (column 2) and rating-year fixed effects (column 3) to mimic
the cross-sectional analysis of model 3 of Table 6. The coefficient of the CLO dummy
remains positive and both its magnitude and its statistical significance increase.
In model 4 we test how insurers’ preference for CLOs over corporate bonds evolved
over time. To this end, we extend the econometric specification of column 1 by interact-
ing the CLO dummy with a dummy identifying four time periods: pre-crisis (2003-2006),
financial crisis (2007-2008), zero lower bound (ZLB) period (2009-2015) and post-ZLB
(2016-2019). To ease the interpretation, we report the interaction terms as simple slopes
of the CLO dummy for each time period. We find that in the pre-crisis period, when the
yields ratio was between 0.5 and 1.25 for all investment grade rating classes, insurance
companies purchased a lower portion of CLO tranches compared to corporate bonds
with the same rating, suggesting a preference for corporate bonds over CLOs. However,
Their preference flipped starting with the financial crisis when the yields differential
between CLOs and corporate bonds widened. In the post-crisis decade, as the yields
ratio continued to be at relatively high levels, insurers’ preference for CLOs over cor-
porate bonds with the same rating became much more pronounced. Replacing rating
fixed effects with rating-year fixed effects in column 5 does not alter the results. In
the subsequent specification we interact the CLO dummy with a dummy identifying the
time period in which the 2010 regulatory reform was into effect (2010-2018). We find
that insurers’ preference for CLOs over corporate bonds is concentrated exactly during
the period in which the new regulatory regime was in place.
33

In the last three specifications of Table 7 we directly link insurers’ preference
for CLOs over corporate bonds to the difference in yields offered by CLO tranches and
corporate bonds by interacting the CLO dummy with the yields ratio. Since our sample
includes a large number of observations where insurance companies have zero investments
in CLO tranches, especially in the pre-crisis period, we limit the analysis to the sub-
sample of non-zero investments by insurance companies in each asset class-rating pair.
These three models (column 6-8) differ only in the set of fixed effects included, which
replicates the setup of columns 1-3. Irrespective of the combination of fixed effects, and
hence on the emphasis put on the time dimension or the cross-section dimension, we
find a positive and highly significant coefficient for the interaction between the CLO
dummy and the yields ratio, confirming that insurance companies tend to purchase a
larger portion of CLO tranches compared to corporate bonds the higher is the yields
differential between CLOs and corporate bonds.
Up to this point, we have investigated insurers’ preference for CLO tranches vis-
a-vis corporate bonds focusing on the amount of new investments in CLOs and corporate
bonds by insurance companies in proportion to the total volume outstanding of these two
asset classes. An alternative and, perhaps, more intuitive way to explore the preference
of insurers for one asset type versus the other would be to look at the the amount of, e.g.,
CLO holdings as a percentage of the total new investments in CLOs and corporate bonds
made by insurance companies. We implement this alternative approach, by estimating
the following econometric specification:
CLO holdingsrct × 100
Total holdingsrct=α + β1
Yield CLOrt
Yield Bondrt
+ β2CLOs Outstanding amountrtBonds Outstanding amountrt
+X ′ctβ3X ′ctβ3X ′ctβ3 + µr + µc
+ µl(c) + µt + ε
(5)
where the dependent variable is the amount of first-time investments by company c
34

in CLO tranches with rating r in year t as a percentage of the total volume of new
investments in CLOs and corporate bonds with that rating in that year. The key variable
of interest is the yields ratio, Yield CLOrt
Yield bondrt. CLOs Outstanding amountrt
Bonds Outstanding amountrtis the ratio of the total
outstanding amount of CLO tranches with rating r in year t to the total outstanding
amount of corporate bonds with rating r in year t.
Column 1 of Table 8 reports the estimates of this model. The coefficient of the
yields ratio is positive and statistically significant, indicating that insurance companies
direct a larger portion of their new investments within a given rating class towards CLOs
the higher is the yields ratio. In the following specification, we focus on the variation
within firm-year by saturating the model with company-time fixed effects. The coefficient
of the yields ratio remains virtually unchanged, suggesting that even within the same
year, an insurance company tends to allocate a larger fraction of its investments to CLO
tranches (relative to corporate bonds) the higher is the yields differential between CLOs
and corporate bonds with a given rating.
As we mentioned earlier, there has been an important shift in the composition
of insurance companies investing in CLO tranches after the financial crisis. Presum-
ably, before the crisis, only large and sophisticated insurers invested in CLOs, given the
complex nature and opacity of this asset class. As the time went by, a progressively
higher fraction of smaller and unsophisticated insurance companies entered the CLO
market. A potential concern about the relevance of the observed preference for CLOs
over corporate bonds in terms of implications for markets dynamics would be that this
phenomenon is mostly driven by the set of new entrants, which may not be influential
investors, especially in the CLOs space. To rule out this concern, we re-estimate mod-
els 1-2 on the subsample of insurance companies that invest in CLO tranches both in
the time period 2003-2008 and in the post-crisis decade (2009-2019). The coefficient
of the yields ratio remains highly significant and, if anything, increases in magnitude.
This suggests that the largest and more sophisticated insurers are actually the main
35

drivers of the progressive shift from corporate bonds to CLOs investments observed in
the insurance industry.
6 Implications of Insurance Companies’ Preference for CLOs
In the previous section, we documented insurance companies’ increasing preference for
CLOs, and particularly CLO mezzanine tranches, over corporate bonds, in connection
with their search for yield. This has potentially relevant implications for the market
for CLOs. Figure 16 shows that insurance companies’ market share of corporate bonds
exhibits a slightly downward trend (although with a twist in the immediate post-crisis
period) over the course of 2003-2019, moving from 21% in 2003 to 18% in 2019. When
we split the market share by ratings, we observe that this downward trend is common
across bonds rated Aa and below, whilst the market share of triple-A bonds remained
stable around 6% up to 2010, experienced a parabolic path in 2011-2017, and came back
to its original value in 2018-2019 (Figure 17).
Differently, insurers’ market share of CLO tranches exhibits a monotonic and
large increase throughout the sample period, moving from 4% in 2003 to 19% in 2019.
Figure 18 shows that this growth was mostly driven by mezzanine tranches Aa, A or Baa
rated, whose aggregate market share octupled in the post-crisis decade, rising from 5%
in 2009 to 44% in 2019. The par value of A-rated tranches held by insurance companies
in 2019 is above 50% of their total outstanding volume, while the market share of Aa
and Baa tranches is 42% and 39%, respectively. It is worth noting that our estimates
represent a lower bound, given the conservative approach we adopted to identify CLO
tranches held in insurers’ portfolio, as described in section 3.22
Importantly, in our sample, investment grade rated mezzanine tranches (Aa, A
22Indeed, our estimate is close, but somewhat below, DeMarco et al. (2020) estimate that domestic insurance companiesheld approximately 60% of Cayman-issued U.S. CLO tranches Aa, A or Baa rated in 2018 using Treasury InternationalCapital (TIC) data. According to Liu and Schmidt-Eisenlohr (2019), Cayman-issued U.S. CLOs represent approximately74% of total U.S. CLO securities in 2018.
36

and Baa rated) correspond to 23% of a CLO deal at issuance, whereas triple-A tranches
represent on average 62%, with the remaining 15% being junior tranches and the equity
tranche. There is plenty of demand for Aaa rated tranches, especially from banks due to
the favorable treatment in capital regulation of triple-A securities vis-a-vis assets with
lower credit quality. The investor base of mezzanine tranches looks quite different, with
banks playing only a marginal role (DeMarco et al., 2020; IMF, 2020). For example,
DeMarco et al. (2020) document that, in 2018, insurance companies held more than 50%
of (Cayman-issued) CLO tranches Aa, A or Baa rated, whereas the remaining investor
based is fragmented with various categories of investors (mutual funds, banks, funds or
other investment vehicles, pension funds, and non-financial organizations) holding less
than 10% each.
Putting these estimates together, we see that mezzanine tranches rated invest-
ment grade account for on average 23% of a CLO deal and insurance companies owned
as of 2019 about half of those tranches. In other words, insurance companies by owning
such a large fraction of the risky tranches of CLOs, those for which there is arguably less
demand in part because they are not attractive to banks, have become a critical player
in the securitization of corporate loans. This brings us to our fourth hypothesis, namely
that CLO deals with a larger holding share by insurance companies are characterized
by a larger fraction of mezzanine tranches. To investigate this hypothesis, we estimate
the following regression on CLO deals at issuance:
Trancherdmt × 100
Issue amountdmt
=α + β1Insurers holdingsdmt × 100
Issue amountdmt
+ µm + µt + ε (6)
where the dependent variable is the par value of a tranche/tranches with rating r of
CLO deal d issued in year t and managed by manager m, Trancherdmt, as a percentage
of the total issue amount of CLO deal d in year t, Issue amountdmt. Insurers holdingsdmt
is the par value of insurers’ aggregate holdings of CLO deal d in the year of the issuance.
We saturate the regression including manager fixed effects, µm, and year fixed effects,
37

µt, to account for any manager’s characteristics and issuance year’s macro conditions
that may affect the securitization structure of the CLO deal.
The coefficient of interest in model 6 is β1, which captures the correlation between
the percentage of a CLO deal represented by tranches with a given rating and the
percentage of the deal held by insurance companies. This regression is estimated on the
full sample of CLO deals issued between 2003 and 2019. Standard errors are clustered
by manager and issuance year (two-way clustering).
Table 9 reports the results of this exercise. We estimate the regression of equation
6, along with two extensions, for the subgroups of Aaa tranches (columns 1-3), mezzanine
tranches rated investment grade (columns 4-6), tranches rated below investment grade
(columns 6-9), and equity tranches (columns 10-12). The first specification suggests that
the triple-A share of CLO tranches pertaining to a deal is inversely correlated to the
percentage of the deal held by insurance companies. When we move to the subgroup of
tranches Aa, A and Baa rated, the coefficient of insurers’ holding share flips sign and is
statistically significant (column 4). The correlation is, instead, negative for the subset
of tranches below investment grade (column 7) and not significant for equity tranches
(column 10). Consistently with our priors, this evidence suggests that CLO deals in
which insurance companies invest more heavily are characterized by a larger fraction
of mezzanine tranches rated investment grade. A one standard deviation increase in
the share of a CLO deal held by insurance companies (14.18 percentage points in the
subsample where this regression is estimated) is associated to an increase in the share
of mezzanine tranches rated investment grade (Aa, A or Baa rated) by 4.17 percentage
points.
This positive correlation cannot be interpreted as causal, though, as it might be
confounded by reverse causality. While CLO managers may design the structure of a
CLO deal in order to meet insurers’ preference for mezzanine tranches Aa, A or Baa
rated, insurance companies may select themselves into CLO deals characterized by a
38

larger fraction of mezzanine tranches rated investment grade. We attempt to shed some
light on the direction of causation exploiting the regulatory reform on capital treatments
of insurers’ investments in CLOs enacted in 2010. Recall that this reform introduced a
form a capital relief for certain CLOs purchased at discount or highly impaired and was
applied both to existing and new investments. As we documented in the previous section,
and consistent with our hypothesis 2, following the 2010 regulatory reform, insurance
companies increased their investments in CLOs relative to bonds within NAIC buckets.
As such, we would expect an increase in the relative size of mezzanine tranches in CLO
deals issued after the implementation of the reform.
To investigate that hypothesis, we extend the baseline model including an in-
teraction between insurance companies’ holding share of the CLO deal and a dummy
equal to one for the time period in which the reform was in place (2010-2018) and zero
otherwise (columns 2, 5, 8 and 11). The coefficient of the interaction term is statisti-
cally significant only for the subgroup of mezzanine tranches. The positive coefficients
suggests that the correlation between insurers’ holding share and the percentage of mez-
zanine tranches rated investment grade is stronger for as long as the reform was in
place. We next replicate this exercise by splitting the sample into three time periods:
the pre-reform period (2003-2009), the reform period (2010-2018) and the post-reform
period (2019). We report the interaction between insurers’ holding share and the time
dummies as simple slopes for each time period. The correlation between the percentage
of tranches belonging to a given rating class and the percentage of the deal held by
insurance companies is negative and statistically significant for the subgroup of triple-A
tranches during the reform and the subgroup of tranches below investment grade in the
time periods 2003-2009 and 2010-2019. By contrast, the correlation is positive and sta-
tistically significant for the mezzanine tranches both in the pre-reform and the reform
periods, but the coefficient of the interaction term of the latter is more than twice that
of the former.
39

The previous results point to a possible adjustment in the design of corporate
loans’ securitization to satisfy the increasing demand for mezzanine tranches by insur-
ance companies in the wake of the capital requirements reform. While these results
help ease concerns with reverse causality, they are still only suggestive of a causal link
between insurance companies’ CLO preference and the design of CLO deals. To further
help establish this link, we designed a test based on the CLO deals that are refinanced.
At the end of the reinvestment period (which typically lasts between 2 and 5
years), CLO managers have the option to refinance the deal. They do so usually to
take advantage of a reduction in market spreads on CLO debt or to extend the maturity
of a CLO, or both, in order to benefit equity holders. This process can involve either
individual tranches or the full set of tranches in the deal (also known “reset”). In the
former case, some of the existing tranches are called and re-issued at current market
spreads, whereas the rest of the CLO deal (including the other tranches, the reinvest-
ment period and the maturity date) remains unchanged. In case of a reset, instead,
all tranches belonging to the deal are called and re-issued at a lower spread and both
the reinvestment period and the maturity date are extended. Refinancing has become a
common phenomenon starting in 2015 due to a tightening in CLO spreads (Ellington,
2018). The share of refinanced deals increased from 2% in 2015 to 21% in 2017, but
followed a downward path in 2018-2019 (Figure 19).23 We identify refinanced deals in
our sample as those satisfying the following two conditions: (i) tranches belonging to
the CLO deal are issued in two or more different years, and (ii) the balance of at least
one of the deal’s original tranches falls to zero before the maximum of its maturity date
and the last trustee report date. A CLO deal is typically refinanced once, but there are
cases of deals with multiple refinancing up to a maximum of 3.
We then investigate if insurers’ holding share is related to the likelihood that
23As mentioned earlier, information on CLOs in 2019 is partial as we have data on issuance only up to November 2019.So, it is possible that we underestimate the share of refinanced deals in 2019.
40

a deal is refinanced or not.24 Given our evidence on insurance companies’ preference
for CLO securities vis-a-vis corporate bonds and on their increased role as investors
in the CLO market we posit that CLO managers will find it easier to refinance CLOs
heavily owned by insurance companies. To test this hypothesis, we consider all CLO
deals during their lifetime and estimate the following regression:
dummy Refinancingdmt =α + β1
Insurers holdingsdmt−1 × 100
Outstanding volumedmt−1
+ µm + µt + ε (7)
where dummy Refinancingdmt is a dummy equal to one if CLO deal d managed by man-
ager m is refinanced in year t and zero otherwise. Insurers holdingsdmt−1 is the amount
held by insurance companies in deal d in year t − 1 (hence lagged of one period), and
Outstanding volumedmt−1 is the total volume outstanding of tranches belonging to deal
d at year-end t − 1. Similar to the previous analysis, we include manager fixed effects
and year fixed effects, to control for any manager and year-specific conditions that may
affect the likelihood of a refinancing. Standard errors are clustered by manager and year
(two-way clustering).
The first specification of Table 10 reports the estimates of this regression. Con-
sistent with our priors, the coefficient of insurers’ lagged holding share is positive and
statistically significant. We estimate this regression using a linear model rather than a
probit model because we need to include two sets of fixed effects to identify the cor-
relation of interest in a clean way (manager and year fixed effects). Nonlinear models
with fixed effects are known to suffer from the so called “incidental parameters problem”
(Neyman and Scott, 1948; Lancaster, 2000), which makes the maximum likelihood esti-
mator (MLE) inconsistent. Using a linear model to fit a regression where the outcome
variable is binary, on the other hand, exposes to inconsistent estimates. As a robustness
check, we re-estimate equation 7 using a probit model (column 2) including time dum-
24In principle, it would be preferable to investigate the likelihood that mezzanine tranches given insurance companies’preferences for these tranches. However, it is difficult to cleanly identify the refinancing of each tranche with the dataavailable.
41

mies and manager dummies for the individual specific effect. Note that the sample on
which this non-linear model is estimated shrinks compared to that of column 1, due to
the fact that some observations pertaining to year and manager dummy variables that
perfectly predict the outcome variable (also known as “perfect separation”) need to be
dropped to avoid infinitely large maximum likelihood estimates.25 For ease of interpre-
tation and comparison with the previous specification, we report the marginal effect of
insurers’ lagged holding share keeping all the other regressors constant at the sample
means. As in the linear model, CLO deals with higher insurance companies’ investments
are more likely to be refinanced.
In the last specification, we extend the baseline model of column 1 exploring a
possible heterogeneity in the correlation during the time period in which the regulatory
reform of 2010 remained in place. We find that the extent of insurers’ holding of a CLO
deal is positively associated with the likelihood of a refinancing exactly during the time
of the reform (2010-2018).
The results we reported in the previous section show a very clear preference of
insurance companies for CLOs, in particular their mezzanine tranches, over corporate
bonds. They also show that these preferences increased following the 2010 reform of
the insurance companies’ capital standards. While we do not have a test that cleanly
shows a causal impact of insurance companies’ preferences on the origination of CLOs,
the evidence we presented in this section strongly suggests they did impact the relative
size of mezzanine tranches in CLO deals. Mezzanine tranches play a critical role in the
origination of CLOs not only because they account for about 25% of CLO deals but
also because their junior position allows for the creation of the highly sought triple-
A tranches. Therefore, insurance companies’ growing preference for these tranches,
particularly after 2010, together with their dominant role in the market for these tranches
25Also, we cluster standard errors only by year, as two-way clustering is not supported by the probit function andsoftware used. This represents, though, a minor limitation, given that we include manager fixed effects and the data setis characterized by a much a higher serial correlation than cross correlation of residuals.
42

(they owned more that 44% of outstanding mezzanine tranches by 2019) likely played
a key role in the rise of corporate loan securitization we have observed over the last
decade.
7 Conclusions
Using data on asset holdings of insurance companies over 2003-2019, we document an
increasing preference in CLO investments vis-a-vis corporate bond investments. That
preference is particularly strong for mezzanine tranches rated investment grade (i.e.,
Aa, A and Baa rated). We show that this is consistent with a search for yield behavior.
Conditional on the asset type and capital charges, insurance companies invest more in
securities offering higher yields. That search for yield behavior is linked to insurers’
increasing preference for CLOs over corporate bonds. Conditional on the credit rating
of the security, insurance companies tend to purchase a higher fraction of CLO tranches
compared to corporate bonds the larger is the difference in the yields carried by the two
asset classes. Similarly, we find that the share of new securities in portfolio represented
by CLO tranches grows for increasing levels of the yields differential.
We explore the implications of the observed proclivity of insurance companies
towards CLOs for the CLO market. We show that insurance companies have become an
important class of investors in CLO securities, representing roughly half of the investor
base in CLO mezzanine tranches rated investment grade. The demand for mezzanine
tranches is critical for the issuance of CLOs as their junior position allows for the creation
of senior tranches rated triple-A. In addition, we document that insurers’ preference for
CLO mezzanine tranches had an impact on the design and refinancing of CLO deals. In
particular, we find that CLO deals with higher insurers’ investments are characterized
by a larger share of mezzanine tranches rated investment grade and are more likely to
be refinanced. Overall, this suggests that insurance companies played an important role
43

in the expansion of corporate loans’ securitization observed in the last decade.
Our findings provide three interrelated economic insights. First, they confirm
that regulation is able to strongly affect firms’ incentives to take on risk. While most
of the literature has explored this link focusing on banks, our findings show that it is
also present among insurance companies and highlight an important implication from
the different design of capital regulation applied to banks and insurance companies.
Second, our results show that insurance companies have been playing a complementary
role to banks in the securitization of corporate loans and, by extension, in the growth
of the shadow banking sector. Third, corporate loans’ securitization together with the
differences between banks’ and insurers’ capital regulation has contributed to the transfer
a substantial portion of credit risk from the banking sector to the insurance sector.
This brings us to some potentially important questions for future research. For
example, is this allocation of credit risk throughout the financial system optimal? Is
the current structure of financial intermediaries involved in the provision of bank credit
better suited to guarantee funding to corporations over the business cycle than one based
on banks alone?
44

Figure 1: U.S. CLOs New Issuance
050
100
150
200
Volu
me in
bln
2003 2005 2007 2009 2011 2013 2015 2017 2019
Year
This figure plots the time series of the volume of total new issuance of CLO tranches denominated in USD, excludingrefinanced tranches, over the time period 2003-2019 on a yearly basis. The data covers CLOs issuance up to November 8,2019. Thus, the data point corresponding to 2019 represents the total volume of CLO tranches issued between January1, 2019, and November 8, 2019. Source: Moody’s Analytics Structured Finance Portal.
Figure 2: U.S. CLOs Outstanding
0200
400
600
Volu
me in
bln
2003 2005 2007 2009 2011 2013 2015 2017 2019
Year
This figure plots the time series of the total outstanding volume of CLO tranches denominated in USD over the timeperiod 2003-2019 on a yearly basis. The data covers CLOs outstanding up to November 8, 2019. Thus, the data pointcorresponding to 2019 represents the total volume of CLO tranches outstanding between January 1, 2019, and November8, 2019. Source: Moody’s Analytics Structured Finance Portal.
Figure 3: Insurance Companies’ Investments Over Time
1000
1200
1400
1600
1800
Volu
mes
Cor
pora
te B
onds
in b
ln
050
100
150
Volu
mes
Loa
ns a
nd C
LOs
in b
ln
2004 2006 2008 2010 2012 2014 2016 2018Year
Loans CLOs
Bonds
This figure plots the time series of insurance companies’ holdings of bonds, corporate loans and CLOs as of December 31of each year during the time period 2003-2019. Source: Schedule D-Part 1 of the annual financial statement filings of life,P&C and health insurance companies submitted to the NAIC and retrieved from SNL Financial.
45

Figure 4: Insurance Companies’ Investments in Corporate Bonds Over Time by Rating
010
2030
4050
Perc
enta
ge IC
s ho
ldin
gs o
f cor
pora
te b
onds
2004 2006 2008 2010 2012 2014 2016 2018Year
Aaa Aa
A Baa
Ba B
Caa−Ca−C NR
WR NA
This figure plots the time series of the volume of corporate bond holdings by credit rating as percentage of the totalvolume of corporate bonds held by insurance companies as of December 31 of each year during the time period 2003-2019.Source: Schedule D-Part 1 of the annual financial statement filings of life, P&C and health insurance companies submittedto the NAIC and retrieved from SNL Financial. Information on the credit rating of corporate bonds comes from MergentFixed Income Securities Database (FISD) and Moody’s.
Figure 5: Insurance Companies’ Investments in CLOs over Time by Rating
020
4060
Perc
enta
ge IC
s ho
ldin
gs C
LOs
2003 2005 2007 2009 2011 2013 2015 2017 2019Year
Aaa Aa
A Baa
Ba B
Caa−Ca−C NR
WR NA
This figure plots the time series of the volume of CLO holdings by credit rating as percentage of the total volume of CLOtranches held by insurance companies as of December 31 of each year during the time period 2003-2019. Source: ScheduleD-Part 1 of the annual financial statement filings of life, P&C and health insurance companies submitted to the NAICand retrieved from SNL Financial. Information on the credit rating of CLOs comes from Moody’s Analytics StructuredFinance Portal.
Figure 6: Yield on Insurance Companies’ Investments in Corporate Bonds by Rating
05
1015
20Av
erag
e Yi
eld
2004 2006 2008 2010 2012 2014 2016 2018Year
Aaa Aa
A Baa
Ba B
Caa−Ca−C
This figure plots the time series of the average yield of corporate bond holdings reported by insurance companies bycredit rating as of December 31 of each year during the time period 2003-2019. Source: Schedule D-Part 1 of the annualfinancial statement filings of life, P&C and health insurance companies submitted to the NAIC and retrieved from SNLFinancial. Information on the credit rating of corporate bonds comes from Mergent Fixed Income Securities Database(FISD) and Moody’s.
46

Figure 7: Yield on Insurance Companies’ Investments in CLOs by Rating
05
1015
Aver
age
Yiel
d
2004 2006 2008 2010 2012 2014 2016 2018Year
Aaa Aa
A Baa
Ba B
Caa−Ca−C
This figure plots the time series of the average yield of CLO holdings reported by insurance companies by credit ratingas of December 31 of each year during the time period 2003-2019. Source: Schedule D-Part 1 of the annual financialstatement filings of life, P&C and health insurance companies submitted to the NAIC and retrieved from SNL Financial.Information on the credit rating of CLOs comes from Moody’s Analytics Structured Finance Portal.
Figure 8: Yield on Insurance Companies’ Investments in CLOs to Yield of Insurance Companies’Investments in Corporate Bonds by Rating
.51
1.5
22.
5R
atio
Avg
Yie
ld C
LOs/
Avg
Yiel
d Bo
nds
2004 2006 2008 2010 2012 2014 2016 2018Year
Aaa Aa
A Baa
Ba B
This figure plots the time series of the “yields ratio” of insurers’ first-time investments in CLO tranches and corporatebonds, that is the ratio of the average yield on new investments in CLOs to the average yield of new investments incorporate bonds, by credit rating as of December 31 of each year during the time period 2003-2019. Source: ScheduleD-Part 1 of the annual financial statement filings of life, P&C and health insurance companies submitted to the NAICand retrieved from SNL Financial. Information on the credit rating of corporate bonds comes from Mergent Fixed IncomeSecurities Database (FISD) and Moody’s, whereas information on the credit rating of CLOs comes from Moody’s AnalyticsStructured Finance Portal.
Figure 9: Insurance Companies’ Share of NAIC 1 Investments Reported According to the MFEProcess
05
1015
% v
olum
e C
LOs
new
hol
ding
s
2003 2005 2007 2009 2011 2013 2015 2017 2019Year
CLO Exception AM CLO Exception Rating
This figure plots the time series of (i) the percentage of CLO holdings in the NAIC 1 designation bucket reported accordingto the “modified filing exempt” approach, MFE, as identified from the “AM” suffix included in the NAIC designation(blu line), and (ii) the percentage of CLO holdings in the NAIC 1 designation bucket that have a credit rating differentfrom Aaa, Aa or A (red line). Source: Schedule D-Part 1 of the annual financial statement filings of life, P&C and healthinsurance companies submitted to the NAIC and retrieved from SNL Financial. Information on the credit rating of CLOscomes from Moody’s Analytics Structured Finance Portal.
47

Figure 10: Share of CLOs Held by Insurance Companies by Percentiles of the Distribution ofYields
020
4060
% v
olum
e ou
tsta
ndin
g
2003 2005 2007 2009 2011 2013 2015 2017 2019Year
Yield 0−33th Yield 33−66th
Yield 66−100th
This figure plots the time series of insurers’ new CLO holdings in the NAIC 1 designation bucket as percentage of thetotal volume outstanding of these CLO tranches based on percentiles of the distribution of CLOs yields reported byinsurance companies as of December 31 of each year during the time period 2003-2019. New CLO holdings are identifiedas first-time investments in a given CLO tranche by an insurance company. Source: Schedule D-Part 1 of the annualfinancial statement filings of life, P&C and health insurance companies submitted to the NAIC and retrieved from SNLFinancial.
Figure 11: Share of CLOs Held by Insurance Companies by Rating
1020
3040
5060
% v
olum
e ou
tsta
ndin
g
2003 2005 2007 2009 2011 2013 2015 2017 2019Year
Aaa Aa
A
This figure plots the time series of insurers’ new CLO holdings in the NAIC 1 designation bucket as percentage of thetotal volume outstanding of these CLO tranches by credit rating as of December 31 of each year during the time period2003-2019. New CLO holdings are identified as first-time investments in a given CLO tranche by an insurance company.Source: Schedule D-Part 1 of the annual financial statement filings of life, P&C and health insurance companies submittedto the NAIC and retrieved from SNL Financial. Information on the credit rating of CLOs comes from Moody’s AnalyticsStructured Finance Portal.
Figure 12: Share of Corporate Bonds Purchased by Insurance Companies by Percentiles of theDistribution of Yields
05
1015
% v
olum
e ou
tsta
ndin
g
2003 2005 2007 2009 2011 2013 2015 2017 2019Year
Yield 0−33th Yield 33−66th
Yield 66−100th
This figure plots the time series of insurers’ new corporate bond holdings in the NAIC 1 designation bucket as percentageof the total volume outstanding of these corporate bonds based on percentiles of the distribution of corporate bonds yieldsreported by insurance companies as of December 31 of each year during the time period 2003-2019. New corporate bondholdings are identified as first-time investments in a given corporate bond by an insurance company. Source: ScheduleD-Part 1 of the annual financial statement filings of life, P&C and health insurance companies submitted to the NAICand retrieved from SNL Financial.
48
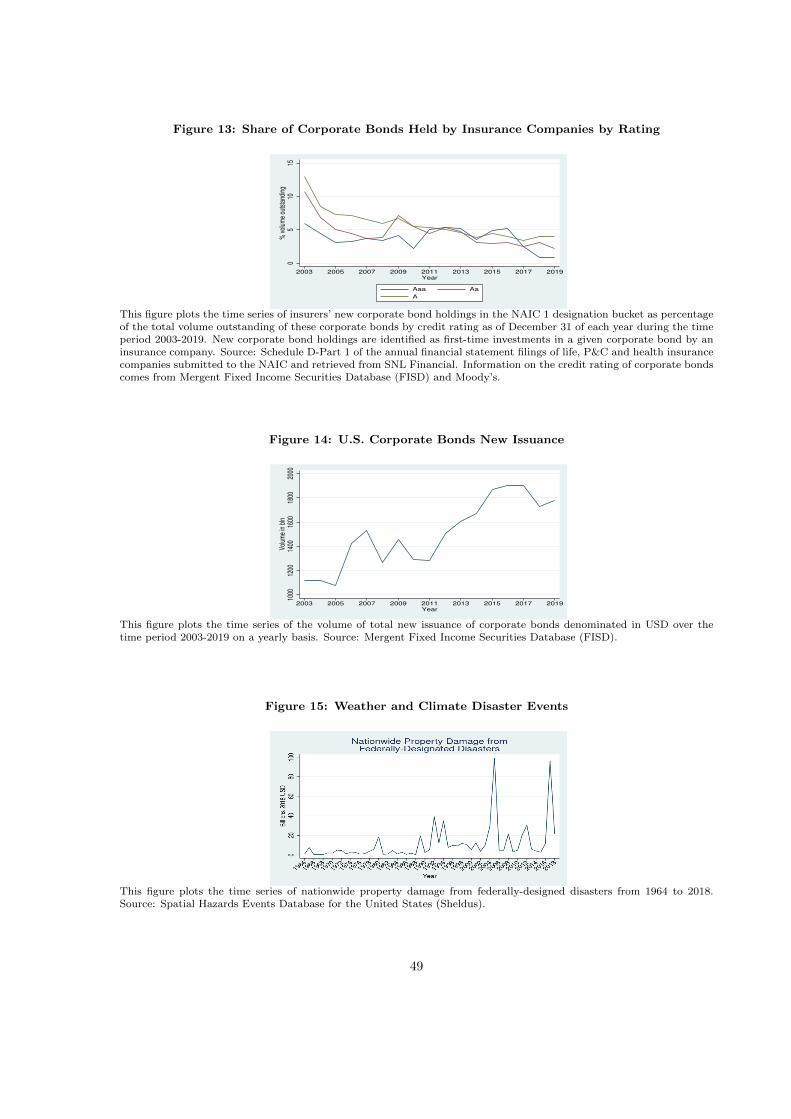
Figure 13: Share of Corporate Bonds Held by Insurance Companies by Rating
05
1015
% v
olum
e ou
tsta
ndin
g
2003 2005 2007 2009 2011 2013 2015 2017 2019Year
Aaa Aa
A
This figure plots the time series of insurers’ new corporate bond holdings in the NAIC 1 designation bucket as percentageof the total volume outstanding of these corporate bonds by credit rating as of December 31 of each year during the timeperiod 2003-2019. New corporate bond holdings are identified as first-time investments in a given corporate bond by aninsurance company. Source: Schedule D-Part 1 of the annual financial statement filings of life, P&C and health insurancecompanies submitted to the NAIC and retrieved from SNL Financial. Information on the credit rating of corporate bondscomes from Mergent Fixed Income Securities Database (FISD) and Moody’s.
Figure 14: U.S. Corporate Bonds New Issuance
10
00
12
00
14
00
16
00
18
00
20
00
Vo
lum
e in
bln
2003 2005 2007 2009 2011 2013 2015 2017 2019
Year
This figure plots the time series of the volume of total new issuance of corporate bonds denominated in USD over thetime period 2003-2019 on a yearly basis. Source: Mergent Fixed Income Securities Database (FISD).
Figure 15: Weather and Climate Disaster Events
This figure plots the time series of nationwide property damage from federally-designed disasters from 1964 to 2018.Source: Spatial Hazards Events Database for the United States (Sheldus).
49

Figure 16: Insurance Companies’ Market Shares of CLOs and Corporate Bonds
510
1520
25%
out
stan
ding
vol
ume
2004 2006 2008 2010 2012 2014 2016 2018Year
CLOs held by ICs as % of total outstanding CLOs
Corp. bonds held by ICs as % of total outstanding corp. bonds
This figure plots the time series of (i) the aggregate volume of CLO holdings of insurance companies as percentage ofthe total volume outstanding of CLO tranches (blue line) and (ii) the aggregate volume of corporate bond holdings ofinsurance companies as percentage of the total volume outstanding of corporate bonds (red line) as of December 31 of eachyear during the time period 2003-2019. Source: Schedule D-Part 1 of the annual financial statement filings of life, P&Cand health insurance companies submitted to the NAIC and retrieved from SNL Financial; Moody’s Analytics StructuredFinance Portal; Mergent Fixed Income Securities Database (FISD).
Figure 17: Insurance Companies’ Market Shares of Corporate Bonds
510
1520
2530
% v
olum
e ou
tsta
ndin
g
2004 2006 2008 2010 2012 2014 2016 2018Year
Aaa Aa−A−Baa
Ba−B−Caa−Ca−C
This figure plots the time series of the aggregate volume of corporate bond holdings of insurance companies as percentageof the total volume outstanding of corporate bonds by credit rating as of December 31 of each year during the timeperiod 2003-2019. Source: Schedule D-Part 1 of the annual financial statement filings of life, P&C and health insurancecompanies submitted to the NAIC and retrieved from SNL Financial; Mergent Fixed Income Securities Database (FISD);Moody’s.
Figure 18: Insurance Companies’ Market Shares of CLOs
010
2030
40%
vol
ume
outs
tand
ing
2004 2006 2008 2010 2012 2014 2016 2018Year
Aaa Aa−A−Baa
Ba−B−Caa−Ca−C
This figure plots the time series of the aggregate volume of CLO holdings of insurance companies as percentage of the totalvolume outstanding of CLO tranches by credit rating as of December 31 of each year during the time period 2003-2019.Source: Schedule D-Part 1 of the annual financial statement filings of life, P&C and health insurance companies submittedto the NAIC and retrieved from SNL Financial; Moody’s Analytics Structured Finance Portal.
50

Figure 19: Percentage of Refinanced CLOs
05
1015
20Pe
rcen
tage
of r
efin
ance
d de
als
2004 2006 2008 2010 2012 2014 2016 2018Year
This figure plots the time series of the percentage of refinanced CLO deals on a yearly basis over the period 2003-2019.Source: Moody’s Analytics Structured Finance Portal.
Table 1: Risk-Based Capital Requirements for Asset Risk
RBC charge (%)NAIC Designation Life (pre-tax) Life (post-tax) P&C and Health Credit Rating
1 0.40% 0.30% 0.30% Aaa, Aa, A2 1.30% 0.96% 1.00% Baa3 4.60% 3.39% 2.00% Ba4 10.00% 7.38% 4.50% B5 23.00% 16.96% 10.00% Caa6 30.00% 19.50% 30.00% Ca, C
This table reports the risk-based capital charges for asset risk applied to fixed income investments of Life, P&C andHealth insurance companies. The regulation defines risk-based capital charges associated to fixed income securities heldby Life insurers both on a pre-tax and post-tax basis, whereas no tax adjustment is required in the case of P&C andHealth insurers. Source: NAIC.
Table 2: Modified Filing Exempt Approach
NAIC Designation BreakpointsLife 1>2 2>3 3>4 4>5 5>6NAIC 2 97.88 100.00 104.69 116.23 132.04NAIC 3 93.49 95.52 100.00 111.02 126.12NAIC 4 84.22 86.04 90.08 100.00 113.61NAIC 5 74.13 75.73 79.29 88.02 100.00P&C and Health 1>2 2>3 3>4 4>5 5>6NAIC 2 99.14 100.00 101.81 106.20 123.13NAIC 3 97.28 98.22 100.00 104.31 120.94NAIC 4 93.36 94.16 95.87 100.00 115.94NAIC 5 80.52 81.22 82.69 86.25 100.00
This table reports the NAIC designation breakpoints used in the “modified filing exempt”, MFE, approach introducedby the 2010 regulatory reform to assign a NAIC designation to CLO tranches rated Baa to Caa. The MFE approachremained into effect from the reporting year 2010 to the reporting year 2018. Source: NAIC.
51

Table 3: Search for yield: Baseline regressions
(1) (2) (3) (4) (5)Dependent variable Insurance company’s holding as percentage of total volume outstanding
Yield 0.067*** 0.069** 0.069** 0.069** 0.003(0.02) (0.03) (0.03) (0.03) (0.01)
dummy CLO 4.680***(0.86)
dummy CLO x Yield 1.114***(0.22)
Time-to-maturity -0.003 -0.002 -0.002 0.000 0.001(0.00) (0.00) (0.00) (0.00) (0.00)
Outstanding Amount -0.299*** -0.330*** -0.330*** -0.307*** -0.296***(0.05) (0.05) (0.05) (0.04) (0.05)
Size 0.256*** 0.256***(0.02) (0.02)
ROE -0.325 -0.325(0.21) (0.21)
Capital ratio 0.036 0.036(0.13) (0.13)
CAL RBC ratio 0.002***(0.00)
ACL RBC ratio 0.001***(0.00)
constant 0.944*** -2.717*** -2.717*** 0.906*** 0.880***(0.10) (0.32) (0.32) (0.09) (0.05)
NAIC designation x Year FE Yes Yes Yes Yes YesSecurity type (CLO or bond) FE Yes Yes Yes Yes NoSecurity issuer FE No No No Yes NoType insurer FE Yes Yes Yes Yes YesInsurer x Year FE Yes No No Yes Yes
Two-way clustering Insurer, Year Insurer, Year Insurer, Year Insurer, Year Insurer, Year
N 1691393 1653931 1653931 1690436 1691393R2 0.2915 0.205 0.205 0.4224 0.2991Adj −R2 0.274 0.205 0.205 0.4041 0.2818F-stat 25.318*** 26.425*** 26.425*** 28.863*** 32.32***Degrees of freedom (3, 16) (7, 16) (7, 16) (3, 16) (5, 16)
This table reports panel regression estimates of the linear regression model of equation 1 and its extensions analyzinginsurers’ search for yield in the CLO and corporate bond asset classes. The models are estimated on a granular dataset atthe security-company-year level covering first-time investments by insurance companies in CLO tranches and corporatebonds. The dependent variable is the amount held by an insurance company in a given security and in a certain year(when the insurer makes its first investment in the security) as a percentage of the volume outstanding of the securityin that year. As for the independent variables, Yield is the yield (i.e., the effect rate or return) of the security reportedby the insurer; dummy CLO is a dummy variable equal to one if the security is a CLO tranche and zero otherwise;Time-to-maturity is the time to maturity of the security in years reported by the insurer; Outstanding Amount is thevolume outstanding of the security; Size is the natural logarithm of total admitted assets of the insurer; ROE is the ratioof net income to total adjusted capital of the insurer; Capital ratio is the ratio of total adjusted capital to total admittedassets of the insurer; CAL RBC ratio is the CAL risk-based capital ratio of the insurer; ACL RBC ratio is the ACLrisk-based capital ratio of the insurer. For each independent variable the first row reports the coefficient, the second rowreports in parenthesis the robust standard error that is corrected for multiclustering at the insurer and year level. Fixedeffects are included, “Yes”, not included, “No”, or subsumed by other fixed effects, “-”. ***, **, and * indicate statisticalsignificance at the 1%, 5% and 10% levels, respectively.
52

Table 4: Search for yield: Heterogeneity over time
(1) (2) (3) (4)
Dependent variableInsurance company’s holding as percentage
of total volume outstanding
Yield -0.011(0.01)
Year=2003 x Yield 0.034***(0.01)
Year=2004 x Yield 0.014(0.01)
Year=2005 x Yield -0.015(0.01)
Year=2006 x Yield 0.041**(0.01)
Year=2007 x Yield 0.064***(0.01)
Year=2008 x Yield -0.019***(0.00)
Year=2009 x Yield 0.006(0.01)
Year=2010 x Yield 0.025***(0.01)
Year=2011 x Yield 0.057***(0.02)
Year=2012 x Yield 0.120***(0.02)
Year=2013 x Yield 0.182***(0.02)
Year=2014 x Yield 0.168***(0.04)
Year=2015 x Yield 0.114***(0.03)
Year=2016 x Yield 0.136***(0.02)
Year=2017 x Yield 0.148***(0.04)
Year=2018 x Yield 0.171***(0.03)
Year=2019 x Yield 0.007(0.03)
Year=2003-2006 x Yield 0.032* 0.02(0.02) (0.01)
Year=2007-2008 x Yield 0.014 -0.001(0.03) (0.02)
Year=2009-2015 x Yield 0.115*** 0.086**(0.04) (0.03)
Year=2016-2019 x Yield 0.363*** 0.113***(0.07) (0.04)
dummy CLO 6.641**(2.59)
dummy CLO x Yield 0.598**(0.26)
dummy Reform x Yield 0.024*(0.01)
dummy Reform x dummy CLO -2.567(2.58)
dummy Reform x dummy CLO x Yield 0.708**(0.33)
Continued on next page
53

Table 4 - continued from previous page(1) (2) (3) (4)
Dependent variableInsurance company’s holding as percentage
of total volume outstanding
Time-to-maturity -0.005 -0.011* -0.004 0.000(0.00) (0.01) (0.00) (0.00)
Outstanding Amount -0.302*** -0.571*** -0.300*** -0.296***(0.05) (0.06) (0.05) (0.05)
constant 0.928*** 0.890*** 0.942*** 0.885***(0.06) (0.09) (0.07) (0.05)
NAIC designation x Year FE Yes Yes Yes YesSecurity type (CLO or bond) FE Yes No Yes NoSecurity issuer FE No No No NoType insurer FE Yes Yes Yes YesInsurer x Year FE Yes Yes Yes Yes
Two-way clustering Insurer, Year Insurer, Year Insurer, Year Insurer, Year
N 1691393 1691393 1691393 1691393R2 0.2919 0.1919 0.2916 0.2998Adj −R2 0.2744 0.1719 0.2741 0.2825F-stat - 14.456*** 11.556*** 25.199***Degrees of freedom (19, 16) (6, 16) (6, 16) (8, 16)
This table reports panel regression estimates of a series of extensions to the linear regression model of equation 1 analyzingthe heterogeneity over time of insurers’ search for yield in the CLO and corporate bond asset classes. The models areestimated on a granular dataset at the security-company-year level covering first-time investments by insurance companiesin CLO tranches and corporate bonds. The dependent variable is the amount held by an insurance company in a givensecurity and in a certain year (when the insurer makes its first investment in the security) as a percentage of the volumeoutstanding of the security in that year. As for the independent variables, Yield is the yield (i.e., the effect rate or return)of the security reported by the insurer; dummy CLO is a dummy variable equal to one if the security is a CLO tranche andzero otherwise; dummy Reform is a dummy equal to one if the year falls into the time period 2010-2018, when the 2010regulatory reform was into effect, and zero otherwise; Time-to-maturity is the time to maturity of the security in yearsreported by the insurer; Outstanding Amount is the volume outstanding of the security; Size is the natural logarithm oftotal admitted assets of the insurer; ROE is the ratio of net income to total adjusted capital of the insurer; Capital ratiois the ratio of total adjusted capital to total admitted assets of the insurer; CAL RBC ratio is the CAL risk-based capitalratio of the insurer; ACL RBC ratio is the ACL risk-based capital ratio of the insurer. For each independent variablethe first row reports the coefficient, the second row reports in parenthesis the robust standard error that is corrected formulticlustering at the insurer and year level. Fixed effects are included, “Yes”, not included, “No”, or subsumed by otherfixed effects, “-”. ***, **, and * indicate statistical significance at the 1%, 5% and 10% levels, respectively.
54
Table 5: Search for yield: Heterogeneity across insurance companies
(1) (2) (3) (4) (5) (6)
Sample All insurersP&C
insurers
Years 2003-2006P&C insurers with2005 ∆Net Incomebelow the median
P&C insurers with2017 ∆Net Incomebelow the median
Dependent variable Insurance company’s holding as percentage of total volume outstandingYield 0.127** 0.073** 0.073** 0.033** 0.001 0.022
(0.04) (0.03) (0.03) (0.01) (0.01) (0.02)Capital ratio x Yield -0.173**
(0.06)CAL RBC ratio x Yield -0.001**
(0.00)ACL RBC ratio x Yield -0.000**
(0.00)Year=2005 x Yield -0.033** -0.013
(0.01) (0.01)Year=2017 x Yield -0.025* 0.065**
(0.01) (0.03)Y ear > 2005 x Yield 0.004
(0.01)Y ear > 2017 x Yield -0.011
(0.63)Below Median ∆Net Income 0.038
(0.04)Below Median ∆Net Income x Yield -0.005
(0.01)Below Median ∆Net Income x Year=2005 -0.074
(0.08)Below Median ∆Net Income x Year=2017 -0.367***
(0.07)Below Median ∆Net Income x Year=2005 x Yield 0.035*
(0.02)Below Median ∆Net Income x Year=2017 x Yield 0.101***
(0.02)Time-to-maturity -0.002 -0.002 -0.002 -0.001 0.000 0.001
(0.00) (0.00) (0.00) (0.00) (0.00) (0.00)Outstanding Amount -0.330*** -0.330*** -0.330*** -0.213*** -0.479*** -0.224***
(0.05) (0.05) (0.05) (0.03) (0.06) (0.03)Size 0.257*** 0.256*** 0.256*** 0.157*** 0.229*** 0.168***
(0.02) (0.02) (0.02) (0.02) (0.03) (0.03)ROE -0.311 -0.324 -0.324 -0.059 0.004 -0.133
(0.21) (0.21) (0.21) (0.10) (0.14) (0.28)Capital ratio 0.757*** 0.041 0.041 0.053 0.188 -0.238
(0.25) (0.13) (0.13) (0.13) (0.29) (0.20)CAL RBC ratio 0.001** 0.004*** 0.000 0.000 0.001
(0.00) (0.00) (0.00) (0.00) (0.00)ACL RBC ratio 0.002***
(0.00)constant -2.989*** -2.730*** -2.730*** -1.544*** -2.120*** -1.550***
(0.34) (0.32) (0.32) (0.25) (0.43) (0.34)
NAIC designation x Year FE Yes Yes Yes Yes Yes YesSecurity type (CLO or bond) FE Yes Yes Yes Yes Yes YesSecurity issuer FE No No No No No NoType insurer FE Yes Yes Yes No No NoInsurer x Year FE No No No No No No
Two-way clustering Insurer, Year Insurer, Year Insurer, Year Insurer, Year Insurer, Year Insurer, Year
N 1653931 1653931 1653931 620644 43891 321247R2 0.2053 0.205 0.205 0.1301 0.0851 0.1444Adj −R2 0.2053 0.205 0.205 0.13 0.0844 0.1441F-stat 25.362*** 26.342*** 26.342*** - - 19.889***Degrees of freedom (8, 16) (8, 16) (8, 16) (15, 15) (9, 3) (9, 16)
This table reports panel regression estimates of a series of extensions to the linear regression model of equation 1 analyzingthe heterogeneity across companies of insurers’ search for yield in the CLO and corporate bond asset classes. The modelsare estimated on a granular dataset at the security-company-year level covering first-time investments by insurancecompanies in CLO tranches and corporate bonds. Model 4 is estimated on the subsample of P&C insurers; model 5 andmodel 6 are estimated on the subsamples of P&C insurers whose yearly change in net income is below the median in 2005and 2017, respectively. The dependent variable is the amount held by an insurance company in a given security and in acertain year (when the insurer makes its first investment in the security) as a percentage of the volume outstanding of thesecurity in that year. As for the independent variables, Yield is the yield (i.e., the effect rate or return) of the securityreported by the insurer; Below Median ∆Net Income is a dummy variable equal to one if the change in net income ofa P&C insurer is below the median; Time-to-maturity is the time to maturity of the security in years reported by theinsurer; Outstanding Amount is the volume outstanding of the security; Size is the natural logarithm of total admittedassets of the insurer; ROE is the ratio of net income to total adjusted capital of the insurer; Capital ratio is the ratio oftotal adjusted capital to total admitted assets of the insurer; CAL RBC ratio is the CAL risk-based capital ratio of theinsurer; ACL RBC ratio is the ACL risk-based capital ratio of the insurer. For each independent variable the first rowreports the coefficient, the second row reports in parenthesis the robust standard error that is corrected for multiclusteringat the insurer and year level. Fixed effects are included, “Yes”, not included, “No”, or subsumed by other fixed effects,“-”. ***, **, and * indicate statistical significance at the 1%, 5% and 10% levels, respectively.
55

Table
6:
Insu
rance
Com
panie
s’P
refe
rence
for
CL
Os
vis
-a-v
isC
orp
ora
teB
onds
(1)
(2)
(3)
(4)
(5)
(6)
(7)
(8)
(9)
(10)
(11)
Sam
ple
Ass
ets
wit
hA
aa,
Aa,
Aand
Baa
rati
ng
Dep
enden
tva
riab
leY
ield
(%)
Insu
rance
com
pan
y’s
new
hold
ing
as
per
centa
ge
of
tota
lvo
lum
eouts
tandin
g
dum
my
CL
O0.7
04*
**
10.5
30***
14.3
31***
10.
422*
**
10.
422*
**
-0.6
84
6.584
-1.7
08
-1.7
08
(0.1
1)
(0.8
1)
(1.0
2)
(0.8
2)
(0.8
2)(3
.73)
(5.1
1)
(3.8
1)
(3.8
1)
Yie
ldC
LO
/Yie
ldB
ond
rati
o0.5
63
-0.9
26*
-0.4
72
-0.4
72(0
.39)
(0.4
6)
(0.2
8)(0
.28)
dum
my
CL
Ox
Yie
ldC
LO
/Yie
ldB
ond
rati
o7.9
09**
5.2
78.3
60**
8.360**
(2.8
7)
(3.9
1)
(2.9
9)(2
.99)
Cap
ital
rati
ox
dum
my
CL
O-2
0.7
11**
*-1
6.4
8(2
.07)
(10.8
0)
CA
LR
BC
rati
ox
dum
my
CL
O-0
.053**
*0.0
53(0
.01)
(0.0
5)A
CL
RB
Cra
tio
xdum
my
CL
O-0
.027*
**
0.0
26
(0.0
0)
(0.0
3)
Cap
ital
rati
ox
Yie
ldC
LO
/Yie
ldB
ond
rati
o1.5
19**
(0.6
4)C
AL
RB
Cra
tio
xY
ield
CL
O/Y
ield
Bon
dra
tio
0.0
03*
*(0
.00)
AC
LR
BC
rati
ox
Yie
ldC
LO
/Yie
ldB
ond
rati
o0.0
02**
(0.0
0)
Cap
ital
rati
ox
dum
my
CL
Ox
Yie
ldC
LO
/Yie
ldB
ond
rati
o-3
.52
(8.3
1)
CA
LR
BC
rati
ox
dum
my
CL
Ox
Yie
ldC
LO
/Yie
ldB
ond
rati
o-0
.090
*(0
.05)
AC
LR
BC
rati
ox
dum
my
CL
Ox
Yie
ldC
LO
/Yie
ldB
ond
rati
o-0
.045*
(0.0
2)
Rat
ing=
Aaa
-0.6
77**
*0.3
69**
(0.2
1)(0
.13)
Rat
ing=
Aa
-0.2
14**
*0.1
41**
(0.0
3)(0
.05)
Rat
ing=
Baa
0.532*
**-0
.132**
*(0
.04)
(0.0
2)
Rat
ing=
Aaa
xdum
my
CL
O0.
238
4.7
80***
(0.2
7)(0
.66)
Rat
ing=
Aa
xdum
my
CL
O0.4
73**
*10
.654***
(0.1
1)(1
.04)
Rat
ing=
Ax
dum
my
CL
O0.
927*
**12.
136*
**
(0.1
1)(0
.96)
Rat
ing=
Baa
xdum
my
CL
O1.5
56**
*12.7
08**
*(0
.14)
(1.3
3)
Tim
e-to
-mat
uri
ty(y
ears
)0.0
61**
*0.
062
***
-0.0
01
-0.0
01
0.006
**
0.0
00
0.0
00
-0.0
02
0.0
03
-0.0
03-0
.003
(0.0
1)(0
.01)
(0.0
0)
(0.0
0)
(0.0
0)
(0.0
0)
(0.0
0)
(0.0
0)
(0.0
0)
(0.0
0)
(0.0
0)
Outs
tandin
gA
mou
nt
($bln
)0.0
71*
**
0.0
62**
*-0
.257***
-0.2
68***
-0.2
98***
-0.2
84*
**
-0.2
84***
-0.2
50**
*-0
.325
***
-0.3
08***
-0.3
08*
**
(0.0
1)(0
.01)
(0.0
5)
(0.0
4)
(0.0
5)
(0.0
5)
(0.0
5)
(0.0
4)
(0.0
5)
(0.0
6)
(0.0
6)
Con
tinued
on
nex
tpag
e
56

Table
6-
conti
nued
from
pre
vio
us
page
(1)
(2)
(3)
(4)
(5)
(6)
(7)
(8)
(9)
(10)
(11)
Sam
ple
Ass
ets
wit
hA
aa,
Aa,
Aand
Baa
rati
ng
Dep
enden
tva
riab
leY
ield
(%)
Insu
rance
com
pany’s
new
hold
ing
as
per
centa
ge
of
tota
lvo
lum
eouts
tandin
g
Siz
e0.
269*
**
0.268*
**
0.2
68***
0.2
57***
0.2
57***
0.2
57***
(0.0
2)(0
.02)
(0.0
2)(0
.02)
(0.0
2)(0
.02)
RO
E-0
.308
-0.2
87
-0.2
87
-0.2
69-0
.243
-0.2
43
(0.1
9)
(0.1
9)
(0.1
9)
(0.1
9)
(0.2
0)
(0.2
0)
Cap
ital
rati
o0.5
77***
0.0
84
0.0
84
-1.7
34*
-0.0
04
-0.0
04
(0.1
7)
(0.1
3)
(0.1
3)
(0.8
8)
(0.1
2)
(0.1
2)
CA
LR
BC
rati
o0.
002**
*0.0
03*
**
0.0
01**
-0.0
02
(0.0
0)
(0.0
0)
(0.0
0)(0
.00)
AC
LR
BC
rati
o0.0
01**
*-0
.001
(0.0
0)
(0.0
0)
const
ant
3.15
9***
2.98
6***
0.8
47**
*0.9
43**
*-3
.115**
*-2
.924*
**
-2.9
24***
0.0
68
-1.4
77**
-1.9
42**
*-1
.942***
(0.0
7)(0
.08)
(0.0
4)(0
.05)
(0.3
5)
(0.3
4)
(0.3
4)
(0.5
7)
(0.5
9)
(0.4
0)
(0.4
0)
Rat
ing
--
--
--
-Y
esY
esY
esY
esR
atin
gx
Yea
rF
EY
esN
oY
esN
oY
esY
esY
esN
oN
oN
oN
oT
yp
ein
sure
rF
EY
esY
esY
esY
esY
esY
esY
esY
esY
esY
esY
esIn
sure
rx
Yea
rF
EY
esY
esY
esY
esN
oN
oN
oY
esN
oN
oN
o
Tw
o-w
aycl
ust
erin
gIn
sure
r,Y
ear
Insu
rer,
Yea
rIn
sure
r,Y
ear
Insu
rer,
Yea
rIn
sure
r,Y
ear
Insu
rer,
Yea
rIn
sure
r,Y
ear
Insu
rer,
Yea
rIn
sure
r,Y
ear
Insu
rer,
Yea
rIn
sure
r,Y
ear
N12
7576
312
7576
312
760
43
127
6043
1245
616
124
5616
124
5616
1276
043
124561
6124
5616
1245
616
R2
0.68
490.
6821
0.3131
0.319
70.
2554
0.2
250
0.2
250
0.3
100
0.2491
0.2
165
0.2
165
Adj
−R
20.
6748
0.67
190.
291
0.2
979
0.2554
0.2
249
0.2
249
0.2
878
0.2491
0.2
165
0.2
165
F-s
tat
70.6
87**
*38
.091
***
58.0
55**
*26
.209
***
39.
543*
**
35.3
69***
35.3
69**
*31
.976***
30.2
08**
*27
.247*
**
27.
247**
*D
egre
esof
free
dom
(3,
16)
(9,
16)
(3,
16)
(9,
16)
(8,
16)
(8,
16)
(8,
16)
(5,
16)
(12,
16)
(12,
16)
(12,
16)
Th
ista
ble
rep
ort
sp
an
elre
gre
ssio
nes
tim
ate
sof
(i)
the
lin
ear
regre
ssio
nm
od
elof
equ
ati
on
2an
dit
sex
ten
sion
s(c
olu
mn
s1-2
)an
d(i
i)th
elin
ear
regre
ssio
nm
odel
of
equ
ati
on
3an
dit
sex
ten
sion
s(c
olu
mn
s3-1
1)
an
aly
zin
gin
sure
rs’
pre
fere
nce
for
CL
Os
over
corp
ora
teb
on
ds.
Th
em
od
els
are
esti
mate
don
agra
nu
lar
data
set
at
the
secu
rity
-com
pany-y
ear
level
cover
ing
firs
t-ti
me
inves
tmen
tsby
insu
ran
ceco
mp
an
ies
inC
LO
tran
ches
an
dco
rpora
teb
on
ds
rate
dA
aa,
Aa,
Aor
Baa.
Th
ed
epen
den
tvari
ab
leof
colu
mn
s1-2
isth
eyie
ld(i
.e.,
the
effec
tra
teor
retu
rn)
of
the
secu
rity
rep
ort
edby
the
insu
rer;
the
dep
end
ent
vari
ab
leof
colu
mn
s3-1
1is
the
am
ou
nt
hel
dby
an
insu
ran
ceco
mp
any
ina
giv
ense
curi
tyan
din
ace
rtain
yea
r(w
hen
the
insu
rer
makes
its
firs
tin
ves
tmen
tin
the
secu
rity
)as
ap
erce
nta
ge
of
the
volu
me
ou
tsta
nd
ing
of
the
secu
rity
inth
at
yea
r.A
sfo
rth
ein
dep
end
ent
vari
ab
les,
dummyCLO
isa
du
mm
yvari
ab
leeq
ual
toon
eif
the
secu
rity
isa
CL
Otr
an
che
an
dze
rooth
erw
ise;
Yield
CLO/Yield
Bondratio
isra
tio
of
the
aver
age
yie
ldon
insu
rers
’n
ewin
ves
tmen
tsin
CL
Os
toth
eaver
age
yie
ldof
insu
rers
’n
ewin
ves
tmen
tsin
corp
ora
teb
on
ds
for
each
rati
ng-y
ear
pair
;Tim
e-to-m
aturity
isth
eti
me
tom
atu
rity
of
the
secu
rity
inyea
rsre
port
edby
the
insu
rer;
OutstandingAmount
isth
evolu
me
ou
tsta
nd
ing
of
the
secu
rity
;Size
isth
en
atu
ral
logari
thm
of
tota
lad
mit
ted
ass
ets
of
the
insu
rer;
ROE
isth
era
tio
of
net
inco
me
toto
tal
ad
just
edca
pit
al
of
the
insu
rer;
Capitalratio
isth
era
tio
of
tota
lad
just
edca
pit
al
toto
tal
ad
mit
ted
ass
ets
of
the
insu
rer;
CAL
RBC
ratio
isth
eC
AL
risk
-base
dca
pit
al
rati
oof
the
insu
rer;
ACL
RBC
ratio
isth
eA
CL
risk
-base
dca
pit
al
rati
oof
the
insu
rer.
For
each
ind
epen
den
tvari
ab
leth
efi
rst
row
rep
ort
sth
eco
effici
ent,
the
seco
nd
row
rep
ort
sin
pare
nth
esis
the
rob
ust
stan
dard
erro
rth
at
isco
rrec
ted
for
mu
ltic
lust
erin
gat
the
insu
rer
an
dyea
rle
vel
.F
ixed
effec
tsare
incl
ud
ed,“
Yes
”,
not
incl
ud
ed,
“N
o”,
or
sub
sum
edby
oth
erfi
xed
effec
ts,
“-”
.***,
**,
an
d*
ind
icate
stati
stic
al
sign
ifica
nce
at
the
1%
,5%
an
d10%
level
s,re
spec
tivel
y.
57

Table
7:
Insu
rance
Com
panie
s’P
refe
rence
for
CL
Os
vis
-a-v
isC
orp
ora
teB
onds
(1)
(2)
(3)
(4)
(5)
(6)
(7)
(8)
(9)
Sam
ple
Hol
din
gs
wit
hA
aa,
Aa,
Aan
dB
aa
rati
ng
Dep
end
ent
vari
able
Insu
ran
ceco
mp
any’s
new
hol
din
gof
asse
tcl
ass
esby
rati
ng
as
per
centa
geof
tota
lvo
lum
eou
tsta
nd
ing
du
mm
yC
LO
0.291
**0.2
97**
*0.
313**
*-0
.025
-3.5
93*
-3.1
48-4
.660
*(0
.10)
(0.1
0)(0
.10)
(0.1
6)(1
.85)
(2.0
5)(2
.32)
Yea
r=20
07-2
008
-0.4
41*
**(0
.09)
Yea
r=20
09-2
015
-0.5
34*
**(0
.11)
Yea
r=20
16-2
019
-0.9
43*
**(0
.12)
Yea
r=20
03-2
006
xd
um
my
CL
O-0
.400
***
-0.3
95***
(0.0
8)
(0.0
8)
Yea
r=20
07-2
008
xd
um
my
CL
O0.
082**
0.09
4**
*(0
.03)
(0.0
3)
Yea
r=20
09-2
015
xd
um
my
CL
O0.
309*
**0.3
27*
**(0
.09)
(0.1
0)
Yea
r=20
16-2
019
xd
um
my
CL
O0.
969*
**0.9
94*
**(0
.09)
(0.0
9)
du
mm
yR
eform
xd
um
my
CL
O0.
581*
**(0
.10)
Yie
ldC
LO
/Yie
ldB
ond
rati
o-0
.392
-0.1
810.
000
(0.3
8)(0
.41)
(0.0
0)d
um
my
CL
Ox
Yie
ldC
LO
/Yie
ldB
ond
rati
o6.7
76**
*6.
770
***
7.959
***
(1.6
2)(1
.71)
(1.9
3)T
ime-
to-m
atu
rity
(yea
rs)
0.1
06**
*0.
106*
**0.1
07*
**0.
103*
**0.
103*
**0.
105*
**-0
.013
*-0
.006
-0.0
08
(0.0
1)
(0.0
1)
(0.0
1)(0
.01)
(0.0
1)(0
.01)
(0.0
1)(0
.01)
(0.0
0)O
uts
tan
din
gA
mou
nt
($b
ln)
0.000
***
0.00
0***
0.0
00**
*0.
000*
**0.0
00*
**0.0
00**
*0.
000**
*0.
000
***
0.000
***
(0.0
0)
(0.0
0)
(0.0
0)(0
.00)
(0.0
0)0.
000
***
(0.0
0)(0
.00)
(0.0
0)S
ize
0.1
14*
**0.
205*
**0.2
01**
*0.
182*
**0.
199**
*0.
200**
*0.
168*
*0.
653
***
0.6
31***
(0.0
3)
(0.0
2)
(0.0
2)(0
.03)
(0.0
2)(0
.02)
(0.0
6)(0
.06)
(0.0
6)R
OE
0.0
26
-0.0
24
-0.0
24-0
.023
-0.0
24-0
.024
0.04
-0.1
58*
-0.1
51*
(0.0
3)
(0.0
3)
(0.0
3)(0
.03)
(0.0
3)(0
.03)
(0.0
8)(0
.08)
(0.0
8)C
apit
aliz
atio
n-0
.128
0.12
4*0.
124*
0.074
0.12
4*
0.124
*-0
.542
***
0.65
0***
0.62
0***
(0.0
8)
(0.0
6)
(0.0
6)(0
.06)
(0.0
6)(0
.06)
-0.1
8-0
.14
-0.1
4C
AL
RB
Cra
tio
0.0
01*
**0.
001*
**0.0
01**
*0.
001*
**0.
001**
*0.
001**
*0.0
000.
001
***
0.0
01***
(0.0
0)
(0.0
0)
(0.0
0)(0
.00)
(0.0
0)(0
.00)
(0.0
0)(0
.00)
(0.0
0)co
nst
ant
-1.4
40**
*-2
.648*
**-2
.621*
**-1
.841
***
-2.6
00**
*-2
.611
***
-0.3
11-7
.252
***
-7.2
38***
(0.4
3)
(0.3
2)
(0.3
2)(0
.30)
(0.3
1)(0
.32)
(0.7
2)(1
.04)
(0.7
8)
Rat
ing
xY
ear
FE
No
No
Yes
No
Yes
Yes
No
No
Yes
Rat
ing
FE
Yes
Yes
-Y
es-
-Y
esY
es-
Typ
ein
sure
rF
EY
esY
esY
esY
esY
esY
esY
esY
esY
esIn
sure
rF
EY
esY
esY
esY
esY
esY
esY
esY
esY
esY
ear
FE
No
Yes
-N
o-
-N
oY
es-
Tw
o-w
aycl
ust
erin
gIn
sure
r,Y
ear
Insu
rer,
Yea
rIn
sure
r,Y
ear
Insu
rer,
Yea
rIn
sure
r,Y
ear
Insu
rer,
Yea
rIn
sure
r,Y
ear
Insu
rer,
Yea
rIn
sure
r,Y
ear
N335
276
3352
76335
276
33527
633
527
633
5276
11465
511
4655
1146
55R
20.
361
00.
3623
0.3
661
0.37
080.
3753
0.36
980.
5865
0.59
71
0.60
53
Adj
−R
20.
352
70.
3540
0.3
577
0.36
260.
3671
0.36
150.
5709
0.58
18
0.59
02
F-s
tat
82.9
75*
**90.
583**
*90
.135
***
3395.
678*
**-
82.1
03**
*43.
692*
**57
.241
***
58.
741*
**
Deg
rees
offr
eed
om(7
,16
)(7
,16)
(7,
16)
(13,
16)
(10,
16)
(8,
16)
(9,
16)
(9,
16)
(8,
16)
Th
ista
ble
rep
ort
sp
an
elre
gre
ssio
nes
tim
ate
sof
the
lin
ear
regre
ssio
nm
od
elof
equ
ati
on
4an
dit
sex
ten
sion
san
aly
zin
gin
sure
rs’
pre
fere
nce
for
CL
Os
over
corp
ora
teb
on
ds.
Th
em
od
els
are
esti
mate
don
ad
ata
set
at
the
insu
rer-
ass
etcl
ass
-rati
ng-y
ear
level
cover
ing
firs
t-ti
me
inves
tmen
tsby
insu
ran
ceco
mp
an
ies
inC
LO
tran
ches
an
dco
rpora
teb
on
ds
rate
dA
aa,
Aa,
Aor
Baa.
Th
ed
epen
den
tvari
ab
leis
the
am
ou
nt
of
firs
t-ti
me
inves
tmen
tsof
an
insu
ran
ceco
mp
any
inon
eass
etcl
ass
(CL
Oor
corp
ora
teb
on
d)
wit
ha
giv
enra
tin
gin
ace
rtain
yea
ras
per
centa
ge
of
the
tota
lvolu
me
ou
tsta
nd
ing
of
the
ass
etcl
ass
wit
hth
at
rati
ng
inth
at
yea
r.A
sfo
rth
ein
dep
end
ent
vari
ab
les,
dummyCLO
isa
du
mm
yvari
ab
leeq
ual
toon
eif
the
ass
etcl
ass
con
sist
sin
CL
Otr
an
ches
an
dze
rooth
erw
ise;
Yield
CLO/Yield
Bondratio
isra
tio
of
the
aver
age
yie
ldon
insu
rers
’n
ewin
ves
tmen
tsin
CL
Os
toth
eaver
age
yie
ldof
insu
rers
’n
ewin
ves
tmen
tsin
corp
ora
teb
on
ds
for
each
rati
ng-y
ear
pair
;Tim
e-to-m
aturity
isth
eaver
age
tim
e-to
-matu
rity
of
all
new
inves
tmen
tsof
the
insu
rer
inth
eass
etcl
ass
for
each
rati
ng-y
ear
pair
;OutstandingAmount
isth
eto
tal
volu
me
ou
tsta
nd
ing
of
the
ass
etcl
ass
for
each
rati
ng-y
ear
pair
;Size
isth
en
atu
ral
logari
thm
of
tota
lad
mit
ted
ass
ets
of
the
insu
rer;
ROE
isth
era
tio
of
net
inco
me
toto
tal
ad
just
edca
pit
al
of
the
insu
rer;
Capitalratio
isth
era
tio
of
tota
lad
just
edca
pit
al
toto
tal
ad
mit
ted
ass
ets
of
the
insu
rer;
CAL
RBC
ratio
isth
eC
AL
risk
-base
dca
pit
al
rati
oof
the
insu
rer;
ACL
RBC
ratio
isth
eA
CL
risk
-base
dca
pit
al
rati
oof
the
insu
rer.
For
each
ind
epen
den
tvari
ab
leth
efi
rst
row
rep
ort
sth
eco
effici
ent,
the
seco
nd
row
rep
ort
sin
pare
nth
esis
the
rob
ust
stan
dard
erro
rth
at
isco
rrec
ted
for
mu
ltic
lust
erin
gat
the
insu
rer
an
dyea
rle
vel
.F
ixed
effec
tsare
incl
ud
ed,
“Y
es”,
not
incl
ud
ed,
“N
o”,
or
sub
sum
edby
oth
erfi
xed
effec
ts,
“-”
.***,
**,
an
d*
ind
icate
stati
stic
al
sign
ifica
nce
at
the
1%
,5%
an
d10%
level
s,re
spec
tivel
y.
58

Table 8: Insurance Companies’ Preference for CLOs vis-a-vis Corporate Bonds
(1) (2) (3) (4)Sample Holdings with Aaa, Aa, A and Baa rating
All insurers Insurers investing in CLOs in the whole sample
Dependent variableInsurance company’s new holding of CLOs by rating
as percentage of total new holdings of CLOs and corporate bonds
Yield CLO/Yield Bond ratio 10.613** 10.145** 15.290** 14.371*(3.99) (3.78) (7.00) (6.85)
Outstanding CLO/Outstanding Bond ratio 27.106*** 25.574*** 34.891*** 33.743***(4.70) (4.48) (5.25) (5.19)
Size 0.525* 2.242(0.28) (1.65)
ROE 1.366*** 0.641(0.43) (1.34)
Capital ratio -2.388** -2.191(1.09) (9.12)
CAL RBC ratio 0.011** 0.035(0.00) (0.03)
constant -19.970** -13.368** -50.293 -12.922(7.90) (5.66) (29.13) (9.78)
Rating FE Yes Yes Yes YesType insurer FE Yes Yes Yes YesInsurer x Year FE No Yes No YesInsurer FE Yes - Yes -Year FE Yes - Yes -
N 113610 110660 7980 7936R2 0.3833 0.6107 0.4857 0.6473Adj −R2 0.3598 0.4163 0.4743 0.5099F-stat 9.923 18.183 10.755 22.61Degrees of freedom (6, 16) (2, 16) (6, 16) (2, 16)
This table reports panel regression estimates of the linear regression model of equation 5 and its extensions analyzinginsurers’ preference for CLOs over corporate bonds. The models are estimated on a dataset at the insurer-asset class-rating-year level covering first-time investments by insurance companies in CLO tranches and corporate bonds rated Aaa,Aa, A or Baa. Models 3-4 are estimated on the subsample of insurance companies that invest in CLO tranches both inthe time period 2003-2008 and in the post-crisis decade (2009-2019). The dependent variable is the amount of first-timeinvestments of an insurance company in CLO tranches with a given rating in a certain year as percentage of the totalvolume of new investments in CLOs and corporate bonds with that rating in that year. As for the independent variables,Yield CLO/Yield Bond ratio is ratio of the average yield on insurers’ new investments in CLOs to the average yield ofinsurers’ new investments in corporate bonds for each rating-year pair; Outstanding CLO/Outstanding Bond ratio is theratio of the total outstanding amount of CLO tranches to the total outstanding amount of corporate bonds for eachrating-year pair; Size is the natural logarithm of total admitted assets of the insurer; ROE is the ratio of net incometo total adjusted capital of the insurer; Capital ratio is the ratio of total adjusted capital to total admitted assets ofthe insurer; CAL RBC ratio is the CAL risk-based capital ratio of the insurer; ACL RBC ratio is the ACL risk-basedcapital ratio of the insurer. For each independent variable the first row reports the coefficient, the second row reports inparenthesis the robust standard error that is corrected for multiclustering at the insurer and year level. Fixed effects areincluded, “Yes”, not included, “No”, or subsumed by other fixed effects, “-”. ***, **, and * indicate statistical significanceat the 1%, 5% and 10% levels, respectively.
59

Table
9:
Str
uct
ure
of
CL
Odea
ls
(1)
(2)
(3)
(4)
(5)
(6)
(7)
(8)
(9)
(10)
(11)
(12)
Sam
ple
Aaa
Aa-
A-B
aa
Ba-
B-C
aa-
Ca-
CN
RD
epen
den
tva
riab
leT
ran
ches
as%
of
CL
O
%C
LO
hel
dby
ICs
-0.2
15*
-0.0
190.
294
*0.0
45-0
.023*
*-0
.017
-0.0
520.
011
(0.1
2)(0
.04)
(0.1
4)
(0.0
5)(0
.01)
(0.0
1)(0
.04)
(0.0
6)
Yea
r=20
03-2
009
x%
CL
Oh
eld
by
ICs
-0.0
570.1
32*
-0.0
40*
-0.0
45
(0.1
0)(0
.07)
(0.0
2)(0
.08)
Yea
r=20
10-2
018
x%
CL
Oh
eld
by
ICs
-0.2
35*
0.3
19*
-0.0
23**
-0.0
58(0
.12)
(0.1
5)
(0.0
1)(0
.05)
Yea
r=20
19x
%C
LO
hel
dby
ICs
0.01
-0.0
19
-0.0
01
0.05
2(0
.03)
(0.0
2)
(0.0
1)(0
.04)
du
mm
yR
efor
mx
%C
LO
hel
dby
ICs
-0.2
160.2
74*
-0.0
06
-0.0
69(0
.13)
(0.1
5)(0
.01)
(0.0
7)co
nst
ant
65.
063*
**64.
868
***
64.8
66**
*18
.096*
**
18.
343
***
18.3
47*
**
4.52
1***
4.5
15***
4.5
14***
11.
793**
*11
.730*
**11
.728*
**
(1.6
3)(1
.45)
(1.4
5)(2
.07)
(1.8
6)(1
.86)
(0.1
3)(0
.12)
(0.1
2)(0
.54)
(0.5
0)(0
.50)
Man
ager
FE
Yes
Yes
Yes
Yes
Yes
Yes
Yes
Yes
Yes
Yes
Yes
Yes
Issu
ance
Yea
rF
EY
esY
esY
esY
esY
esY
esY
esY
esY
esY
esY
esY
es
Tw
o-w
aycl
ust
erin
gM
anag
er,
Yea
rM
anag
er,
Yea
rM
anage
r,Y
ear
Man
age
r,Y
ear
Man
ager
,Y
ear
Man
age
r,Y
ear
Man
ager
,Y
ear
Man
age
r,Y
ear
Man
ager
,Y
ear
Man
ager
,Y
ear
Man
age
r,Y
ear
Man
ager
,Y
ear
N216
7216
7216
721
6721
67216
7216
7216
7216
7216
7216
721
67R
20.3
590.
363
0.36
30.
320
0.3
28
0.329
0.38
30.
383
0.38
40.2
510.
252
0.2
52
Adj
−R
20.3
030.
307
0.30
70.
261
0.2
69
0.270
0.32
90.
329
0.32
90.1
860.
186
0.1
86
F-s
tat
3.4
72*
1.982
1.3
19
4.109
*2.
354
3.0
24*
5.206
**
3.4
08*
2.63*
1.495
0.8
441.4
59D
egre
esof
free
dom
(1,
16)
(2,
16)
(3,
16)
(1,
16)
(2,
16)
(3,
16)
(1,
16)
(2,
16)
(3,
16)
(1,
16)
(2,
16)
(3,
16)
Th
ista
ble
rep
ort
sre
gre
ssio
nes
tim
ate
sof
the
lin
ear
regre
ssio
nm
od
elof
equ
ati
on
6an
dit
sex
ten
sion
san
aly
zin
gth
ed
esig
nC
LO
dea
lsin
rela
tion
toth
esh
are
of
the
CL
Od
eal
hel
dby
insu
ran
ceco
mp
an
ies.
Th
em
od
els
are
esti
mate
don
ad
ata
set
at
the
CL
Od
eal-
man
ager
-iss
uan
ceyea
rle
vel
cover
ing
info
rmati
on
on
CL
Od
eals
issu
edover
the
tim
ep
erio
d2003-2
019.
Th
ed
epen
den
tvari
ab
leis
the
per
centa
ge
of
aC
LO
dea
lre
pre
sente
dby
tran
ches
rate
d(i
)tr
iple
-A(c
olu
mn
s1-3
),(i
i)A
a,
Aan
dB
aa
(colu
mn
s4-6
),(i
ii)
Ba,
B,
Caa,
Ca,
C(c
olu
mn
s7-9
),or
(iv)
not
rate
d(c
olu
mn
s10-1
2)
inth
eyea
rof
the
issu
an
ce.
As
for
the
ind
epen
den
tvari
ab
les,
%CLO
heldby
ICs
isth
ep
erce
nta
ge
of
the
CL
Od
eal
hel
dby
insu
ran
ceco
mp
an
ies
inth
eyea
rof
issu
an
ceof
the
CL
Od
eal;dummyReform
isa
du
mm
yeq
ual
toon
eif
the
yea
rfa
lls
into
the
tim
ep
erio
d2010-2
018,
wh
enth
e2010
regu
lato
ryre
form
was
into
effec
t,an
dze
rooth
erw
ise.
For
each
ind
epen
den
tvari
ab
leth
efi
rst
row
rep
ort
sth
eco
effici
ent,
the
seco
nd
row
rep
ort
sin
pare
nth
esis
the
rob
ust
stan
dard
erro
rth
at
isco
rrec
ted
for
mu
ltic
lust
erin
gat
the
CL
Om
an
ager
an
dyea
rle
vel
.F
ixed
effec
tsare
incl
ud
ed,
“Y
es”,
not
incl
ud
ed,
“N
o”,
or
sub
sum
edby
oth
erfi
xed
effec
ts,
“-”
.***,
**,
an
d*
ind
icate
stati
stic
al
sign
ifica
nce
at
the
1%
,5%
an
d10%
level
s,re
spec
tivel
y.
60

Table 10: Likelihood of CLO Refinancing
(1) (2) (3)Model Linear Probit LinearDependent variable dummy dummy dummy
Refinancing Refinancing Refinancing
% of CLO held by ICst−1 0.003** 0.002*** 0.000(0.00) (0.00) (0.00)
dummy Reform x % of CLO held by ICst−1 0.004***(0.00)
constant 0.047*** -2.153*** 0.048***(0.01) (0.23) (0.01)
Manager FE Yes Yes YesIssuance Year FE Yes Yes Yes
Two-way clustering Manager, Year Year Manager, Year
N 11499 8047 11499R2 (Pseudo R2 for probit) 0.164 0.207 0.168Adj −R2 0.148 0.152
This table reports panel regression estimates of the regression model of equation 7 and its extensions analyzing thelikelihood of refinancing of CLO deals in relation to the share of the CLO deal held by insurance companies. The modelsare estimated on a dataset at the CLO deal-manager-year level covering information on CLO deals outstanding during thetime period 2003-2019. The dependent variable is a dummy equal to one if a CLO deal is refinanced in a given year and zerootherwise. As for the independent variables, % CLO held by ICst−1 is the percentage of the CLO deal held by insurancecompanies lagged of one year; dummy Reform is a dummy equal to one if the year falls into the time period 2010-2018,when the 2010 regulatory reform was into effect, and zero otherwise. Model 1 and models 3-6 report the estimates of alinear regression. Model 2 reports the estimates of a probit model. The coefficient of % CLO held by ICst−1 in model 2represents the marginal effect of insurers’ lagged holding share keeping all other regressors constant at the sample means.For each independent variable the first row reports the coefficient, the second row reports in parenthesis the standarderror. Standard errors of model 1 and models 3-6 are corrected for multiclustering at the CLO manager and year level.Standard errors of model 2 are clustered by year. Fixed effects are included, “Yes”, not included, “No”, or subsumed byother fixed effects, “-”. ***, **, and * indicate statistical significance at the 1%, 5% and 10% levels, respectively.
61

References
Acharya, V. and Steffen, S. (2015). The “greatest” carry trade ever? Understanding eurozone bankrisks. Journal of Financial Economics, 115(2):215–236.
Altunbas, Y., Gambacorta, L., and Marques-Ibanez, D. (2014). Does monetary policy affect bank risk?International Journal of Monetary Policy.
Becker, B. and Ivashina, V. (2015). Reaching for yield in the bond market. Journal of Finance,70(5):1863–1901.
Becker, B., Opp, M., and Saidi, F. (2021). Regulatory forbearance in the U.S. insurance industry: Theeffects of eliminating capital requirements. Review of Financial Studies, forthcoming.
Benmelech, E., Dlugosz, J., and Ivashina, V. (2012). Did securitization affect the cost of corporatedebt? Journal of Financial Economics, 106:91–113.
BoE (2019). Financial stability report. Issue No. 46, December 2019.
Bord, V. and Santos, J. (2012). The rise of the originate-to-distribute model and the role of banks infinancial intermediation. Federal Reserve Bank of New York Economic Policy Review, pages 21–34.
Bord, V. and Santos, J. (2015). Does securitization of corporate loans lead to riskier lending? Journalof Money, Credit and Banking, 47 (2-3):415–444.
Boyer, P. and Kempf, H. (2020). Regulatory arbitrage and the efficiency of banking regulation. Journalof Financial Intermediation, 41:1–17.
Boyson, N., Fahlenbrach, R., and Stulz, R. (2016). Why don’t all banks practice regulatory arbitrage?Evidence from usage of trust-preferred securities. Review of Financial Studies, 29(7):1821–1859.
Buchak, G., Matvos, G., Piskorski, T., and Seru, A. (2020). Fintech, regulatory arbitrage, and the riseof shadow banks. Journal of Financial Economics, 130:453–483.
Cameron, A. C., Gelbach, J. B., and Miller, D. L. (2011). Robust inference with multiway clustering.Review of Business and Economic Statistics, 29.
Cameron, A. C. and Miller, D. L. (2015). A practitioner’s guide to cluster-robust inference. Journal ofHuman Resources, 50.
Dell’Ariccia, G., Laeven, L., and Suarez, G. (2017). Bank leverage and monetary policy’s risk-takingchannel: Evidence from the united states. Journal of Finance, 72(2):613–654.
DeMarco, L., Liu, E., and Schmidt-Eisenlohr, T. (2020). Who owns U.S. CLO securities? An updateby tranche. FEDS Notes. Washington: Board of Governors of the Federal Reserve System, June 25,2020. Available at https://doi.org/10.17016/2380-7172.2592.
Demyanyk, Y. and Loutskina, E. (2016). Mortgage companies and regulatory arbitrage. Journal ofFinancial Economics, 122(2):328–351.
Ellington (2018). Understanding CLOs: Exploring the impacts of various dynamics on mar-ket spreads. Available at https://ellingtonincomefund.com/wp-content/uploads/2019/10/EIOF-Alternative-Credit-Insights-October-2018.pdf.
Foley-Fisher, N., Heinrich, N., and Verani, S. (2020). Capturing the illiquidity premium. WorkingPaper, SSRN.
FSB (2019). Vulnerabilities associated with leveraged loans and collateralised loan obligations. Decem-ber 2019.
Griffin, J. M. and Nickerson, J. (2021). Are CLO collateral and tranche ratings disconnected? WorkingPaper, SSRN.
IMF (2020). Global financial stability report: Markets in the time of covid-19. April 2020.
Ioannidou, V., Ongena, S., and Peydro, J. (2015). Monetary policy, risk-taking and pricing: Evidencefrom a quasi-natural experiment. Review of Finance, 19:95–144.
62

Ivashina, V. and Scharfstein, D. (2010). Loan syndication and credit cycles. American Economic ReviewPapers and Proceedings, 100(2):57–61.
Ivashina, V. and Vallee, B. (2020). Weak credit covenants. Working Paper, SSRN.
Jensen, M. C. and Meckling, W. H. (1976). Theory of the firm: Managerial behavior, agency costs andownership structure. Journal of Financial Economics, 3(4):305–360.
Jimenez, G., Saurina, J., Ongena, S., and Peydro, J. (2014). Hazardous times for monetary policy: Whatdo twenty-three million bank loans say about the effects of monetary policy on credit risk-taking?Econometrica, 82:463–505.
Karolyi, A. and Taboada, A. (2015). Regulatory arbitrage and cross-border bank acquisitions. Journalof Finance, 70(6):2395–2450.
Koijen, R. S. J. and Yogo, M. (2015). The cost of financial frictions for life insurers. American EconomicReview, 105.
Kroszner, R. and Strahan, P. (2011). Financial regulatory reform: Challenges ahead. American Eco-nomic Review: Papers & Proceedings, 101(3):242–246.
Lancaster, T. (2000). The incidental parameters problem since 1948. Journal of Econometrics, 95.
Liu, E. and Schmidt-Eisenlohr, T. (2019). Who owns U.S. CLO securities? FEDS Notes. Washington:Board of Governors of the Federal Reserve System, July 19, 2019. Available at https://doi.org/10.17016/2380-7172.2423.
Liu, W. S. (2019). Regulatory capital, business growth, and investment risk: Evidence from life insur-ance companies. Working Paper, SSRN.
Nadauld, T. and Weisbach, M. (2012). Did securitization affect the cost of corporate debt? Journal ofFinancial Economics, 105:332–352.
NAIC (2017). Purposes and procedures manuel of the NAIC investment analysis office. December 31,2017.
NAIC (2018a). Investment RBC charges. Available at https://www.naic.org/documents/committees_e_capad_investment_rbc_wg_related_irbc_factors.pdf.
NAIC (2018b). U.S. insurance industry’s exposure to collateralized loan obligations as of year-end 2018.
NAIC (2019). Purposes and procedures manuel of the NAIC investment analysis office. December 31,2019.
NAIC (2020). Risk-based capital. Available at https://content.naic.org/cipr_topics/topic_riskbased_capital.htm.
NAIC (2021). Structured securities project. Available at https://content.naic.org/cipr_topics/topic_structured_securities_project.htm.
Neyman, J. and Scott, E. L. (1948). Consistent estimates based on partially consistent observations.Econometrica, 16.
Paligorova, T. and Santos, J. (2017). Monetary policy and bank risk-taking: Evidence from the corpo-rate loan market. Journal of Financial Intermediation, 30:35–49.
Paligorova, T. and Santos, J. (2019). The side effects of shadow banking on liquidity provision. WorkingPaper, SSRN.
Petersen, M. A. (2009). Estimating standard errors in finance panel data sets: Comparing approaches.Review of Financial Studies, 22.
Peydro, J. and Maddaloni, A. (2011). Bank risk-taking, securitization, supervision, and low interestrates: Evidence from the euro area and U.S. lending standards. Review of Financial Studies, 24:2121–2165.
Repullo, R. (2000). Who should act as lender of last resort? An incomplete contracts model. Journalof Money, Credit, and Banking, 32.
63

Rochet, J.-C. (1992). Capital requirements and the behavior of commercial banks. European EconomicReview, 36.
SEC (2020). U.S. credit markets: Interconnectedeness and the effects of the covid-19 economic shock.October 2020.
Shivdasani, A. and Wang, Y. (2011). Did structured credit fuel the LBO boom? Journal of Finance,66:1291–1328.
Wang, Y. and Xia, H. (2010). Bank monitoring and corporate loan securitization. Working Paper,University of Texas at Dallas.
64