
Insurance Bureau of Canada
83
Transcript of Insurance Bureau of Canada
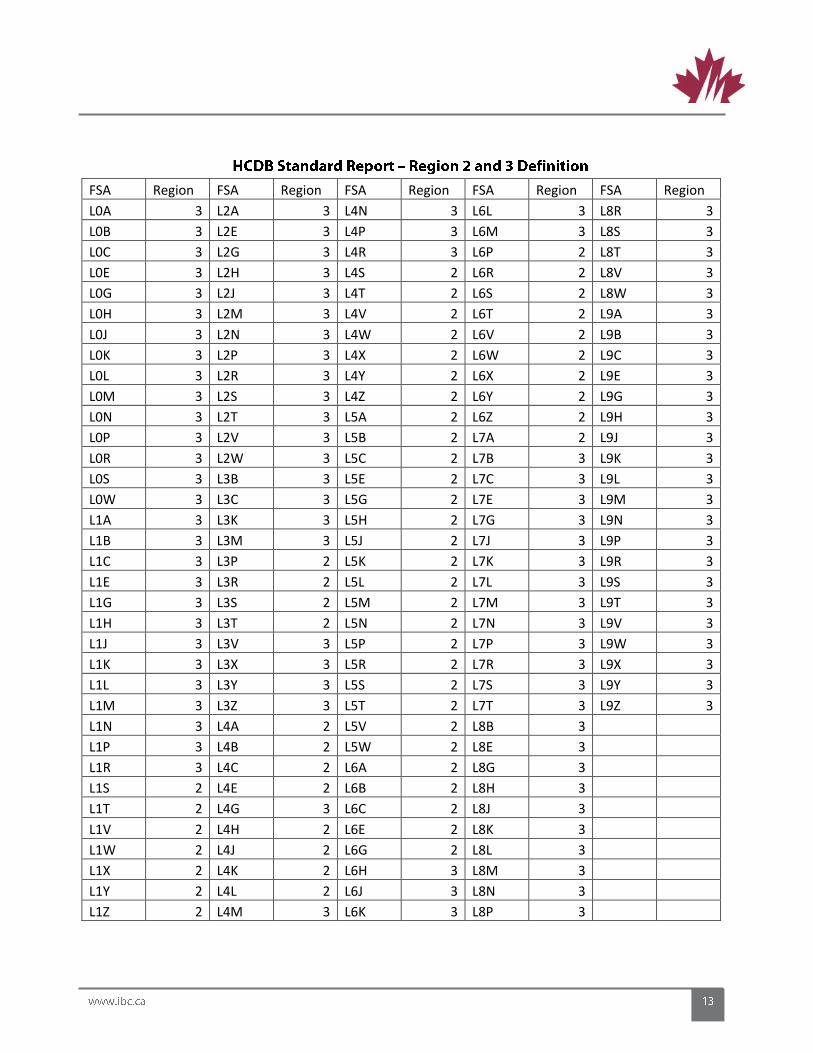
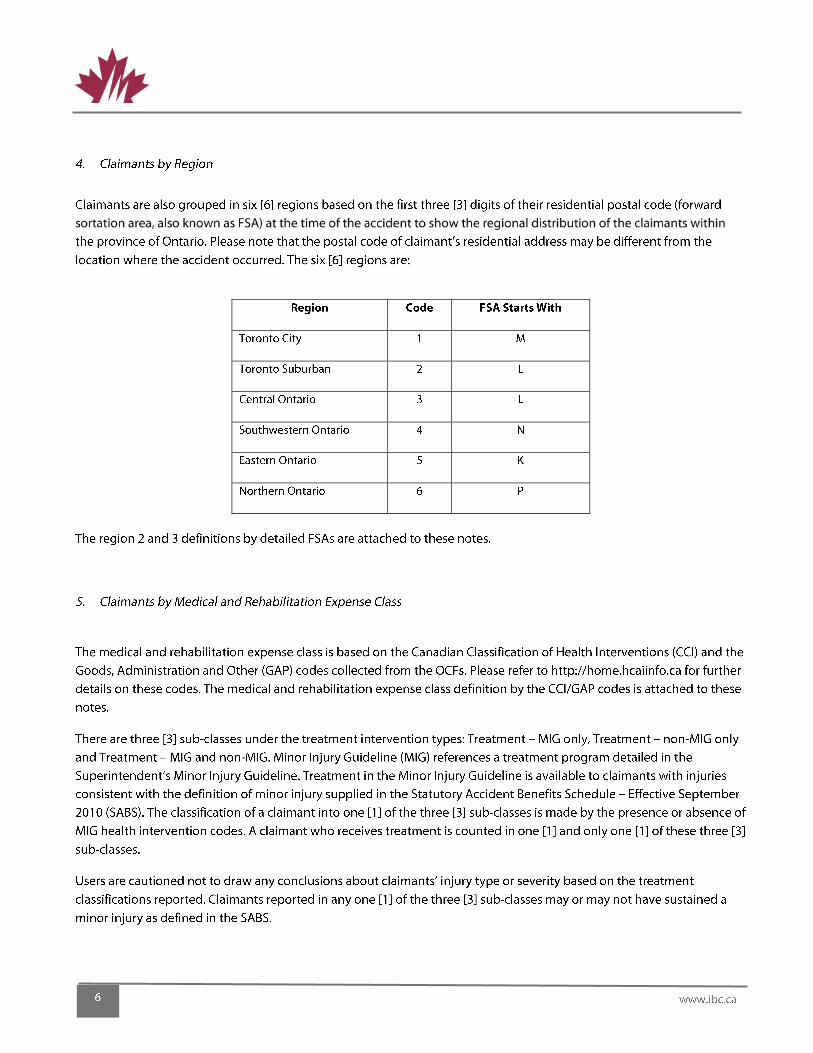
FSA Region FSA Region FSA Region FSA Region FSA Region
L0A 3 L2A 3 L4N 3 L6L 3 L8R 3
L0B 3 L2E 3 L4P 3 L6M 3 L8S 3
L0C 3 L2G 3 L4R 3 L6P 2 L8T 3
L0E 3 L2H 3 L4S 2 L6R 2 L8V 3
L0G 3 L2J 3 L4T 2 L6S 2 L8W 3
L0H 3 L2M 3 L4V 2 L6T 2 L9A 3
L0J 3 L2N 3 L4W 2 L6V 2 L9B 3
L0K 3 L2P 3 L4X 2 L6W 2 L9C 3
L0L 3 L2R 3 L4Y 2 L6X 2 L9E 3
L0M 3 L2S 3 L4Z 2 L6Y 2 L9G 3
L0N 3 L2T 3 L5A 2 L6Z 2 L9H 3
L0P 3 L2V 3 L5B 2 L7A 2 L9J 3
L0R 3 L2W 3 L5C 2 L7B 3 L9K 3
L0S 3 L3B 3 L5E 2 L7C 3 L9L 3
L0W 3 L3C 3 L5G 2 L7E 3 L9M 3
L1A 3 L3K 3 L5H 2 L7G 3 L9N 3
L1B 3 L3M 3 L5J 2 L7J 3 L9P 3
L1C 3 L3P 2 L5K 2 L7K 3 L9R 3
L1E 3 L3R 2 L5L 2 L7L 3 L9S 3
L1G 3 L3S 2 L5M 2 L7M 3 L9T 3
L1H 3 L3T 2 L5N 2 L7N 3 L9V 3
L1J 3 L3V 3 L5P 2 L7P 3 L9W 3
L1K 3 L3X 3 L5R 2 L7R 3 L9X 3
L1L 3 L3Y 3 L5S 2 L7S 3 L9Y 3
L1M 3 L3Z 3 L5T 2 L7T 3 L9Z 3
L1N 3 L4A 2 L5V 2 L8B 3
L1P 3 L4B 2 L5W 2 L8E 3
L1R 3 L4C 2 L6A 2 L8G 3
L1S 2 L4E 2 L6B 2 L8H 3
L1T 2 L4G 3 L6C 2 L8J 3
L1V 2 L4H 2 L6E 2 L8K 3
L1W 2 L4J 2 L6G 2 L8L 3
L1X 2 L4K 2 L6H 3 L8M 3
L1Y 2 L4L 2 L6J 3 L8N 3
L1Z 2 L4M 3 L6K 3 L8P 3
1. 2. 3. 4. 5. 6. 7. 8.
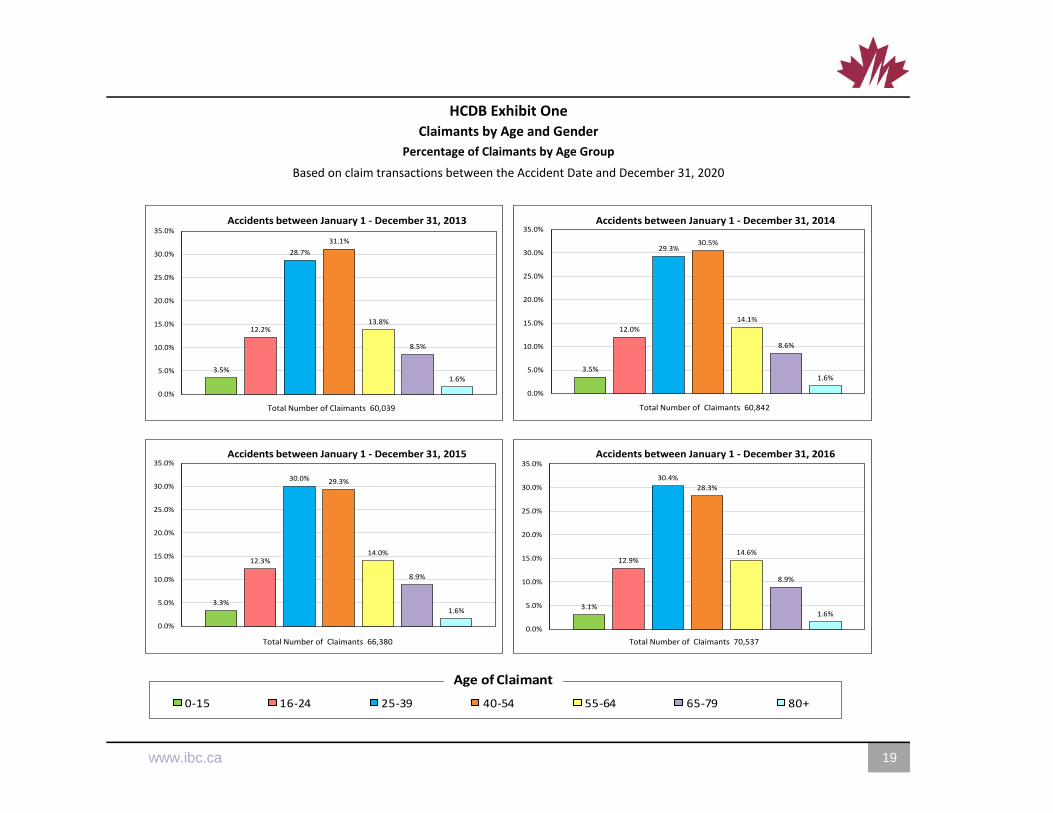
HCDB Exhibit One
Claimants by Age and Gender
Percentage of Claimants by Age Group
Based on claim transactions between the Accident Date and December 31, 2020
2 www.ibc.ca www.ibc.ca 19
3.5%
12.2%
28.7%
31.1%
13.8%
8.5%
1.6%
0.0%
5.0%
10.0%
15.0%
20.0%
25.0%
30.0%
35.0%Accidents between January 1 - December 31, 2013
Total Number of Claimants 60,039
3.5%
12.0%
29.3%30.5%
14.1%
8.6%
1.6%
0.0%
5.0%
10.0%
15.0%
20.0%
25.0%
30.0%
35.0%Accidents between January 1 - December 31, 2014
Total Number of Claimants 60,842
3.3%
12.3%
30.0% 29.3%
14.0%
8.9%
1.6%
0.0%
5.0%
10.0%
15.0%
20.0%
25.0%
30.0%
35.0%Accidents between January 1 - December 31, 2015
Total Number of Claimants 66,380
3.1%
12.9%
30.4%
28.3%
14.6%
8.9%
1.6%
0.0%
5.0%
10.0%
15.0%
20.0%
25.0%
30.0%
35.0%Accidents between January 1 - December 31, 2016
Total Number of Claimants 70,537
2.7%
12.0%
32.6%
28.2%
13.8%
8.7%
1.8%
0.0%
5.0%
10.0%
15.0%
20.0%
25.0%
30.0%
35.0%
Accidents between January 1 - June 30, 2017
0-15 16-24 25-39 40-54 55-64 65-79 80+
Total Number of Claimants 14,292
Age of Claimant
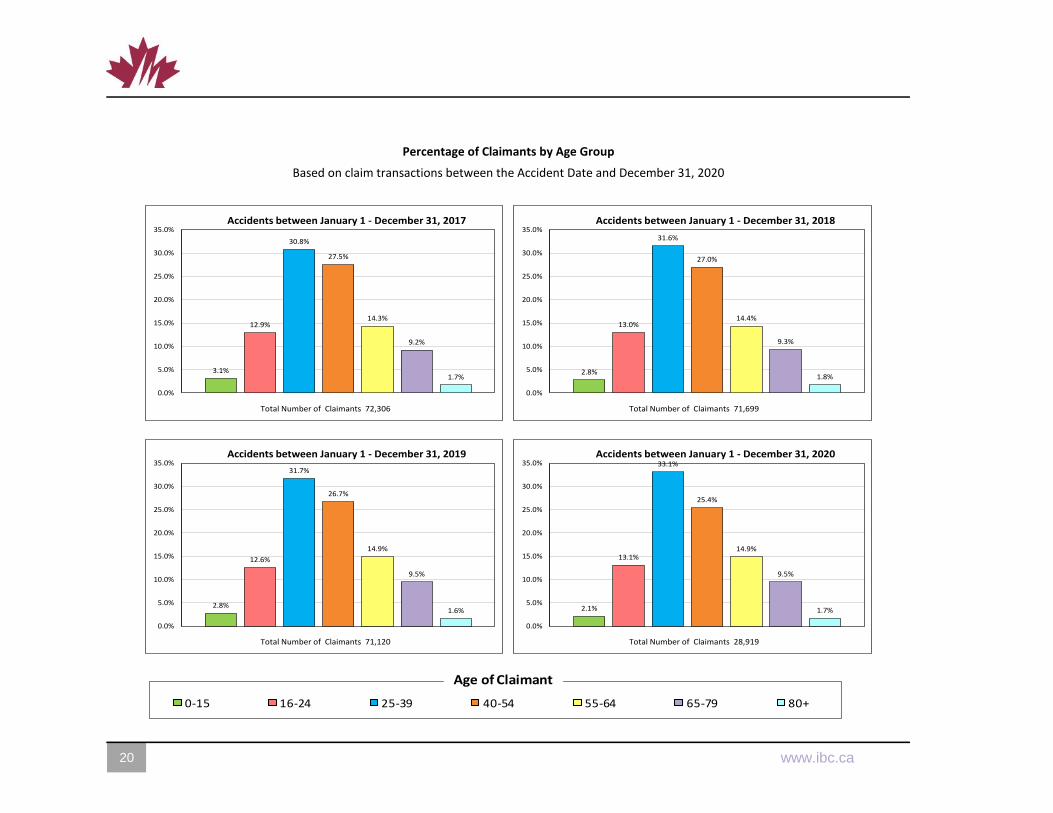
Percentage of Claimants by Age Group
Based on claim transactions between the Accident Date and December 31, 2020
20 20 www.ibc.ca 3
3.1%
12.9%
30.8%
27.5%
14.3%
9.2%
1.7%
0.0%
5.0%
10.0%
15.0%
20.0%
25.0%
30.0%
35.0%Accidents between January 1 - December 31, 2017
Total Number of Claimants 72,306
2.8%
13.0%
31.6%
27.0%
14.4%
9.3%
1.8%
0.0%
5.0%
10.0%
15.0%
20.0%
25.0%
30.0%
35.0%Accidents between January 1 - December 31, 2018
Total Number of Claimants 71,699
2.8%
12.6%
31.7%
26.7%
14.9%
9.5%
1.6%
0.0%
5.0%
10.0%
15.0%
20.0%
25.0%
30.0%
35.0%Accidents between January 1 - December 31, 2019
Total Number of Claimants 71,120
2.1%
13.1%
33.1%
25.4%
14.9%
9.5%
1.7%
0.0%
5.0%
10.0%
15.0%
20.0%
25.0%
30.0%
35.0%Accidents between January 1 - December 31, 2020
Total Number of Claimants 28,919
2.7%
12.0%
32.6%
28.2%
13.8%
8.7%
1.8%
0.0%
5.0%
10.0%
15.0%
20.0%
25.0%
30.0%
35.0%
Accidents between January 1 - June 30, 2017
0-15 16-24 25-39 40-54 55-64 65-79 80+
Total Number of Claimants 14,292
Age of Claimant
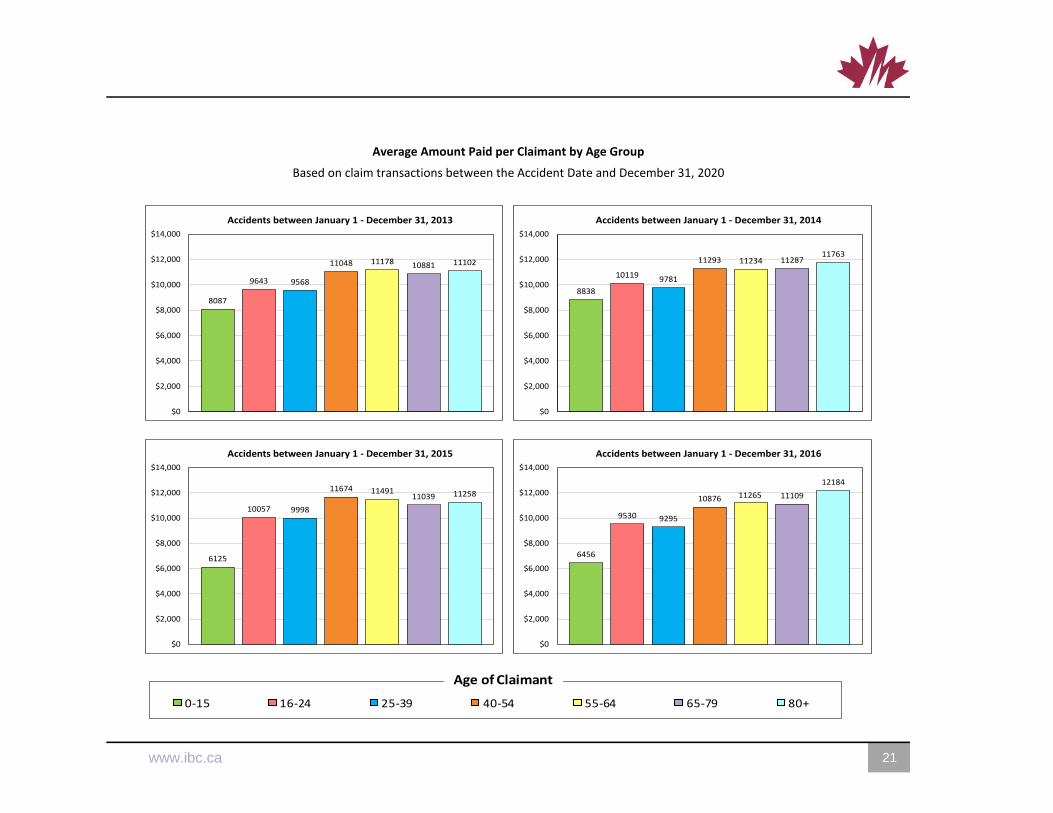
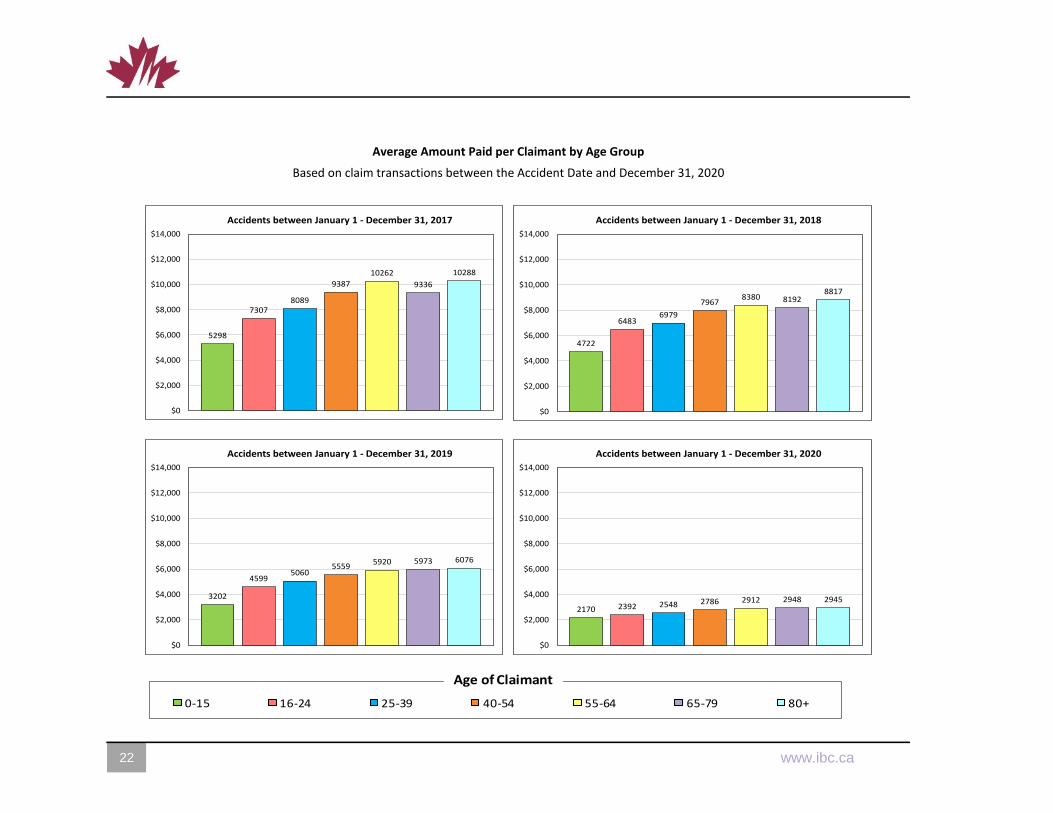
Average Amount Paid per Claimant by Age Group
Based on claim transactions between the Accident Date and December 31, 2020
2 www.ibc.ca www.ibc.ca 21
8087
9643 9568
11048 11178 10881 11102
$0
$2,000
$4,000
$6,000
$8,000
$10,000
$12,000
$14,000
Accidents between January 1 - December 31, 2013
8838
101199781
11293 11234 1128711763
$0
$2,000
$4,000
$6,000
$8,000
$10,000
$12,000
$14,000
Accidents between January 1 - December 31, 2014
6125
10057 9998
11674 1149111039 11258
$0
$2,000
$4,000
$6,000
$8,000
$10,000
$12,000
$14,000
Accidents between January 1 - December 31, 2015
6456
9530 9295
10876 11265 11109
12184
$0
$2,000
$4,000
$6,000
$8,000
$10,000
$12,000
$14,000
Accidents between January 1 - December 31, 2016
2.7%
12.0%
32.6%
28.2%
13.8%
8.7%
1.8%
0.0%
5.0%
10.0%
15.0%
20.0%
25.0%
30.0%
35.0%
Accidents between January 1 - June 30, 2017
0-15 16-24 25-39 40-54 55-64 65-79 80+
Total Number of Claimants 14,292
Age of Claimant
Average Amount Paid per Claimant by Age Group
Based on claim transactions between the Accident Date and December 31, 2020
22 22 www.ibc.ca 3
5298
73078089
9387
10262
9336
10288
$0
$2,000
$4,000
$6,000
$8,000
$10,000
$12,000
$14,000
Accidents between January 1 - December 31, 2017
4722
64836979
79678380 8192
8817
$0
$2,000
$4,000
$6,000
$8,000
$10,000
$12,000
$14,000
Accidents between January 1 - December 31, 2018
3202
45995060
55595920 5973 6076
$0
$2,000
$4,000
$6,000
$8,000
$10,000
$12,000
$14,000
Accidents between January 1 - December 31, 2019
2170 2392 2548 2786 2912 2948 2945
$0
$2,000
$4,000
$6,000
$8,000
$10,000
$12,000
$14,000
Accidents between January 1 - December 31, 2020
2.7%
12.0%
32.6%
28.2%
13.8%
8.7%
1.8%
0.0%
5.0%
10.0%
15.0%
20.0%
25.0%
30.0%
35.0%
Accidents between January 1 - June 30, 2017
0-15 16-24 25-39 40-54 55-64 65-79 80+
Total Number of Claimants 14,292
Age of Claimant
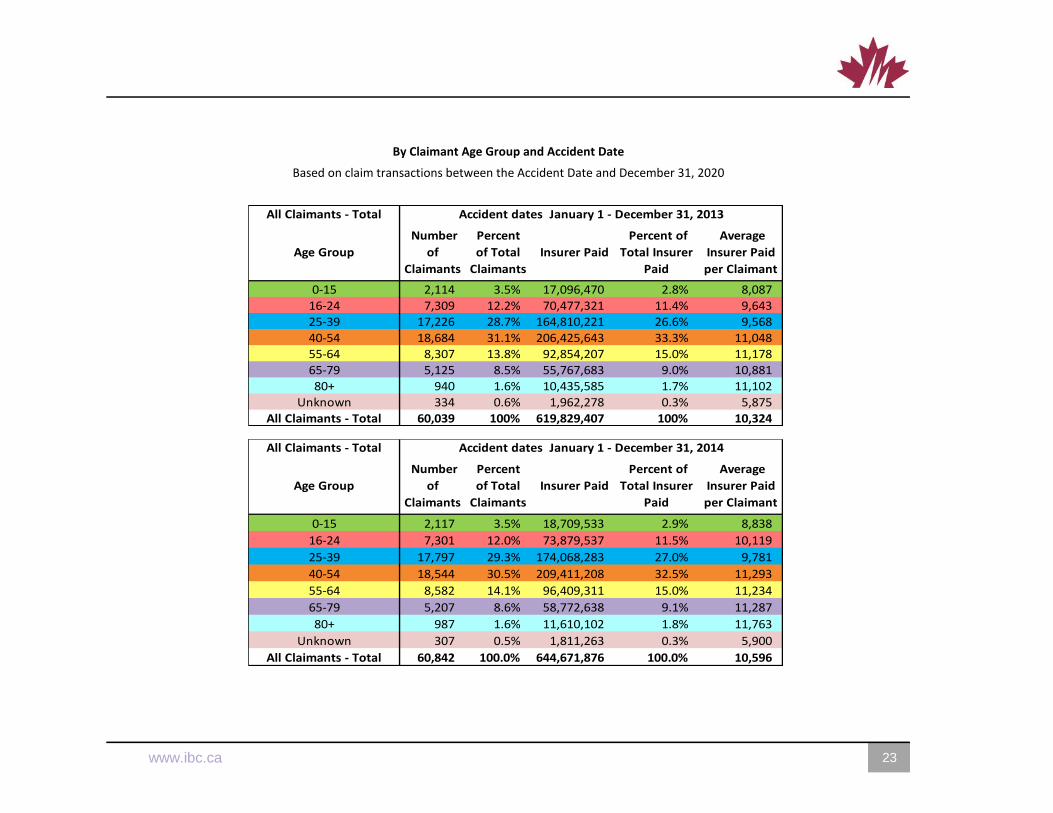
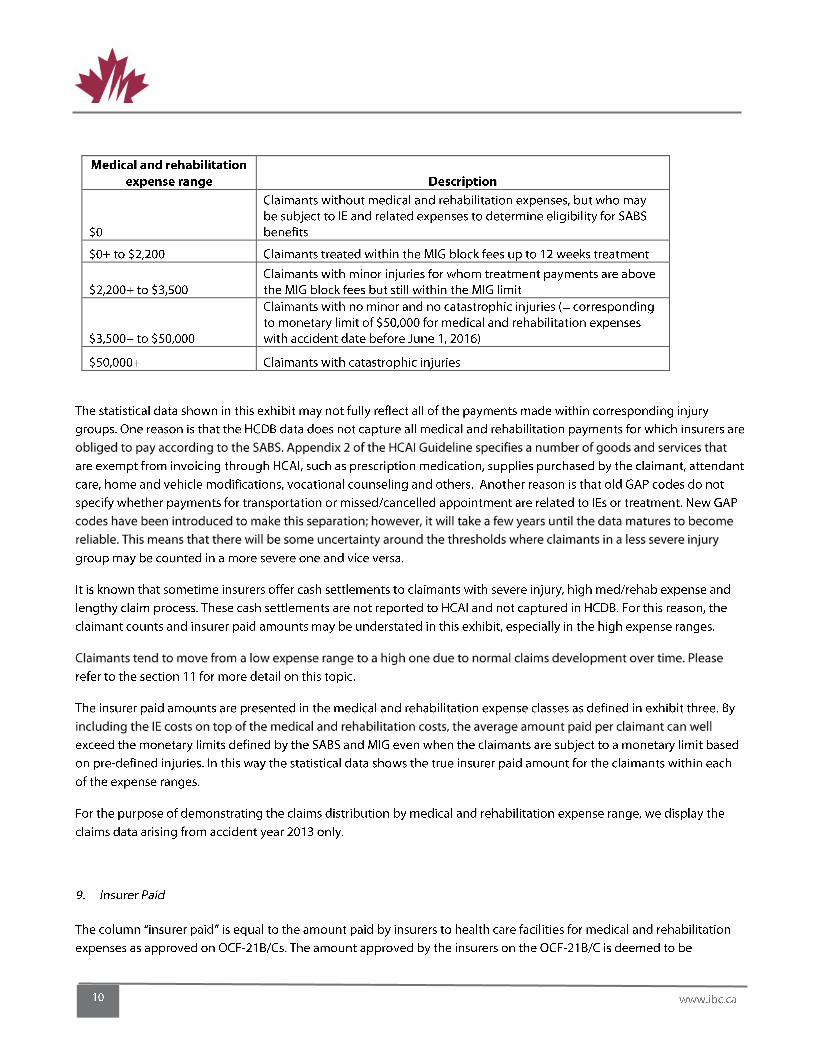
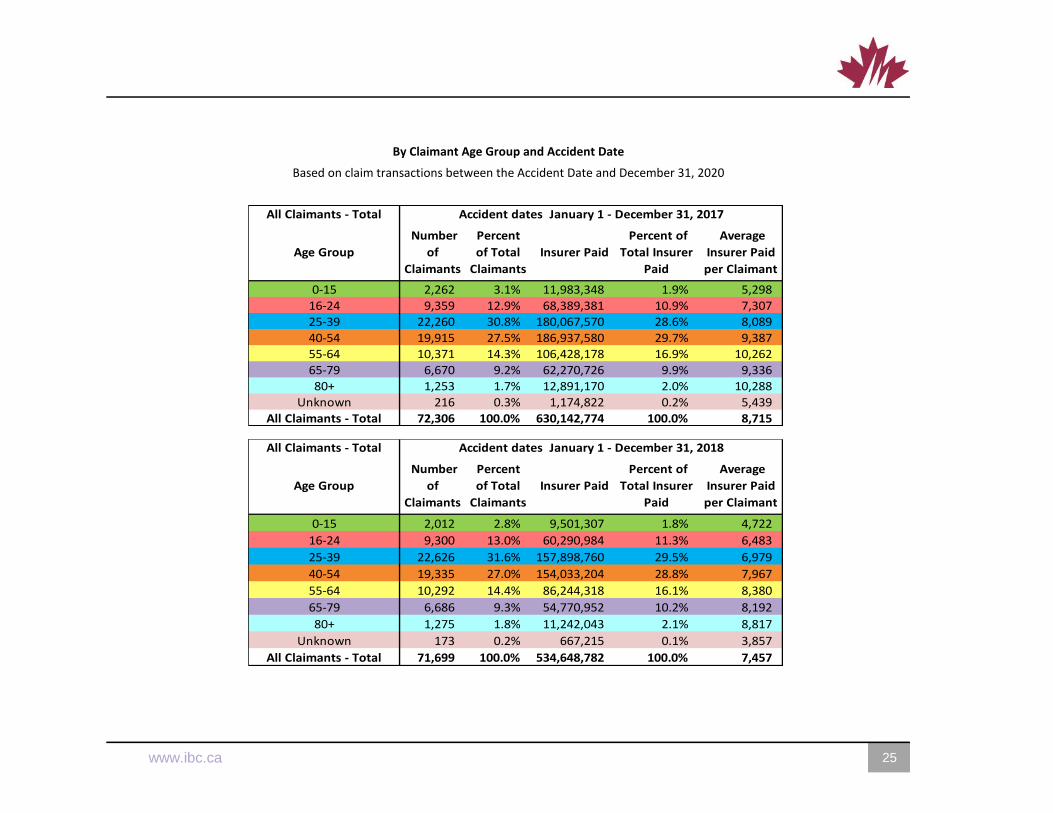
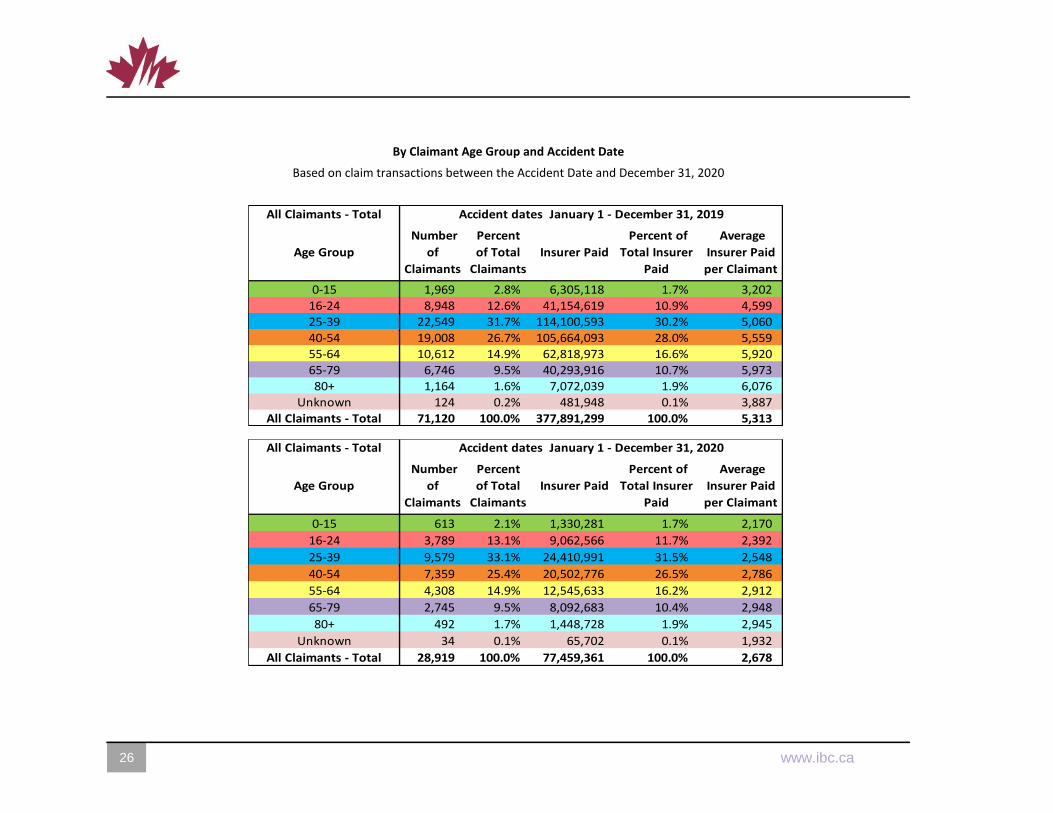
By Claimant Age Group and Accident Date
Based on claim transactions between the Accident Date and December 31, 2020
2 www.ibc.ca www.ibc.ca 23
Number
of
Claimants
Percent
of Total
Claimants
Insurer Paid
Percent of
Total Insurer
Paid
Average
Insurer Paid
per Claimant
2,114 3.5% 17,096,470 2.8% 8,087
7,309 12.2% 70,477,321 11.4% 9,64317,226 28.7% 164,810,221 26.6% 9,568
18,684 31.1% 206,425,643 33.3% 11,048
8,307 13.8% 92,854,207 15.0% 11,178
5,125 8.5% 55,767,683 9.0% 10,881940 1.6% 10,435,585 1.7% 11,102
334 0.6% 1,962,278 0.3% 5,875
60,039 100% 619,829,407 100% 10,324
All Claimants - Total Accident dates January 1 - December 31, 2013
Age Group
25-3916-24
40-54
65-79
55-64
0-15
80+
Unknown
All Claimants - Total
Number
of
Claimants
Percent
of Total
Claimants
Insurer Paid
Percent of
Total Insurer
Paid
Average
Insurer Paid
per Claimant
2,117 3.5% 18,709,533 2.9% 8,838
7,301 12.0% 73,879,537 11.5% 10,119
17,797 29.3% 174,068,283 27.0% 9,781
18,544 30.5% 209,411,208 32.5% 11,293
8,582 14.1% 96,409,311 15.0% 11,234
5,207 8.6% 58,772,638 9.1% 11,287
987 1.6% 11,610,102 1.8% 11,763
307 0.5% 1,811,263 0.3% 5,900
60,842 100.0% 644,671,876 100.0% 10,596
All Claimants - Total Accident dates January 1 - December 31, 2014
25-39
16-24
0-15
Age Group
40-54
55-64
Unknown
80+
65-79
All Claimants - Total
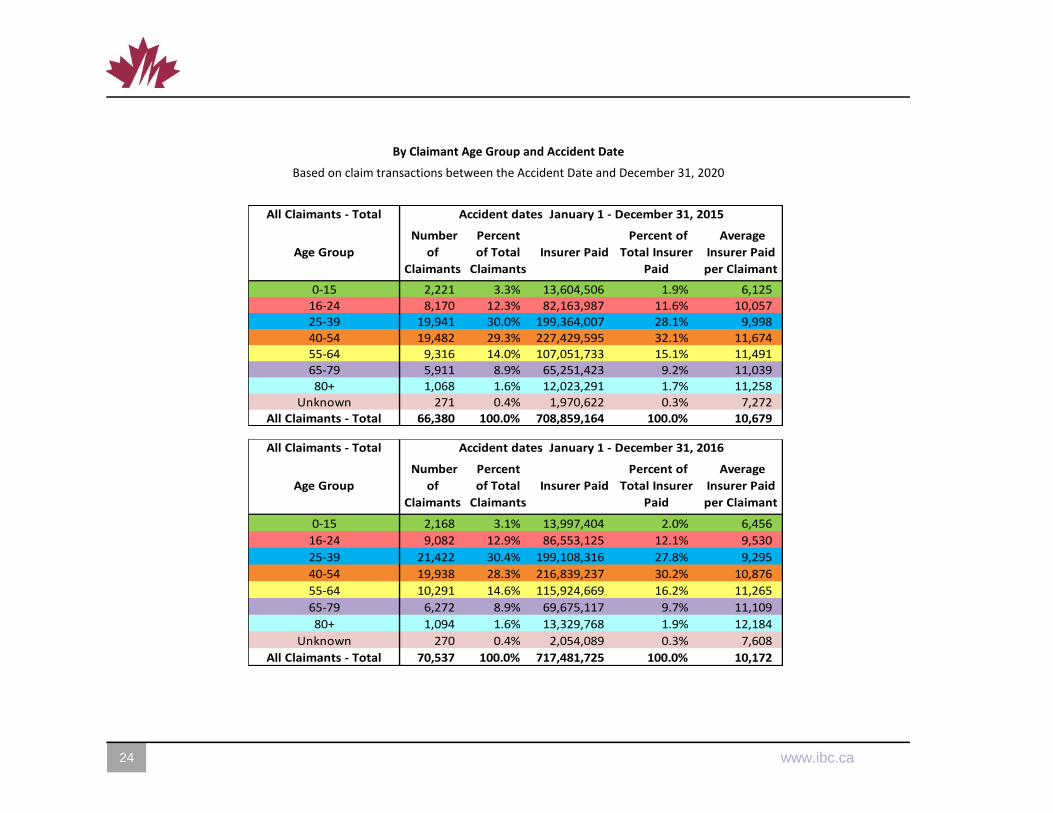
By Claimant Age Group and Accident Date
Based on claim transactions between the Accident Date and December 31, 2020
24 24 www.ibc.ca 3
Number
of
Claimants
Percent
of Total
Claimants
Insurer Paid
Percent of
Total Insurer
Paid
Average
Insurer Paid
per Claimant
2,221 3.3% 13,604,506 1.9% 6,125
8,170 12.3% 82,163,987 11.6% 10,05719,941 30.0% 199,364,007 28.1% 9,998
19,482 29.3% 227,429,595 32.1% 11,674
9,316 14.0% 107,051,733 15.1% 11,491
5,911 8.9% 65,251,423 9.2% 11,0391,068 1.6% 12,023,291 1.7% 11,258
271 0.4% 1,970,622 0.3% 7,272
66,380 100.0% 708,859,164 100.0% 10,679
Age Group
All Claimants - Total Accident dates January 1 - December 31, 2015
25-3916-24
65-79
0-15
40-54
55-64
80+
Unknown
All Claimants - Total
Number
of
Claimants
Percent
of Total
Claimants
Insurer Paid
Percent of
Total Insurer
Paid
Average
Insurer Paid
per Claimant
2,168 3.1% 13,997,404 2.0% 6,456
9,082 12.9% 86,553,125 12.1% 9,530
21,422 30.4% 199,108,316 27.8% 9,295
19,938 28.3% 216,839,237 30.2% 10,876
10,291 14.6% 115,924,669 16.2% 11,265
6,272 8.9% 69,675,117 9.7% 11,109
1,094 1.6% 13,329,768 1.9% 12,184
270 0.4% 2,054,089 0.3% 7,608
70,537 100.0% 717,481,725 100.0% 10,172
All Claimants - Total Accident dates January 1 - December 31, 2016
25-39
Age Group
16-24
0-15
40-54
55-64
Unknown
80+
65-79
All Claimants - Total
By Claimant Age Group and Accident Date
Based on claim transactions between the Accident Date and December 31, 2020
2 www.ibc.ca www.ibc.ca 25
Number
of
Claimants
Percent
of Total
Claimants
Insurer Paid
Percent of
Total Insurer
Paid
Average
Insurer Paid
per Claimant
2,262 3.1% 11,983,348 1.9% 5,298
9,359 12.9% 68,389,381 10.9% 7,30722,260 30.8% 180,067,570 28.6% 8,089
19,915 27.5% 186,937,580 29.7% 9,387
10,371 14.3% 106,428,178 16.9% 10,262
6,670 9.2% 62,270,726 9.9% 9,3361,253 1.7% 12,891,170 2.0% 10,288
216 0.3% 1,174,822 0.2% 5,439
72,306 100.0% 630,142,774 100.0% 8,715
All Claimants - Total Accident dates January 1 - December 31, 2017
Age Group
0-15
25-39
65-7980+
16-24
40-54
55-64
Unknown
All Claimants - Total
Number
of
Claimants
Percent
of Total
Claimants
Insurer Paid
Percent of
Total Insurer
Paid
Average
Insurer Paid
per Claimant
2,012 2.8% 9,501,307 1.8% 4,722
9,300 13.0% 60,290,984 11.3% 6,483
22,626 31.6% 157,898,760 29.5% 6,979
19,335 27.0% 154,033,204 28.8% 7,967
10,292 14.4% 86,244,318 16.1% 8,380
6,686 9.3% 54,770,952 10.2% 8,192
1,275 1.8% 11,242,043 2.1% 8,817
173 0.2% 667,215 0.1% 3,857
71,699 100.0% 534,648,782 100.0% 7,457
All Claimants - Total Accident dates January 1 - December 31, 2018
Age Group
0-15
25-39
16-24
Unknown
40-54
55-64
80+
65-79
All Claimants - Total
By Claimant Age Group and Accident Date
Based on claim transactions between the Accident Date and December 31, 2020
26 26 www.ibc.ca 3
Number
of
Claimants
Percent
of Total
Claimants
Insurer Paid
Percent of
Total Insurer
Paid
Average
Insurer Paid
per Claimant
1,969 2.8% 6,305,118 1.7% 3,202
8,948 12.6% 41,154,619 10.9% 4,59922,549 31.7% 114,100,593 30.2% 5,060
19,008 26.7% 105,664,093 28.0% 5,559
10,612 14.9% 62,818,973 16.6% 5,920
6,746 9.5% 40,293,916 10.7% 5,9731,164 1.6% 7,072,039 1.9% 6,076
124 0.2% 481,948 0.1% 3,887
71,120 100.0% 377,891,299 100.0% 5,313
All Claimants - Total Accident dates January 1 - December 31, 2019
Age Group
65-79
0-15
25-39
80+
16-24
40-54
55-64
Unknown
All Claimants - Total
Number
of
Claimants
Percent
of Total
Claimants
Insurer Paid
Percent of
Total Insurer
Paid
Average
Insurer Paid
per Claimant
613 2.1% 1,330,281 1.7% 2,170
3,789 13.1% 9,062,566 11.7% 2,392
9,579 33.1% 24,410,991 31.5% 2,548
7,359 25.4% 20,502,776 26.5% 2,786
4,308 14.9% 12,545,633 16.2% 2,912
2,745 9.5% 8,092,683 10.4% 2,948
492 1.7% 1,448,728 1.9% 2,945
34 0.1% 65,702 0.1% 1,932
28,919 100.0% 77,459,361 100.0% 2,678
All Claimants - Total Accident dates January 1 - December 31, 2020
Age Group
0-15
25-39
16-24
All Claimants - Total
65-79
40-54
Unknown
55-64
80+
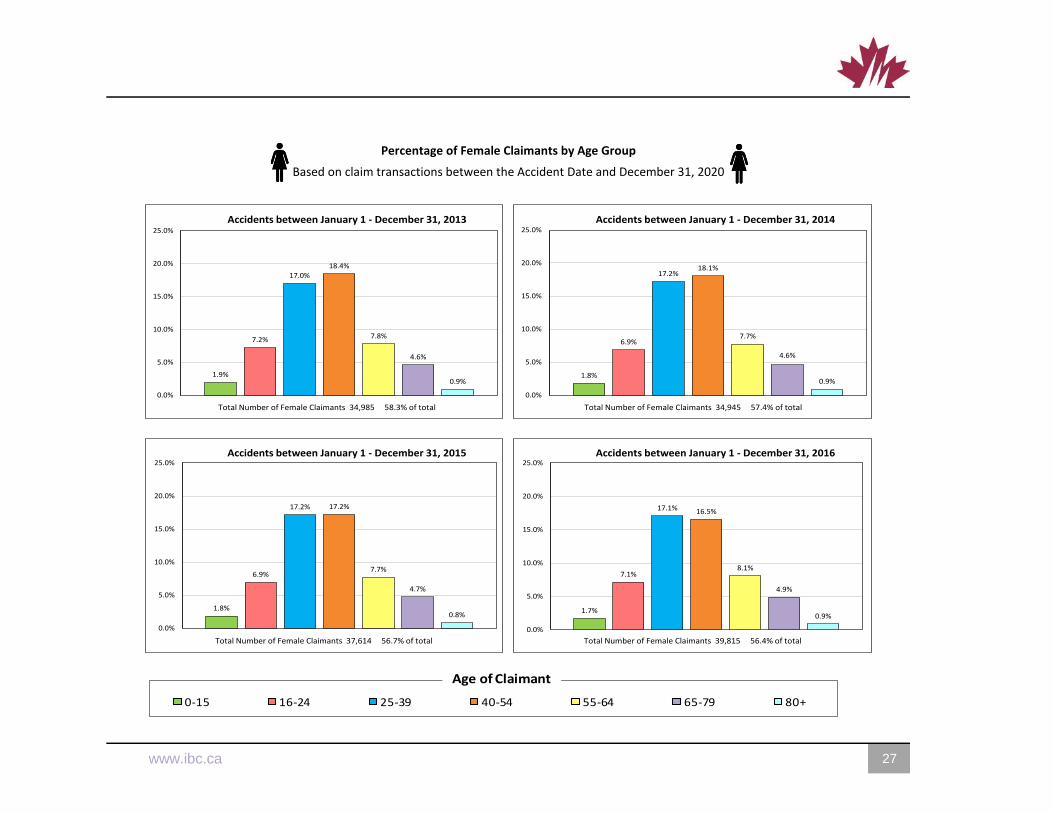
Percentage of Female Claimants by Age Group
Based on claim transactions between the Accident Date and December 31, 2020
2 www.ibc.ca www.ibc.ca 27
1.9%
7.2%
17.0%18.4%
7.8%
4.6%
0.9%
0.0%
5.0%
10.0%
15.0%
20.0%
25.0%
Accidents between January 1 - December 31, 2013
Total Number of Female Claimants 34,985 58.3% of total
1.8%
6.9%
17.2%18.1%
7.7%
4.6%
0.9%
0.0%
5.0%
10.0%
15.0%
20.0%
25.0%Accidents between January 1 - December 31, 2014
Total Number of Female Claimants 34,945 57.4% of total
1.8%
6.9%
17.2% 17.2%
7.7%
4.7%
0.8%
0.0%
5.0%
10.0%
15.0%
20.0%
25.0%Accidents between January 1 - December 31, 2015
Total Number of Female Claimants 37,614 56.7% of total
1.7%
7.1%
17.1% 16.5%
8.1%
4.9%
0.9%
0.0%
5.0%
10.0%
15.0%
20.0%
25.0%Accidents between January 1 - December 31, 2016
Total Number of Female Claimants 39,815 56.4% of total
2.7%
12.0%
32.6%
28.2%
13.8%
8.7%
1.8%
0.0%
5.0%
10.0%
15.0%
20.0%
25.0%
30.0%
35.0%
Accidents between January 1 - June 30, 2017
0-15 16-24 25-39 40-54 55-64 65-79 80+
Total Number of Claimants 14,292
Age of Claimant
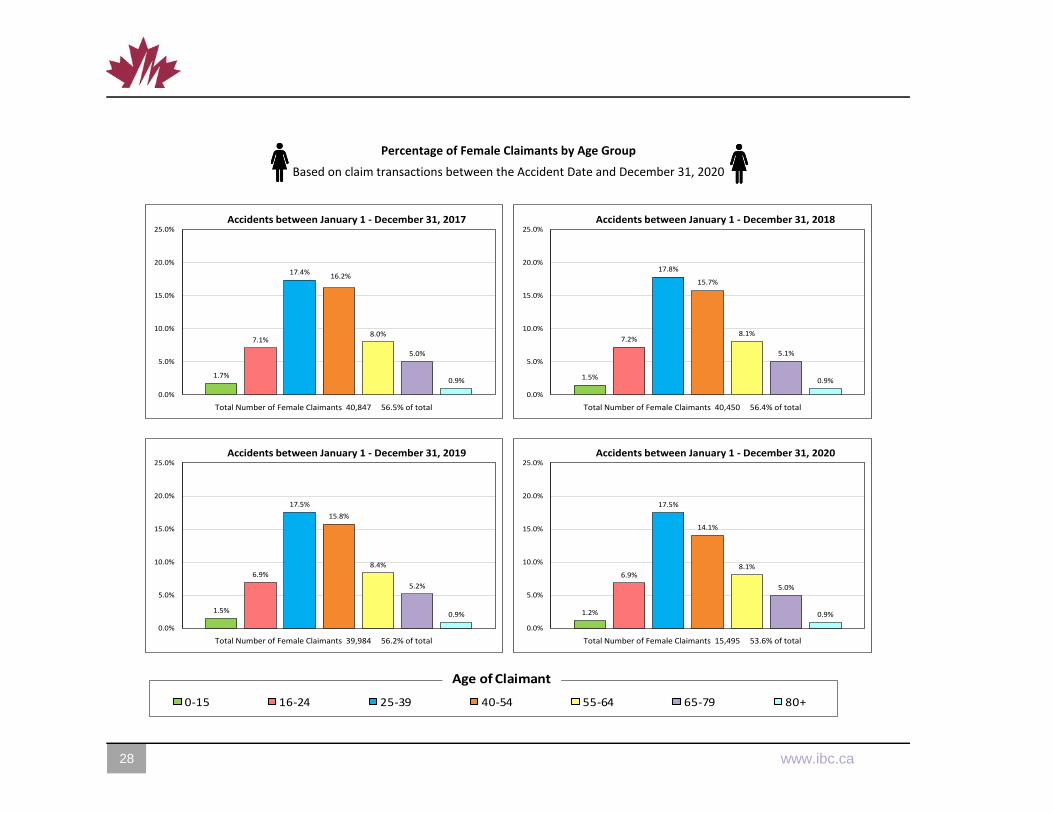
Percentage of Female Claimants by Age Group
Based on claim transactions between the Accident Date and December 31, 2020
28 28 www.ibc.ca 3
1.7%
7.1%
17.4%16.2%
8.0%
5.0%
0.9%
0.0%
5.0%
10.0%
15.0%
20.0%
25.0%Accidents between January 1 - December 31, 2017
Total Number of Female Claimants 40,847 56.5% of total
1.5%
7.2%
17.8%
15.7%
8.1%
5.1%
0.9%
0.0%
5.0%
10.0%
15.0%
20.0%
25.0%Accidents between January 1 - December 31, 2018
Total Number of Female Claimants 40,450 56.4% of total
1.5%
6.9%
17.5%
15.8%
8.4%
5.2%
0.9%
0.0%
5.0%
10.0%
15.0%
20.0%
25.0%Accidents between January 1 - December 31, 2019
Total Number of Female Claimants 39,984 56.2% of total
1.2%
6.9%
17.5%
14.1%
8.1%
5.0%
0.9%
0.0%
5.0%
10.0%
15.0%
20.0%
25.0%Accidents between January 1 - December 31, 2020
Total Number of Female Claimants 15,495 53.6% of total
2.7%
12.0%
32.6%
28.2%
13.8%
8.7%
1.8%
0.0%
5.0%
10.0%
15.0%
20.0%
25.0%
30.0%
35.0%
Accidents between January 1 - June 30, 2017
0-15 16-24 25-39 40-54 55-64 65-79 80+
Total Number of Claimants 14,292
Age of Claimant
Average Amount Paid per Female Claimant by Age Group
Based on claim transactions between the Accident Date and December 31, 2020
2 www.ibc.ca www.ibc.ca 29
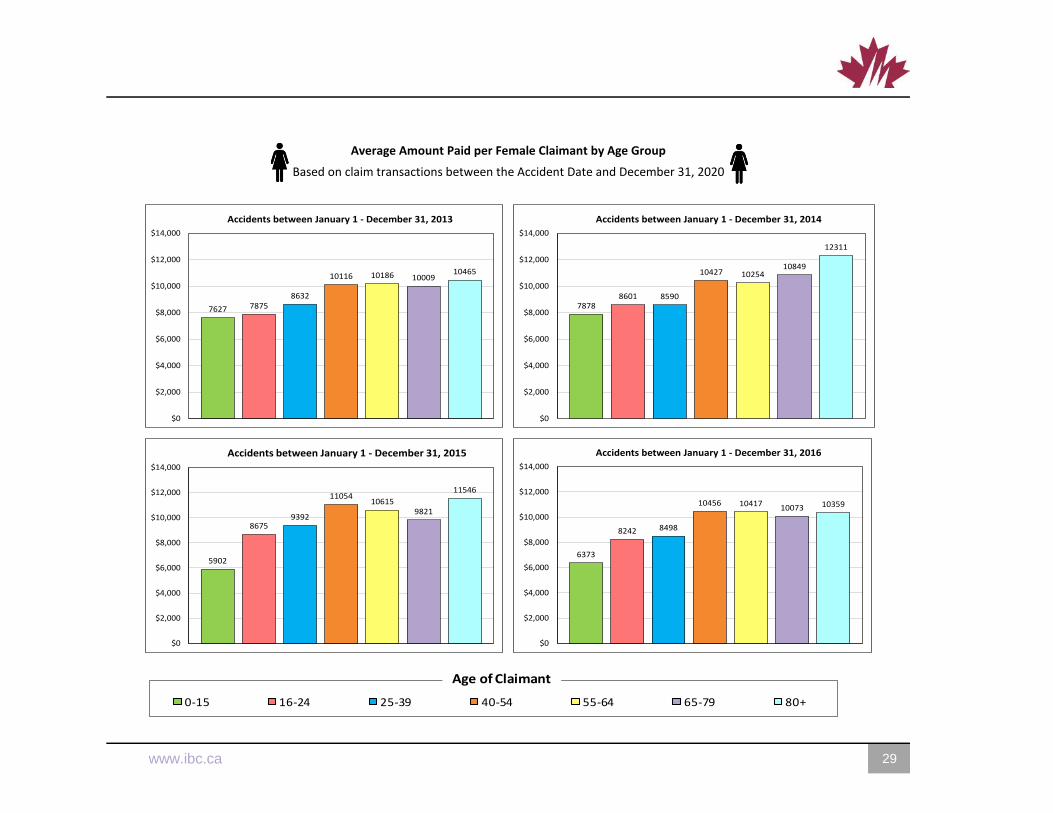
7627 78758632
10116 10186 1000910465
$0
$2,000
$4,000
$6,000
$8,000
$10,000
$12,000
$14,000
Accidents between January 1 - December 31, 2013
78788601 8590
10427 1025410849
12311
$0
$2,000
$4,000
$6,000
$8,000
$10,000
$12,000
$14,000
Accidents between January 1 - December 31, 2014
5902
86759392
1105410615
9821
11546
$0
$2,000
$4,000
$6,000
$8,000
$10,000
$12,000
$14,000
Accidents between January 1 - December 31, 2015
6373
8242 8498
10456 1041710073 10359
$0
$2,000
$4,000
$6,000
$8,000
$10,000
$12,000
$14,000
Accidents between January 1 - December 31, 2016
2.7%
12.0%
32.6%
28.2%
13.8%
8.7%
1.8%
0.0%
5.0%
10.0%
15.0%
20.0%
25.0%
30.0%
35.0%
Accidents between January 1 - June 30, 2017
0-15 16-24 25-39 40-54 55-64 65-79 80+
Total Number of Claimants 14,292
Age of Claimant
Average Amount Paid per Female Claimant by Age Group
Based on claim transactions between the Accident Date and December 31, 2020
30 30 www.ibc.ca 3
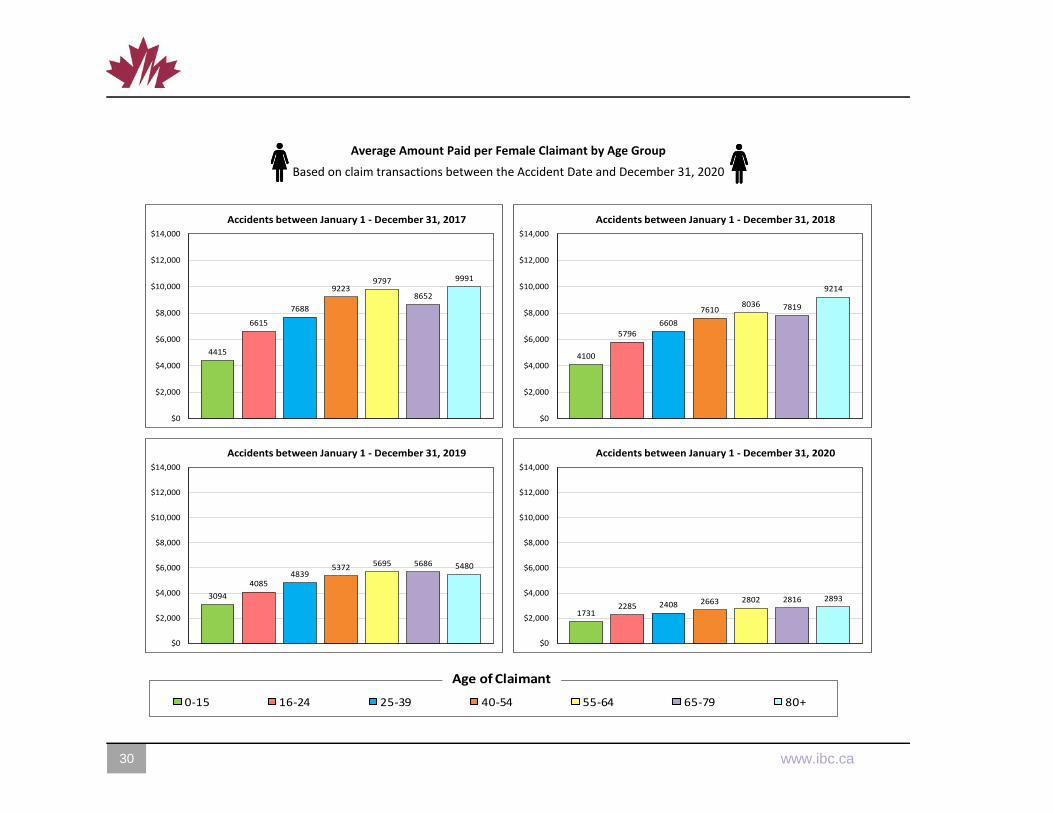
4415
6615
7688
92239797
8652
9991
$0
$2,000
$4,000
$6,000
$8,000
$10,000
$12,000
$14,000
Accidents between January 1 - December 31, 2017
4100
5796
6608
76108036 7819
9214
$0
$2,000
$4,000
$6,000
$8,000
$10,000
$12,000
$14,000
Accidents between January 1 - December 31, 2018
3094
40854839
5372 5695 5686 5480
$0
$2,000
$4,000
$6,000
$8,000
$10,000
$12,000
$14,000
Accidents between January 1 - December 31, 2019
17312285 2408 2663 2802 2816 2893
$0
$2,000
$4,000
$6,000
$8,000
$10,000
$12,000
$14,000
Accidents between January 1 - December 31, 2020
2.7%
12.0%
32.6%
28.2%
13.8%
8.7%
1.8%
0.0%
5.0%
10.0%
15.0%
20.0%
25.0%
30.0%
35.0%
Accidents between January 1 - June 30, 2017
0-15 16-24 25-39 40-54 55-64 65-79 80+
Total Number of Claimants 14,292
Age of Claimant
By Female Claimant Age Group and Accident Date
Based on claim transactions between the Accident Date and December 31, 2020
2 www.ibc.ca www.ibc.ca 31
Number
of
Claimants
Percent
of Total
Claimants
Insurer Paid
Percent of
Total Insurer
Paid
Average
Insurer Paid
per Claimant
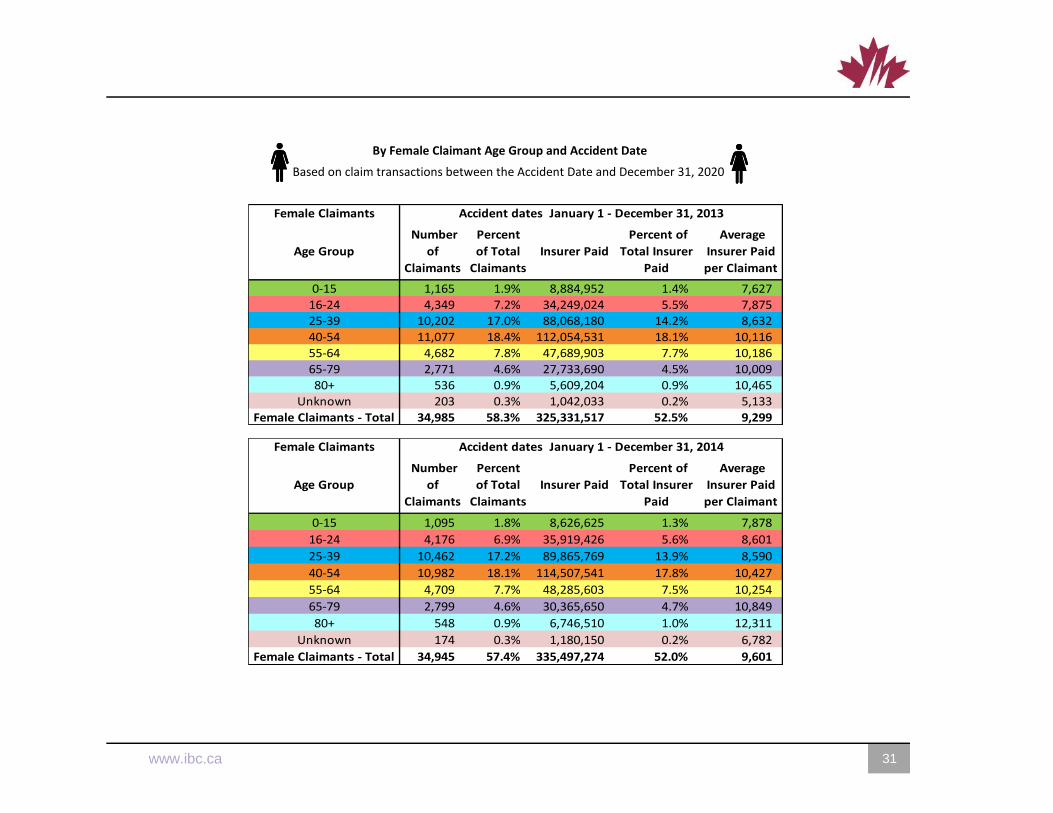
1,165 1.9% 8,884,952 1.4% 7,627
4,349 7.2% 34,249,024 5.5% 7,87510,202 17.0% 88,068,180 14.2% 8,632
11,077 18.4% 112,054,531 18.1% 10,116
4,682 7.8% 47,689,903 7.7% 10,186
2,771 4.6% 27,733,690 4.5% 10,009536 0.9% 5,609,204 0.9% 10,465
203 0.3% 1,042,033 0.2% 5,133
34,985 58.3% 325,331,517 52.5% 9,299
Female Claimants Accident dates January 1 - December 31, 2013
0-15
Age Group
40-54
25-39
55-64
65-79
16-24
80+
Unknown
Female Claimants - Total
Number
of
Claimants
Percent
of Total
Claimants
Insurer Paid
Percent of
Total Insurer
Paid
Average
Insurer Paid
per Claimant
1,095 1.8% 8,626,625 1.3% 7,878
4,176 6.9% 35,919,426 5.6% 8,601
10,462 17.2% 89,865,769 13.9% 8,590
10,982 18.1% 114,507,541 17.8% 10,427
4,709 7.7% 48,285,603 7.5% 10,254
2,799 4.6% 30,365,650 4.7% 10,849
548 0.9% 6,746,510 1.0% 12,311
174 0.3% 1,180,150 0.2% 6,782
34,945 57.4% 335,497,274 52.0% 9,601
Female Claimants Accident dates January 1 - December 31, 2014
0-15
Age Group
16-24
40-54
55-64
65-79
25-39
Female Claimants - Total
Unknown
80+
By Female Claimant Age Group and Accident Date
Based on claim transactions between the Accident Date and December 31, 2020
32 32 www.ibc.ca 3
Number
of
Claimants
Percent
of Total
Claimants
Insurer Paid
Percent of
Total Insurer
Paid
Average
Insurer Paid
per Claimant
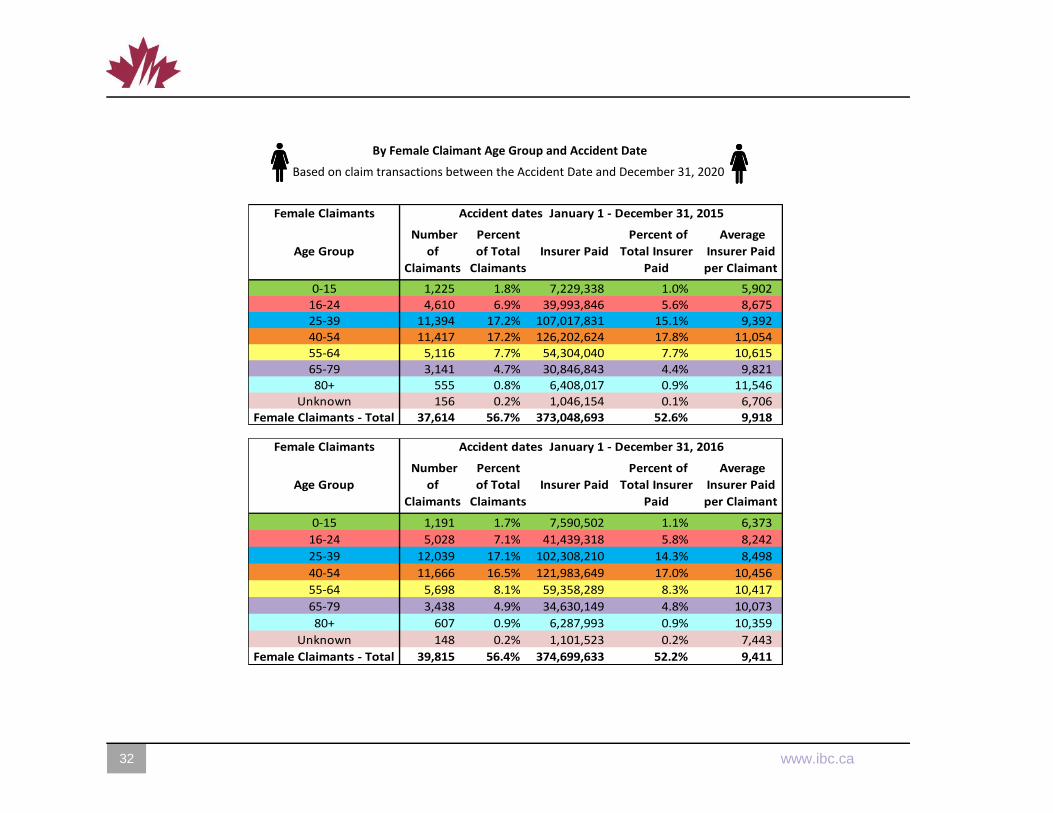
1,225 1.8% 7,229,338 1.0% 5,902
4,610 6.9% 39,993,846 5.6% 8,67511,394 17.2% 107,017,831 15.1% 9,392
11,417 17.2% 126,202,624 17.8% 11,054
5,116 7.7% 54,304,040 7.7% 10,615
3,141 4.7% 30,846,843 4.4% 9,821555 0.8% 6,408,017 0.9% 11,546
156 0.2% 1,046,154 0.1% 6,706
37,614 56.7% 373,048,693 52.6% 9,918
Female Claimants Accident dates January 1 - December 31, 2015
0-15
Age Group
25-39
40-54
16-24
55-64
65-7980+
Unknown
Female Claimants - Total
Number
of
Claimants
Percent
of Total
Claimants
Insurer Paid
Percent of
Total Insurer
Paid
Average
Insurer Paid
per Claimant
1,191 1.7% 7,590,502 1.1% 6,373
5,028 7.1% 41,439,318 5.8% 8,242
12,039 17.1% 102,308,210 14.3% 8,498
11,666 16.5% 121,983,649 17.0% 10,456
5,698 8.1% 59,358,289 8.3% 10,417
3,438 4.9% 34,630,149 4.8% 10,073
607 0.9% 6,287,993 0.9% 10,359
148 0.2% 1,101,523 0.2% 7,443
39,815 56.4% 374,699,633 52.2% 9,411
Female Claimants
0-15
Age Group
Accident dates January 1 - December 31, 2016
25-39
16-24
40-54
55-64
65-79
Female Claimants - Total
Unknown
80+
By Female Claimant Age Group and Accident Date
Based on claim transactions between the Accident Date and December 31, 2020
2 www.ibc.ca www.ibc.ca 33
Number
of
Claimants
Percent
of Total
Claimants
Insurer Paid
Percent of
Total Insurer
Paid
Average
Insurer Paid
per Claimant
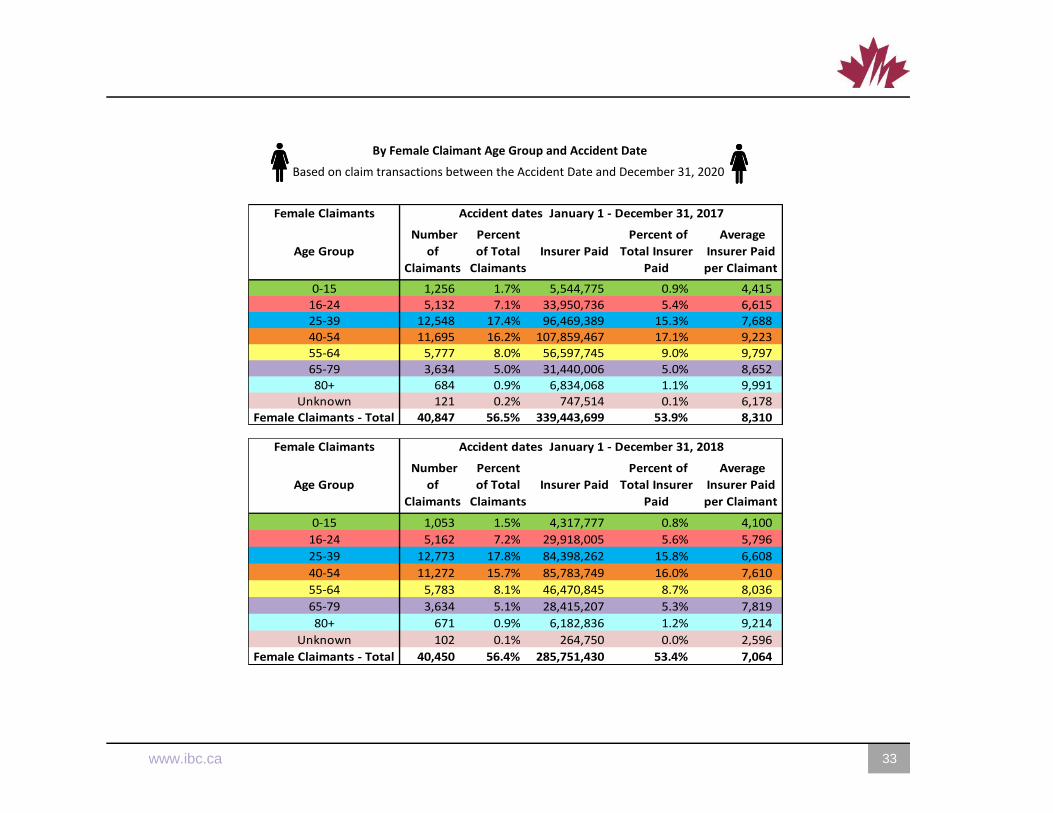
1,256 1.7% 5,544,775 0.9% 4,415
5,132 7.1% 33,950,736 5.4% 6,61512,548 17.4% 96,469,389 15.3% 7,688
11,695 16.2% 107,859,467 17.1% 9,223
5,777 8.0% 56,597,745 9.0% 9,797
3,634 5.0% 31,440,006 5.0% 8,652684 0.9% 6,834,068 1.1% 9,991
121 0.2% 747,514 0.1% 6,178
40,847 56.5% 339,443,699 53.9% 8,310
Female Claimants Accident dates January 1 - December 31, 2017
0-15
Age Group
16-2425-39
40-54
55-64
65-7980+
Unknown
Female Claimants - Total
Number
of
Claimants
Percent
of Total
Claimants
Insurer Paid
Percent of
Total Insurer
Paid
Average
Insurer Paid
per Claimant
1,053 1.5% 4,317,777 0.8% 4,100
5,162 7.2% 29,918,005 5.6% 5,796
12,773 17.8% 84,398,262 15.8% 6,608
11,272 15.7% 85,783,749 16.0% 7,610
5,783 8.1% 46,470,845 8.7% 8,036
3,634 5.1% 28,415,207 5.3% 7,819
671 0.9% 6,182,836 1.2% 9,214
102 0.1% 264,750 0.0% 2,596
40,450 56.4% 285,751,430 53.4% 7,064
Female Claimants Accident dates January 1 - December 31, 2018
16-24
25-39
0-15
Age Group
Unknown
40-54
55-64
65-79
Female Claimants - Total
80+
By Female Claimant Age Group and Accident Date
Based on claim transactions between the Accident Date and December 31, 2020
34 34 www.ibc.ca 3
Number
of
Claimants
Percent
of Total
Claimants
Insurer Paid
Percent of
Total Insurer
Paid
Average
Insurer Paid
per Claimant
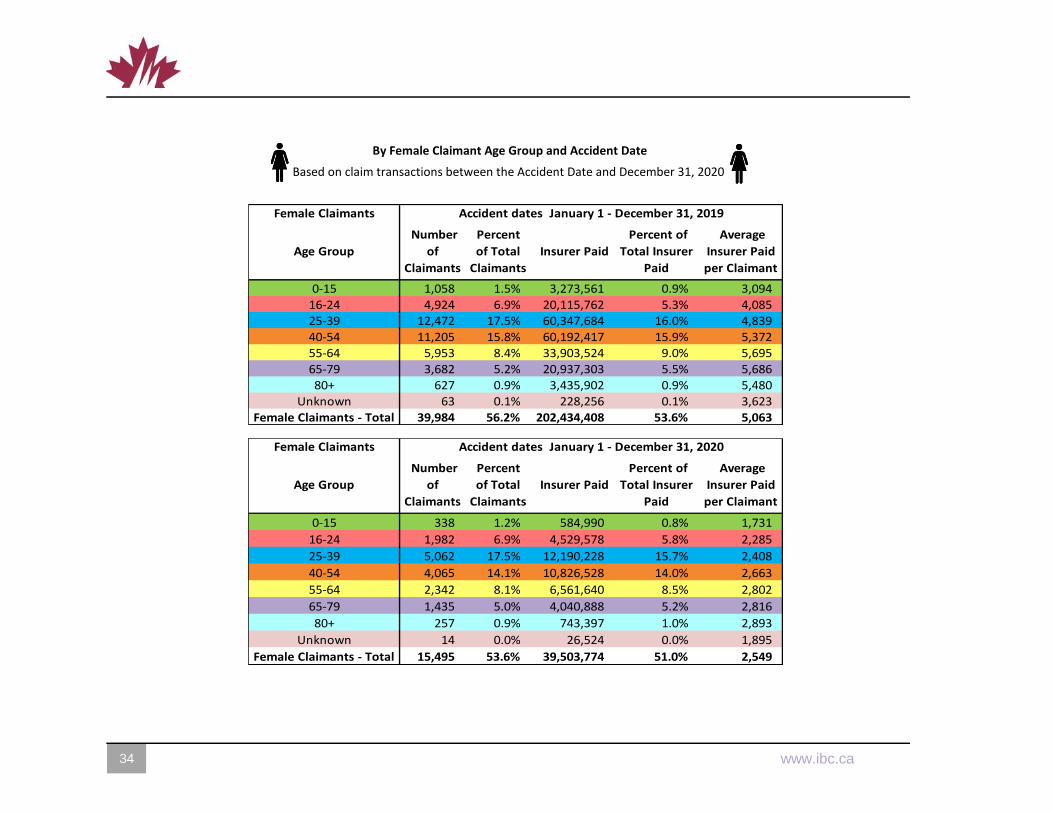
1,058 1.5% 3,273,561 0.9% 3,094
4,924 6.9% 20,115,762 5.3% 4,08512,472 17.5% 60,347,684 16.0% 4,839
11,205 15.8% 60,192,417 15.9% 5,372
5,953 8.4% 33,903,524 9.0% 5,695
3,682 5.2% 20,937,303 5.5% 5,686627 0.9% 3,435,902 0.9% 5,480
63 0.1% 228,256 0.1% 3,623
39,984 56.2% 202,434,408 53.6% 5,063
Female Claimants Accident dates January 1 - December 31, 2019
Age Group
0-15
16-2425-39
40-54
55-64
65-79
Unknown
80+
Female Claimants - Total
Number
of
Claimants
Percent
of Total
Claimants
Insurer Paid
Percent of
Total Insurer
Paid
Average
Insurer Paid
per Claimant
338 1.2% 584,990 0.8% 1,731
1,982 6.9% 4,529,578 5.8% 2,285
5,062 17.5% 12,190,228 15.7% 2,408
4,065 14.1% 10,826,528 14.0% 2,663
2,342 8.1% 6,561,640 8.5% 2,802
1,435 5.0% 4,040,888 5.2% 2,816
257 0.9% 743,397 1.0% 2,893
14 0.0% 26,524 0.0% 1,895
15,495 53.6% 39,503,774 51.0% 2,549
16-24
25-39
0-15
Age Group
Female Claimants Accident dates January 1 - December 31, 2020
40-54
55-64
65-79
Unknown
Female Claimants - Total
80+
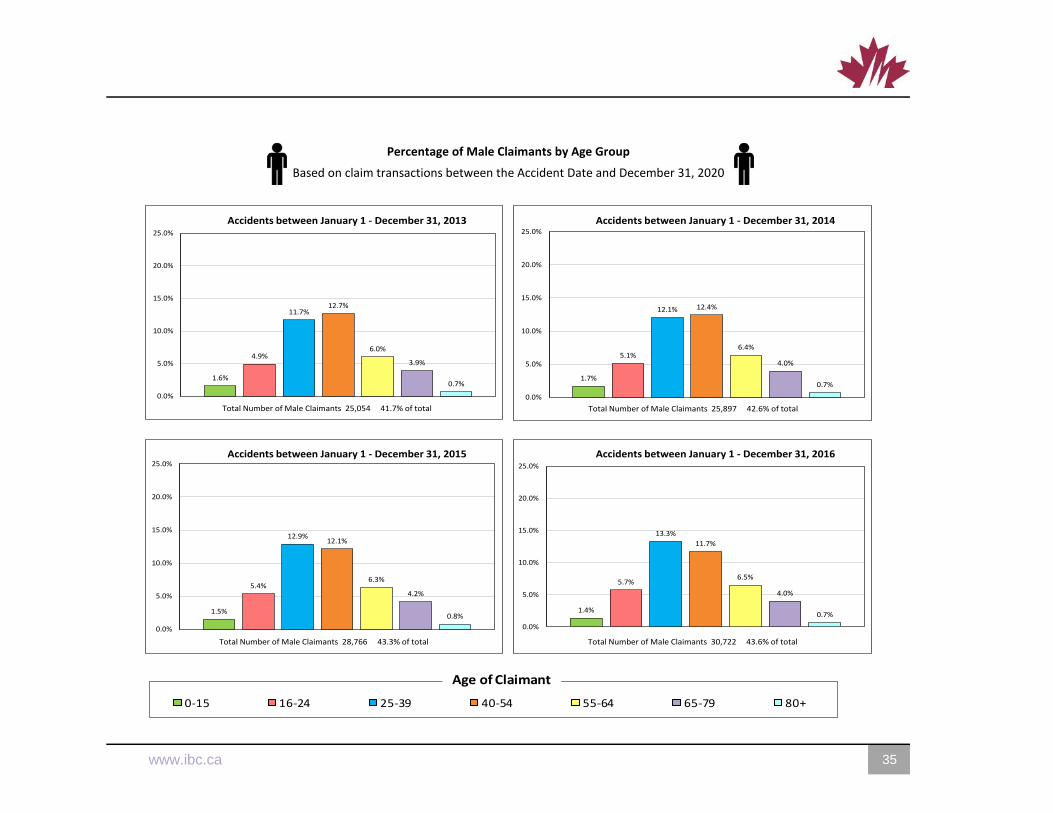
Percentage of Male Claimants by Age Group
Based on claim transactions between the Accident Date and December 31, 2020
2 www.ibc.ca www.ibc.ca 35
1.6%
4.9%
11.7%12.7%
6.0%
3.9%
0.7%
0.0%
5.0%
10.0%
15.0%
20.0%
25.0%
Accidents between January 1 - December 31, 2013
Total Number of Male Claimants 25,054 41.7% of total
1.7%
5.1%
12.1% 12.4%
6.4%
4.0%
0.7%
0.0%
5.0%
10.0%
15.0%
20.0%
25.0%
Accidents between January 1 - December 31, 2014
Total Number of Male Claimants 25,897 42.6% of total
1.5%
5.4%
12.9%12.1%
6.3%
4.2%
0.8%
0.0%
5.0%
10.0%
15.0%
20.0%
25.0%Accidents between January 1 - December 31, 2015
Total Number of Male Claimants 28,766 43.3% of total
1.4%
5.7%
13.3%
11.7%
6.5%
4.0%
0.7%
0.0%
5.0%
10.0%
15.0%
20.0%
25.0%
Accidents between January 1 - December 31, 2016
Total Number of Male Claimants 30,722 43.6% of total
2.7%
12.0%
32.6%
28.2%
13.8%
8.7%
1.8%
0.0%
5.0%
10.0%
15.0%
20.0%
25.0%
30.0%
35.0%
Accidents between January 1 - June 30, 2017
0-15 16-24 25-39 40-54 55-64 65-79 80+
Total Number of Claimants 14,292
Age of Claimant
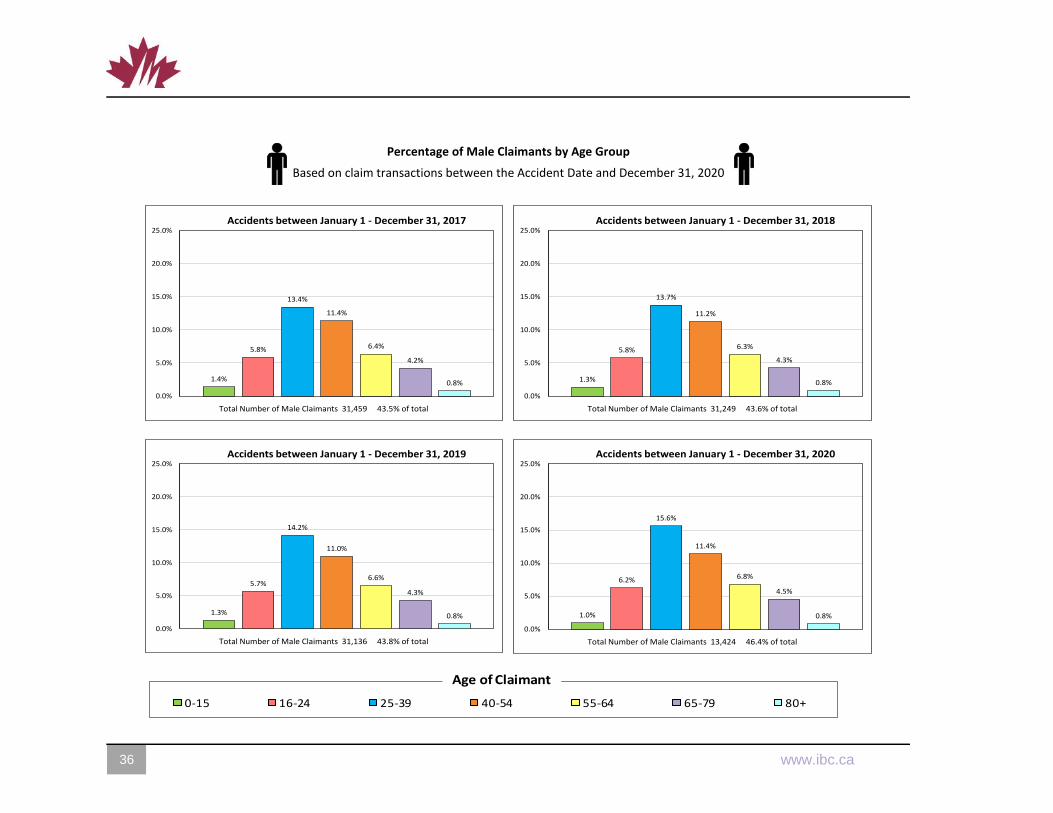
Percentage of Male Claimants by Age Group
Based on claim transactions between the Accident Date and December 31, 2020
36 36 www.ibc.ca 3
1.4%
5.8%
13.4%
11.4%
6.4%
4.2%
0.8%
0.0%
5.0%
10.0%
15.0%
20.0%
25.0%Accidents between January 1 - December 31, 2017
Total Number of Male Claimants 31,459 43.5% of total
1.3%
5.8%
13.7%
11.2%
6.3%
4.3%
0.8%
0.0%
5.0%
10.0%
15.0%
20.0%
25.0%Accidents between January 1 - December 31, 2018
Total Number of Male Claimants 31,249 43.6% of total
1.3%
5.7%
14.2%
11.0%
6.6%
4.3%
0.8%
0.0%
5.0%
10.0%
15.0%
20.0%
25.0%Accidents between January 1 - December 31, 2019
Total Number of Male Claimants 31,136 43.8% of total
1.0%
6.2%
15.6%
11.4%
6.8%
4.5%
0.8%
0.0%
5.0%
10.0%
15.0%
20.0%
25.0%Accidents between January 1 - December 31, 2020
Total Number of Male Claimants 13,424 46.4% of total
2.7%
12.0%
32.6%
28.2%
13.8%
8.7%
1.8%
0.0%
5.0%
10.0%
15.0%
20.0%
25.0%
30.0%
35.0%
Accidents between January 1 - June 30, 2017
0-15 16-24 25-39 40-54 55-64 65-79 80+
Total Number of Claimants 14,292
Age of Claimant
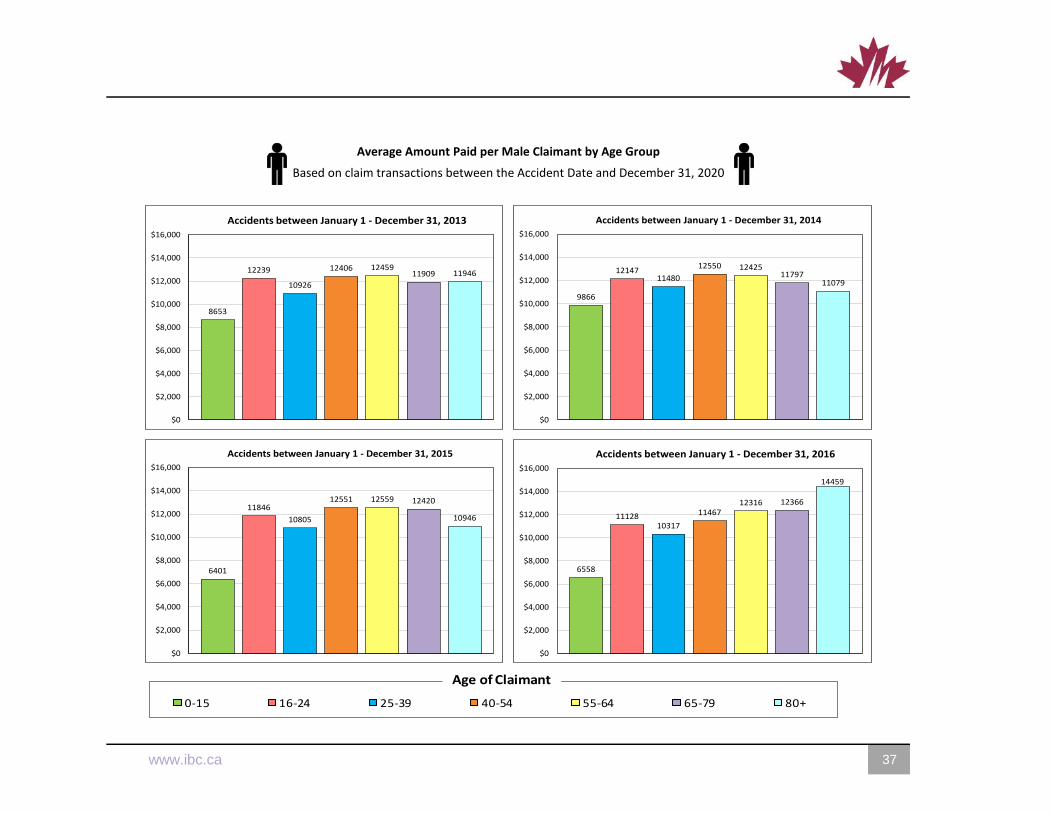
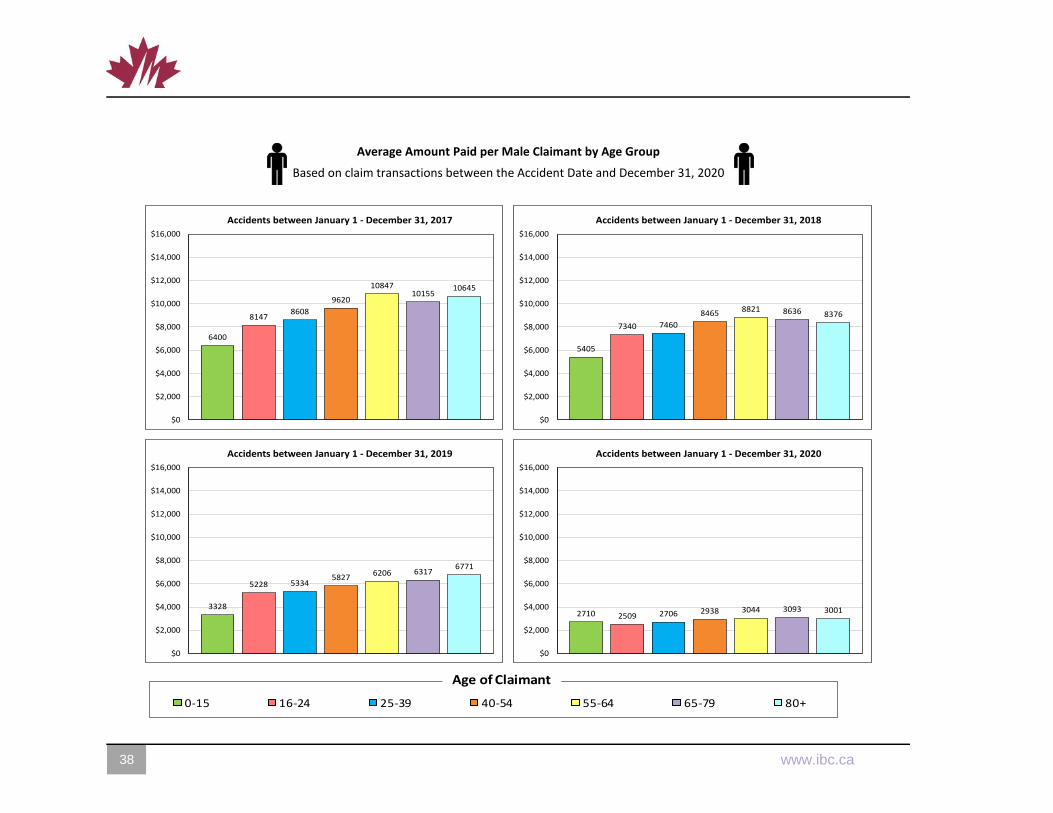
Average Amount Paid per Male Claimant by Age Group
Based on claim transactions between the Accident Date and December 31, 2020
2 www.ibc.ca www.ibc.ca 37
8653
12239
10926
12406 1245911909 11946
$0
$2,000
$4,000
$6,000
$8,000
$10,000
$12,000
$14,000
$16,000
Accidents between January 1 - December 31, 2013
9866
1214711480
12550 1242511797
11079
$0
$2,000
$4,000
$6,000
$8,000
$10,000
$12,000
$14,000
$16,000
Accidents between January 1 - December 31, 2014
6401
11846
10805
12551 12559 12420
10946
$0
$2,000
$4,000
$6,000
$8,000
$10,000
$12,000
$14,000
$16,000
Accidents between January 1 - December 31, 2015
6558
1112810317
1146712316 12366
14459
$0
$2,000
$4,000
$6,000
$8,000
$10,000
$12,000
$14,000
$16,000
Accidents between January 1 - December 31, 2016
2.7%
12.0%
32.6%
28.2%
13.8%
8.7%
1.8%
0.0%
5.0%
10.0%
15.0%
20.0%
25.0%
30.0%
35.0%
Accidents between January 1 - June 30, 2017
0-15 16-24 25-39 40-54 55-64 65-79 80+
Total Number of Claimants 14,292
Age of Claimant
Average Amount Paid per Male Claimant by Age Group
Based on claim transactions between the Accident Date and December 31, 2020
38 38 www.ibc.ca 3
6400
81478608
9620
1084710155
10645
$0
$2,000
$4,000
$6,000
$8,000
$10,000
$12,000
$14,000
$16,000
Accidents between January 1 - December 31, 2017
5405
7340 7460
8465 8821 8636 8376
$0
$2,000
$4,000
$6,000
$8,000
$10,000
$12,000
$14,000
$16,000
Accidents between January 1 - December 31, 2018
3328
5228 53345827
6206 63176771
$0
$2,000
$4,000
$6,000
$8,000
$10,000
$12,000
$14,000
$16,000
Accidents between January 1 - December 31, 2019
2710 2509 2706 2938 3044 3093 3001
$0
$2,000
$4,000
$6,000
$8,000
$10,000
$12,000
$14,000
$16,000
Accidents between January 1 - December 31, 2020
2.7%
12.0%
32.6%
28.2%
13.8%
8.7%
1.8%
0.0%
5.0%
10.0%
15.0%
20.0%
25.0%
30.0%
35.0%
Accidents between January 1 - June 30, 2017
0-15 16-24 25-39 40-54 55-64 65-79 80+
Total Number of Claimants 14,292
Age of Claimant
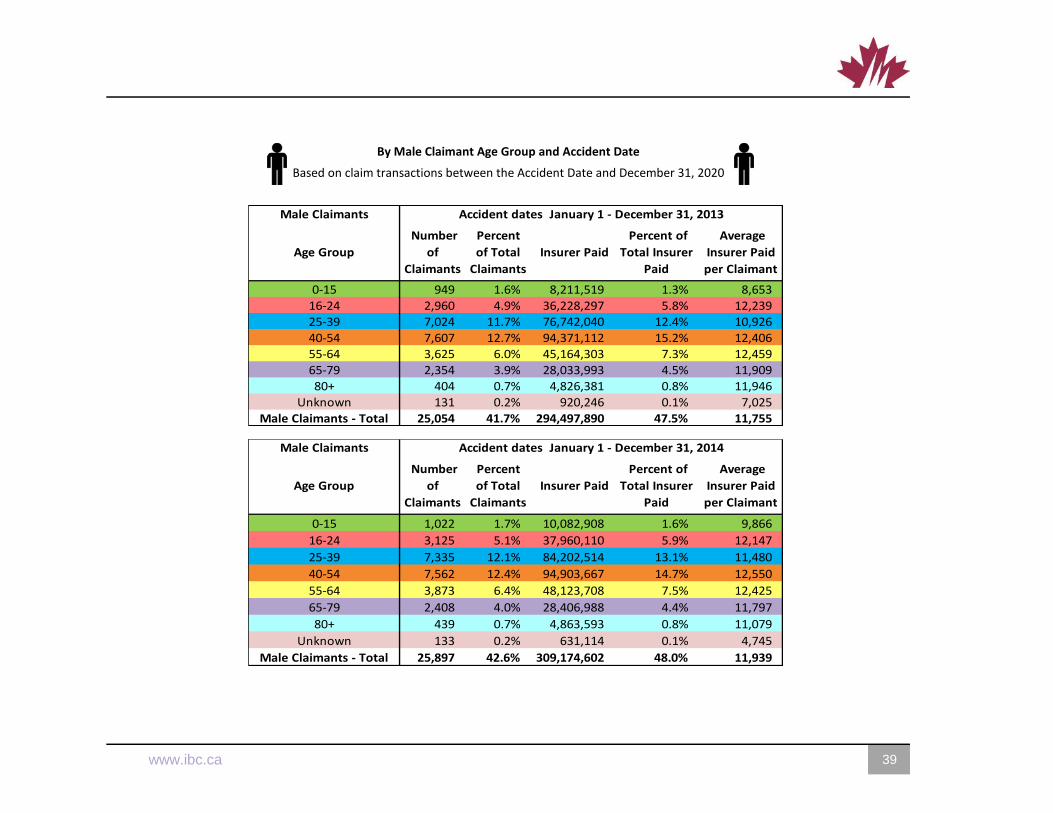
By Male Claimant Age Group and Accident Date
Based on claim transactions between the Accident Date and December 31, 2020
2 www.ibc.ca www.ibc.ca 39
Number
of
Claimants
Percent
of Total
Claimants
Insurer Paid
Percent of
Total Insurer
Paid
Average
Insurer Paid
per Claimant
949 1.6% 8,211,519 1.3% 8,653
2,960 4.9% 36,228,297 5.8% 12,2397,024 11.7% 76,742,040 12.4% 10,926
7,607 12.7% 94,371,112 15.2% 12,406
3,625 6.0% 45,164,303 7.3% 12,459
2,354 3.9% 28,033,993 4.5% 11,909404 0.7% 4,826,381 0.8% 11,946
131 0.2% 920,246 0.1% 7,025
25,054 41.7% 294,497,890 47.5% 11,755
0-15
Male Claimants Accident dates January 1 - December 31, 2013
Age Group
25-3916-24
40-54
55-64
80+
Unknown
65-79
Male Claimants - Total
Number
of
Claimants
Percent
of Total
Claimants
Insurer Paid
Percent of
Total Insurer
Paid
Average
Insurer Paid
per Claimant
1,022 1.7% 10,082,908 1.6% 9,866
3,125 5.1% 37,960,110 5.9% 12,147
7,335 12.1% 84,202,514 13.1% 11,480
7,562 12.4% 94,903,667 14.7% 12,550
3,873 6.4% 48,123,708 7.5% 12,425
2,408 4.0% 28,406,988 4.4% 11,797
439 0.7% 4,863,593 0.8% 11,079
133 0.2% 631,114 0.1% 4,745
25,897 42.6% 309,174,602 48.0% 11,939
Male Claimants Accident dates January 1 - December 31, 2014
Age Group
0-15
16-24
55-64
40-54
25-39
Male Claimants - Total
80+
65-79
Unknown
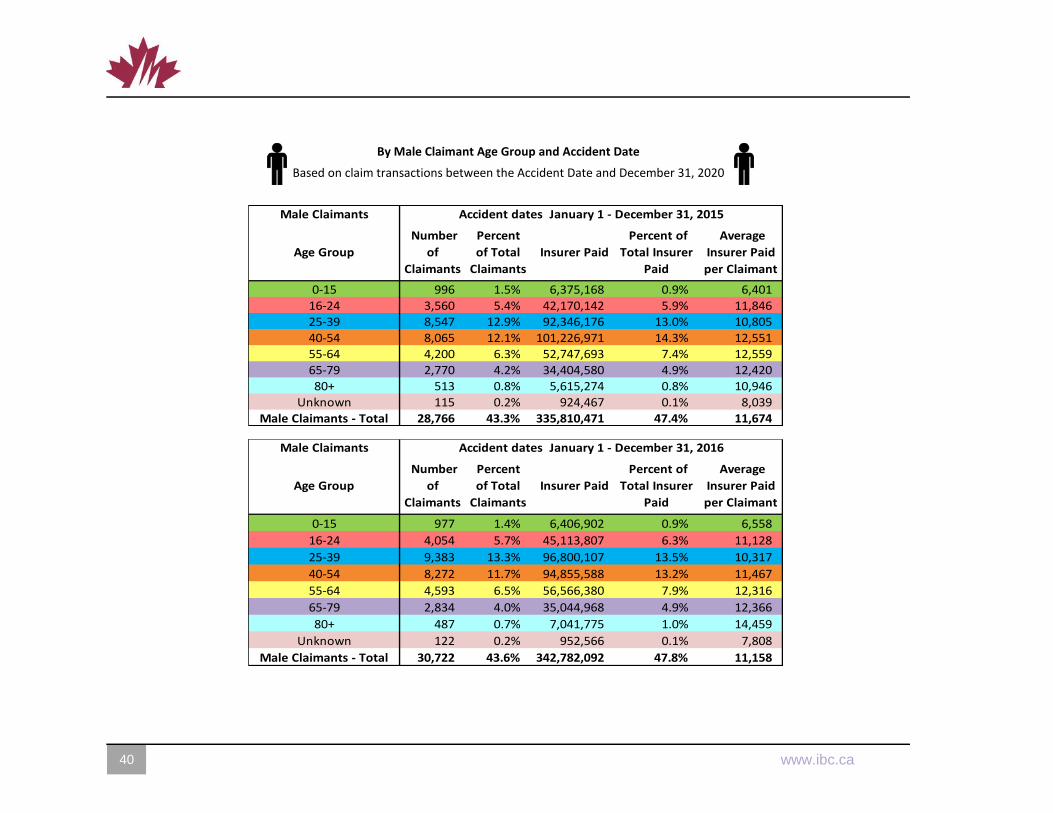
By Male Claimant Age Group and Accident Date
Based on claim transactions between the Accident Date and December 31, 2020
40 40 www.ibc.ca 3
Number
of
Claimants
Percent
of Total
Claimants
Insurer Paid
Percent of
Total Insurer
Paid
Average
Insurer Paid
per Claimant
996 1.5% 6,375,168 0.9% 6,401
3,560 5.4% 42,170,142 5.9% 11,8468,547 12.9% 92,346,176 13.0% 10,805
8,065 12.1% 101,226,971 14.3% 12,551
4,200 6.3% 52,747,693 7.4% 12,559
2,770 4.2% 34,404,580 4.9% 12,420513 0.8% 5,615,274 0.8% 10,946
115 0.2% 924,467 0.1% 8,039
28,766 43.3% 335,810,471 47.4% 11,674
Age Group
Male Claimants Accident dates January 1 - December 31, 2015
0-15
25-3916-24
40-54
65-79
55-64
80+
Male Claimants - Total
Unknown
Number
of
Claimants
Percent
of Total
Claimants
Insurer Paid
Percent of
Total Insurer
Paid
Average
Insurer Paid
per Claimant
977 1.4% 6,406,902 0.9% 6,558
4,054 5.7% 45,113,807 6.3% 11,128
9,383 13.3% 96,800,107 13.5% 10,317
8,272 11.7% 94,855,588 13.2% 11,467
4,593 6.5% 56,566,380 7.9% 12,316
2,834 4.0% 35,044,968 4.9% 12,366
487 0.7% 7,041,775 1.0% 14,459
122 0.2% 952,566 0.1% 7,808
30,722 43.6% 342,782,092 47.8% 11,158
Male Claimants Accident dates January 1 - December 31, 2016
16-24
0-15
Age Group
55-64
40-54
25-39
Male Claimants - Total
80+
65-79
Unknown
By Male Claimant Age Group and Accident Date
Based on claim transactions between the Accident Date and December 31, 2020
2 www.ibc.ca www.ibc.ca 41
Number
of
Claimants
Percent
of Total
Claimants
Insurer Paid
Percent of
Total Insurer
Paid
Average
Insurer Paid
per Claimant
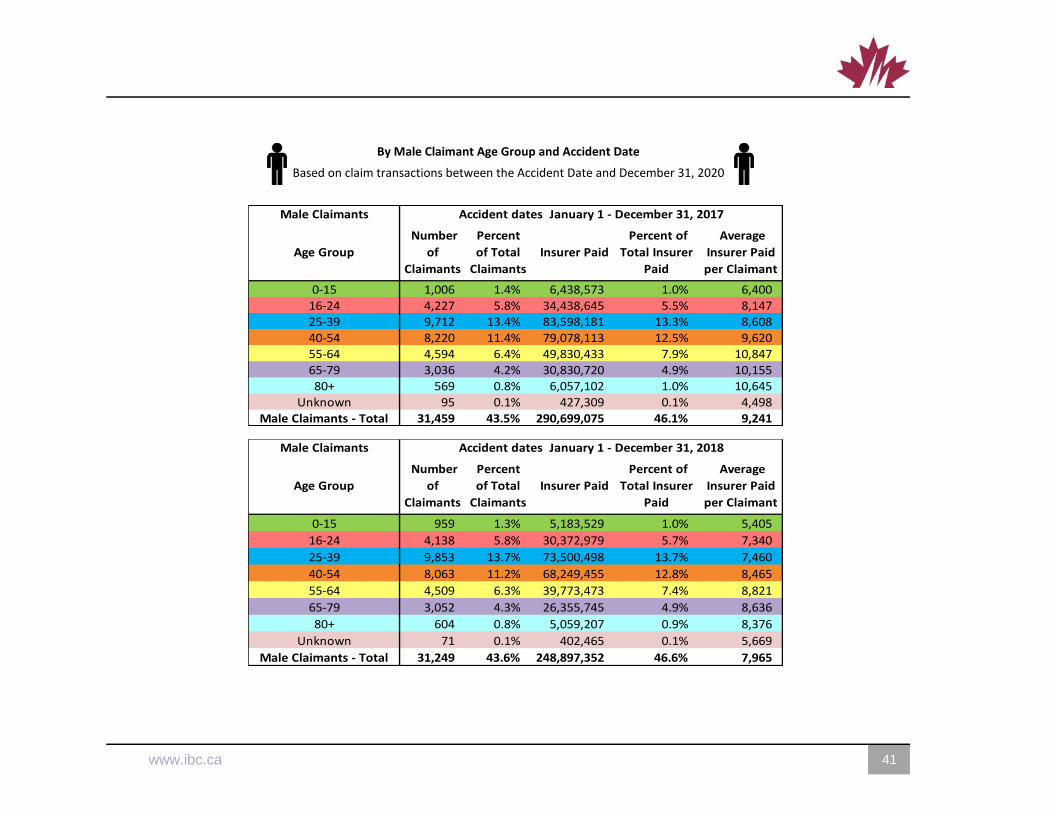
1,006 1.4% 6,438,573 1.0% 6,400
4,227 5.8% 34,438,645 5.5% 8,1479,712 13.4% 83,598,181 13.3% 8,608
8,220 11.4% 79,078,113 12.5% 9,620
4,594 6.4% 49,830,433 7.9% 10,847
3,036 4.2% 30,830,720 4.9% 10,155569 0.8% 6,057,102 1.0% 10,645
95 0.1% 427,309 0.1% 4,498
31,459 43.5% 290,699,075 46.1% 9,241
Male Claimants Accident dates January 1 - December 31, 2017
Age Group
0-15
25-3916-24
40-54
65-79
55-64
80+
Male Claimants - Total
Unknown
Number
of
Claimants
Percent
of Total
Claimants
Insurer Paid
Percent of
Total Insurer
Paid
Average
Insurer Paid
per Claimant
959 1.3% 5,183,529 1.0% 5,405
4,138 5.8% 30,372,979 5.7% 7,340
9,853 13.7% 73,500,498 13.7% 7,460
8,063 11.2% 68,249,455 12.8% 8,465
4,509 6.3% 39,773,473 7.4% 8,821
3,052 4.3% 26,355,745 4.9% 8,636
604 0.8% 5,059,207 0.9% 8,376
71 0.1% 402,465 0.1% 5,669
31,249 43.6% 248,897,352 46.6% 7,965
Male Claimants Accident dates January 1 - December 31, 2018
16-24
0-15
Age Group
65-79
25-39
55-64
40-54
Male Claimants - Total
80+
Unknown
By Male Claimant Age Group and Accident Date
Based on claim transactions between the Accident Date and December 31, 2020
42 42 www.ibc.ca 3
Number
of
Claimants
Percent
of Total
Claimants
Insurer Paid
Percent of
Total Insurer
Paid
Average
Insurer Paid
per Claimant
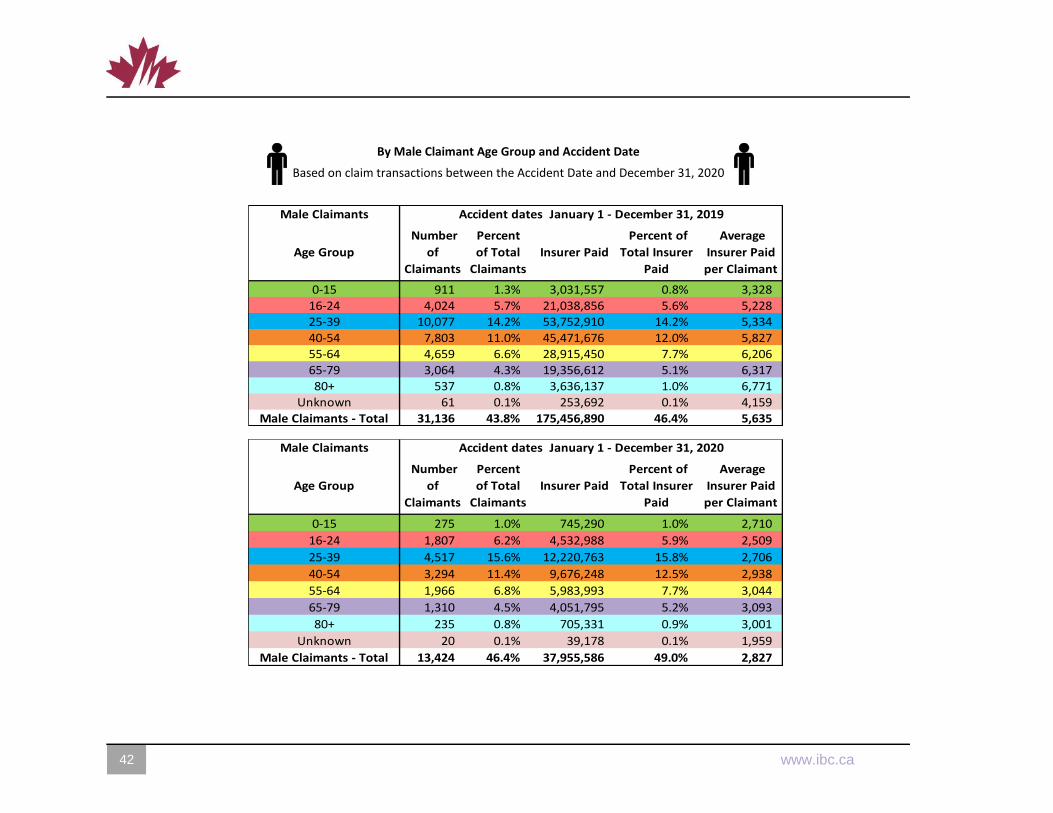
911 1.3% 3,031,557 0.8% 3,328
4,024 5.7% 21,038,856 5.6% 5,22810,077 14.2% 53,752,910 14.2% 5,334
7,803 11.0% 45,471,676 12.0% 5,827
4,659 6.6% 28,915,450 7.7% 6,206
3,064 4.3% 19,356,612 5.1% 6,317537 0.8% 3,636,137 1.0% 6,771
61 0.1% 253,692 0.1% 4,159
31,136 43.8% 175,456,890 46.4% 5,635
Male Claimants Accident dates January 1 - December 31, 2019
Age Group
0-15
25-3916-24
40-54
65-79
55-64
80+
Unknown
Male Claimants - Total
Number
of
Claimants
Percent
of Total
Claimants
Insurer Paid
Percent of
Total Insurer
Paid
Average
Insurer Paid
per Claimant
275 1.0% 745,290 1.0% 2,710
1,807 6.2% 4,532,988 5.9% 2,509
4,517 15.6% 12,220,763 15.8% 2,706
3,294 11.4% 9,676,248 12.5% 2,938
1,966 6.8% 5,983,993 7.7% 3,044
1,310 4.5% 4,051,795 5.2% 3,093
235 0.8% 705,331 0.9% 3,001
20 0.1% 39,178 0.1% 1,959
13,424 46.4% 37,955,586 49.0% 2,827
Male Claimants Accident dates January 1 - December 31, 2020
16-24
0-15
Age Group
Unknown
65-79
25-39
55-64
40-54
Male Claimants - Total
80+
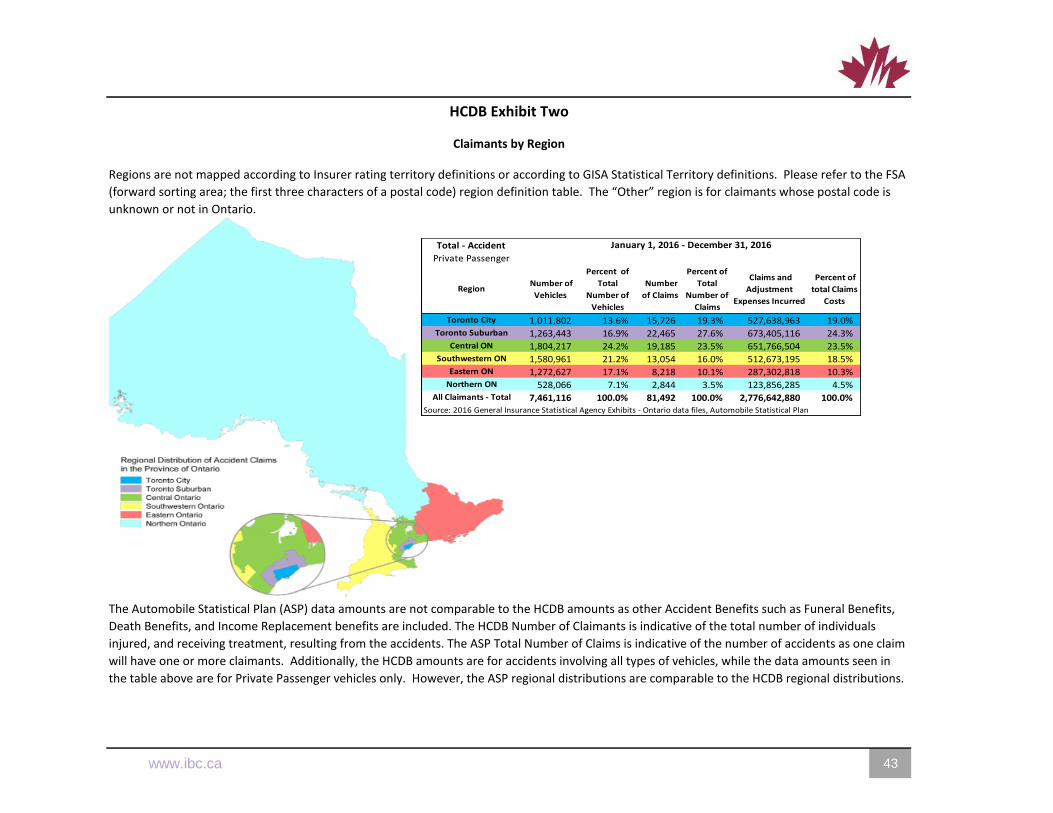
HCDB Exhibit Two
Claimants by Region
2 www.ibc.ca www.ibc.ca 43
Regions are not mapped according to Insurer rating territory definitions or according to GISA Statistical Territory definitions. Please refer to the FSA
(forward sorting area; the first three characters of a postal code) region definition table. The “Other” region is for claimants whose postal code is
unknown or not in Ontario.
The Automobile Statistical Plan (ASP) data amounts are not comparable to the HCDB amounts as other Accident Benefits such as Funeral Benefits,
Death Benefits, and Income Replacement benefits are included. The HCDB Number of Claimants is indicative of the total number of individuals
injured, and receiving treatment, resulting from the accidents. The ASP Total Number of Claims is indicative of the number of accidents as one claim
will have one or more claimants. Additionally, the HCDB amounts are for accidents involving all types of vehicles, while the data amounts seen in
the table above are for Private Passenger vehicles only. However, the ASP regional distributions are comparable to the HCDB regional distributions.
Number of
Vehicles
Percent of
Total
Number of
Vehicles
Number
of Claims
Percent of
Total
Number of
Claims
Claims and
Adjustment
Expenses Incurred
Percent of
total Claims
Costs
1,011,802 13.6% 15,726 19.3% 527,638,963 19.0%
1,263,443 16.9% 22,465 27.6% 673,405,116 24.3%
1,804,217 24.2% 19,185 23.5% 651,766,504 23.5%
1,580,961 21.2% 13,054 16.0% 512,673,195 18.5%
1,272,627 17.1% 8,218 10.1% 287,302,818 10.3%
528,066 7.1% 2,844 3.5% 123,856,285 4.5%
7,461,116 100.0% 81,492 100.0% 2,776,642,880 100.0%Source: 2016 General Insurance Statistical Agency Exhibits - Ontario data files, Automobile Statistical Plan
Central ON
Southwestern ON
Eastern ON
Northern ON
All Claimants - Total
Toronto Suburban
Total - Accident January 1, 2016 - December 31, 2016
Private Passenger
Region
Toronto City
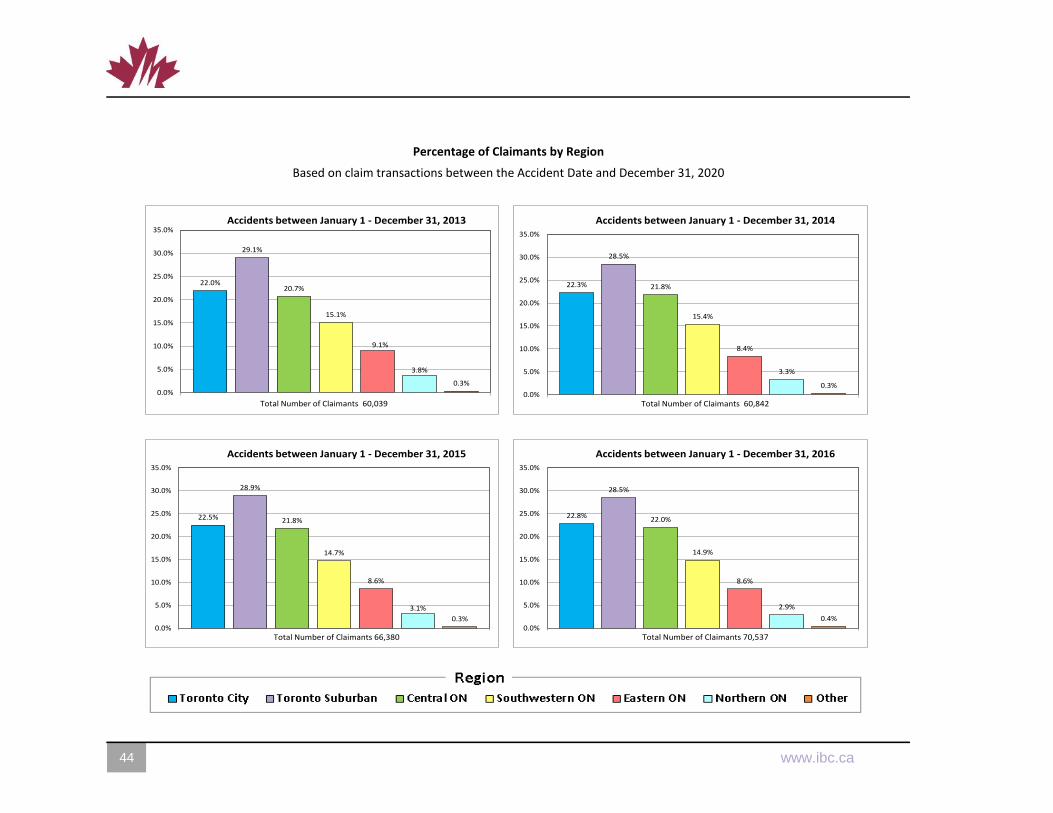
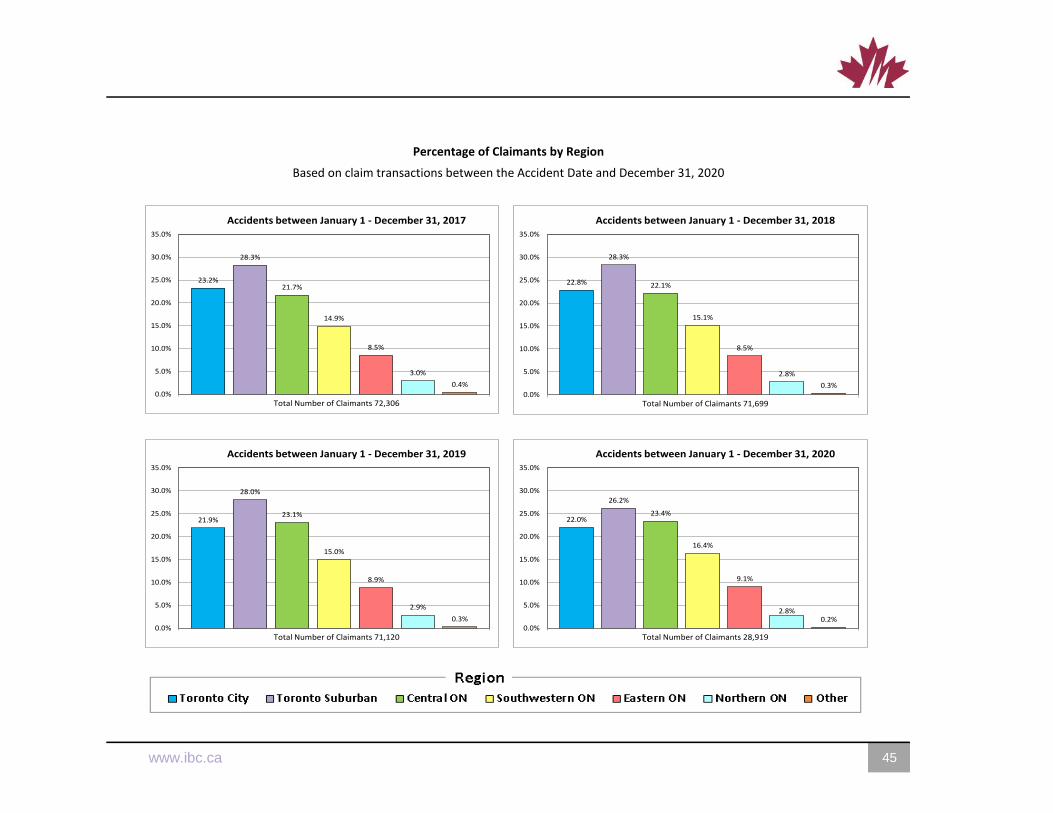
Percentage of Claimants by Region
Based on claim transactions between the Accident Date and December 31, 2020
44 44 www.ibc.ca 3
22.0%
29.1%
20.7%
15.1%
9.1%
3.8%
0.3%0.0%
5.0%
10.0%
15.0%
20.0%
25.0%
30.0%
35.0%Accidents between January 1 - December 31, 2013
Total Number of Claimants 60,039
22.3%
28.5%
21.8%
15.4%
8.4%
3.3%
0.3%
1
0.0%
5.0%
10.0%
15.0%
20.0%
25.0%
30.0%
35.0%
Accidents between January 1 - December 31, 2014
Total Number of Claimants 60,842
22.5%
28.9%
21.8%
14.7%
8.6%
3.1%
0.3%
1
0.0%
5.0%
10.0%
15.0%
20.0%
25.0%
30.0%
35.0%
Accidents between January 1 - December 31, 2015
Total Number of Claimants 66,380
22.8%
28.5%
22.0%
14.9%
8.6%
2.9%
0.4%
1
0.0%
5.0%
10.0%
15.0%
20.0%
25.0%
30.0%
35.0%
Accidents between January 1 - December 31, 2016
Total Number of Claimants 70,537
Percentage of Claimants by Region
Based on claim transactions between the Accident Date and December 31, 2020
2 www.ibc.ca www.ibc.ca 45
23.2%
28.3%
21.7%
14.9%
8.5%
3.0%
0.4%
1
0.0%
5.0%
10.0%
15.0%
20.0%
25.0%
30.0%
35.0%
Accidents between January 1 - December 31, 2017
Total Number of Claimants 72,306
22.8%
28.3%
22.1%
15.1%
8.5%
2.8%
0.3%
1
0.0%
5.0%
10.0%
15.0%
20.0%
25.0%
30.0%
35.0%
Accidents between January 1 - December 31, 2018
Total Number of Claimants 71,699
21.9%
28.0%
23.1%
15.0%
8.9%
2.9%
0.3%
1
0.0%
5.0%
10.0%
15.0%
20.0%
25.0%
30.0%
35.0%
Accidents between January 1 - December 31, 2019
Total Number of Claimants 71,120
22.0%
26.2%
23.4%
16.4%
9.1%
2.8%0.2%
1
0.0%
5.0%
10.0%
15.0%
20.0%
25.0%
30.0%
35.0%
Accidents between January 1 - December 31, 2020
Total Number of Claimants 28,919
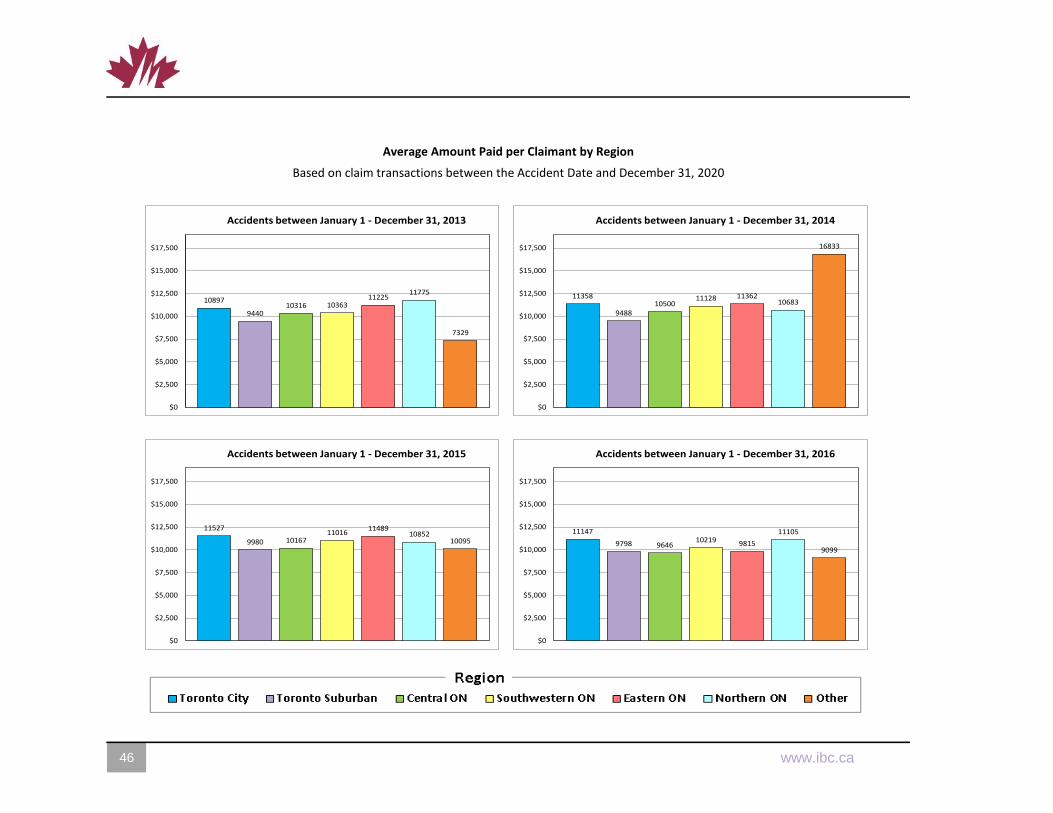
Average Amount Paid per Claimant by Region
Based on claim transactions between the Accident Date and December 31, 2020
46 46 www.ibc.ca 3
10897
944010316 10363
1122511775
7329
$0
$2,500
$5,000
$7,500
$10,000
$12,500
$15,000
$17,500
Accidents between January 1 - December 31, 2013
11358
948810500
11128 1136210683
16833
$0
$2,500
$5,000
$7,500
$10,000
$12,500
$15,000
$17,500
Accidents between January 1 - December 31, 2014
11527
9980 1016711016
1148910852
10095
$0
$2,500
$5,000
$7,500
$10,000
$12,500
$15,000
$17,500
Accidents between January 1 - December 31, 2015
11147
9798 964610219 9815
11105
9099
$0
$2,500
$5,000
$7,500
$10,000
$12,500
$15,000
$17,500
Accidents between January 1 - December 31, 2016
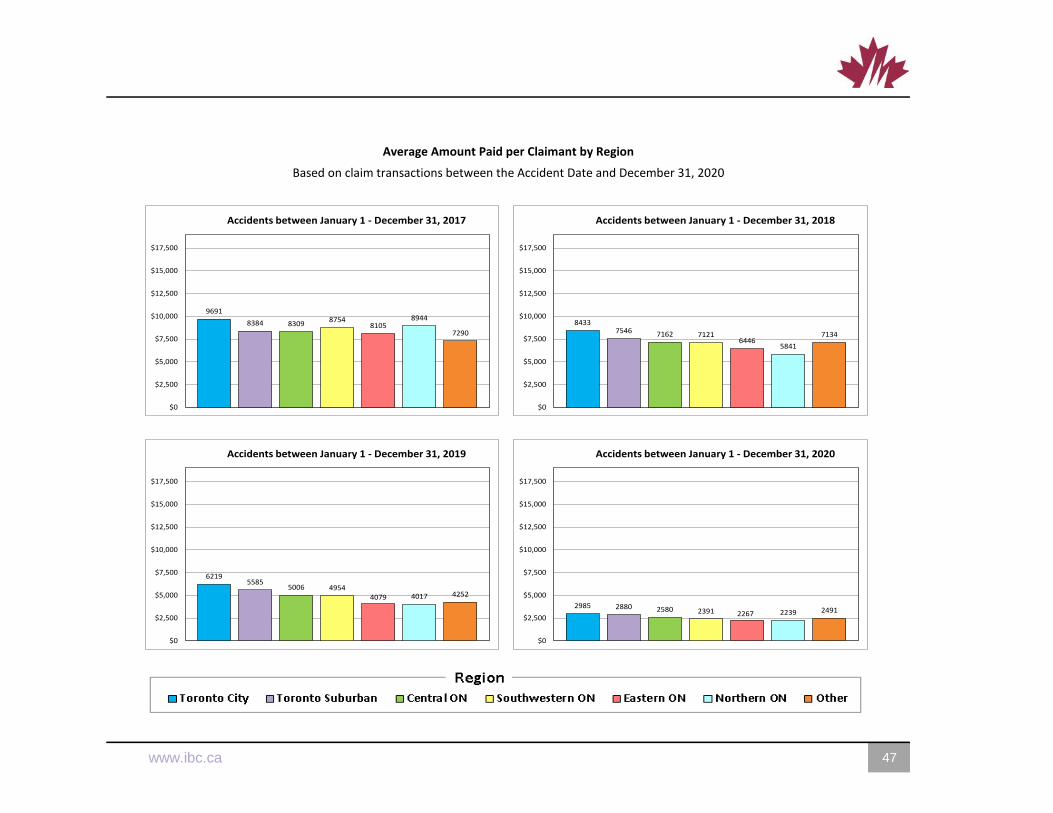
Average Amount Paid per Claimant by Region
Based on claim transactions between the Accident Date and December 31, 2020
2 www.ibc.ca www.ibc.ca 47
9691
8384 83098754
81058944
7290
$0
$2,500
$5,000
$7,500
$10,000
$12,500
$15,000
$17,500
Accidents between January 1 - December 31, 2017
84337546 7162 7121
64465841
7134
$0
$2,500
$5,000
$7,500
$10,000
$12,500
$15,000
$17,500
Accidents between January 1 - December 31, 2018
62195585
5006 49544079 4017 4252
$0
$2,500
$5,000
$7,500
$10,000
$12,500
$15,000
$17,500
Accidents between January 1 - December 31, 2019
2985 2880 2580 2391 2267 2239 2491
$0
$2,500
$5,000
$7,500
$10,000
$12,500
$15,000
$17,500
Accidents between January 1 - December 31, 2020
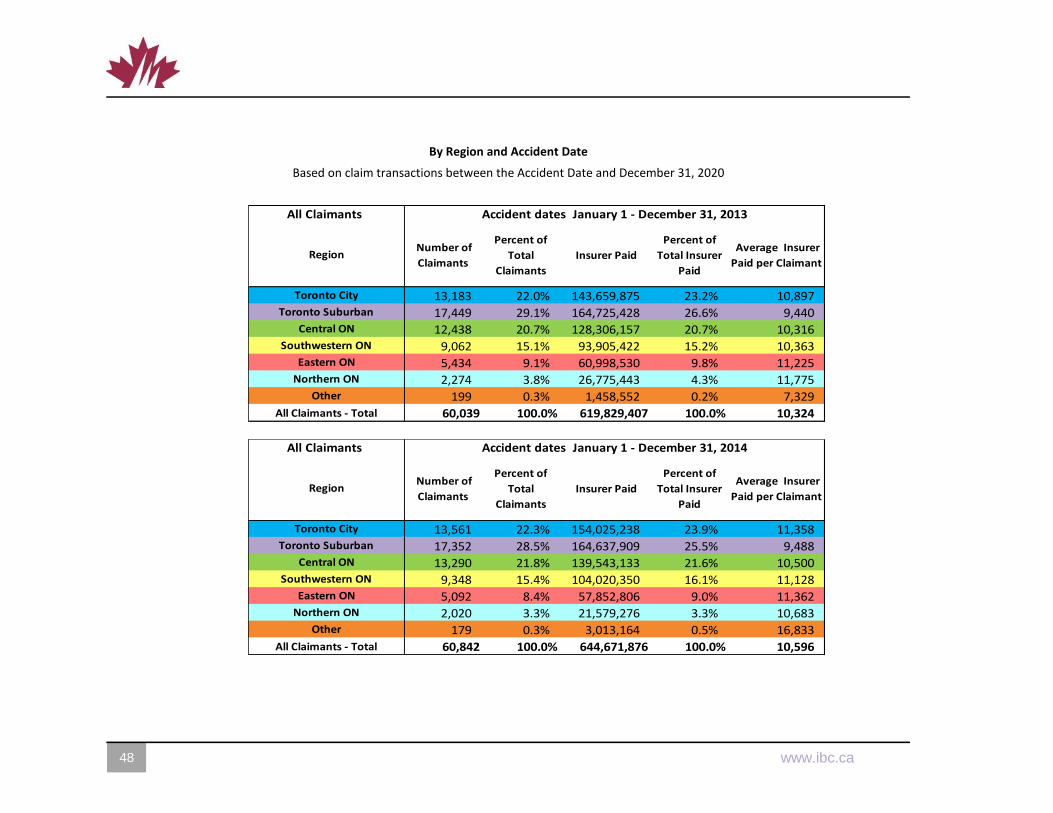
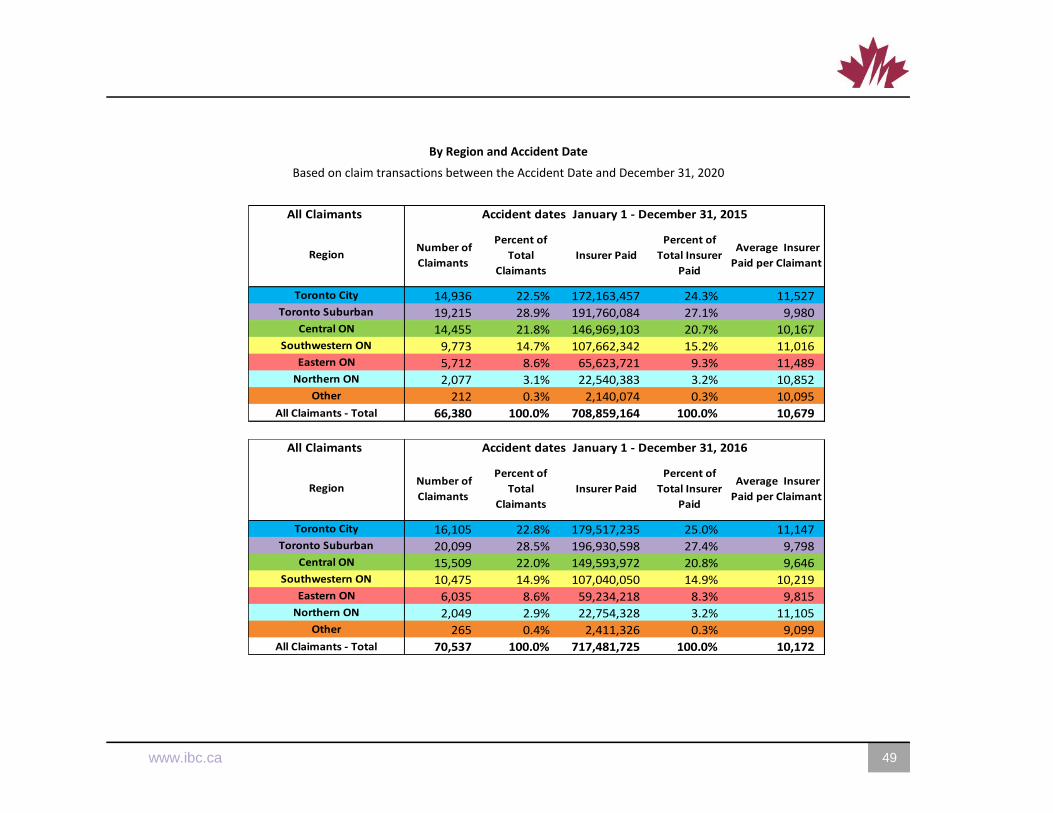
By Region and Accident Date
Based on claim transactions between the Accident Date and December 31, 2020
48 48 www.ibc.ca 3
Number of
Claimants
Percent of
Total
Claimants
Insurer Paid
Percent of
Total Insurer
Paid
Average Insurer
Paid per Claimant
13,183 22.0% 143,659,875 23.2% 10,897
17,449 29.1% 164,725,428 26.6% 9,440
12,438 20.7% 128,306,157 20.7% 10,316
9,062 15.1% 93,905,422 15.2% 10,363
5,434 9.1% 60,998,530 9.8% 11,225
2,274 3.8% 26,775,443 4.3% 11,775
199 0.3% 1,458,552 0.2% 7,329
60,039 100.0% 619,829,407 100.0% 10,324
Eastern ON
Northern ON
Other
All Claimants - Total
Region
Toronto City
Toronto Suburban
Central ON
Southwestern ON
All Claimants Accident dates January 1 - December 31, 2013
Number of
Claimants
Percent of
Total
Claimants
Insurer Paid
Percent of
Total Insurer
Paid
Average Insurer
Paid per Claimant
13,561 22.3% 154,025,238 23.9% 11,358
17,352 28.5% 164,637,909 25.5% 9,488
13,290 21.8% 139,543,133 21.6% 10,500
9,348 15.4% 104,020,350 16.1% 11,128
5,092 8.4% 57,852,806 9.0% 11,362
2,020 3.3% 21,579,276 3.3% 10,683
179 0.3% 3,013,164 0.5% 16,833
60,842 100.0% 644,671,876 100.0% 10,596All Claimants - Total
Southwestern ON
Eastern ON
Northern ON
Other
Toronto City
Toronto Suburban
Central ON
All Claimants Accident dates January 1 - December 31, 2014
Region
By Region and Accident Date
Based on claim transactions between the Accident Date and December 31, 2020
2 www.ibc.ca www.ibc.ca 49
Number of
Claimants
Percent of
Total
Claimants
Insurer Paid
Percent of
Total Insurer
Paid
Average Insurer
Paid per Claimant
14,936 22.5% 172,163,457 24.3% 11,527
19,215 28.9% 191,760,084 27.1% 9,980
14,455 21.8% 146,969,103 20.7% 10,167
9,773 14.7% 107,662,342 15.2% 11,016
5,712 8.6% 65,623,721 9.3% 11,489
2,077 3.1% 22,540,383 3.2% 10,852
212 0.3% 2,140,074 0.3% 10,095
66,380 100.0% 708,859,164 100.0% 10,679
All Claimants Accident dates January 1 - December 31, 2015
Region
Toronto City
Toronto Suburban
Central ON
Southwestern ON
Eastern ON
Northern ON
Other
All Claimants - Total
Number of
Claimants
Percent of
Total
Claimants
Insurer Paid
Percent of
Total Insurer
Paid
Average Insurer
Paid per Claimant
16,105 22.8% 179,517,235 25.0% 11,147
20,099 28.5% 196,930,598 27.4% 9,798
15,509 22.0% 149,593,972 20.8% 9,646
10,475 14.9% 107,040,050 14.9% 10,219
6,035 8.6% 59,234,218 8.3% 9,815
2,049 2.9% 22,754,328 3.2% 11,105
265 0.4% 2,411,326 0.3% 9,099
70,537 100.0% 717,481,725 100.0% 10,172All Claimants - Total
Accident dates January 1 - December 31, 2016
Region
Toronto City
Toronto Suburban
Central ON
Southwestern ON
Eastern ON
Northern ON
Other
All Claimants
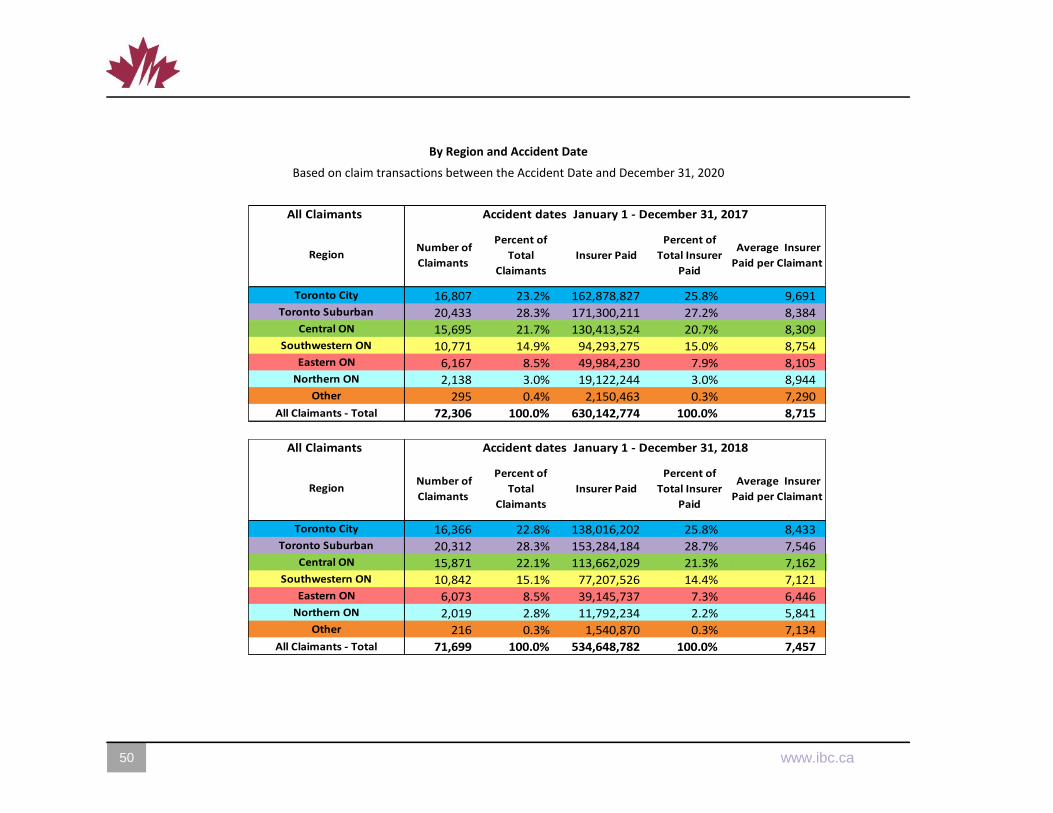
By Region and Accident Date
Based on claim transactions between the Accident Date and December 31, 2020
50 50 www.ibc.ca 3
Number of
Claimants
Percent of
Total
Claimants
Insurer Paid
Percent of
Total Insurer
Paid
Average Insurer
Paid per Claimant
16,807 23.2% 162,878,827 25.8% 9,691
20,433 28.3% 171,300,211 27.2% 8,384
15,695 21.7% 130,413,524 20.7% 8,309
10,771 14.9% 94,293,275 15.0% 8,754
6,167 8.5% 49,984,230 7.9% 8,105
2,138 3.0% 19,122,244 3.0% 8,944
295 0.4% 2,150,463 0.3% 7,290
72,306 100.0% 630,142,774 100.0% 8,715
Southwestern ON
Eastern ON
Northern ON
Other
All Claimants - Total
All Claimants
Region
Toronto City
Toronto Suburban
Central ON
Accident dates January 1 - December 31, 2017
Number of
Claimants
Percent of
Total
Claimants
Insurer Paid
Percent of
Total Insurer
Paid
Average Insurer
Paid per Claimant
16,366 22.8% 138,016,202 25.8% 8,433
20,312 28.3% 153,284,184 28.7% 7,546
15,871 22.1% 113,662,029 21.3% 7,162
10,842 15.1% 77,207,526 14.4% 7,121
6,073 8.5% 39,145,737 7.3% 6,446
2,019 2.8% 11,792,234 2.2% 5,841
216 0.3% 1,540,870 0.3% 7,134
71,699 100.0% 534,648,782 100.0% 7,457All Claimants - Total
Central ON
Southwestern ON
Eastern ON
Northern ON
Other
Toronto City
Toronto Suburban
All Claimants Accident dates January 1 - December 31, 2018
Region
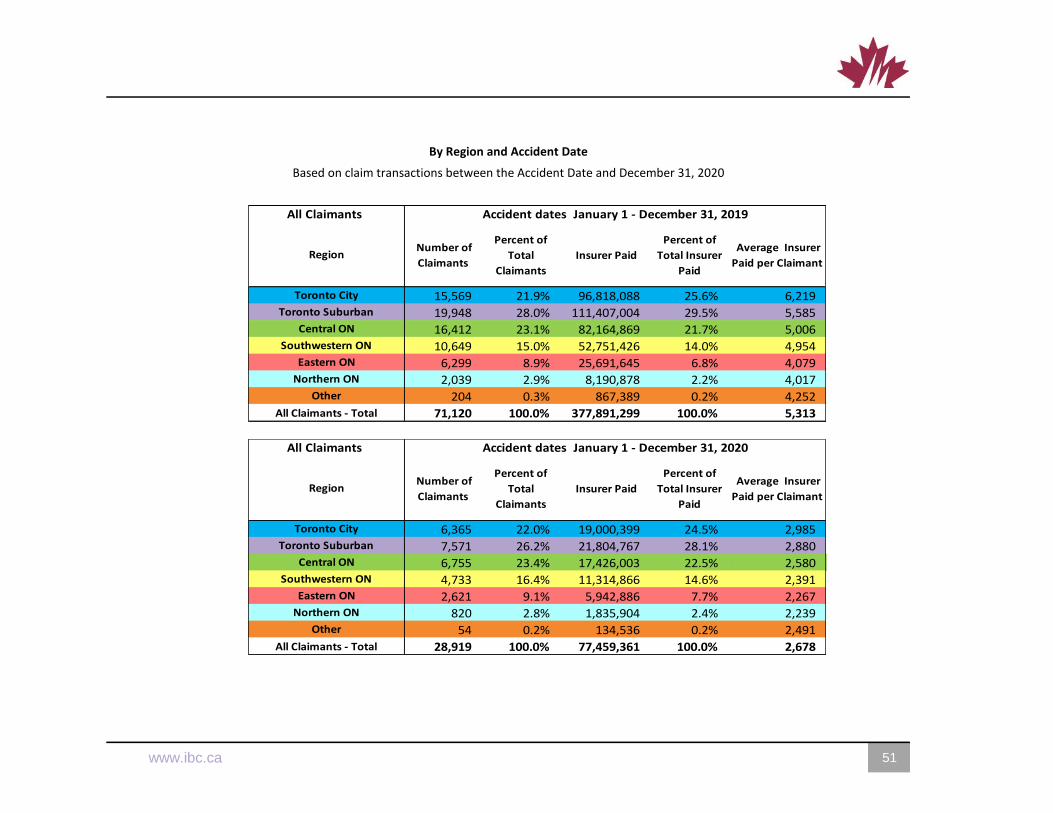
By Region and Accident Date
Based on claim transactions between the Accident Date and December 31, 2020
2 www.ibc.ca www.ibc.ca 51
Number of
Claimants
Percent of
Total
Claimants
Insurer Paid
Percent of
Total Insurer
Paid
Average Insurer
Paid per Claimant
15,569 21.9% 96,818,088 25.6% 6,219
19,948 28.0% 111,407,004 29.5% 5,585
16,412 23.1% 82,164,869 21.7% 5,006
10,649 15.0% 52,751,426 14.0% 4,954
6,299 8.9% 25,691,645 6.8% 4,079
2,039 2.9% 8,190,878 2.2% 4,017
204 0.3% 867,389 0.2% 4,252
71,120 100.0% 377,891,299 100.0% 5,313
Accident dates January 1 - December 31, 2019
Toronto City
Toronto Suburban
Central ON
Other
All Claimants - Total
Southwestern ON
Eastern ON
Northern ON
Region
All Claimants
Number of
Claimants
Percent of
Total
Claimants
Insurer Paid
Percent of
Total Insurer
Paid
Average Insurer
Paid per Claimant
6,365 22.0% 19,000,399 24.5% 2,985
7,571 26.2% 21,804,767 28.1% 2,880
6,755 23.4% 17,426,003 22.5% 2,580
4,733 16.4% 11,314,866 14.6% 2,391
2,621 9.1% 5,942,886 7.7% 2,267
820 2.8% 1,835,904 2.4% 2,239
54 0.2% 134,536 0.2% 2,491
28,919 100.0% 77,459,361 100.0% 2,678
Toronto City
Toronto Suburban
Central ON
All Claimants
Other
All Claimants - Total
Southwestern ON
Eastern ON
Northern ON
Region
Accident dates January 1 - December 31, 2020
HCDB Exhibit Three
Claimants by Medical and Rehabilitation Expense Class
Percentage of Claimants by Medical and Rehabilitation Expense Class
Based on claim transactions between the Accident Date and December 31, 2020
52 52 www.ibc.ca 3
97.4%
42.5% 41.5%
17.6% 20.1%16.0%
6.2%
1
0.0%
20.0%
40.0%
60.0%
80.0%
100.0%
120.0%
Accidents between January 1 - December 31, 2013
23.6%18.1%
55.7%
0.0%
20.0%
40.0%
60.0%Treatment Types
Total Number of Claimants 60,039
97.7%
42.5% 41.1%
18.7% 20.0%16.4%
6.3%
0.0%
20.0%
40.0%
60.0%
80.0%
100.0%
120.0%
Accidents between January 1 - December 31, 2014
22.4%17.7%
57.6%
0.0%
20.0%
40.0%
60.0%
80.0%Treatment Types
Total Number of Claimants 60,842
97.9%
42.6% 40.6%
21.1% 20.0%16.8%
6.3%
0.0%
20.0%
40.0%
60.0%
80.0%
100.0%
120.0%
Accidents between January 1 - December 31, 2015
Total Number of Claimants 66,380
21.7%18.0%
58.2%
0.0%
20.0%
40.0%
60.0%
80.0%Treatment Type
98.1%
41.3% 41.2%
22.0%19.1%
0.3%6.1%
12.2%6.0%
0.0%
20.0%
40.0%
60.0%
80.0%
100.0%
120.0%
Accidents between January 1 - December 31, 2016
Total Number of Claimants 70,537
21.8%17.8%
58.4%
0.0%
20.0%
40.0%
60.0%
80.0%Treatment Types
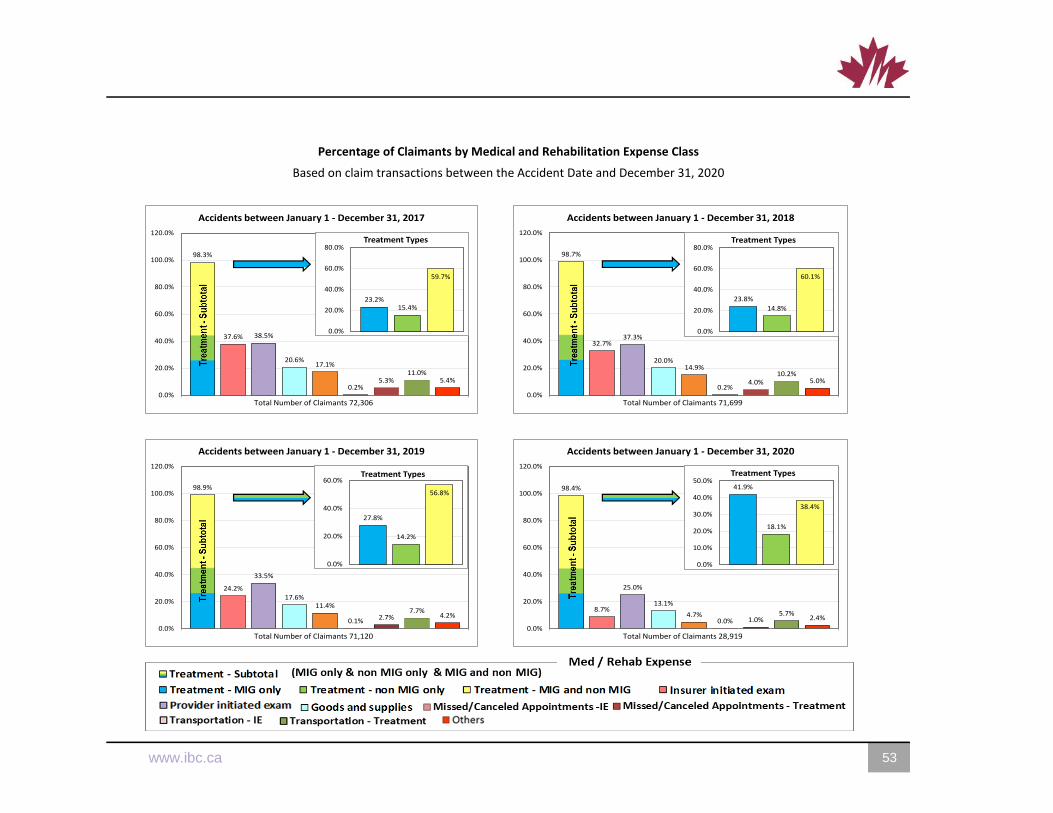
Percentage of Claimants by Medical and Rehabilitation Expense Class
Based on claim transactions between the Accident Date and December 31, 2020
2 www.ibc.ca www.ibc.ca 53
98.3%
37.6% 38.5%
20.6%17.1%
0.2%5.3%
11.0%5.4%
0.0%
20.0%
40.0%
60.0%
80.0%
100.0%
120.0%
Accidents between January 1 - December 31, 2017
Total Number of Claimants 72,306
23.2%15.4%
59.7%
0.0%
20.0%
40.0%
60.0%
80.0%Treatment Types
98.7%
32.7%37.3%
20.0%14.9%
0.2%4.0%
10.2%5.0%
0.0%
20.0%
40.0%
60.0%
80.0%
100.0%
120.0%
Accidents between January 1 - December 31, 2018
Total Number of Claimants 71,699
23.8%
14.8%
60.1%
0.0%
20.0%
40.0%
60.0%
80.0%Treatment Types
98.9%
24.2%
33.5%
17.6%11.4%
0.1% 2.7%7.7%
4.2%
0.0%
20.0%
40.0%
60.0%
80.0%
100.0%
120.0%
Accidents between January 1 - December 31, 2019
Total Number of Claimants 71,120
27.8%
14.2%
56.8%
0.0%
20.0%
40.0%
60.0%Treatment Types
98.4%
8.7%
25.0%
13.1%
4.7%0.0% 1.0%
5.7%2.4%
0.0%
20.0%
40.0%
60.0%
80.0%
100.0%
120.0%
Accidents between January 1 - December 31, 2020
Total Number of Claimants 28,919
41.9%
18.1%
38.4%
0.0%
10.0%
20.0%
30.0%
40.0%
50.0%Treatment Types
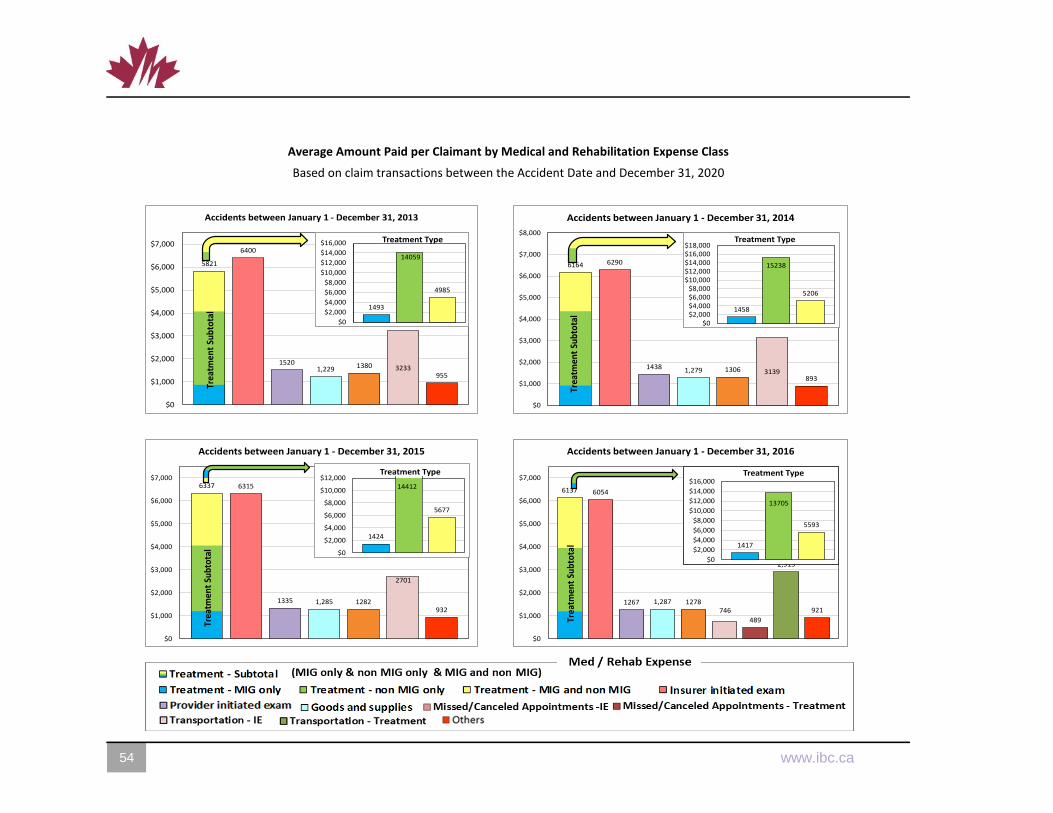
Average Amount Paid per Claimant by Medical and Rehabilitation Expense Class
Based on claim transactions between the Accident Date and December 31, 2020
54 54 www.ibc.ca 3
5821
6400
15201,229 1380 3233
955
$0
$1,000
$2,000
$3,000
$4,000
$5,000
$6,000
$7,000
Accidents between January 1 - December 31, 2013Tr
eatm
ent
Sub
tota
l 1493
14059
4985
$0
$2,000
$4,000
$6,000
$8,000
$10,000
$12,000
$14,000
$16,000 Treatment Type
6164 6290
1438 1,279 1306 3139893
$0
$1,000
$2,000
$3,000
$4,000
$5,000
$6,000
$7,000
$8,000
Accidents between January 1 - December 31, 2014
Trea
tmen
t Su
bto
tal
1458
15238
5206
$0$2,000$4,000$6,000$8,000
$10,000$12,000$14,000$16,000$18,000
Treatment Type
6337 6315
1335 1,285 1282
2701
932
$0
$1,000
$2,000
$3,000
$4,000
$5,000
$6,000
$7,000
Accidents between January 1 - December 31, 2015
Trea
tmen
t Su
bto
tal
1424
14412
5677
$0
$2,000
$4,000
$6,000
$8,000
$10,000
$12,000Treatment Type
6137 6054
1267 1,287 1278746
489
2,915
921
$0
$1,000
$2,000
$3,000
$4,000
$5,000
$6,000
$7,000
Accidents between January 1 - December 31, 2016
Trea
tmen
t Su
bto
tal 1417
13705
5593
$0
$2,000
$4,000
$6,000
$8,000
$10,000
$12,000
$14,000
$16,000Treatment Type
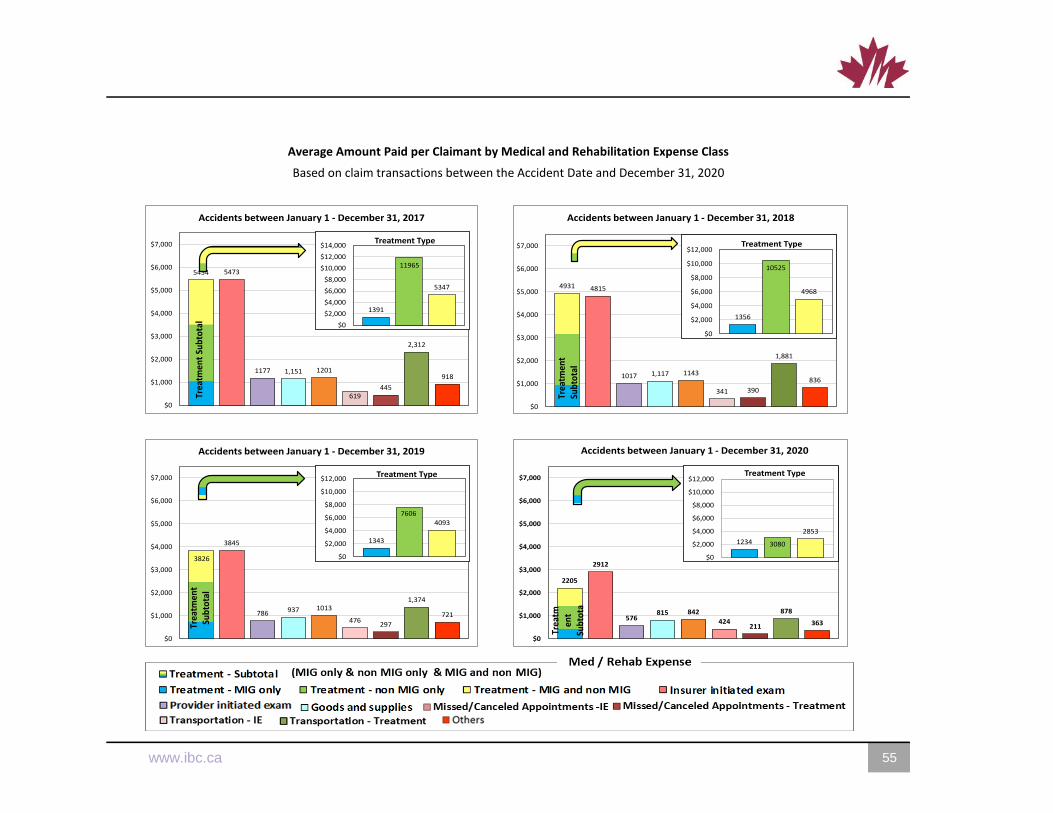
Average Amount Paid per Claimant by Medical and Rehabilitation Expense Class
Based on claim transactions between the Accident Date and December 31, 2020
2 www.ibc.ca www.ibc.ca 55
5454 5473
1177 1,151 1201
619445
2,312
918
$0
$1,000
$2,000
$3,000
$4,000
$5,000
$6,000
$7,000
Accidents between January 1 - December 31, 2017
Trea
tmen
t Su
bto
tal
1391
11965
5347
$0
$2,000
$4,000
$6,000
$8,000
$10,000
$12,000
$14,000Treatment Type
4931 4815
1017 1,117 1143
341 390
1,881
836
$0
$1,000
$2,000
$3,000
$4,000
$5,000
$6,000
$7,000
Accidents between January 1 - December 31, 2018
Trea
tmen
t Su
bto
tal
1356
10525
4968
$0
$2,000
$4,000
$6,000
$8,000
$10,000
$12,000Treatment Type
3826
3845
786 937 1013
476297
1,374
721
$0
$1,000
$2,000
$3,000
$4,000
$5,000
$6,000
$7,000
Accidents between January 1 - December 31, 2019
Trea
tmen
t Su
bto
tal
1343
7606
4093
$0
$2,000
$4,000
$6,000
$8,000
$10,000
$12,000Treatment Type
2205
2912
576815 842
424211
878
363
$0
$1,000
$2,000
$3,000
$4,000
$5,000
$6,000
$7,000
Accidents between January 1 - December 31, 2020
Trea
tmen
t Su
bto
ta
1234 3080
2853
$0
$2,000
$4,000
$6,000
$8,000
$10,000
$12,000Treatment Type
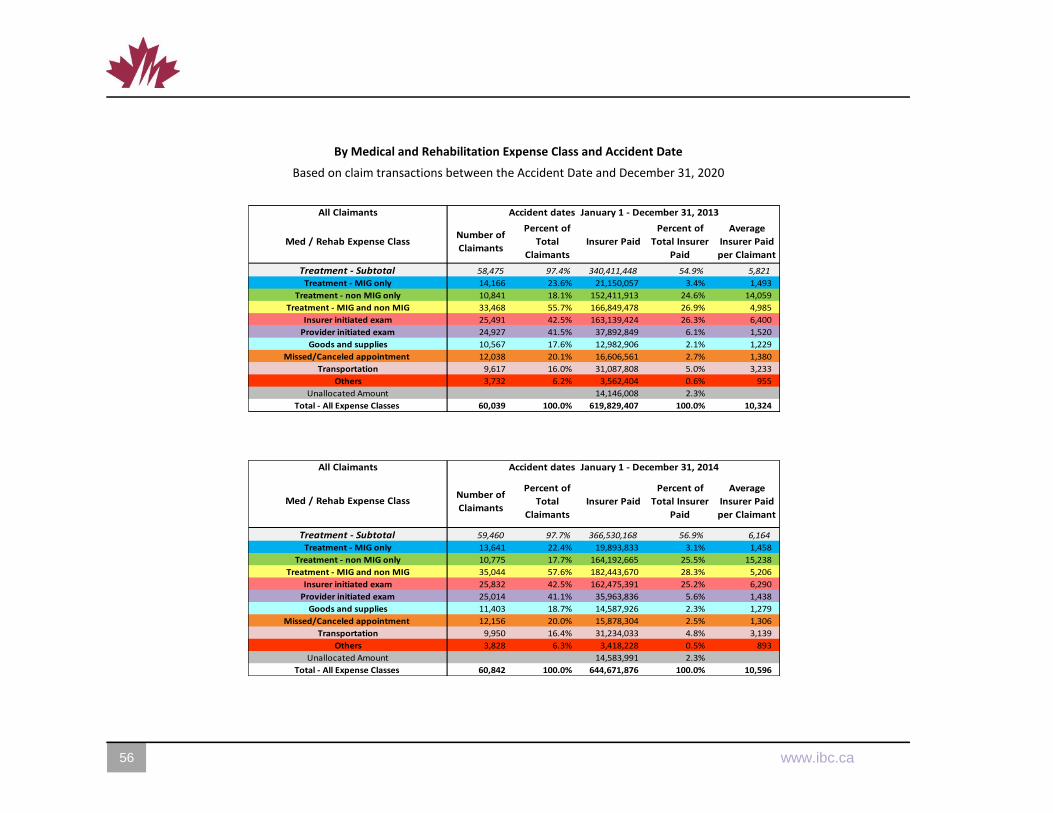
By Medical and Rehabilitation Expense Class and Accident Date
Based on claim transactions between the Accident Date and December 31, 2020
56 56 www.ibc.ca 3
Number of
Claimants
Percent of
Total
Claimants
Insurer Paid
Percent of
Total Insurer
Paid
Average
Insurer Paid
per Claimant
58,475 97.4% 340,411,448 54.9% 5,821
14,166 23.6% 21,150,057 3.4% 1,493
10,841 18.1% 152,411,913 24.6% 14,059
33,468 55.7% 166,849,478 26.9% 4,985
25,491 42.5% 163,139,424 26.3% 6,400
24,927 41.5% 37,892,849 6.1% 1,520
10,567 17.6% 12,982,906 2.1% 1,229
12,038 20.1% 16,606,561 2.7% 1,380
9,617 16.0% 31,087,808 5.0% 3,233
3,732 6.2% 3,562,404 0.6% 955
14,146,008 2.3%
60,039 100.0% 619,829,407 100.0% 10,324
Treatment - MIG only
Treatment - non MIG only
Others
Unallocated Amount
Total - All Expense Classes
Transportation
All Claimants Accident dates January 1 - December 31, 2013
Med / Rehab Expense Class
Treatment - Subtotal
Treatment - MIG and non MIG
Insurer initiated exam
Provider initiated exam
Goods and supplies
Missed/Canceled appointment
Number of
Claimants
Percent of
Total
Claimants
Insurer Paid
Percent of
Total Insurer
Paid
Average
Insurer Paid
per Claimant
59,460 97.7% 366,530,168 56.9% 6,164
13,641 22.4% 19,893,833 3.1% 1,458
10,775 17.7% 164,192,665 25.5% 15,238
35,044 57.6% 182,443,670 28.3% 5,206
25,832 42.5% 162,475,391 25.2% 6,290
25,014 41.1% 35,963,836 5.6% 1,438
11,403 18.7% 14,587,926 2.3% 1,279
12,156 20.0% 15,878,304 2.5% 1,306
9,950 16.4% 31,234,033 4.8% 3,139
3,828 6.3% 3,418,228 0.5% 893
14,583,991 2.3%
60,842 100.0% 644,671,876 100.0% 10,596
Accident dates January 1 - December 31, 2014
Med / Rehab Expense Class
Treatment - non MIG only
Treatment - MIG and non MIG
Insurer initiated exam
Provider initiated exam
Treatment - Subtotal
All Claimants
Treatment - MIG only
Unallocated Amount
Total - All Expense Classes
Transportation
Others
Goods and supplies
Missed/Canceled appointment
By Medical and Rehabilitation Expense Class and Accident Date
Based on claim transactions between the Accident Date and December 31, 2020
2 www.ibc.ca www.ibc.ca 57
Number of
Claimants
Percent of
Total
Claimants
Insurer Paid
Percent of
Total Insurer
Paid
Average
Insurer Paid
per Claimant
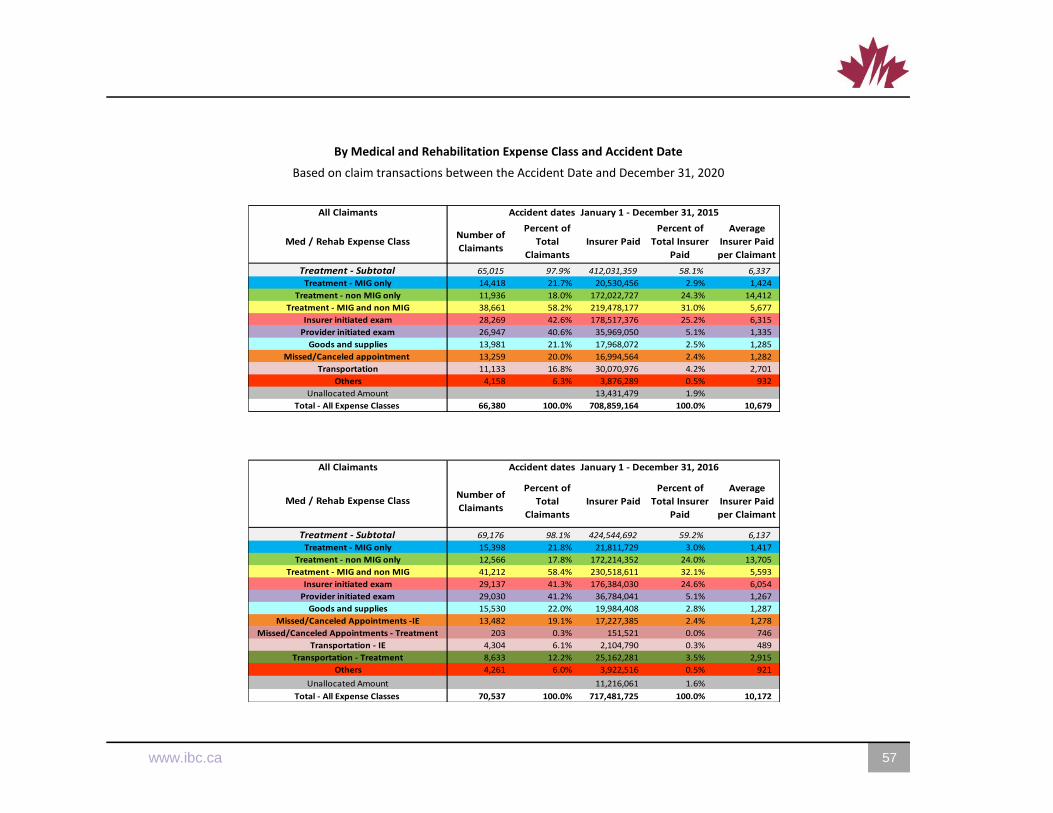
65,015 97.9% 412,031,359 58.1% 6,337
14,418 21.7% 20,530,456 2.9% 1,424
11,936 18.0% 172,022,727 24.3% 14,412
38,661 58.2% 219,478,177 31.0% 5,677
28,269 42.6% 178,517,376 25.2% 6,315
26,947 40.6% 35,969,050 5.1% 1,335
13,981 21.1% 17,968,072 2.5% 1,285
13,259 20.0% 16,994,564 2.4% 1,282
11,133 16.8% 30,070,976 4.2% 2,701
4,158 6.3% 3,876,289 0.5% 932
13,431,479 1.9%
66,380 100.0% 708,859,164 100.0% 10,679
Goods and supplies
Transportation
Others
Unallocated Amount
Total - All Expense Classes
All Claimants Accident dates January 1 - December 31, 2015
Med / Rehab Expense Class
Treatment - SubtotalTreatment - MIG only
Treatment - non MIG only
Treatment - MIG and non MIG
Insurer initiated exam
Provider initiated exam
Missed/Canceled appointment
Number of
Claimants
Percent of
Total
Claimants
Insurer Paid
Percent of
Total Insurer
Paid
Average
Insurer Paid
per Claimant
69,176 98.1% 424,544,692 59.2% 6,137
15,398 21.8% 21,811,729 3.0% 1,417
12,566 17.8% 172,214,352 24.0% 13,705
41,212 58.4% 230,518,611 32.1% 5,593
29,137 41.3% 176,384,030 24.6% 6,054
29,030 41.2% 36,784,041 5.1% 1,267
15,530 22.0% 19,984,408 2.8% 1,287
13,482 19.1% 17,227,385 2.4% 1,278
203 0.3% 151,521 0.0% 746
4,304 6.1% 2,104,790 0.3% 489
8,633 12.2% 25,162,281 3.5% 2,915
4,261 6.0% 3,922,516 0.5% 921
11,216,061 1.6%
70,537 100.0% 717,481,725 100.0% 10,172
Transportation - IE
Transportation - Treatment
Total - All Expense Classes
Goods and supplies
Missed/Canceled Appointments -IE
Missed/Canceled Appointments - Treatment
Others
Provider initiated exam
Accident dates January 1 - December 31, 2016
Med / Rehab Expense Class
Treatment - SubtotalTreatment - MIG only
All Claimants
Treatment - non MIG only
Treatment - MIG and non MIG
Insurer initiated exam
Unallocated Amount
By Medical and Rehabilitation Expense Class and Accident Date
Based on claim transactions between the Accident Date and December 31, 2020
58 58 www.ibc.ca 3
Number of
Claimants
Percent of
Total
Claimants
Insurer Paid
Percent of
Total Insurer
Paid
Average
Insurer Paid
per Claimant
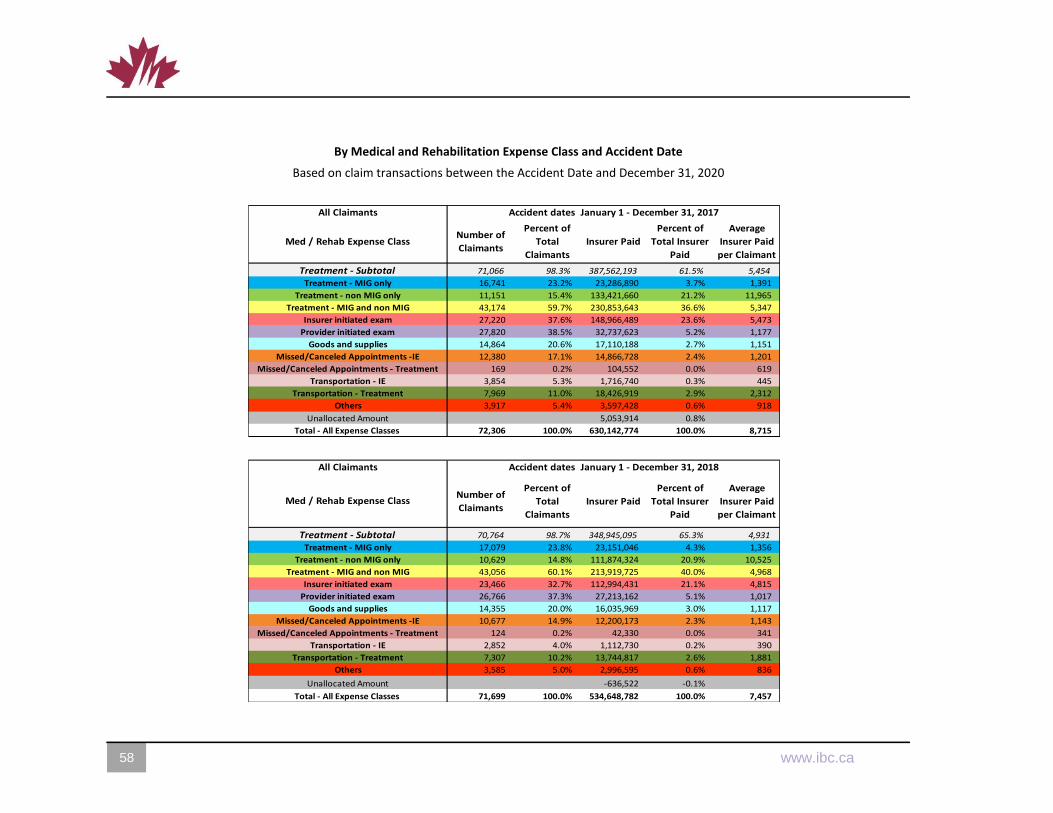
71,066 98.3% 387,562,193 61.5% 5,454
16,741 23.2% 23,286,890 3.7% 1,391
11,151 15.4% 133,421,660 21.2% 11,965
43,174 59.7% 230,853,643 36.6% 5,347
27,220 37.6% 148,966,489 23.6% 5,473
27,820 38.5% 32,737,623 5.2% 1,177
14,864 20.6% 17,110,188 2.7% 1,151
12,380 17.1% 14,866,728 2.4% 1,201
169 0.2% 104,552 0.0% 619
3,854 5.3% 1,716,740 0.3% 445
7,969 11.0% 18,426,919 2.9% 2,312
3,917 5.4% 3,597,428 0.6% 918
5,053,914 0.8%
72,306 100.0% 630,142,774 100.0% 8,715
Transportation - IE
Transportation - Treatment
Total - All Expense Classes
Others
Unallocated Amount
Goods and supplies
Missed/Canceled Appointments -IE
Missed/Canceled Appointments - Treatment
All Claimants Accident dates January 1 - December 31, 2017
Med / Rehab Expense Class
Treatment - SubtotalTreatment - MIG only
Treatment - non MIG only
Treatment - MIG and non MIG
Insurer initiated exam
Provider initiated exam
Number of
Claimants
Percent of
Total
Claimants
Insurer Paid
Percent of
Total Insurer
Paid
Average
Insurer Paid
per Claimant
70,764 98.7% 348,945,095 65.3% 4,931
17,079 23.8% 23,151,046 4.3% 1,356
10,629 14.8% 111,874,324 20.9% 10,525
43,056 60.1% 213,919,725 40.0% 4,968
23,466 32.7% 112,994,431 21.1% 4,815
26,766 37.3% 27,213,162 5.1% 1,017
14,355 20.0% 16,035,969 3.0% 1,117
10,677 14.9% 12,200,173 2.3% 1,143
124 0.2% 42,330 0.0% 341
2,852 4.0% 1,112,730 0.2% 390
7,307 10.2% 13,744,817 2.6% 1,881
3,585 5.0% 2,996,595 0.6% 836
-636,522 -0.1%
71,699 100.0% 534,648,782 100.0% 7,457Total - All Expense Classes
Transportation - IE
Transportation - Treatment
All Claimants Accident dates January 1 - December 31, 2018
Med / Rehab Expense Class
Unallocated Amount
Missed/Canceled Appointments -IE
Missed/Canceled Appointments - Treatment
Others
Treatment - SubtotalTreatment - MIG only
Treatment - non MIG only
Treatment - MIG and non MIG
Insurer initiated exam
Provider initiated exam
Goods and supplies
By Medical and Rehabilitation Expense Class and Accident Date
Based on claim transactions between the Accident Date and December 31, 2020
2 www.ibc.ca www.ibc.ca 59
Number of
Claimants
Percent of
Total
Claimants
Insurer Paid
Percent of
Total Insurer
Paid
Average
Insurer Paid
per Claimant
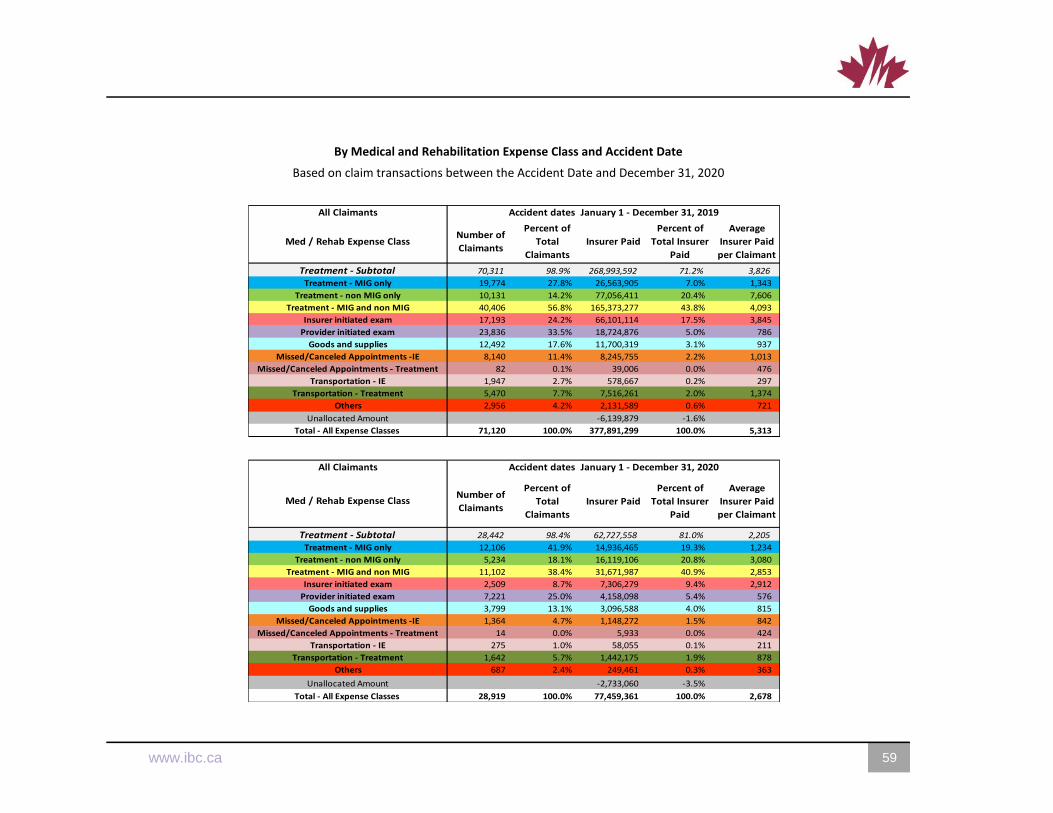
70,311 98.9% 268,993,592 71.2% 3,826
19,774 27.8% 26,563,905 7.0% 1,343
10,131 14.2% 77,056,411 20.4% 7,606
40,406 56.8% 165,373,277 43.8% 4,093
17,193 24.2% 66,101,114 17.5% 3,845
23,836 33.5% 18,724,876 5.0% 786
12,492 17.6% 11,700,319 3.1% 937
8,140 11.4% 8,245,755 2.2% 1,013
82 0.1% 39,006 0.0% 476
1,947 2.7% 578,667 0.2% 297
5,470 7.7% 7,516,261 2.0% 1,374
2,956 4.2% 2,131,589 0.6% 721
-6,139,879 -1.6%
71,120 100.0% 377,891,299 100.0% 5,313
Missed/Canceled Appointments - Treatment
Transportation - Treatment
Unallocated Amount
Others
Goods and supplies
Missed/Canceled Appointments -IE
Transportation - IE
Treatment - SubtotalTreatment - MIG only
Treatment - non MIG only
All Claimants Accident dates January 1 - December 31, 2019
Total - All Expense Classes
Med / Rehab Expense Class
Treatment - MIG and non MIG
Insurer initiated exam
Provider initiated exam
Number of
Claimants
Percent of
Total
Claimants
Insurer Paid
Percent of
Total Insurer
Paid
Average
Insurer Paid
per Claimant
28,442 98.4% 62,727,558 81.0% 2,205
12,106 41.9% 14,936,465 19.3% 1,234
5,234 18.1% 16,119,106 20.8% 3,080
11,102 38.4% 31,671,987 40.9% 2,853
2,509 8.7% 7,306,279 9.4% 2,912
7,221 25.0% 4,158,098 5.4% 576
3,799 13.1% 3,096,588 4.0% 815
1,364 4.7% 1,148,272 1.5% 842
14 0.0% 5,933 0.0% 424
275 1.0% 58,055 0.1% 211
1,642 5.7% 1,442,175 1.9% 878
687 2.4% 249,461 0.3% 363
-2,733,060 -3.5%
28,919 100.0% 77,459,361 100.0% 2,678Total - All Expense Classes
Med / Rehab Expense Class
Accident dates January 1 - December 31, 2020All Claimants
Missed/Canceled Appointments - Treatment
Transportation - IE
Insurer initiated exam
Provider initiated exam
Goods and supplies
Treatment - MIG only
Treatment - non MIG only
Treatment - MIG and non MIG
Treatment - Subtotal
Missed/Canceled Appointments -IE
Transportation - Treatment
Others
Unallocated Amount
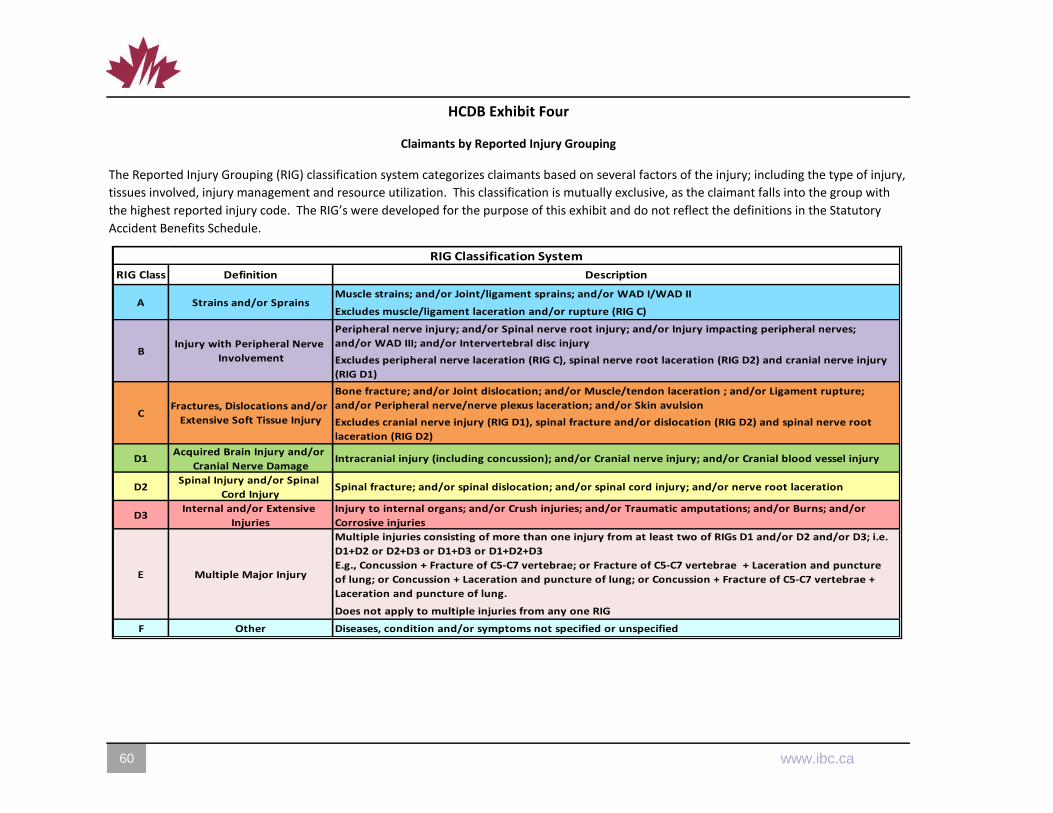
HCDB Exhibit Four
Claimants by Reported Injury Grouping
60 60 www.ibc.ca 3
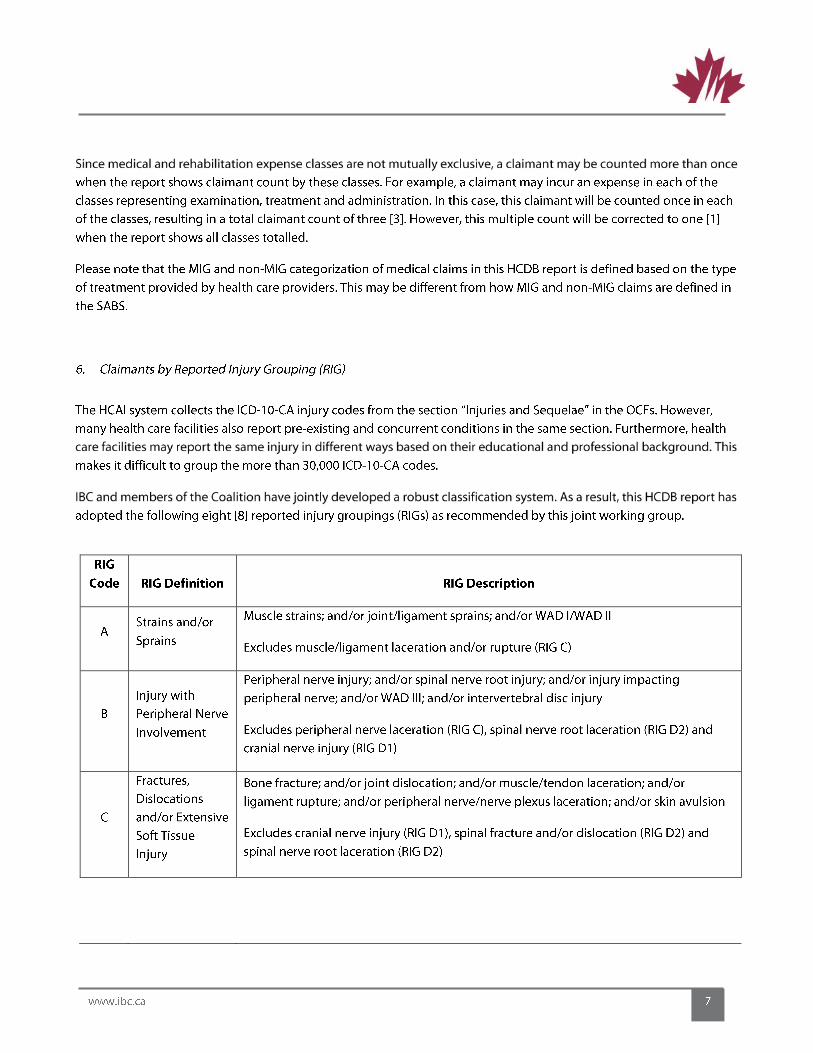
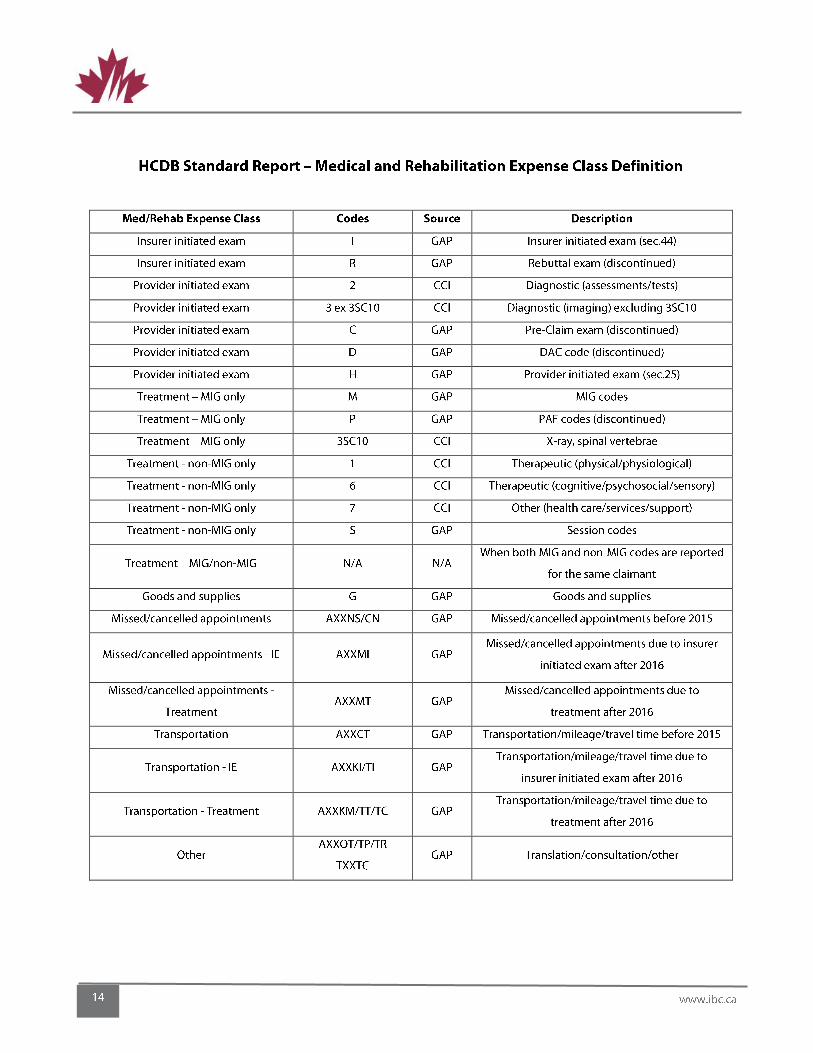
The Reported Injury Grouping (RIG) classification system categorizes claimants based on several factors of the injury; including the type of injury,
tissues involved, injury management and resource utilization. This classification is mutually exclusive, as the claimant falls into the group with
the highest reported injury code. The RIG’s were developed for the purpose of this exhibit and do not reflect the definitions in the Statutory
Accident Benefits Schedule.
RIG Class Definition Description
Muscle strains; and/or Joint/ligament sprains; and/or WAD I/WAD II
Excludes muscle/ligament laceration and/or rupture (RIG C)
Peripheral nerve injury; and/or Spinal nerve root injury; and/or Injury impacting peripheral nerves;
and/or WAD III; and/or Intervertebral disc injury
Excludes peripheral nerve laceration (RIG C), spinal nerve root laceration (RIG D2) and cranial nerve injury
(RIG D1)
Bone fracture; and/or Joint dislocation; and/or Muscle/tendon laceration ; and/or Ligament rupture;
and/or Peripheral nerve/nerve plexus laceration; and/or Skin avulsion
Excludes cranial nerve injury (RIG D1), spinal fracture and/or dislocation (RIG D2) and spinal nerve root
laceration (RIG D2)
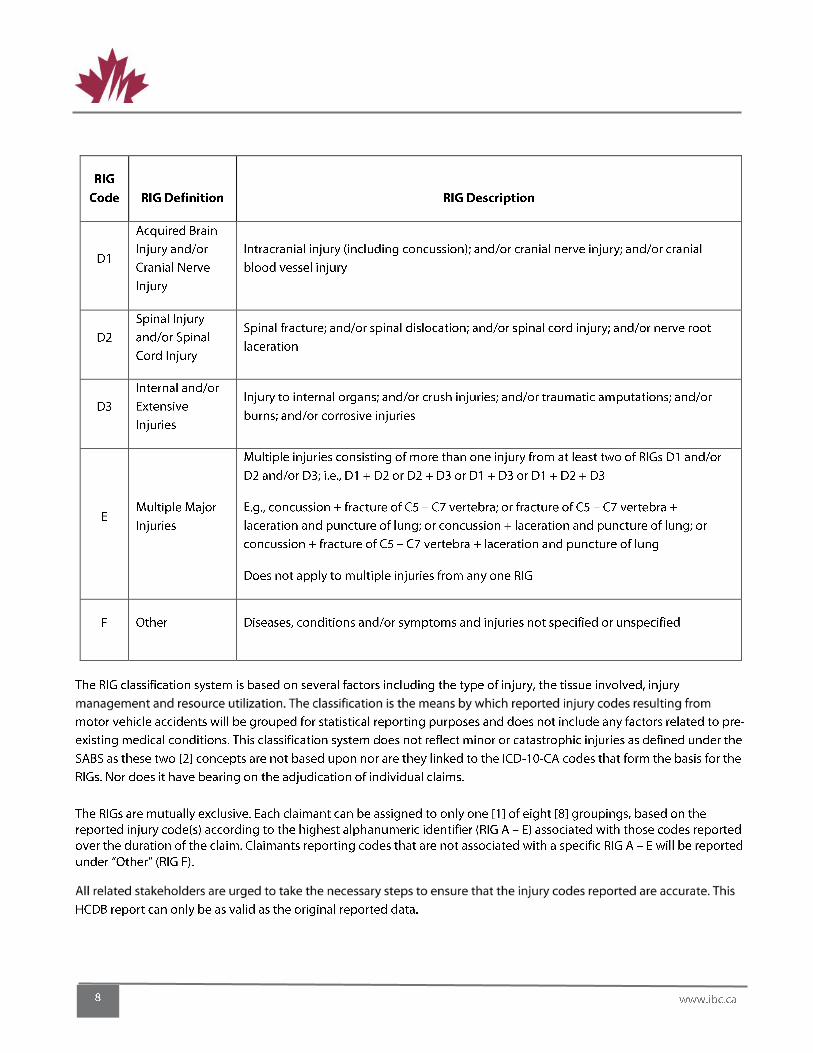
D1Acquired Brain Injury and/or
Cranial Nerve Damage Intracranial injury (including concussion); and/or Cranial nerve injury; and/or Cranial blood vessel injury
D2Spinal Injury and/or Spinal
Cord Injury Spinal fracture; and/or spinal dislocation; and/or spinal cord injury; and/or nerve root laceration
D3Internal and/or Extensive
Injuries
Injury to internal organs; and/or Crush injuries; and/or Traumatic amputations; and/or Burns; and/or
Corrosive injuries
Multiple injuries consisting of more than one injury from at least two of RIGs D1 and/or D2 and/or D3; i.e.
D1+D2 or D2+D3 or D1+D3 or D1+D2+D3
E.g., Concussion + Fracture of C5-C7 vertebrae; or Fracture of C5-C7 vertebrae + Laceration and puncture
of lung; or Concussion + Laceration and puncture of lung; or Concussion + Fracture of C5-C7 vertebrae +
Laceration and puncture of lung.
Does not apply to multiple injuries from any one RIG
F Other Diseases, condition and/or symptoms not specified or unspecified
Fractures, Dislocations and/or
Extensive Soft Tissue InjuryC
E Multiple Major Injury
RIG Classification System
Injury with Peripheral Nerve
Involvement
Strains and/or SprainsA
B
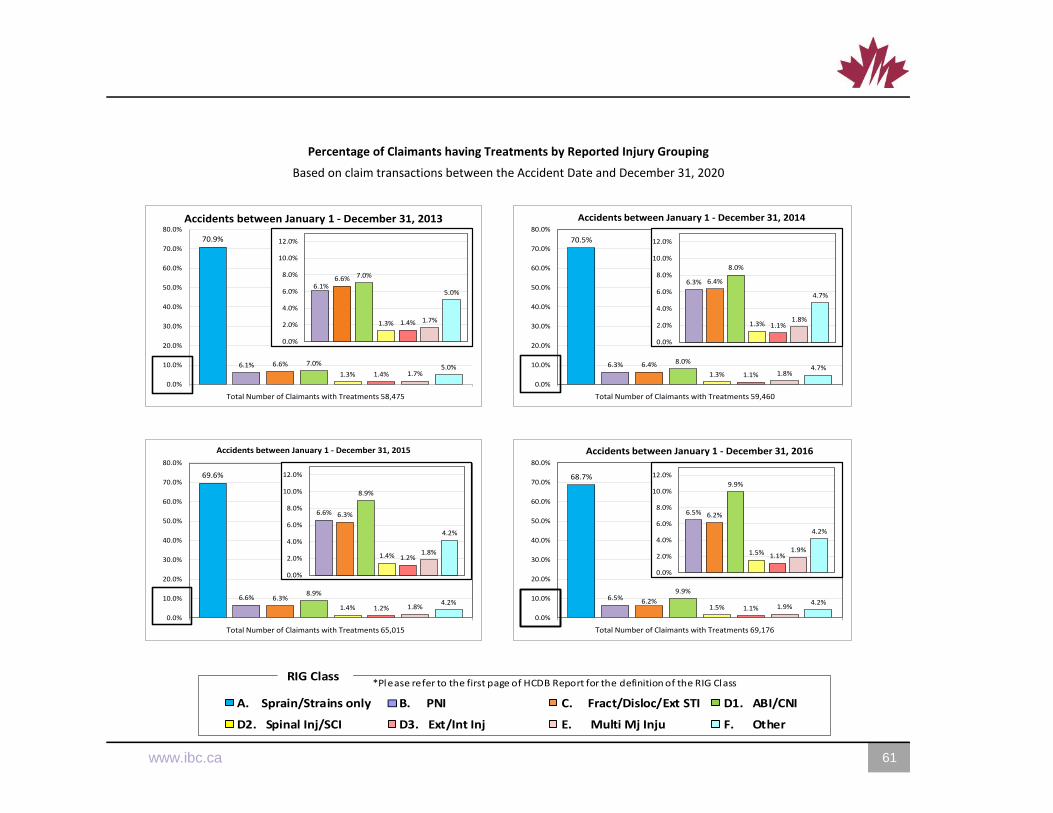
Percentage of Claimants having Treatments by Reported Injury Grouping
Based on claim transactions between the Accident Date and December 31, 2020
2 www.ibc.ca www.ibc.ca 61
70.9%
6.1% 6.6% 7.0%
1.3% 1.4% 1.7%5.0%
0.0%
10.0%
20.0%
30.0%
40.0%
50.0%
60.0%
70.0%
80.0%
Accidents between January 1 - December 31, 2013
Total Number of Claimants with Treatments 58,475
6.1%6.6% 7.0%
1.3% 1.4% 1.7%
5.0%
0.0%
2.0%
4.0%
6.0%
8.0%
10.0%
12.0% 70.5%
6.3% 6.4% 8.0%
1.3% 1.1% 1.8%4.7%
0.0%
10.0%
20.0%
30.0%
40.0%
50.0%
60.0%
70.0%
80.0%
Accidents between January 1 - December 31, 2014
Total Number of Claimants with Treatments 59,460
6.3% 6.4%
8.0%
1.3% 1.1%1.8%
4.7%
0.0%
2.0%
4.0%
6.0%
8.0%
10.0%
12.0%
69.6%
6.6% 6.3%8.9%
1.4% 1.2% 1.8%4.2%
0.0%
10.0%
20.0%
30.0%
40.0%
50.0%
60.0%
70.0%
80.0%
Accidents between January 1 - December 31, 2015
Total Number of Claimants with Treatments 65,015
6.6% 6.3%
8.9%
1.4% 1.2%1.8%
4.2%
0.0%
2.0%
4.0%
6.0%
8.0%
10.0%
12.0% 68.7%
6.5% 6.2%
9.9%
1.5% 1.1% 1.9%4.2%
0.0%
10.0%
20.0%
30.0%
40.0%
50.0%
60.0%
70.0%
80.0%
Accidents between January 1 - December 31, 2016
Total Number of Claimants with Treatments 69,176
6.5% 6.2%
9.9%
1.5% 1.1%1.9%
4.2%
0.0%
2.0%
4.0%
6.0%
8.0%
10.0%
12.0%
1455 1518 1981 1698 2101 2419 28461307
$0
$5,000
$10,000
$15,000
$20,000
$25,000
$30,000
$35,000
$40,000
$45,000
$50,000
$55,000
Accidents between January 1 - June 30, 2018
A. Sprain/Strains only B. PNI C. Fract/Disloc/Ext STI D1. ABI/CNI
D2. Spinal Inj/SCI D3. Ext/Int Inj E. Multi Mj Inju F. Other
RIG Class*Please refer to the first page of HCDB Report for the definition of the RIG Class
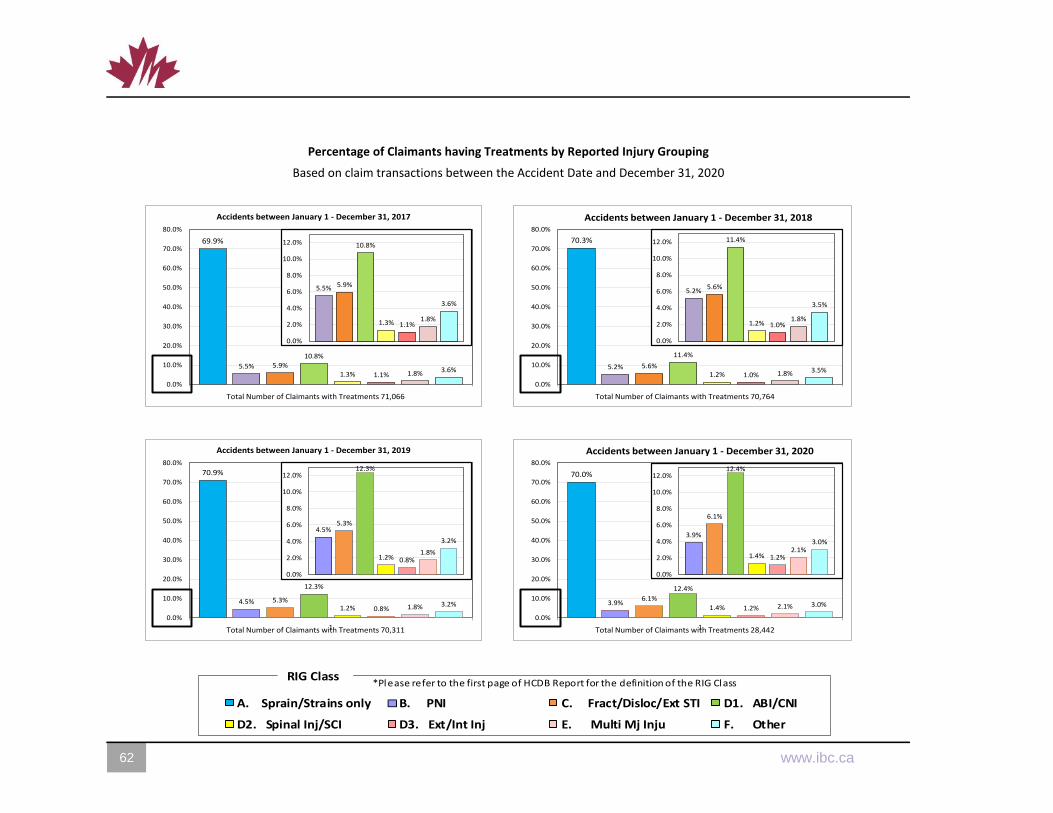
Percentage of Claimants having Treatments by Reported Injury Grouping
Based on claim transactions between the Accident Date and December 31, 2020
62 62 www.ibc.ca 3
69.9%
5.5% 5.9%
10.8%
1.3% 1.1% 1.8% 3.6%
0.0%
10.0%
20.0%
30.0%
40.0%
50.0%
60.0%
70.0%
80.0%
Accidents between January 1 - December 31, 2017
Total Number of Claimants with Treatments 71,066
5.5% 5.9%
10.8%
1.3% 1.1%1.8%
3.6%
0.0%
2.0%
4.0%
6.0%
8.0%
10.0%
12.0% 70.3%
5.2% 5.6%
11.4%
1.2% 1.0% 1.8% 3.5%
0.0%
10.0%
20.0%
30.0%
40.0%
50.0%
60.0%
70.0%
80.0%
Accidents between January 1 - December 31, 2018
Total Number of Claimants with Treatments 70,764
5.2%5.6%
11.4%
1.2% 1.0%1.8%
3.5%
0.0%
2.0%
4.0%
6.0%
8.0%
10.0%
12.0%
70.9%
4.5% 5.3%
12.3%
1.2% 0.8% 1.8% 3.2%
1
0.0%
10.0%
20.0%
30.0%
40.0%
50.0%
60.0%
70.0%
80.0%
Accidents between January 1 - December 31, 2019
Total Number of Claimants with Treatments 70,311
4.5%5.3%
12.3%
1.2% 0.8%1.8%
3.2%
0.0%
2.0%
4.0%
6.0%
8.0%
10.0%
12.0% 70.0%
3.9%6.1%
12.4%
1.4% 1.2% 2.1% 3.0%
1
0.0%
10.0%
20.0%
30.0%
40.0%
50.0%
60.0%
70.0%
80.0%
Accidents between January 1 - December 31, 2020
Total Number of Claimants with Treatments 28,442
3.9%
6.1%
12.4%
1.4% 1.2%2.1%
3.0%
0.0%
2.0%
4.0%
6.0%
8.0%
10.0%
12.0%
1455 1518 1981 1698 2101 2419 28461307
$0
$5,000
$10,000
$15,000
$20,000
$25,000
$30,000
$35,000
$40,000
$45,000
$50,000
$55,000
Accidents between January 1 - June 30, 2018
A. Sprain/Strains only B. PNI C. Fract/Disloc/Ext STI D1. ABI/CNI
D2. Spinal Inj/SCI D3. Ext/Int Inj E. Multi Mj Inju F. Other
RIG Class*Please refer to the first page of HCDB Report for the definition of the RIG Class
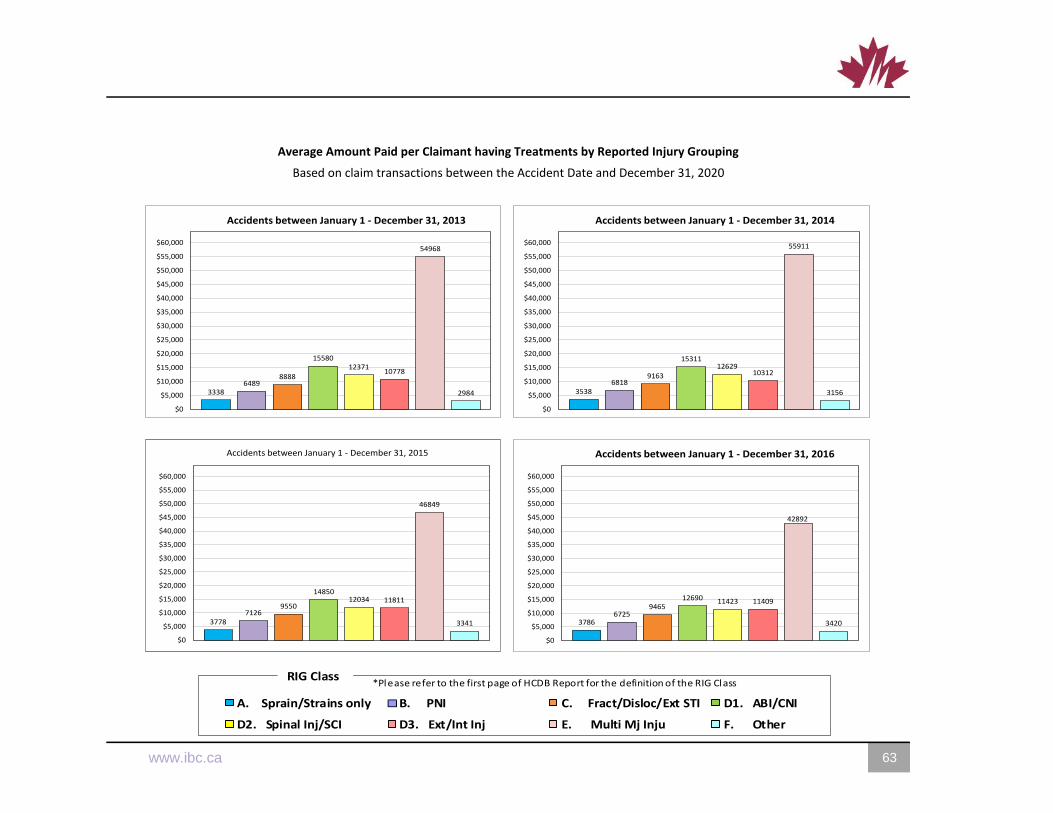
Average Amount Paid per Claimant having Treatments by Reported Injury Grouping
Based on claim transactions between the Accident Date and December 31, 2020
2 www.ibc.ca www.ibc.ca 63
33386489
8888
1558012371
10778
54968
2984
$0
$5,000
$10,000
$15,000
$20,000
$25,000
$30,000
$35,000
$40,000
$45,000
$50,000
$55,000
$60,000
Accidents between January 1 - December 31, 2013
35386818
9163
1531112629
10312
55911
3156
$0
$5,000
$10,000
$15,000
$20,000
$25,000
$30,000
$35,000
$40,000
$45,000
$50,000
$55,000
$60,000
Accidents between January 1 - December 31, 2014
37787126
9550
1485012034 11811
46849
3341
$0
$5,000
$10,000
$15,000
$20,000
$25,000
$30,000
$35,000
$40,000
$45,000
$50,000
$55,000
$60,000
Accidents between January 1 - December 31, 2015
37866725
946512690 11423 11409
42892
3420
$0
$5,000
$10,000
$15,000
$20,000
$25,000
$30,000
$35,000
$40,000
$45,000
$50,000
$55,000
$60,000
Accidents between January 1 - December 31, 2016
1455 1518 1981 1698 2101 2419 28461307
$0
$5,000
$10,000
$15,000
$20,000
$25,000
$30,000
$35,000
$40,000
$45,000
$50,000
$55,000
Accidents between January 1 - June 30, 2018
A. Sprain/Strains only B. PNI C. Fract/Disloc/Ext STI D1. ABI/CNI
D2. Spinal Inj/SCI D3. Ext/Int Inj E. Multi Mj Inju F. Other
RIG Class*Please refer to the first page of HCDB Report for the definition of the RIG Class
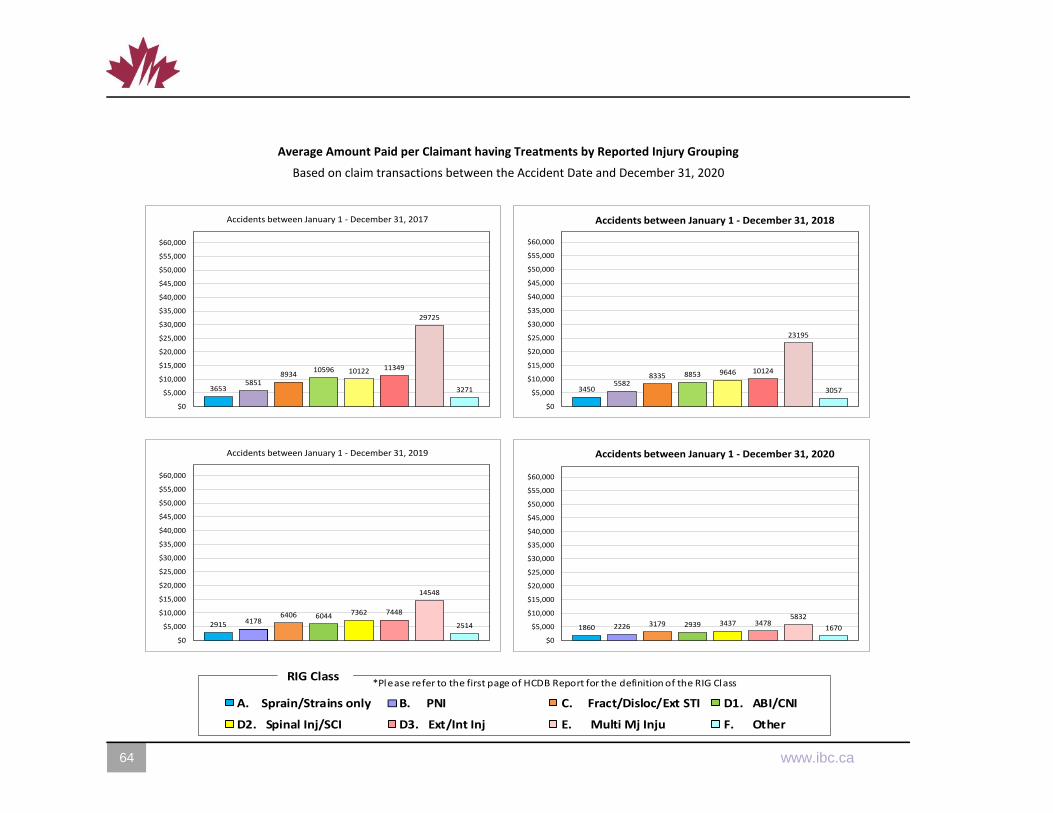
Average Amount Paid per Claimant having Treatments by Reported Injury Grouping
Based on claim transactions between the Accident Date and December 31, 2020
64 64 www.ibc.ca 3
36535851
893410596 10122 11349
29725
3271
$0
$5,000
$10,000
$15,000
$20,000
$25,000
$30,000
$35,000
$40,000
$45,000
$50,000
$55,000
$60,000
Accidents between January 1 - December 31, 2017
34505582
8335 8853 9646 10124
23195
3057
$0
$5,000
$10,000
$15,000
$20,000
$25,000
$30,000
$35,000
$40,000
$45,000
$50,000
$55,000
$60,000
Accidents between January 1 - December 31, 2018
2915 41786406 6044 7362 7448
14548
2514
$0
$5,000
$10,000
$15,000
$20,000
$25,000
$30,000
$35,000
$40,000
$45,000
$50,000
$55,000
$60,000
Accidents between January 1 - December 31, 2019
1860 2226 3179 2939 3437 34785832
1670
$0
$5,000
$10,000
$15,000
$20,000
$25,000
$30,000
$35,000
$40,000
$45,000
$50,000
$55,000
$60,000
Accidents between January 1 - December 31, 2020
1455 1518 1981 1698 2101 2419 28461307
$0
$5,000
$10,000
$15,000
$20,000
$25,000
$30,000
$35,000
$40,000
$45,000
$50,000
$55,000
Accidents between January 1 - June 30, 2018
A. Sprain/Strains only B. PNI C. Fract/Disloc/Ext STI D1. ABI/CNI
D2. Spinal Inj/SCI D3. Ext/Int Inj E. Multi Mj Inju F. Other
RIG Class*Please refer to the first page of HCDB Report for the definition of the RIG Class

Treatments by Reported Injury Grouping and Accident Date
Based on claim transactions between the Accident Date and December 31, 2020
2 www.ibc.ca www.ibc.ca 65
All Claimants
Reported Injury Grouping
Number
of
Claimants
Percent of
Total
Claimants
Insurer Paid
Percent of
Total
Insurer
Paid
Average
Insurer
Paid per
Claimant
A. Sprain/Strains only 41,455 70.9% 138,361,739 40.6% 3,338
B. PNI 3,576 6.1% 23,204,888 6.8% 6,489
C. Fract/Disloc/Ext STI 3,887 6.6% 34,547,536 10.1% 8,888
D1. ABI/CNI 4,117 7.0% 64,142,200 18.8% 15,580
D2. Spinal Inj/SCI 754 1.3% 9,327,676 2.7% 12,371
D3. Ext/Int Inj 797 1.4% 8,590,145 2.5% 10,778
E. Multi Mj Inju 974 1.7% 53,539,263 15.7% 54,968
F. Other 2,915 5.0% 8,698,000 2.6% 2,984
Treatment - Subtotal 58,475 100.0% 340,411,448 100.0% 5,821
Accident dates January 1 - December 31, 2013
All Claimants
Reported Injury Grouping
Number
of
Claimants
Percent of
Total
Claimants
Insurer Paid
Percent of
Total
Insurer
Paid
Average
Insurer
Paid per
Claimant
A. Sprain/Strains only 41,919 70.5% 148,306,142 40.5% 3,538
B. PNI 3,729 6.3% 25,423,433 6.9% 6,818
C. Fract/Disloc/Ext STI 3,777 6.4% 34,608,047 9.4% 9,163
D1. ABI/CNI 4,765 8.0% 72,957,496 19.9% 15,311
D2. Spinal Inj/SCI 758 1.3% 9,572,647 2.6% 12,629
D3. Ext/Int Inj 651 1.1% 6,713,120 1.8% 10,312
E. Multi Mj Inju 1,076 1.8% 60,160,336 16.4% 55,911
F. Other 2,785 4.7% 8,788,946 2.4% 3,156
Treatment - Subtotal 59,460 100.0% 366,530,168 100.0% 6,164
Accident dates January 1 - December 31, 2014
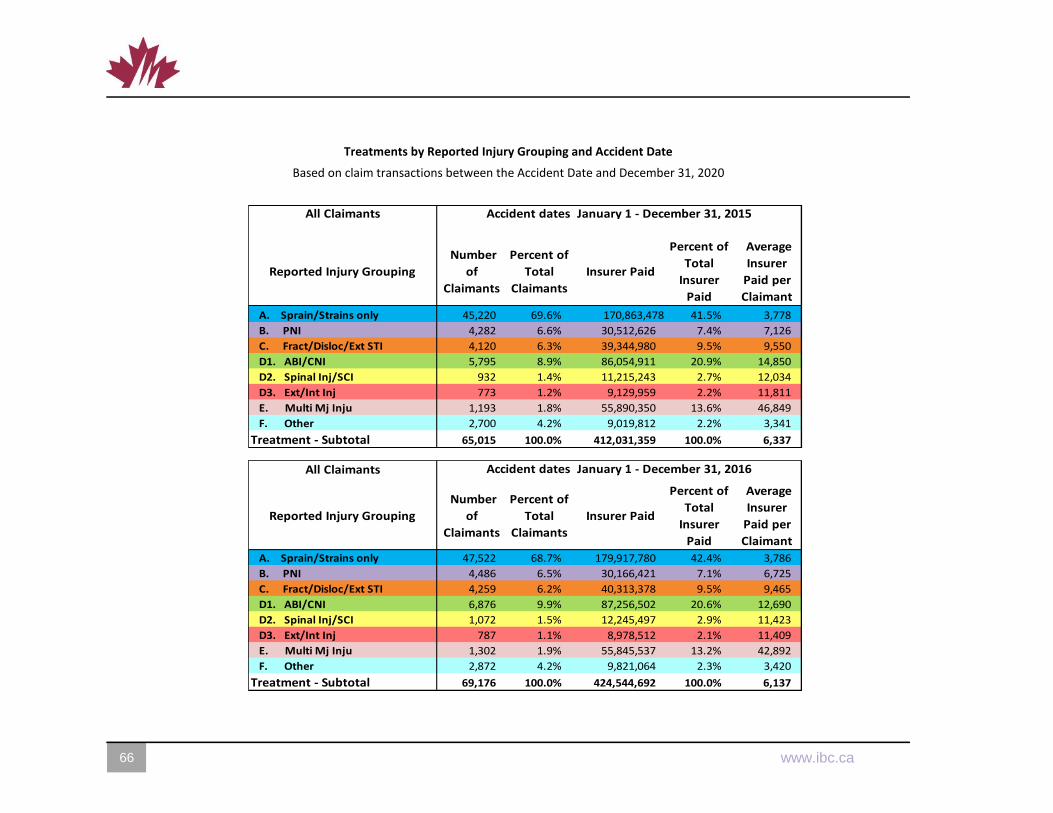
Treatments by Reported Injury Grouping and Accident Date
Based on claim transactions between the Accident Date and December 31, 2020
66 66 www.ibc.ca 3
All Claimants
Reported Injury Grouping
Number
of
Claimants
Percent of
Total
Claimants
Insurer Paid
Percent of
Total
Insurer
Paid
Average
Insurer
Paid per
Claimant
A. Sprain/Strains only 45,220 69.6% 170,863,478 41.5% 3,778
B. PNI 4,282 6.6% 30,512,626 7.4% 7,126
C. Fract/Disloc/Ext STI 4,120 6.3% 39,344,980 9.5% 9,550
D1. ABI/CNI 5,795 8.9% 86,054,911 20.9% 14,850
D2. Spinal Inj/SCI 932 1.4% 11,215,243 2.7% 12,034
D3. Ext/Int Inj 773 1.2% 9,129,959 2.2% 11,811
E. Multi Mj Inju 1,193 1.8% 55,890,350 13.6% 46,849
F. Other 2,700 4.2% 9,019,812 2.2% 3,341
Treatment - Subtotal 65,015 100.0% 412,031,359 100.0% 6,337
Accident dates January 1 - December 31, 2015
All Claimants
Reported Injury Grouping
Number
of
Claimants
Percent of
Total
Claimants
Insurer Paid
Percent of
Total
Insurer
Paid
Average
Insurer
Paid per
Claimant
A. Sprain/Strains only 47,522 68.7% 179,917,780 42.4% 3,786
B. PNI 4,486 6.5% 30,166,421 7.1% 6,725
C. Fract/Disloc/Ext STI 4,259 6.2% 40,313,378 9.5% 9,465
D1. ABI/CNI 6,876 9.9% 87,256,502 20.6% 12,690
D2. Spinal Inj/SCI 1,072 1.5% 12,245,497 2.9% 11,423
D3. Ext/Int Inj 787 1.1% 8,978,512 2.1% 11,409
E. Multi Mj Inju 1,302 1.9% 55,845,537 13.2% 42,892
F. Other 2,872 4.2% 9,821,064 2.3% 3,420
Treatment - Subtotal 69,176 100.0% 424,544,692 100.0% 6,137
Accident dates January 1 - December 31, 2016
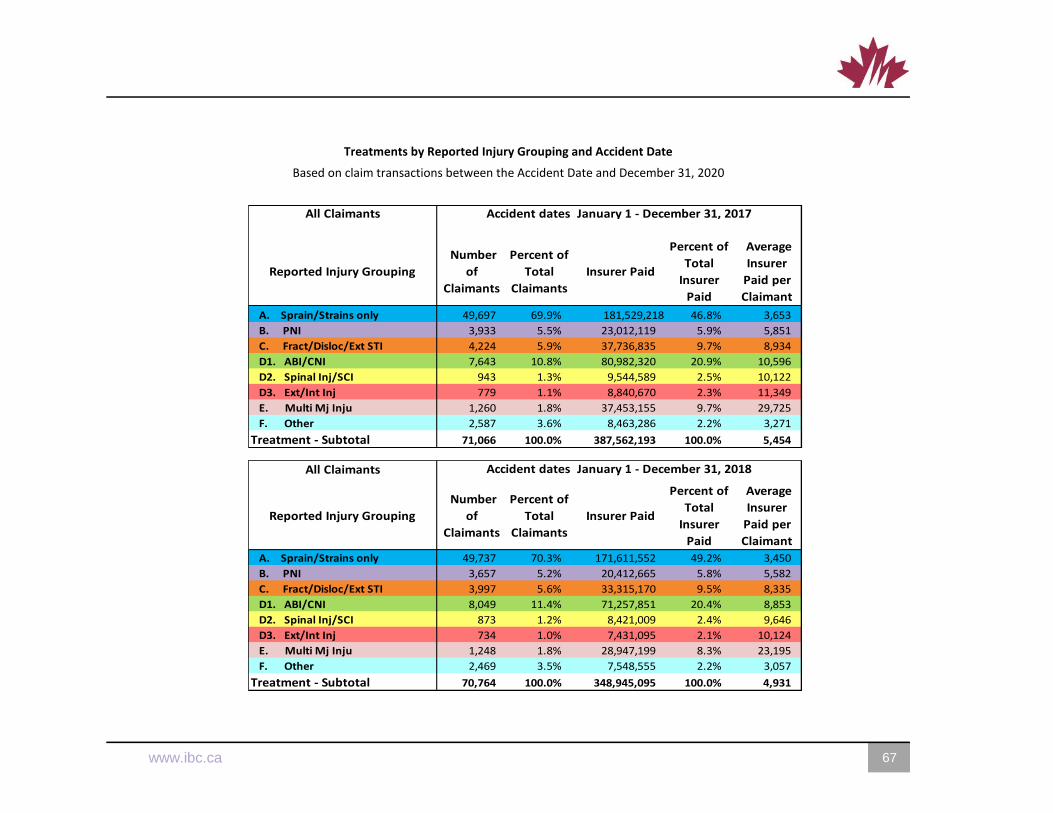
Treatments by Reported Injury Grouping and Accident Date
Based on claim transactions between the Accident Date and December 31, 2020
2 www.ibc.ca www.ibc.ca 67
All Claimants
Reported Injury Grouping
Number
of
Claimants
Percent of
Total
Claimants
Insurer Paid
Percent of
Total
Insurer
Paid
Average
Insurer
Paid per
Claimant
A. Sprain/Strains only 49,697 69.9% 181,529,218 46.8% 3,653
B. PNI 3,933 5.5% 23,012,119 5.9% 5,851
C. Fract/Disloc/Ext STI 4,224 5.9% 37,736,835 9.7% 8,934
D1. ABI/CNI 7,643 10.8% 80,982,320 20.9% 10,596
D2. Spinal Inj/SCI 943 1.3% 9,544,589 2.5% 10,122
D3. Ext/Int Inj 779 1.1% 8,840,670 2.3% 11,349
E. Multi Mj Inju 1,260 1.8% 37,453,155 9.7% 29,725
F. Other 2,587 3.6% 8,463,286 2.2% 3,271
Treatment - Subtotal 71,066 100.0% 387,562,193 100.0% 5,454
Accident dates January 1 - December 31, 2017
All Claimants
Reported Injury Grouping
Number
of
Claimants
Percent of
Total
Claimants
Insurer Paid
Percent of
Total
Insurer
Paid
Average
Insurer
Paid per
Claimant
A. Sprain/Strains only 49,737 70.3% 171,611,552 49.2% 3,450
B. PNI 3,657 5.2% 20,412,665 5.8% 5,582
C. Fract/Disloc/Ext STI 3,997 5.6% 33,315,170 9.5% 8,335
D1. ABI/CNI 8,049 11.4% 71,257,851 20.4% 8,853
D2. Spinal Inj/SCI 873 1.2% 8,421,009 2.4% 9,646
D3. Ext/Int Inj 734 1.0% 7,431,095 2.1% 10,124
E. Multi Mj Inju 1,248 1.8% 28,947,199 8.3% 23,195
F. Other 2,469 3.5% 7,548,555 2.2% 3,057
Treatment - Subtotal 70,764 100.0% 348,945,095 100.0% 4,931
Accident dates January 1 - December 31, 2018

Treatments by Reported Injury Grouping and Accident Date
Based on claim transactions between the Accident Date and December 31, 2020
68 68 www.ibc.ca 3
All Claimants
Reported Injury Grouping
Number
of
Claimants
Percent of
Total
Claimants
Insurer Paid
Percent of
Total
Insurer
Paid
Average
Insurer
Paid per
Claimant
A. Sprain/Strains only 49,849 70.9% 145,288,607 54.0% 2,915
B. PNI 3,179 4.5% 13,282,928 4.9% 4,178
C. Fract/Disloc/Ext STI 3,727 5.3% 23,874,706 8.9% 6,406
D1. ABI/CNI 8,659 12.3% 52,337,912 19.5% 6,044
D2. Spinal Inj/SCI 821 1.2% 6,043,838 2.2% 7,362
D3. Ext/Int Inj 595 0.8% 4,431,518 1.6% 7,448
E. Multi Mj Inju 1,245 1.8% 18,112,481 6.7% 14,548
F. Other 2,236 3.2% 5,621,601 2.1% 2,514
Treatment - Subtotal 70,311 100.0% 268,993,592 100.0% 3,826
Accident dates January 1 - December 31, 2019
All Claimants
Reported Injury Grouping
Number
of
Claimants
Percent of
Total
Claimants
Insurer Paid
Percent of
Total
Insurer
Paid
Average
Insurer
Paid per
Claimant
A. Sprain/Strains only 19,901 70.0% 37,016,659 59.0% 1,860
B. PNI 1,106 3.9% 2,461,445 3.9% 2,226
C. Fract/Disloc/Ext STI 1,747 6.1% 5,553,083 8.9% 3,179
D1. ABI/CNI 3,515 12.4% 10,331,224 16.5% 2,939
D2. Spinal Inj/SCI 384 1.4% 1,319,998 2.1% 3,437
D3. Ext/Int Inj 333 1.2% 1,158,162 1.8% 3,478
E. Multi Mj Inju 590 2.1% 3,440,830 5.5% 5,832
F. Other 866 3.0% 1,446,159 2.3% 1,670
Treatment - Subtotal 28,442 100.0% 62,727,558 100.0% 2,205
Accident dates January 1 - December 31, 2020
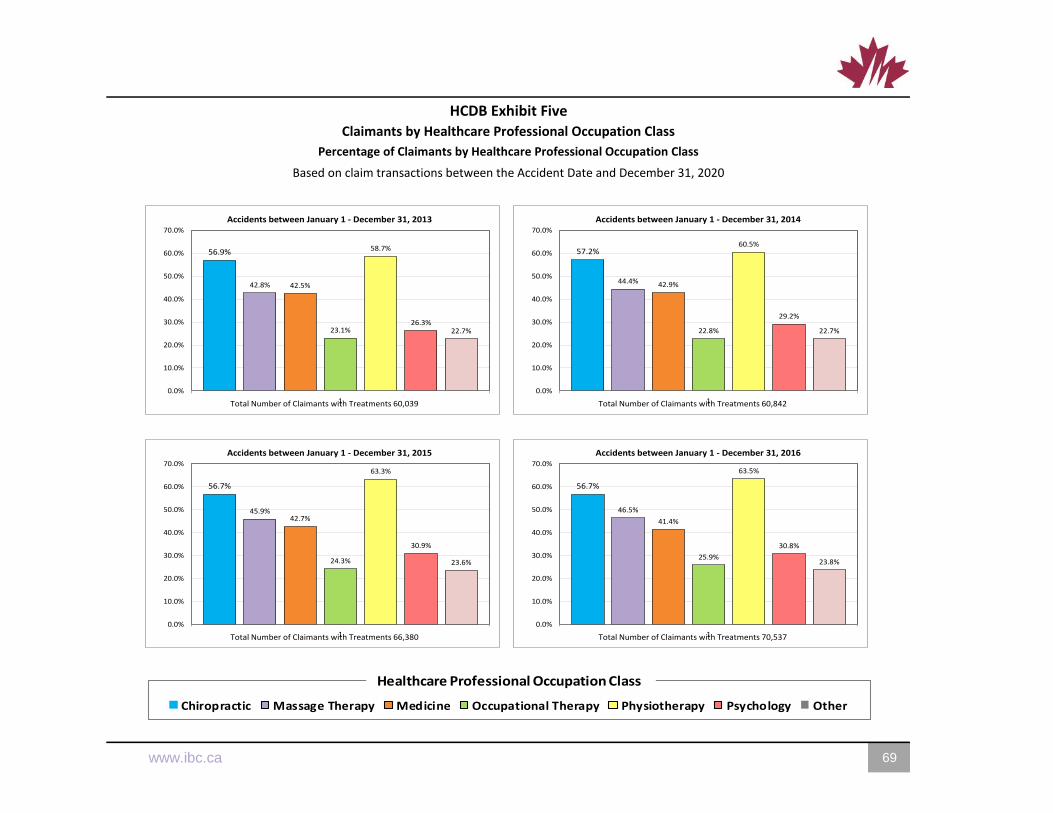
HCDB Exhibit Five
Claimants by Healthcare Professional Occupation Class
Percentage of Claimants by Healthcare Professional Occupation Class
Based on claim transactions between the Accident Date and December 31, 2020
2 www.ibc.ca www.ibc.ca 69
56.9%
42.8% 42.5%
23.1%
58.7%
26.3%22.7%
1
0.0%
10.0%
20.0%
30.0%
40.0%
50.0%
60.0%
70.0%
Accidents between January 1 - December 31, 2013
Total Number of Claimants with Treatments 60,039
57.2%
44.4% 42.9%
22.8%
60.5%
29.2%
22.7%
1
0.0%
10.0%
20.0%
30.0%
40.0%
50.0%
60.0%
70.0%
Accidents between January 1 - December 31, 2014
Total Number of Claimants with Treatments 60,842
56.7%
45.9%42.7%
24.3%
63.3%
30.9%
23.6%
1
0.0%
10.0%
20.0%
30.0%
40.0%
50.0%
60.0%
70.0%
Accidents between January 1 - December 31, 2015
Total Number of Claimants with Treatments 66,380
56.7%
46.5%
41.4%
25.9%
63.5%
30.8%
23.8%
1
0.0%
10.0%
20.0%
30.0%
40.0%
50.0%
60.0%
70.0%
Accidents between January 1 - December 31, 2016
Total Number of Claimants with Treatments 70,537$0
Accidents between July 1 - December 31, 2017
Chiropractic Massage Therapy Medicine Occupational Therapy Physiotherapy Psychology Other
Healthcare Professional Occupation Class
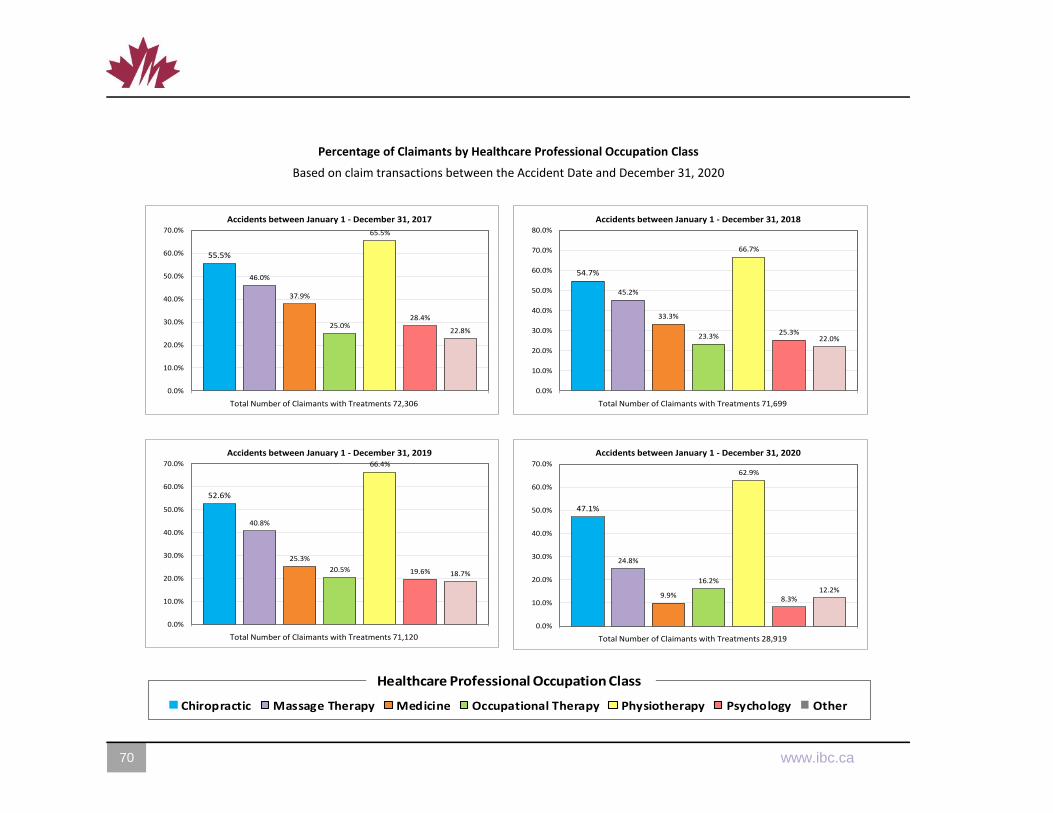
Percentage of Claimants by Healthcare Professional Occupation Class
Based on claim transactions between the Accident Date and December 31, 2020
70 70 www.ibc.ca 3
55.5%
46.0%
37.9%
25.0%
65.5%
28.4%
22.8%
0.0%
10.0%
20.0%
30.0%
40.0%
50.0%
60.0%
70.0%
Accidents between January 1 - December 31, 2017
Total Number of Claimants with Treatments 72,306
54.7%
45.2%
33.3%
23.3%
66.7%
25.3%22.0%
0.0%
10.0%
20.0%
30.0%
40.0%
50.0%
60.0%
70.0%
80.0%
Accidents between January 1 - December 31, 2018
Total Number of Claimants with Treatments 71,699
52.6%
40.8%
25.3%
20.5%
66.4%
19.6% 18.7%
0.0%
10.0%
20.0%
30.0%
40.0%
50.0%
60.0%
70.0%
Accidents between January 1 - December 31, 2019
Total Number of Claimants with Treatments 71,120
47.1%
24.8%
9.9%
16.2%
62.9%
8.3%12.2%
0.0%
10.0%
20.0%
30.0%
40.0%
50.0%
60.0%
70.0%
Accidents between January 1 - December 31, 2020
Total Number of Claimants with Treatments 28,919$0
Accidents between July 1 - December 31, 2017
Chiropractic Massage Therapy Medicine Occupational Therapy Physiotherapy Psychology Other
Healthcare Professional Occupation Class
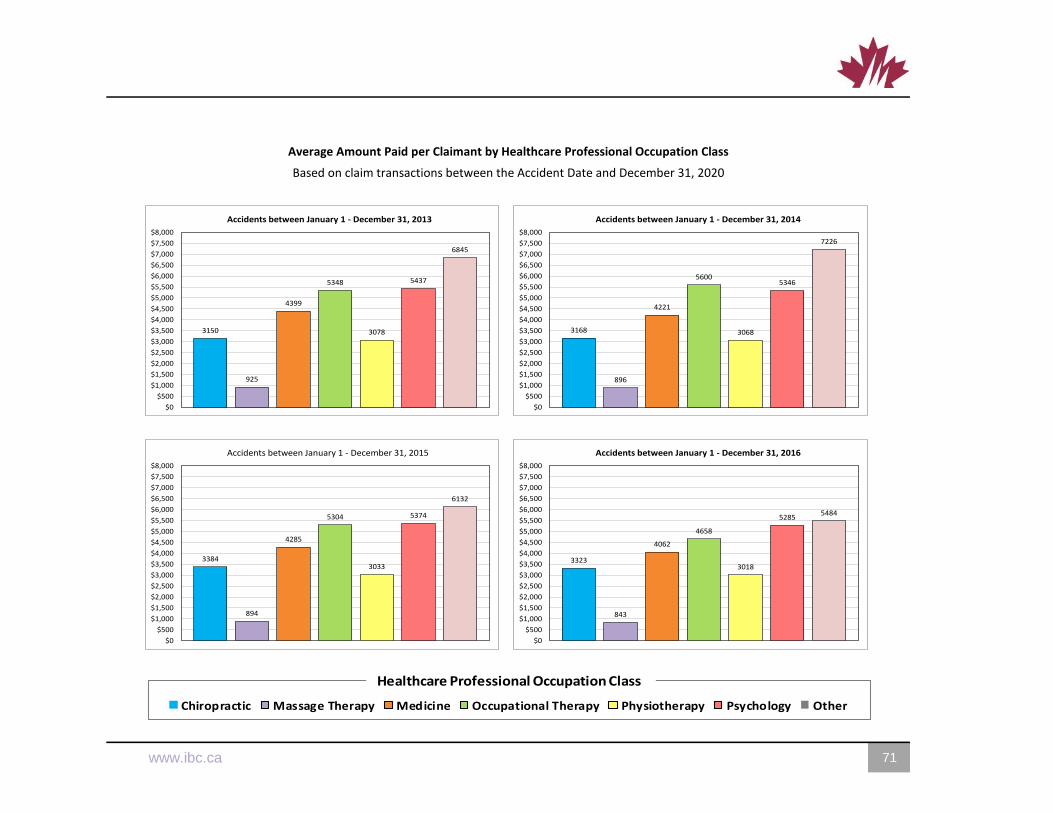
Average Amount Paid per Claimant by Healthcare Professional Occupation Class
Based on claim transactions between the Accident Date and December 31, 2020
2 www.ibc.ca www.ibc.ca 71
3150
925
4399
5348
3078
5437
6845
$0
$500
$1,000
$1,500
$2,000
$2,500
$3,000
$3,500
$4,000
$4,500
$5,000
$5,500
$6,000
$6,500
$7,000
$7,500
$8,000
Accidents between January 1 - December 31, 2013
3168
896
4221
5600
3068
5346
7226
$0
$500
$1,000
$1,500
$2,000
$2,500
$3,000
$3,500
$4,000
$4,500
$5,000
$5,500
$6,000
$6,500
$7,000
$7,500
$8,000
Accidents between January 1 - December 31, 2014
3384
894
4285
5304
3033
5374
6132
$0
$500
$1,000
$1,500
$2,000
$2,500
$3,000
$3,500
$4,000
$4,500
$5,000
$5,500
$6,000
$6,500
$7,000
$7,500
$8,000
Accidents between January 1 - December 31, 2015
3323
843
4062
4658
3018
52855484
$0
$500
$1,000
$1,500
$2,000
$2,500
$3,000
$3,500
$4,000
$4,500
$5,000
$5,500
$6,000
$6,500
$7,000
$7,500
$8,000
Accidents between January 1 - December 31, 2016
$0
Accidents between July 1 - December 31, 2017
Chiropractic Massage Therapy Medicine Occupational Therapy Physiotherapy Psychology Other
Healthcare Professional Occupation Class
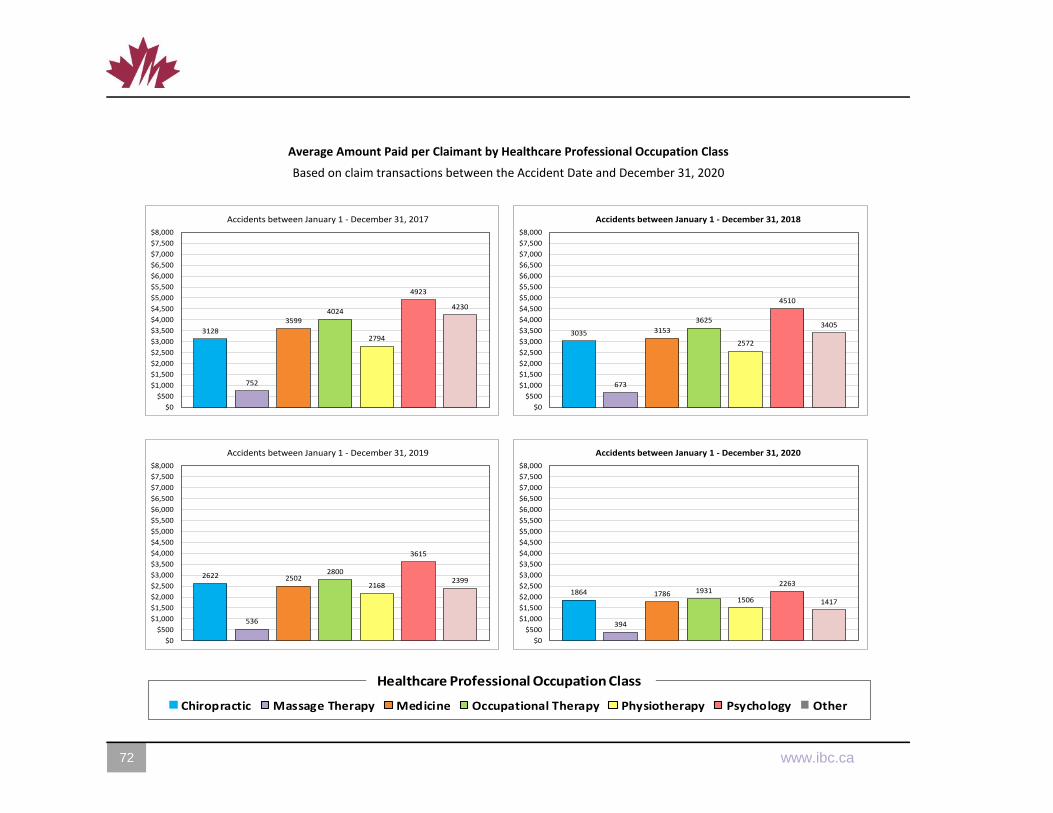
Average Amount Paid per Claimant by Healthcare Professional Occupation Class
Based on claim transactions between the Accident Date and December 31, 2020
72 72 www.ibc.ca 3
3128
752
35994024
2794
4923
4230
$0
$500
$1,000
$1,500
$2,000
$2,500
$3,000
$3,500
$4,000
$4,500
$5,000
$5,500
$6,000
$6,500
$7,000
$7,500
$8,000
Accidents between January 1 - December 31, 2017
3035
673
3153
3625
2572
4510
3405
$0
$500
$1,000
$1,500
$2,000
$2,500
$3,000
$3,500
$4,000
$4,500
$5,000
$5,500
$6,000
$6,500
$7,000
$7,500
$8,000
Accidents between January 1 - December 31, 2018
2622
536
25022800
2168
3615
2399
$0
$500
$1,000
$1,500
$2,000
$2,500
$3,000
$3,500
$4,000
$4,500
$5,000
$5,500
$6,000
$6,500
$7,000
$7,500
$8,000
Accidents between January 1 - December 31, 2019
1864
394
1786 19311506
2263
1417
$0
$500
$1,000
$1,500
$2,000
$2,500
$3,000
$3,500
$4,000
$4,500
$5,000
$5,500
$6,000
$6,500
$7,000
$7,500
$8,000
Accidents between January 1 - December 31, 2020
$0
Accidents between July 1 - December 31, 2017
Chiropractic Massage Therapy Medicine Occupational Therapy Physiotherapy Psychology Other
Healthcare Professional Occupation Class

Treatments/Assessments by Healthcare Professional Occupation Class and Accident Date
Based on claim transactions between the Accident Date and December 31, 2020
2 www.ibc.ca www.ibc.ca 73
All Claimants
Healthcare Professional
Occupation Class
Number
of
Claimants
Percent of
Total
Claimants
Insurer Paid
Percent of
Total
Insurer Paid
Average
Insurer Paid
per Claimant
Chiropractic 34,175 56.9% 107,656,047 17.4% 3,150
Massage Therapy 25,667 42.8% 23,731,545 3.8% 925
Medicine 25,545 42.5% 112,364,690 18.1% 4,399
Occupational Therapy 13,842 23.1% 74,028,440 11.9% 5,348
Physiotherapy 35,263 58.7% 108,528,269 17.5% 3,078
Psychology 15,814 26.3% 85,976,169 13.9% 5,437
Other 13,644 22.7% 93,398,240 15.1% 6,845
Unallocated Amount 14,146,008 2.3%
All Classes Total 60,039 100.0% 619,829,407 100.0% 10,324
Accident dates January 1 - December 31, 2013
All Claimants
Healthcare Professional
Occupation Class
Number
of
Claimants
Percent of
Total
Claimants
Insurer Paid
Percent of
Total
Insurer Paid
Average
Insurer Paid
per Claimant
Chiropractic 34,784 57.2% 110,192,517 17.1% 3,168
Massage Therapy 27,042 44.4% 24,225,126 3.8% 896
Medicine 26,103 42.9% 110,183,193 17.1% 4,221
Occupational Therapy 13,870 22.8% 77,671,036 12.0% 5,600
Physiotherapy 36,825 60.5% 112,969,485 17.5% 3,068
Psychology 17,746 29.2% 94,867,538 14.7% 5,346
Other 13,836 22.7% 99,978,990 15.5% 7,226
Unallocated Amount 14,583,991 2.3%
All Classes Total 60,842 100.0% 644,671,876 100.0% 10,596
Accident dates January 1 - December 31, 2014
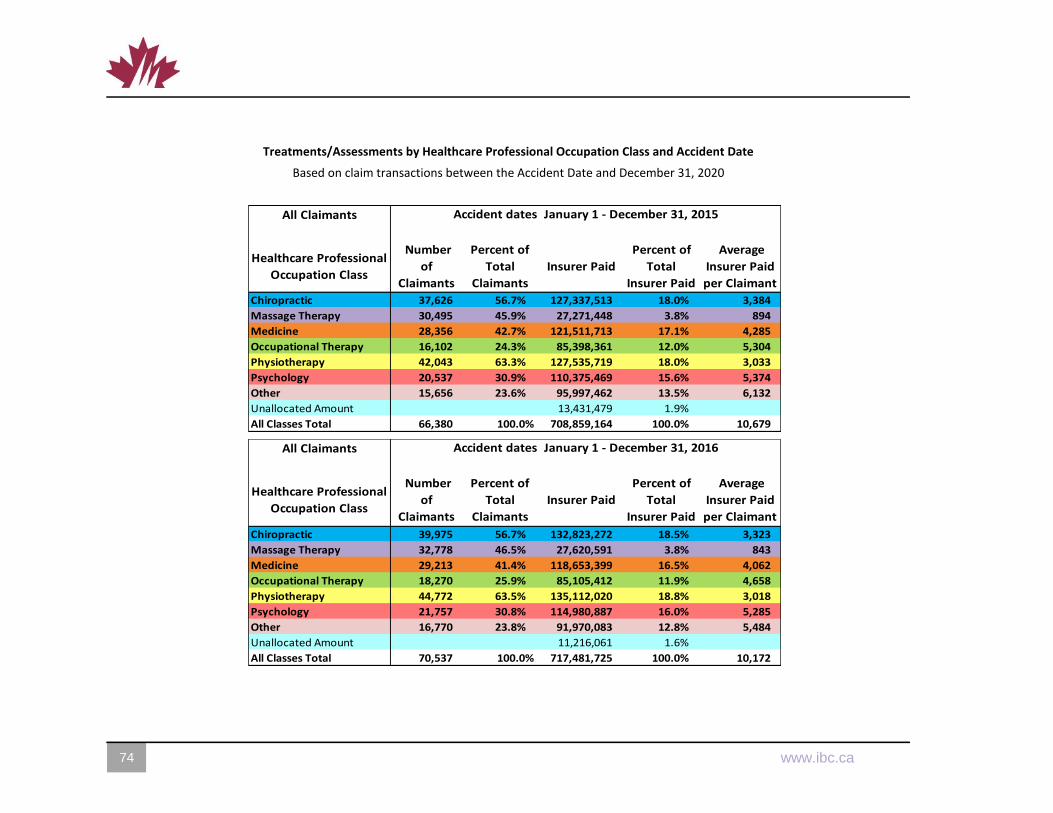
Treatments/Assessments by Healthcare Professional Occupation Class and Accident Date
Based on claim transactions between the Accident Date and December 31, 2020
74 74 www.ibc.ca 3
All Claimants
Healthcare Professional
Occupation Class
Number
of
Claimants
Percent of
Total
Claimants
Insurer Paid
Percent of
Total
Insurer Paid
Average
Insurer Paid
per Claimant
Chiropractic 37,626 56.7% 127,337,513 18.0% 3,384
Massage Therapy 30,495 45.9% 27,271,448 3.8% 894
Medicine 28,356 42.7% 121,511,713 17.1% 4,285
Occupational Therapy 16,102 24.3% 85,398,361 12.0% 5,304
Physiotherapy 42,043 63.3% 127,535,719 18.0% 3,033
Psychology 20,537 30.9% 110,375,469 15.6% 5,374
Other 15,656 23.6% 95,997,462 13.5% 6,132
Unallocated Amount 13,431,479 1.9%
All Classes Total 66,380 100.0% 708,859,164 100.0% 10,679
Accident dates January 1 - December 31, 2015
All Claimants
Healthcare Professional
Occupation Class
Number
of
Claimants
Percent of
Total
Claimants
Insurer Paid
Percent of
Total
Insurer Paid
Average
Insurer Paid
per Claimant
Chiropractic 39,975 56.7% 132,823,272 18.5% 3,323
Massage Therapy 32,778 46.5% 27,620,591 3.8% 843
Medicine 29,213 41.4% 118,653,399 16.5% 4,062
Occupational Therapy 18,270 25.9% 85,105,412 11.9% 4,658
Physiotherapy 44,772 63.5% 135,112,020 18.8% 3,018
Psychology 21,757 30.8% 114,980,887 16.0% 5,285
Other 16,770 23.8% 91,970,083 12.8% 5,484
Unallocated Amount 11,216,061 1.6%
All Classes Total 70,537 100.0% 717,481,725 100.0% 10,172
Accident dates January 1 - December 31, 2016
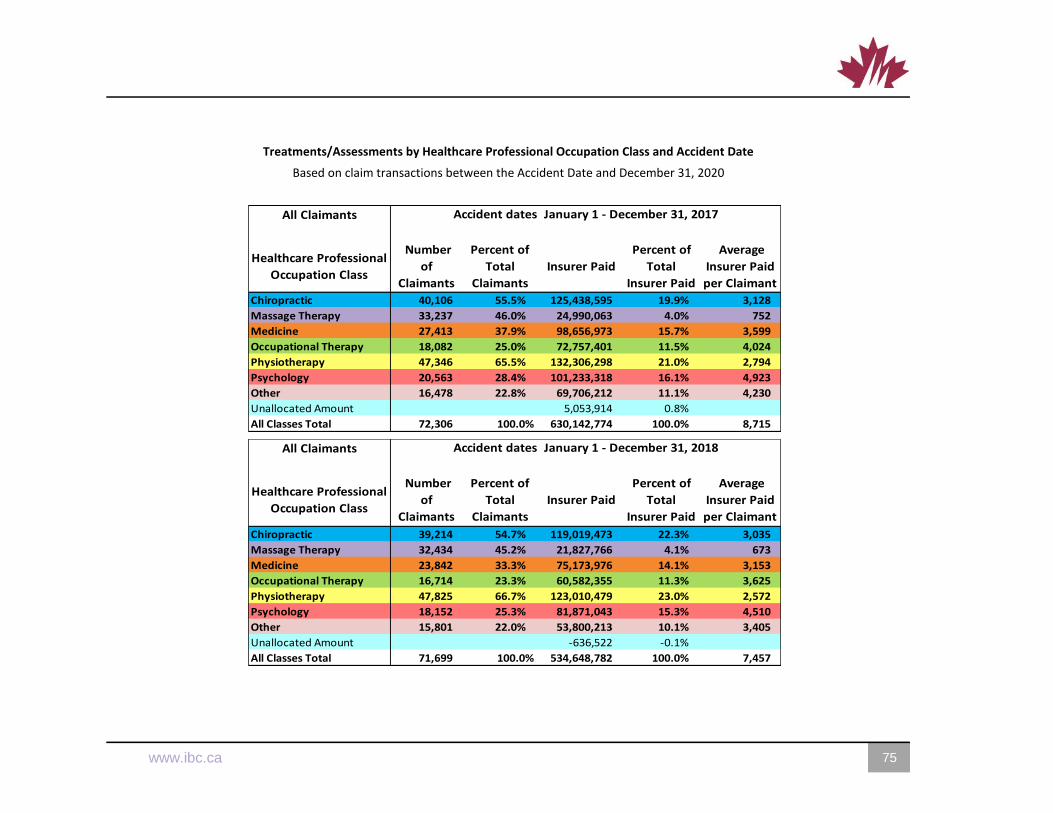
Treatments/Assessments by Healthcare Professional Occupation Class and Accident Date
Based on claim transactions between the Accident Date and December 31, 2020
2 www.ibc.ca www.ibc.ca 75
All Claimants
Healthcare Professional
Occupation Class
Number
of
Claimants
Percent of
Total
Claimants
Insurer Paid
Percent of
Total
Insurer Paid
Average
Insurer Paid
per Claimant
Chiropractic 40,106 55.5% 125,438,595 19.9% 3,128
Massage Therapy 33,237 46.0% 24,990,063 4.0% 752
Medicine 27,413 37.9% 98,656,973 15.7% 3,599
Occupational Therapy 18,082 25.0% 72,757,401 11.5% 4,024
Physiotherapy 47,346 65.5% 132,306,298 21.0% 2,794
Psychology 20,563 28.4% 101,233,318 16.1% 4,923
Other 16,478 22.8% 69,706,212 11.1% 4,230
Unallocated Amount 5,053,914 0.8%
All Classes Total 72,306 100.0% 630,142,774 100.0% 8,715
Accident dates January 1 - December 31, 2017
All Claimants
Healthcare Professional
Occupation Class
Number
of
Claimants
Percent of
Total
Claimants
Insurer Paid
Percent of
Total
Insurer Paid
Average
Insurer Paid
per Claimant
Chiropractic 39,214 54.7% 119,019,473 22.3% 3,035
Massage Therapy 32,434 45.2% 21,827,766 4.1% 673
Medicine 23,842 33.3% 75,173,976 14.1% 3,153
Occupational Therapy 16,714 23.3% 60,582,355 11.3% 3,625
Physiotherapy 47,825 66.7% 123,010,479 23.0% 2,572
Psychology 18,152 25.3% 81,871,043 15.3% 4,510
Other 15,801 22.0% 53,800,213 10.1% 3,405
Unallocated Amount -636,522 -0.1%
All Classes Total 71,699 100.0% 534,648,782 100.0% 7,457
Accident dates January 1 - December 31, 2018
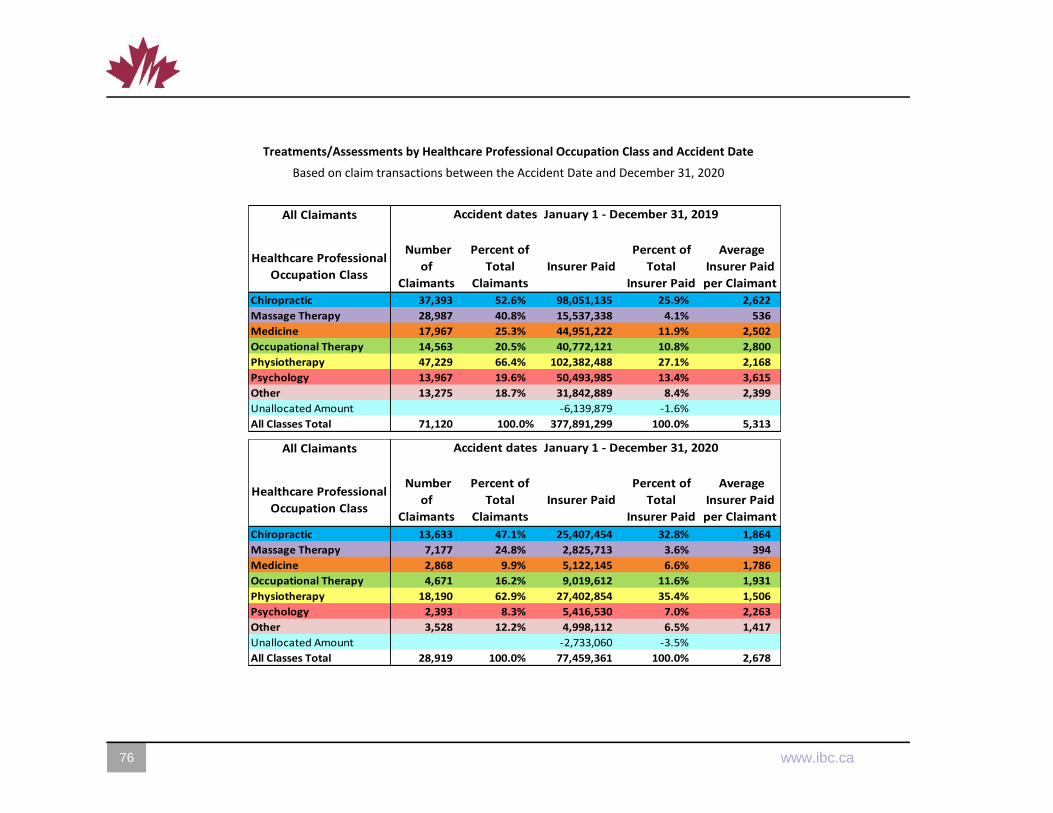
Treatments/Assessments by Healthcare Professional Occupation Class and Accident Date
Based on claim transactions between the Accident Date and December 31, 2020
76 76 www.ibc.ca 3
All Claimants
Healthcare Professional
Occupation Class
Number
of
Claimants
Percent of
Total
Claimants
Insurer Paid
Percent of
Total
Insurer Paid
Average
Insurer Paid
per Claimant
Chiropractic 37,393 52.6% 98,051,135 25.9% 2,622
Massage Therapy 28,987 40.8% 15,537,338 4.1% 536
Medicine 17,967 25.3% 44,951,222 11.9% 2,502
Occupational Therapy 14,563 20.5% 40,772,121 10.8% 2,800
Physiotherapy 47,229 66.4% 102,382,488 27.1% 2,168
Psychology 13,967 19.6% 50,493,985 13.4% 3,615
Other 13,275 18.7% 31,842,889 8.4% 2,399
Unallocated Amount -6,139,879 -1.6%
All Classes Total 71,120 100.0% 377,891,299 100.0% 5,313
Accident dates January 1 - December 31, 2019
All Claimants
Healthcare Professional
Occupation Class
Number
of
Claimants
Percent of
Total
Claimants
Insurer Paid
Percent of
Total
Insurer Paid
Average
Insurer Paid
per Claimant
Chiropractic 13,633 47.1% 25,407,454 32.8% 1,864
Massage Therapy 7,177 24.8% 2,825,713 3.6% 394
Medicine 2,868 9.9% 5,122,145 6.6% 1,786
Occupational Therapy 4,671 16.2% 9,019,612 11.6% 1,931
Physiotherapy 18,190 62.9% 27,402,854 35.4% 1,506
Psychology 2,393 8.3% 5,416,530 7.0% 2,263
Other 3,528 12.2% 4,998,112 6.5% 1,417
Unallocated Amount -2,733,060 -3.5%
All Classes Total 28,919 100.0% 77,459,361 100.0% 2,678
Accident dates January 1 - December 31, 2020
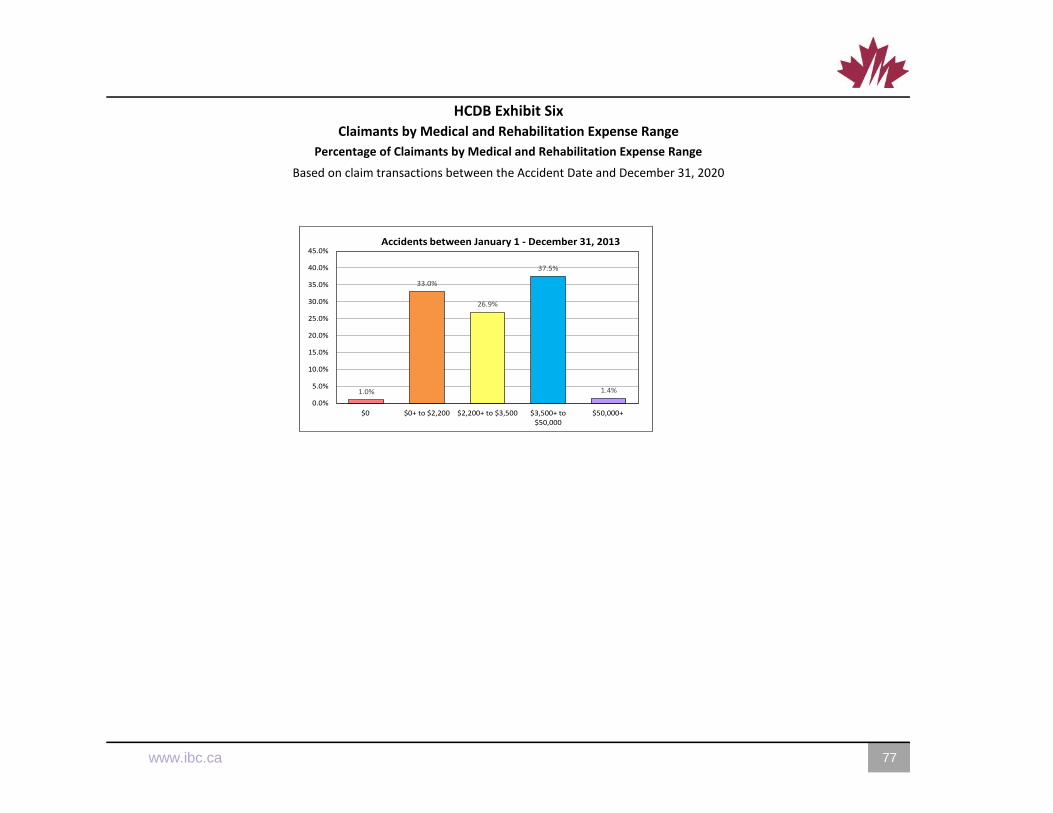
HCDB Exhibit Six
Claimants by Medical and Rehabilitation Expense Range
Percentage of Claimants by Medical and Rehabilitation Expense Range
Based on claim transactions between the Accident Date and December 31, 2020
2 www.ibc.ca www.ibc.ca 77
1.0%
33.0%
26.9%
37.5%
1.4%
0.0%
5.0%
10.0%
15.0%
20.0%
25.0%
30.0%
35.0%
40.0%
45.0%
$0 $0+ to $2,200 $2,200+ to $3,500 $3,500+ to$50,000
$50,000+
Accidents between January 1 - December 31, 2013
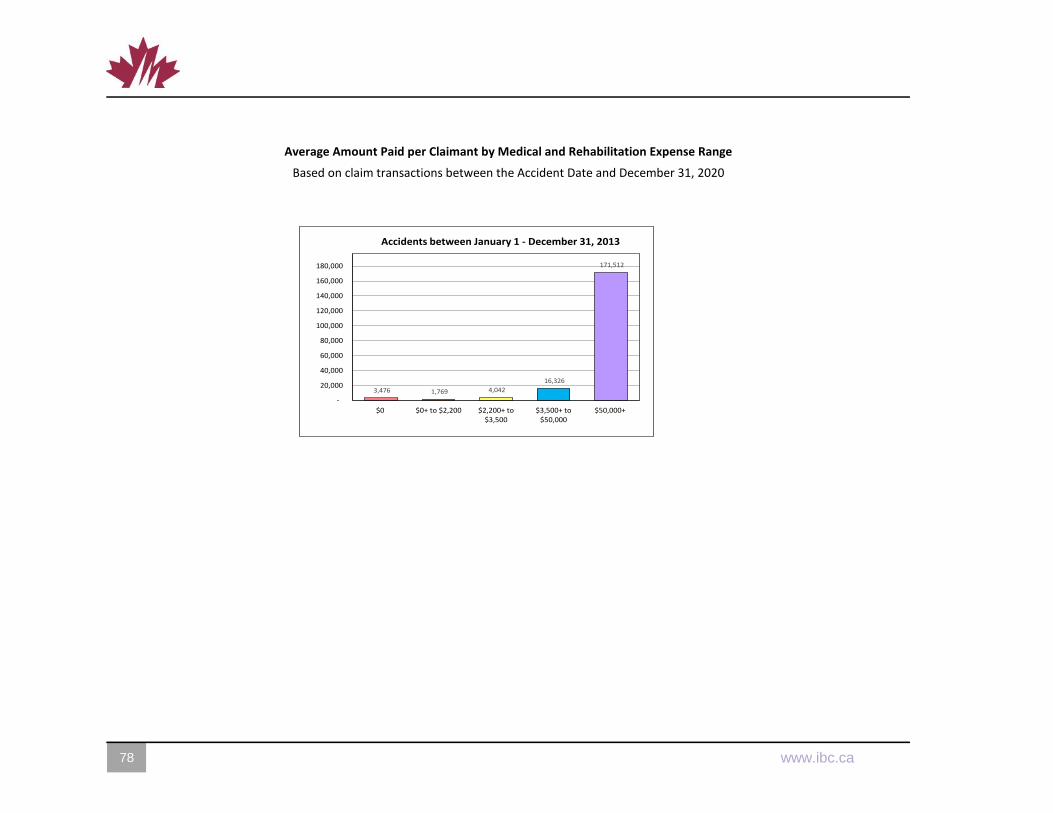
Average Amount Paid per Claimant by Medical and Rehabilitation Expense Range
Based on claim transactions between the Accident Date and December 31, 2020
78 78 www.ibc.ca 3
3,476 1,769 4,042
16,326
171,512
-
20,000
40,000
60,000
80,000
100,000
120,000
140,000
160,000
180,000
$0 $0+ to $2,200 $2,200+ to$3,500
$3,500+ to$50,000
$50,000+
Accidents between January 1 - December 31, 2013
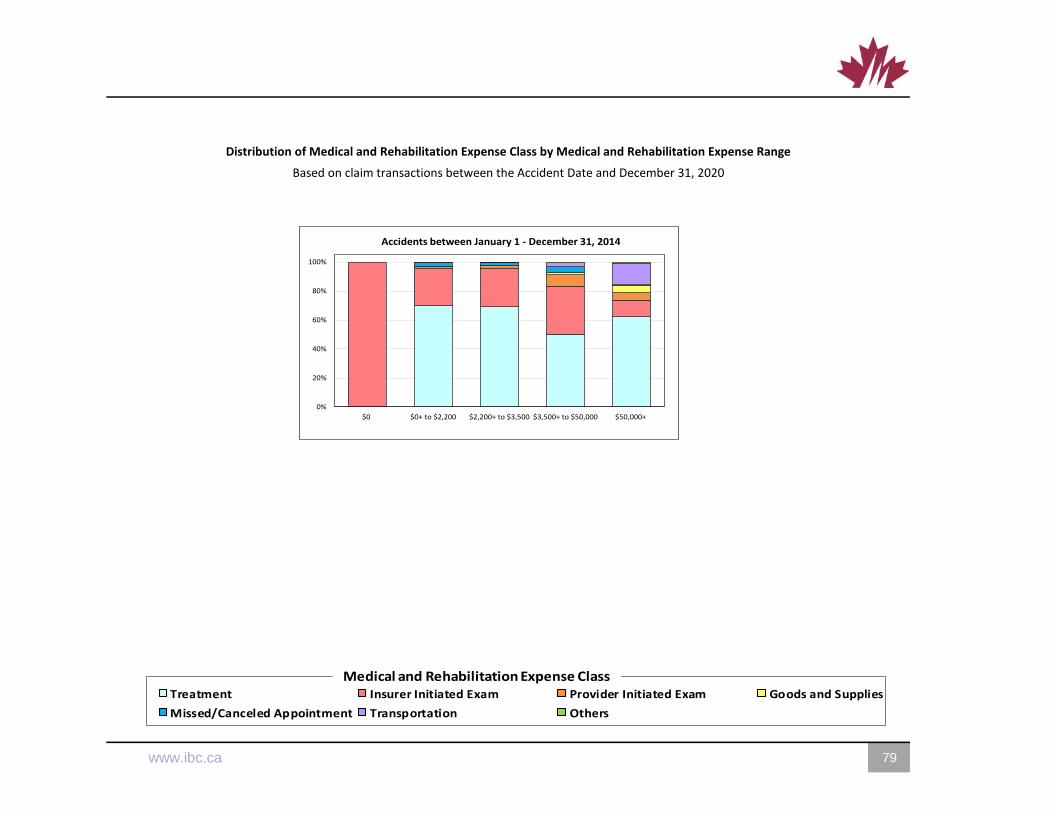
Distribution of Medical and Rehabilitation Expense Class by Medical and Rehabilitation Expense Range
Based on claim transactions between the Accident Date and December 31, 2020
2 www.ibc.ca www.ibc.ca 79
0%
20%
40%
60%
80%
100%
$0 $0+ to $2,200 $2,200+ to $3,500 $3,500+ to $50,000 $50,000+
Accidents between January 1 - December 31, 2014
0%
20%
40%
60%
80%
100%
$0 $0+ to $2,200 $2,200+ to $3,500 $3,500+ to $50,000 $50,000+
Accidents between July 1 - December 31, 2012
Treatment Insurer Initiated Exam Provider Initiated Exam Goods and Supplies
Missed/Canceled Appointment Transportation Others
Medical and Rehabilitation Expense Class
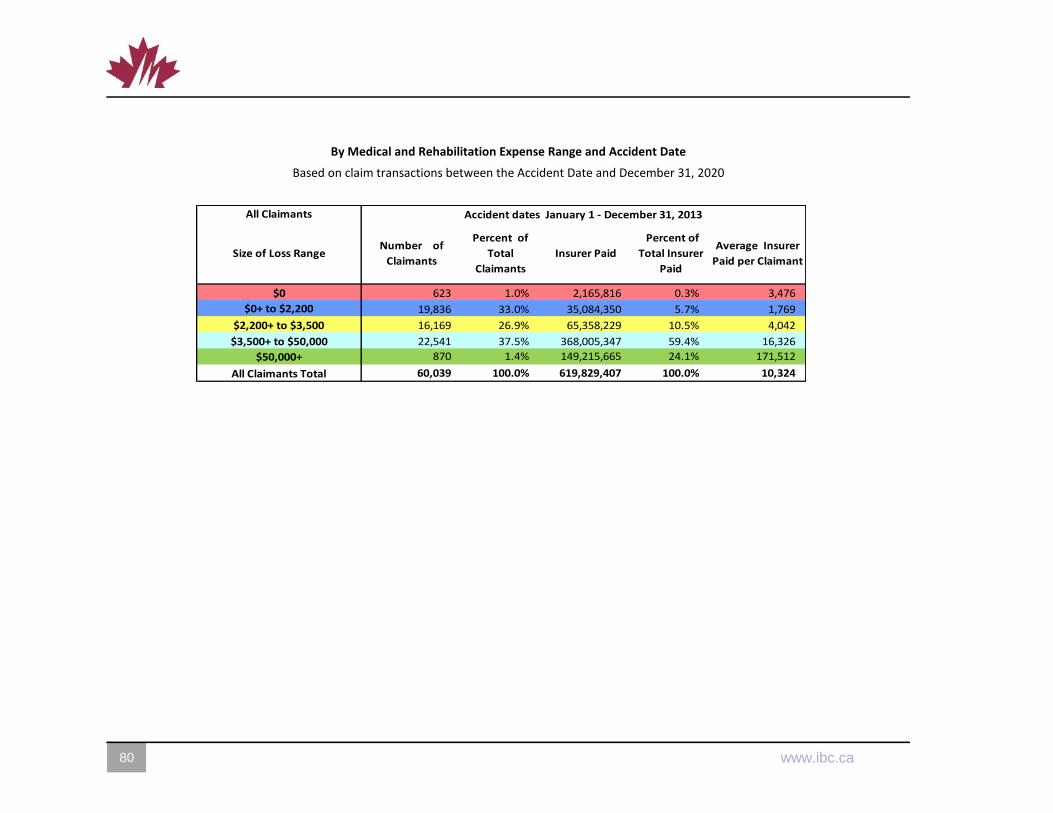
By Medical and Rehabilitation Expense Range and Accident Date
Based on claim transactions between the Accident Date and December 31, 2020
80 80 www.ibc.ca 3
Size of Loss RangeNumber of
Claimants
Percent of
Total
Claimants
Insurer Paid
Percent of
Total Insurer
Paid
Average Insurer
Paid per Claimant
623 1.0% 2,165,816 0.3% 3,476
$0+ to $2,200 19,836 33.0% 35,084,350 5.7% 1,769
16,169 26.9% 65,358,229 10.5% 4,042
22,541 37.5% 368,005,347 59.4% 16,326
870 1.4% 149,215,665 24.1% 171,512
60,039 100.0% 619,829,407 100.0% 10,324 All Claimants Total
$0
$2,200+ to $3,500
$3,500+ to $50,000
$50,000+
All Claimants Accident dates January 1 - December 31, 2013
Percentage Distribution of Expense Class by Medical and Rehabilitation Expense Range and Accident Date
Based on claim transactions between the Accident Date and December 31, 2020
2 www.ibc.ca www.ibc.ca 81
Size of Loss Range Treatment
Insurer
Initiated
Exam
Provider
Initiated
Exam
Goods and
Supplies
Missed/
Cancelled
Appointmen
t
Transportati
on
Others
0.0% 88.6% 0.0% 0.0% 0.0% 0.0% 0.0%
$0+ to $2,200 73.4% 26.9% 1.5% 0.2% 2.5% 0.5% 0.1%
70.1% 26.8% 1.9% 0.4% 1.8% 0.3% 0.1%
48.7% 32.1% 7.8% 1.6% 3.7% 2.6% 0.5%
60.0% 10.9% 5.0% 4.6% 0.6% 14.1% 1.1%
Accident dates January 1 - December 31, 2013
$0
$2,200+ to $3,500
$3,500+ to $50,000
All Claimants
$50,000+