INSURANCE AUSTRALIA GROUP LIMITED HALF YEAR REPORT … · insurance australia group limited half...
30
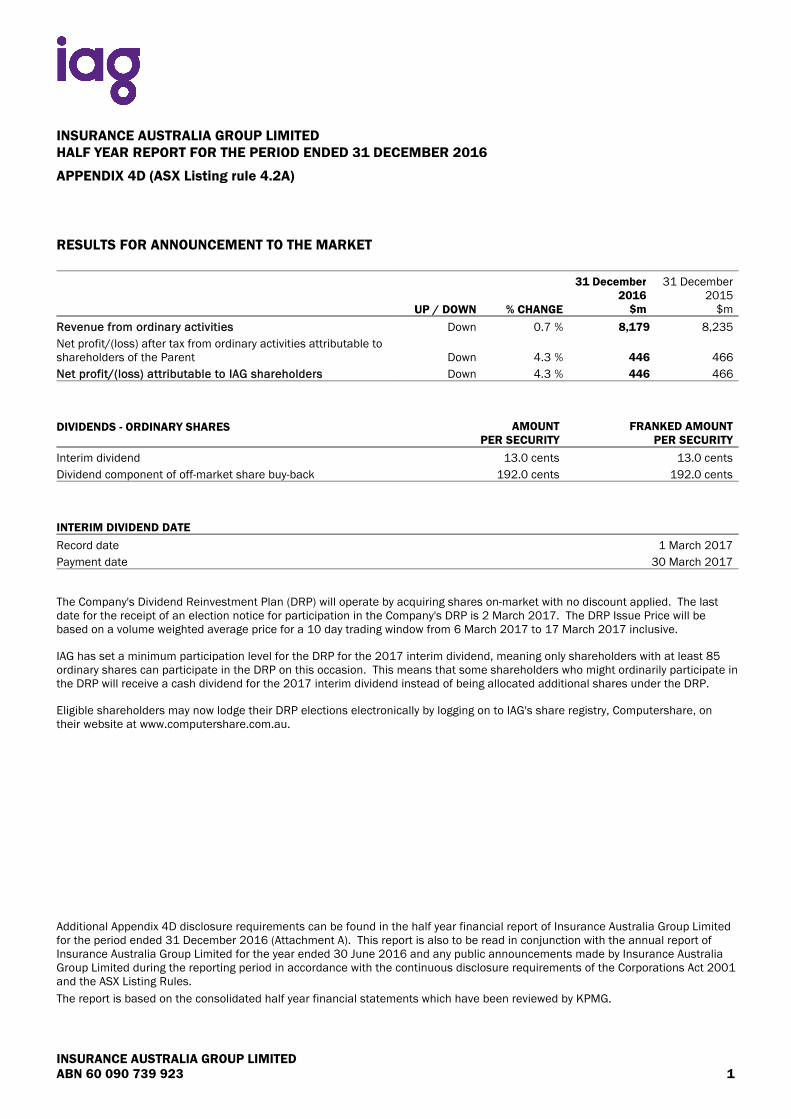
INSURANCE AUSTRALIA GROUP LIMITED HALF YEAR REPORT FOR THE PERIOD ENDED 31 DECEMBER 2016 APPENDIX 4D (ASX Listing rule 4.2A) RESULTS FOR ANNOUNCEMENT TO THE MARKET UP / DOWN % CHANGE 31 December 2016 $m 31 December 2015 $m Revenue from ordinary activities Down % 0.7 8,179 8,235 Net profit/(loss) after tax from ordinary activities attributable to shareholders of the Parent Down % 4.3 446 466 Net profit/(loss) attributable to IAG shareholders Down % 4.3 446 466 DIVIDENDS - ORDINARY SHARES AMOUNT PER SECURITY FRANKED AMOUNT PER SECURITY Interim dividend 13.0 cents 13.0 cents Dividend component of off-market share buy-back 192.0 cents 192.0 cents INTERIM DIVIDEND DATE Record date 1 March 2017 Payment date 30 March 2017 The Company's Dividend Reinvestment Plan (DRP) will operate by acquiring shares on-market with no discount applied. The last date for the receipt of an election notice for participation in the Company's DRP is 2 March 2017. The DRP Issue Price will be based on a volume weighted average price for a 10 day trading window from 6 March 2017 to 17 March 2017 inclusive. IAG has set a minimum participation level for the DRP for the 2017 interim dividend, meaning only shareholders with at least 85 ordinary shares can participate in the DRP on this occasion. This means that some shareholders who might ordinarily participate in the DRP will receive a cash dividend for the 2017 interim dividend instead of being allocated additional shares under the DRP. Eligible shareholders may now lodge their DRP elections electronically by logging on to IAG's share registry, Computershare, on their website at www.computershare.com.au. Additional Appendix 4D disclosure requirements can be found in the half year financial report of Insurance Australia Group Limited for the period ended 31 December 2016 (Attachment A). This report is also to be read in conjunction with the annual report of Insurance Australia Group Limited for the year ended 30 June 2016 and any public announcements made by Insurance Australia Group Limited during the reporting period in accordance with the continuous disclosure requirements of the Corporations Act 2001 and the ASX Listing Rules. The report is based on the consolidated half year financial statements which have been reviewed by KPMG. INSURANCE AUSTRALIA GROUP LIMITED ABN 60 090 739 923 1
Transcript of INSURANCE AUSTRALIA GROUP LIMITED HALF YEAR REPORT … · insurance australia group limited half...
INSURANCE AUSTRALIA GROUP LIMITEDHALF YEAR REPORT FOR THE PERIOD ENDED 31 DECEMBER 2016
APPENDIX 4D (ASX Listing rule 4.2A)
RESULTS FOR ANNOUNCEMENT TO THE MARKET
UP / DOWN % CHANGE
31 December2016
$m
31 December2015
$m
Revenue from ordinary activities Down %0.7 8,179 8,235
Net profit/(loss) after tax from ordinary activities attributable toshareholders of the Parent Down %4.3 446 466
Net profit/(loss) attributable to IAG shareholders Down %4.3 446 466
DIVIDENDS - ORDINARY SHARES AMOUNTPER SECURITY
FRANKED AMOUNTPER SECURITY
Interim dividend 13.0 cents 13.0 cents
Dividend component of off-market share buy-back 192.0 cents 192.0 cents
INTERIM DIVIDEND DATE
Record date 1 March 2017
Payment date 30 March 2017
The Company's Dividend Reinvestment Plan (DRP) will operate by acquiring shares on-market with no discount applied. The lastdate for the receipt of an election notice for participation in the Company's DRP is 2 March 2017. The DRP Issue Price will bebased on a volume weighted average price for a 10 day trading window from 6 March 2017 to 17 March 2017 inclusive.
IAG has set a minimum participation level for the DRP for the 2017 interim dividend, meaning only shareholders with at least 85ordinary shares can participate in the DRP on this occasion. This means that some shareholders who might ordinarily participate inthe DRP will receive a cash dividend for the 2017 interim dividend instead of being allocated additional shares under the DRP.
Eligible shareholders may now lodge their DRP elections electronically by logging on to IAG's share registry, Computershare, ontheir website at www.computershare.com.au.
Additional Appendix 4D disclosure requirements can be found in the half year financial report of Insurance Australia Group Limitedfor the period ended 31 December 2016 (Attachment A). This report is also to be read in conjunction with the annual report ofInsurance Australia Group Limited for the year ended 30 June 2016 and any public announcements made by Insurance AustraliaGroup Limited during the reporting period in accordance with the continuous disclosure requirements of the Corporations Act 2001and the ASX Listing Rules.
The report is based on the consolidated half year financial statements which have been reviewed by KPMG.
INSURANCE AUSTRALIA GROUP LIMITEDABN 60 090 739 923 1

ATTACHMENT A
INSURANCE AUSTRALIA GROUP LIMITED AND SUBSIDIARIES
HALF YEAR REPORT FOR THE PERIOD ENDED 31 DECEMBER 2016
INSURANCE AUSTRALIA GROUP LIMITEDABN 60 090 739 923 2

INSURANCE AUSTRALIA GROUPLIMITEDABN 60 090 739 923
FINANCIAL REPORTFOR THE HALF YEAR ENDED 31 DECEMBER 2016

INSURANCE AUSTRALIA GROUP LIMITEDTABLE OF CONTENTS
Directors' Report................................................................................................................................................................................................................................................................................................................................................................................................................................................................................................................................1
Lead Auditor's Independence Declaration................................................................................................................................................................................................................................................................................................................................................................................................................................................................................................................................11
Consolidated Financial Statements................................................................................................................................................................................................................................................................................................................................................................................................................................................................................................................................12
Directors' Declaration................................................................................................................................................................................................................................................................................................................................................................................................................................................................................................................................25
Independent Auditor's Review Report................................................................................................................................................................................................................................................................................................................................................................................................................................................................................................................................26

DIRECTORS' REPORTThe Directors present their report together with the consolidated financial report of Insurance Australia Group Limited and itssubsidiaries for the half year ended 31 December 2016 and the Auditor's Report thereon.
The following terminology is used throughout the financial report: IAG, Parent or Company - Insurance Australia Group Limited; and
Group or Consolidated - the Consolidated entity consists of Insurance Australia Group Limited and its subsidiaries.
DIRECTORS OF INSURANCE AUSTRALIA GROUP LIMITEDThe names and details of the Company's Directors in office at any time during or since the end of the half year are as follows.Directors were in office for the entire period unless otherwise stated.
Elizabeth Bryan (Director since 5 December 2014), Duncan Boyle (Director appointed 23 December 2016), Alison Deans (Directorsince 1 February 2013), Hugh Fletcher (Director since 1 September 2007), Peter Harmer (Director since 16 November 2015),Raymond Lim (Director from 1 February 2013 to 20 February 2017), Jonathan Nicholson (Director since 1 September 2015), HelenNugent (Director appointed 23 December 2016), Tom Pockett (Director since 1 January 2015) and Philip Twyman (Director since 9July 2008).
PRINCIPAL ACTIVITYThe principal continuing activity of the Group is the underwriting of general insurance and related corporate services and investingactivities. The Group reports its financial information under the following business divisions:
DIVISION OVERVIEW PRODUCTSConsumer Division(Australia)
53% of Group grosswritten premium(GWP)
Consumer insurance products are sold in Australia through branches, callcentres, the internet and representatives, under the following brands:
NRMA Insurance in NSW, ACT, Queensland and Tasmania;
SGIO in Western Australia;
SGIC in South Australia;
RACV in Victoria, via a distribution agreement with RACV;
Coles Insurance nationally, via a distribution agreement with Coles; and
CGU through affinity and financial institution partnerships and brokerand agent channels.
Consumer Division also includes travel insurance, life insurance, incomeprotection and funeral products which are underwritten by third parties.
Short tail insurance
Motor vehicle
Home and contents
Lifestyle and leisure,such as boat, veteranand classic car andcaravan
Long tail insurance
Compulsory Third Party(motor injury liability)
Business Division(Australia)
25% of Group GWP
Business insurance products are sold in Australia through a network ofaround 2,000 intermediaries, such as brokers, agents, motor dealershipsand financial institutions. Business Division is a leading provider ofbusiness and farm insurance, and also provides workers' compensationservices in every state and territory, except South Australia and Queensland.
Business Division operates across Australia under the following brands:
CGU Insurance;
Swann Insurance;
WFI;
NRMA Insurance;
RACV;
SGIC; and
SGIO.
Short tail insurance
Business packages
Farm and crop
Commercial property
Construction andengineering
Niche, such as consumercredit
Commercial motor andfleet motor
Marine
Long tail insurance
Workers' compensation
Professional indemnity
Directors' and officers'
Public and productsliability
1

DIVISION OVERVIEW PRODUCTSNew Zealand
19% of Group GWP
The New Zealand business is the leading general insurance provider in thecountry in both the direct and broker/agent channels. Insurance productsare provided directly to customers primarily under the State and AMI brands,and indirectly through insurance brokers and agents, under the NZI andLumley Insurance brands. Personal products and simplified commercialproducts are also distributed through agents and under third party brands bycorporate partners, which include large financial institutions.
Short tail insurance
Motor vehicle
Home and contents
Commercial property,motor and fleet motor
Construction andengineering
Niche, such as pleasurecraft, boat, caravan andtravel
Rural and horticultural
Marine
Long tail insurance
Personal liability
Commercial liability
Asia
3% of Group GWP
The Group has interests in five general insurance businesses in Asia, whichcomprises the direct and intermediated insurance business underwrittenthrough subsidiaries in Thailand, Vietnam and Indonesia and the share ofthe operating result from the investment in associates in Malaysia and India.The businesses offer personal and commercial insurance products throughlocal brands.
Corporate and other Corporate and other comprises other activities, including corporate services,capital management activity, shareholders’ funds investment activities andinward reinsurance from associates.
OPERATING AND FINANCIAL REVIEWOPERATING RESULT FOR THE HALF YEARDuring the half year ended 31 December 2016, IAG continued to deliver a sound operating performance, in an environment ofincreased claim cost pressures. GWP growth was slightly higher than expected, as IAG responded to those claim cost issues viaincreased premium rates, while the Group’s underlying margin was slightly softer than expected.
Short tail personal lines businesses in both Australia and New Zealand generated solid growth. While higher rates dominated GWPgrowth in the period, these were supplemented by ongoing volume advances in motor, in both markets. Underlying short tailprofitability was strong. Long tail Compulsory Third Party (CTP) profitability remained under pressure, particularly in NSW, where IAGhas a market-leading position. Regular rate increases in that market have countered claims inflation, serving to check any furtherdeterioration in current year profitability, however returns were poor.
Commercial lines reflected the earned-through effect of cumulative past rate reductions and volume loss. In Australia, there isevidence of pricing having passed the bottom of the cycle, with business retention levels proving better than expected. Thisresulted in a slightly improved underlying margin from the Business Division over the preceding half. In New Zealand, early signs ofcommercial rate improvement are emerging.
Asia delivered a lower result which was impacted by increased competitive pressures in both Thailand and Malaysia. This wasreflected in flat proportional GWP, despite strong ongoing growth in India.
Compared to the half year ended 31 December 2015, IAG’s reported insurance profit bore an increase in net natural peril claimcosts of over $140 million, influenced by the earthquake event in New Zealand in November 2016. Peril costs were countered byhigher prior period reserve releases from Australian long tail classes, which exceeded expectations.
IAG’s optimisation program saw a range of cost-out initiatives commenced in the current half year. Progress to date has been inline with expectations. As foreshadowed, a small net negative was borne within the current half year insurance profit, as modestinitial benefits were more than offset by related implementation costs.
Net profit after taxThe Group's profit after tax for the half year was $491 million (31 December 2015-$506 million). After adjusting for non-controllinginterests in the Group result, net profit attributable to the shareholders of the Company was $446 million (31 December 2015-$466 million) and was approximately 4% lower than the corresponding half year. This outcome included: a significantly higher contribution from investment income on shareholders’ funds, incorporating stronger equity market
returns; and
a higher tax rate of approximately 18%, compared to a 12% rate in the corresponding half year.
2 INSURANCE AUSTRALIA GROUP LIMITED
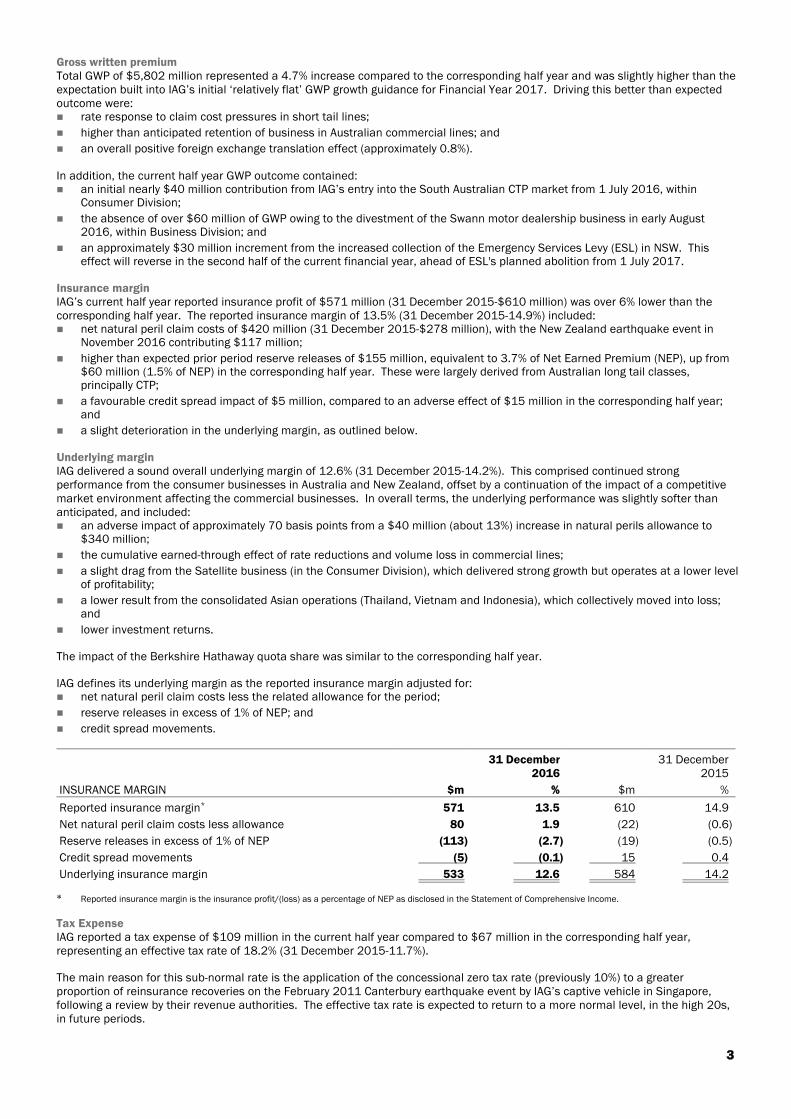
Gross written premiumTotal GWP of $5,802 million represented a 4.7% increase compared to the corresponding half year and was slightly higher than theexpectation built into IAG’s initial ‘relatively flat’ GWP growth guidance for Financial Year 2017. Driving this better than expectedoutcome were: rate response to claim cost pressures in short tail lines;
higher than anticipated retention of business in Australian commercial lines; and
an overall positive foreign exchange translation effect (approximately 0.8%).
In addition, the current half year GWP outcome contained: an initial nearly $40 million contribution from IAG’s entry into the South Australian CTP market from 1 July 2016, within
Consumer Division;
the absence of over $60 million of GWP owing to the divestment of the Swann motor dealership business in early August2016, within Business Division; and
an approximately $30 million increment from the increased collection of the Emergency Services Levy (ESL) in NSW. Thiseffect will reverse in the second half of the current financial year, ahead of ESL's planned abolition from 1 July 2017.
Insurance marginIAG’s current half year reported insurance profit of $571 million (31 December 2015-$610 million) was over 6% lower than thecorresponding half year. The reported insurance margin of 13.5% (31 December 2015-14.9%) included: net natural peril claim costs of $420 million (31 December 2015-$278 million), with the New Zealand earthquake event in
November 2016 contributing $117 million;
higher than expected prior period reserve releases of $155 million, equivalent to 3.7% of Net Earned Premium (NEP), up from$60 million (1.5% of NEP) in the corresponding half year. These were largely derived from Australian long tail classes,principally CTP;
a favourable credit spread impact of $5 million, compared to an adverse effect of $15 million in the corresponding half year;and
a slight deterioration in the underlying margin, as outlined below.
Underlying marginIAG delivered a sound overall underlying margin of 12.6% (31 December 2015-14.2%). This comprised continued strongperformance from the consumer businesses in Australia and New Zealand, offset by a continuation of the impact of a competitivemarket environment affecting the commercial businesses. In overall terms, the underlying performance was slightly softer thananticipated, and included: an adverse impact of approximately 70 basis points from a $40 million (about 13%) increase in natural perils allowance to
$340 million;
the cumulative earned-through effect of rate reductions and volume loss in commercial lines;
a slight drag from the Satellite business (in the Consumer Division), which delivered strong growth but operates at a lower levelof profitability;
a lower result from the consolidated Asian operations (Thailand, Vietnam and Indonesia), which collectively moved into loss;and
lower investment returns.
The impact of the Berkshire Hathaway quota share was similar to the corresponding half year.
IAG defines its underlying margin as the reported insurance margin adjusted for: net natural peril claim costs less the related allowance for the period;
reserve releases in excess of 1% of NEP; and
credit spread movements.
31 December2016
31 December2015
INSURANCE MARGIN $m % $m %
Reported insurance margin* 571 13.5 610 14.9
Net natural peril claim costs less allowance 80 1.9 (22) (0.6)
Reserve releases in excess of 1% of NEP (113) (2.7) (19) (0.5)
Credit spread movements (5) (0.1) 15 0.4
Underlying insurance margin 533 12.6 584 14.2
* Reported insurance margin is the insurance profit/(loss) as a percentage of NEP as disclosed in the Statement of Comprehensive Income.
Tax ExpenseIAG reported a tax expense of $109 million in the current half year compared to $67 million in the corresponding half year,representing an effective tax rate of 18.2% (31 December 2015-11.7%).
The main reason for this sub-normal rate is the application of the concessional zero tax rate (previously 10%) to a greaterproportion of reinsurance recoveries on the February 2011 Canterbury earthquake event by IAG’s captive vehicle in Singapore,following a review by their revenue authorities. The effective tax rate is expected to return to a more normal level, in the high 20s,in future periods.
3

The tax rate in the corresponding half year was also abnormally low, owing to the combination of the favourable resolution of a taxaudit associated with IAG’s former UK operations and further reinsurance recoveries relating to the September 2010 Canterburyearthquake event, as recognised by IAG’s captive vehicle.
Other contributory elements reconciling the effective tax rate to the prevailing Australian corporate rate of 30% are: differences in tax rates applicable to IAG’s foreign operations, principally in New Zealand, Singapore and Malaysia; and
franking credits generated from IAG’s investment portfolio.
Investment income on shareholders’ fundsInvestment income on shareholders’ funds was a profit of $109 million, a substantial increase on the profit of $52 million in thecorresponding half year. This was driven by a stronger equity market performance, with the broader Australian index (S&P ASX200Accumulation) delivering a return of 10.6% (31 December 2015-negative 0.5%). The MSCI World Total Return Index (AUD Hedged)also had a similar increase (31 December 2015-negative 1.3%).
At 31 December 2016 the weighting to growth assets (equities and alternatives) within shareholders’ funds stood at approximately48% (31 December 2015-48%).
A. CONSUMER DIVISION (AUSTRALIA)The Australian Consumer Division accounted for 53% of Group GWP and produced a strong, but slightly lower, underlying margin of14.1%.
I. PremiumsThe Consumer Division’s GWP increased by 7.4% to $3,060 million in the current half compared to $2,848 million in thecorresponding half year, and included growth in both short tail home and motor lines, as well as long tail CTP.
Short tail personal lines represented approximately 85% of divisional GWP, and grew by 6.6%. The growth was predominantly rate-driven, partly in response to higher than originally expected claims inflation, notably in motor. Higher levy collection and anincrease in the average sum insured were also features in home. Rate-related GWP growth was augmented by volume gain inmotor, while home volumes were stable. Long tail CTP GWP increased by 12.4%, embracing IAG’s entry into the South Australianmarket from 1 July 2016 and cumulative rate increases in NSW to combat ongoing elevated claim frequency.
II. Insurance profitThe Consumer Division reported an insurance profit of $461 million, compared to $495 million in the corresponding half year. Thisequates to a lower reported insurance margin of 21.5% compared to 24.6% in the corresponding half year, and included the neteffect of: lower reserve releases;
higher net natural peril claim costs;
a favourable credit spread movement of $12 million;
a lower underlying investment return; and
higher expenses, including those related to ESL.
B. BUSINESS DIVISION (AUSTRALIA)The Australian Business Division accounted for 25% of Group GWP and generated a better-than-expected flat GWP result. A lowerunderlying margin reflected the earned-through effect of past rate and volume declines, but represented a modest improvementover the preceding half year. A lower reported margin housed an adverse natural peril claim cost experience and slightly lowerreserve releases.
I. PremiumsThe Business Division reported flat GWP of $1,423 million, compared to $1,419 million in the corresponding half. After allowancefor the divestment of the Swann Insurance motor dealer business, like-for-like GWP was over 4% higher. This outcome comprised: a relatively steady policy count, with higher than expected retention levels achieved in key portfolios;
lower new business opportunities and volumes; and
further increases in rates in most classes.
The Swann Insurance motor dealer, finance broker and fleet network business was divested at the beginning of August 2016 andresulted in a contraction in GWP of approximately $61 million, compared to the corresponding half year.
II. Insurance profitThe Business Division reported a lower insurance profit of $81 million, compared to $100 million in the corresponding half year.This equates to a reported insurance margin of 7.1% (31 December 2015-8.4%) and includes the net effect of: a similar net natural peril claim cost;
slightly lower prior period reserve releases;
a favourable credit spread movement of $8 million; and
lower investment returns.
4 INSURANCE AUSTRALIA GROUP LIMITED
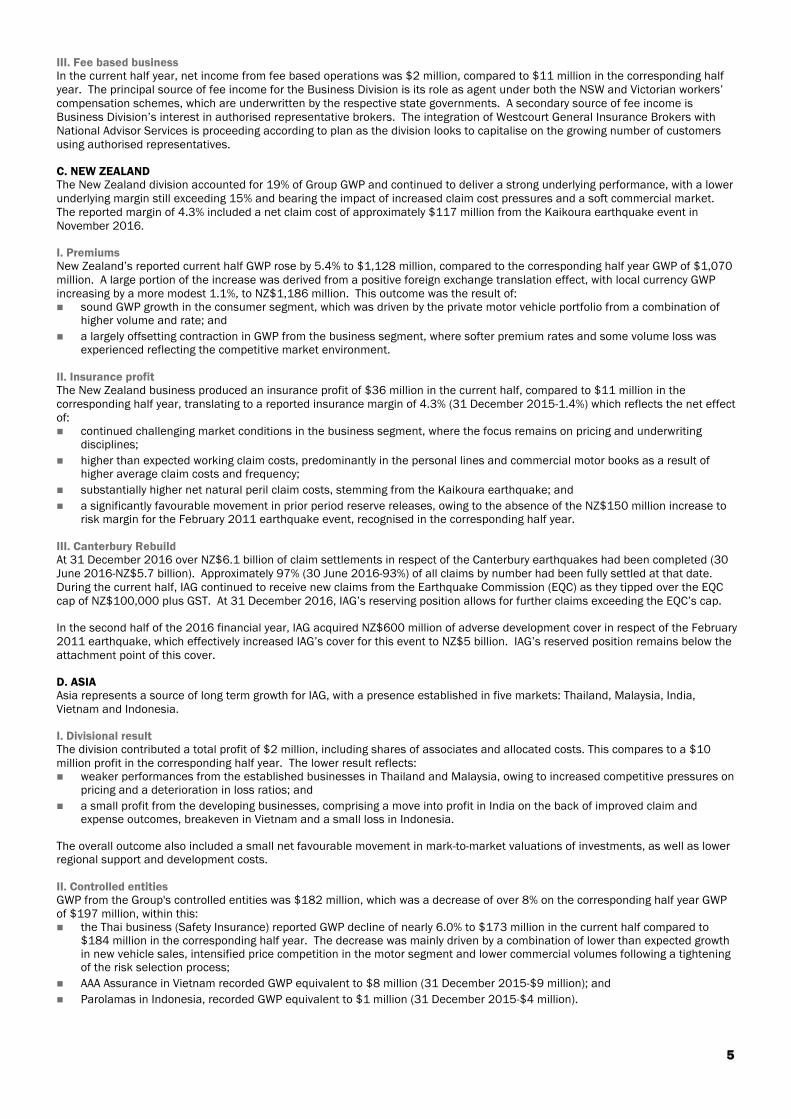
III. Fee based businessIn the current half year, net income from fee based operations was $2 million, compared to $11 million in the corresponding halfyear. The principal source of fee income for the Business Division is its role as agent under both the NSW and Victorian workers’compensation schemes, which are underwritten by the respective state governments. A secondary source of fee income isBusiness Division’s interest in authorised representative brokers. The integration of Westcourt General Insurance Brokers withNational Advisor Services is proceeding according to plan as the division looks to capitalise on the growing number of customersusing authorised representatives.
C. NEW ZEALANDThe New Zealand division accounted for 19% of Group GWP and continued to deliver a strong underlying performance, with a lowerunderlying margin still exceeding 15% and bearing the impact of increased claim cost pressures and a soft commercial market.The reported margin of 4.3% included a net claim cost of approximately $117 million from the Kaikoura earthquake event inNovember 2016.
I. PremiumsNew Zealand’s reported current half GWP rose by 5.4% to $1,128 million, compared to the corresponding half year GWP of $1,070million. A large portion of the increase was derived from a positive foreign exchange translation effect, with local currency GWPincreasing by a more modest 1.1%, to NZ$1,186 million. This outcome was the result of: sound GWP growth in the consumer segment, which was driven by the private motor vehicle portfolio from a combination of
higher volume and rate; and
a largely offsetting contraction in GWP from the business segment, where softer premium rates and some volume loss wasexperienced reflecting the competitive market environment.
II. Insurance profitThe New Zealand business produced an insurance profit of $36 million in the current half, compared to $11 million in thecorresponding half year, translating to a reported insurance margin of 4.3% (31 December 2015-1.4%) which reflects the net effectof: continued challenging market conditions in the business segment, where the focus remains on pricing and underwriting
disciplines;
higher than expected working claim costs, predominantly in the personal lines and commercial motor books as a result ofhigher average claim costs and frequency;
substantially higher net natural peril claim costs, stemming from the Kaikoura earthquake; and
a significantly favourable movement in prior period reserve releases, owing to the absence of the NZ$150 million increase torisk margin for the February 2011 earthquake event, recognised in the corresponding half year.
III. Canterbury RebuildAt 31 December 2016 over NZ$6.1 billion of claim settlements in respect of the Canterbury earthquakes had been completed (30June 2016-NZ$5.7 billion). Approximately 97% (30 June 2016-93%) of all claims by number had been fully settled at that date.During the current half, IAG continued to receive new claims from the Earthquake Commission (EQC) as they tipped over the EQCcap of NZ$100,000 plus GST. At 31 December 2016, IAG’s reserving position allows for further claims exceeding the EQC’s cap.
In the second half of the 2016 financial year, IAG acquired NZ$600 million of adverse development cover in respect of the February2011 earthquake, which effectively increased IAG’s cover for this event to NZ$5 billion. IAG’s reserved position remains below theattachment point of this cover.
D. ASIAAsia represents a source of long term growth for IAG, with a presence established in five markets: Thailand, Malaysia, India,Vietnam and Indonesia.
I. Divisional resultThe division contributed a total profit of $2 million, including shares of associates and allocated costs. This compares to a $10million profit in the corresponding half year. The lower result reflects: weaker performances from the established businesses in Thailand and Malaysia, owing to increased competitive pressures on
pricing and a deterioration in loss ratios; and
a small profit from the developing businesses, comprising a move into profit in India on the back of improved claim andexpense outcomes, breakeven in Vietnam and a small loss in Indonesia.
The overall outcome also included a small net favourable movement in mark-to-market valuations of investments, as well as lowerregional support and development costs.
II. Controlled entitiesGWP from the Group's controlled entities was $182 million, which was a decrease of over 8% on the corresponding half year GWPof $197 million, within this: the Thai business (Safety Insurance) reported GWP decline of nearly 6.0% to $173 million in the current half compared to
$184 million in the corresponding half year. The decrease was mainly driven by a combination of lower than expected growthin new vehicle sales, intensified price competition in the motor segment and lower commercial volumes following a tighteningof the risk selection process;
AAA Assurance in Vietnam recorded GWP equivalent to $8 million (31 December 2015-$9 million); and
Parolamas in Indonesia, recorded GWP equivalent to $1 million (31 December 2015-$4 million).
5

During the current half, the controlled entities incurred an insurance loss of $2 million (31 December 2015-profit of $10 million)excluding allocated regional development costs. Within this: the Thai business reported a breakeven result at the insurance profit line, compared to a $10 million profit in the
corresponding half year, with the weaker outcome driven by a higher number of large losses in the engineering and fire classesand prior period reserve strengthening for those classes;
AAA Assurance reported a breakeven result compared to an insurance loss of $1 million in the corresponding half year; and
Parolamas in Indonesia contributed an insurance loss of $2 million compared to a profit of $1 million in the corresponding halfyear.
III. Share of net profit/(loss) of associatesThe Group's share of associates was a profit of $16 million (31 December 2015-$15 million), excluding allocated regionaldevelopment costs and before amortisation. This result includes AmGeneral Holdings Berhad (AmGeneral) in Malaysia and SBIGeneral Insurance Company Limited (SBI General) in India.
IAG’s share of AmGeneral's profit for the half year decreased to $10 million (31 December 2015-$17 million). The reductionresulted from a combination of: reduced NEP on the back of lower average premiums in the face of increased competition;
a higher loss ratio of 66.7% (31 December 2015-64.3%), including the influence of higher repair costs arising from thefranchise partnerships business and the adverse impact of the ringgit’s depreciation;
higher administration expenses from accelerated project costs, including those associated with detariffication; and
the absence of the prior period reinsurance recoveries which were included in the corresponding half year.
IAG’s share of SBI General's profit for the half year increased to $6 million (31 December 2015-loss of $2 million). This positiveoutcome comprised the net effect of: a lower loss ratio arising from reduced claims frequency alongside a favourable monsoon season in the current half year,
partially offset by deterioration in the motor business;
an improved expense ratio resulting from tightened cost control; and
higher investment income bolstered by business growth and a favourable mark-to-market movement in technical reservesincome.
E. CORPORATE AND OTHERA pre-tax profit of $18 million was reported, which compares to a loss of $56 million in the corresponding prior half year,predominantly due to higher investment income on shareholders’ funds net of investment fees. The results also include a smallloss on divestment of the Swann Insurance car dealership business.
Further details on the operating segments are set out in note 1.3 segment reporting within the Financial Statements.
REVIEW OF FINANCIAL CONDITIONA. FINANCIAL POSITIONThe total assets of the Group as at 31 December 2016 were $29,266 million compared to $30,030 million at 30 June 2016.Movements within the overall decrease of $764 million include: a decrease in investments of $632 million from the funds outflow associated with the payment of the 2016 final dividend,
redemption of the GBP subordinated term notes and NZD subordinated bonds, the partial buy-back of convertible preferenceshares and the off-market share buy-back, partially offset by sound operating earnings for the half year and the net proceedsfrom the issue of capital notes;
trade and other receivables decreased by $554 million, largely due to settlement of reinsurance recoveries pertaining to the2010 and 2011 New Zealand earthquakes and a higher level of broker collections; and
an increase in reinsurance and other recoveries on outstanding claims by $251 million, predominantly due to recoveriesrelating to the Kaikoura earthquake, partially offset by the continued settlement of the 2010 and 2011 New Zealandearthquakes and other prior period natural peril events.
The total liabilities of the Group as at 31 December 2016 were $22,655 million compared to $23,245 million at 30 June 2016.The decrease in liabilities of $590 million is mainly attributable to: a decrease in outstanding claims liability of $213 million, primarily due to prior year reserve releases from long tail classes
(predominantly CTP), higher discount rates impacting claim reserves and settlements on prior year events, partially offset bythe Kaikoura earthquake and the trans-Tasman storm claim reserves;
interest bearing liabilities decreased by $184 million predominantly due to the redemption of NZD subordinated bonds ($179million) and GBP subordinated term notes ($171 million) and partial buy-back of convertible preference shares ($224 million),offset by the issuance of capital notes ($404 million); and
a decrease in provisions of $112 million, primarily due to the settlement of the prior year short term incentive and restructurecosts.
IAG shareholders’ equity (excluding non-controlling interests) decreased from $6,563 million at 30 June 2016 to $6,388 million at31 December 2016, reflecting the combined effect of: a sound earnings performance in the current half year, resulting in a net profit attributable to shareholders of $446 million;
payment of the final dividend of $316 million declared in respect of the 2016 financial year; and
the off-market ordinary share buy-back of $316 million (including transaction costs).
6 INSURANCE AUSTRALIA GROUP LIMITED
B. CASH FROM OPERATIONSThe net cash inflows from operating activities for the half year ended 31 December 2016 were $469 million compared to net cashoutflows of $1,082 million for the corresponding half year. The movement is mainly attributable to the net effect of: an increase in reinsurance and other recoveries received of $686 million, predominantly due to recoveries under the Berkshire
Hathaway quota share and continued collection of recoveries pertaining to the 2010 and 2011 New Zealand earthquakes;
a decrease in claims costs paid of $407 million, mainly attributable to the period-on-period reduction in payments made inrespect of the 2010 and 2011 New Zealand earthquakes; and
a decrease in outward reinsurance premium expense paid of $147 million, primarily due to a slight decrease in premiumpayments to Berkshire Hathaway under the quota share agreement and the savings achieved on the renewal of the calendar2016 catastrophe reinsurance covers.
C. INVESTMENTSThe Group’s investments totalled $12.3 billion as at 31 December 2016, excluding investments held in joint ventures andassociates, with over 67% represented by the technical reserves portfolio. Total investments at 30 June 2016 were $12.9 billion.The decrease in total investments since 30 June 2016 reflects the combined effect of: further reduction in technical reserves, mirroring the progressive effect of the 20% quota share in lowering related insurance
liabilities; and
the net reduction in shareholders’ funds, where dividend payments ($316 million) and completion of the off-market share buy-back for a consideration of $316 million (including transaction costs) exceeded operating earnings during the period.
Since 30 June 2016, the main change to asset allocation has been a marginally higher weighting to growth asset categories withinshareholders’ funds. As at 31 December 2016, the Group’s overall investment allocation remains conservatively positioned, with84% of total investments in fixed interest and cash. Technical reserves were 100% invested in fixed interest and cash, while theequivalent figure for shareholders’ funds was 52%.
D. INTEREST BEARING LIABILITIESThe Group’s interest bearing liabilities stood at $1,778 million at 31 December 2016, compared to $1,962 million at 30 June2016. The net decrease of $184 million predominantly comprises: the issue of $404 million capital notes, qualifying as Additional Tier 1 Capital;
the buy-back of $224 million convertible preference shares, as part of the reinvestment offer accompanying the capital notesissue;
the redemption of NZ$187 million subordinated bonds ($179 million as of the redemption date); and
the redemption of £100 million subordinated term notes ($171 million as of the redemption date).
E. CAPITAL MIXThe Group measures its capital mix on a net tangible equity basis, i.e. after deduction of goodwill and intangibles, giving it strongalignment with regulatory and rating agency models. It is IAG’s intention to have a capital mix in the following ranges over thelonger term: ordinary equity (net of goodwill and intangibles) 60-70%; and
debt and hybrids 30-40%.
At 31 December 2016, the Group’s capital mix stood close to the mid-point of its targeted range, with debt and hybridsrepresenting 35.4% (30 June 2016-36.8%) of total tangible capitalisation.
F. CAPITAL MANAGEMENTThe Group remains strongly capitalised under APRA's Prudential Standards, with regulatory capital of $4,500 million at 31December 2016 (30 June 2016-$4,619 million). The Group has set the following related targeted benchmarks: a total capital position equivalent to 1.4 to 1.6 times the Prescribed Capital Amount (PCA), compared to a regulatory
requirement of 1.0 times; and
a Common Equity Tier 1 (CET1) target range of 0.9 to 1.1 times the PCA, compared to a regulatory requirement of 0.6 times.
At 31 December 2016, the Group had a PCA multiple of 1.81 (30 June 2016-1.72) and a CET1 multiple of 1.09 (30 June 2016-1.06).
7

STRATEGY AND RISK MANAGEMENTA. STRATEGY At IAG, our purpose is to make your world a safer place: IAG’s purpose means that whether you are a customer, partner,
employee, shareholder or part of the communities IAG serves across Australia, New Zealand or Asia, IAG exists to ‘make yourworld a safer place’. IAG believes its purpose will enable it to become a more sustainable business over the long term, anddeliver stronger and more consistent returns for its shareholders.
IAG’s opportunity is to embrace innovation: The way we live our lives is changing at a rapid pace driven by new technologiesand shifting demographic trends. This means our customers are faced with new challenges and opportunities every day. IAGis determined to lead, helping our customers navigate through this journey and using innovation to make their lives safer andbetter.
Our promise is to deliver world class customer experiences: All the elements of our strategy are driven by our customer’sneeds. As well as delivering world class customer experiences, we will make IAG as successful as possible so that we canreinvest in our leadership position.
Financial targetsIAG is focused on delivering through-the-cycle targets of: Cash return on equity (ROE) 1.5x weighted average cost of capital (WACC); High dividend (60-80% of cash earnings payout); Top quartile total shareholder return (TSR); and Approximately 10% compound earnings per share (EPS) growth.
Strategic themesIAG is focused on optimising its core business and building the necessary platforms for future growth. IAG has identified two keystrategic themes to deliver this strategy:I. Leading: IAG is determined to lead the change that its customers need and demand. This has the company’s customers at its core and
IAG will embrace innovation and new technology to make each individual interaction a world class experience. This will bedriven by: Deepening customer intimacy through digitally-enabled customer experiences, providing needs-based customer
propositions and creating ecosystems of relevant adjacent services alongside insurance to help make customers’ livessafer and fulfil IAG’s purpose.
Partnering selectively to complement and strengthen our capabilities, incorporating third party offerings in ourecosystems and investing in new ventures and incubation.
II. Fuelling: IAG will fuel the business so that it can deliver on these opportunities. This involves tackling necessary changes to the way IAG
operates – simplifying processes and systems, and optimising resources, to be more efficient. This will be driven by: Optimising our core through simplification and scalability and becoming an agile organisation so that we can deliver
inspiring customer experiences with less cost and complexity. Modularising our operating and capital platforms so that the business can derive maximum value from each component
of the value chain, including offering elements on a fee-for-service basis where they strengthen our competitiveadvantage and partnering for capability in areas that are not a competitive advantage.
B. BUSINESS RISK AND RISK MANAGEMENTManaging risk is central to the sustainability of IAG's business, its purpose and delivery of value to shareholders. IAG uses anenterprise approach to risk and its risk management framework is a core part of the governance structure and includes internalpolicies, key management processes and culture. The Risk Management Strategy (RMS) is reviewed annually or as required by theRisk Committee (RC) before being recommended for approval by the Board. IAG’s risk and governance function provides regularreports to the RC on the operation of IAG’s risk management framework, the status of key risks, risk and compliance incidents andrisk framework changes. IAG’s Internal Audit function provides reports to the Audit Committee (AC) on significant audit findings andother audit related matters.
Roles and responsibilities of the Board and its standing committees, the AC, the RC, the People and Remuneration Committee(PARC) and the Nominations Committee, are set out in the Corporate Governance section of the IAG website.
The Group is exposed to multiple risks relating to the conduct of its general insurance business. The following risks noted beloware not meant to represent an exhaustive list, but the risks faced by the Group that have been identified by the RMS process: strategic risk: the risk of not achieving corporate or strategic goals;
insurance risk: the risk that the Group is exposed to financial loss, as a result of inadequate or inappropriate underwriting,inadequate or inappropriate product pricing, unforeseen, unknown or unintended liabilities that may eventuate, inadequate orinappropriate claims management including reserving or insurance concentration risk (i.e. by locality, segment factor ordistribution);
reinsurance risk: the risk of insufficient or inappropriate reinsurance coverage, inadequate underwriting and pricing ofreinsurance exposures retained by IAG’s reinsurance captives, inadequate or inappropriate reinsurance recovery management,reinsurance arrangements not being legally binding and reinsurance concentration risk;
financial risk: the risk of inadequate liquidity, adverse movements in market prices (equities, derivatives, interest rates, foreignexchange, etc.) or inappropriate concentration within investment funds, a counterparty failing to meet its obligations and/orinappropriate capital management; and
operational risk: the risk of loss from inadequate or failed internal processes, people, systems and/or external events.
8 INSURANCE AUSTRALIA GROUP LIMITED

A disciplined approach to risk management has been adopted and IAG believes this approach provides the greatest long termlikelihood of being able to meet the objectives of all stakeholders, including policyholders, lenders, regulators and shareholders.
Detail of the Group's overall risk management framework, which is outlined in the RMS, is set out in note 3.1 risk and capitalmanagement in the 30 June 2016 Annual Report and in the Corporate Governance Statement, which is available atwww.iag.com.au/about-us/corporate-governance.
OUTLOOK IAG continues to expect to record a sound operating performance for the year ended 30 June 2017.
Following the current half year GWP growth of 4.7%, IAG has raised its GWP guidance to one of ‘low single digit growth’, comparedto its previous ‘relatively flat’ prediction. The Group’s reported margin guidance for the year ended 30 June 2017 remains at 12.5-14.5%, with an expected outcome around the middle of the range. This incorporates slightly softer underlying profitability thanoriginally anticipated, countered by an increase in prior period reserve release expectations. Underlying assumptions behind thereported margin guidance are: net losses from natural perils in line with an allowance of $680 million (2016-$600 million);
prior period reserve releases of at least 2% of NEP (previously at least 1%);
no material movement in foreign exchange rates or investment markets in the second half of the current financial year; and
a small net negative from optimisation program initiatives, as early benefits are outweighed by related costs.
It is too early to determine the net cost of the Northern Sydney hailstorm, which occurred on 18 February 2017. In this guidance,IAG has assumed the net cost, together with further perils in the current year, will be within the current perils allowance andavailable reinsurance cover. IAG’s reinsurance cover, post-quota share, comprises: a calendar 2017 main catastrophe program which limits a first event exposure to $200 million;
a calendar 2017 aggregate cover which provides $380 million of protection excess of $260 million, with qualifying eventscapped at $180 million excess of $20 million per event; and
a 2017 financial year specific cover which provides $96 million of protection directly above the $680 million perils allowance.
While IAG now expects prior period reserve releases of at least 2% of NEP in the current financial year, it remains the Group’s beliefthat long term reserve releases of around 1% of NEP are a recurring feature of its reported operating results in benign inflationaryperiods.
DIVIDENDSDetails of dividends paid or determined to be paid by the Company and the dividend policy employed by the Group are set out innote 2.3 dividends within the Financial Statements.
Cash earnings are used for the purposes of targeted ROE and dividend payout policy and are defined as: net profit after tax attributable to IAG shareholders;
plus amortisation and impairment of acquired identifiable intangibles; and
excluding any unusual items (non-recurring in nature).
31 December2016
31 December2015
CASH EARNINGS $m $m
Net profit after tax 446 466
Acquired intangible amortisation and impairment 29 28
475 494Non-recurring items:
Corporate expenses 4 14
Tax effect on corporate expenses - (4)
Cash earnings* 479 504
Interim dividend 308 316
Cash payout ratio* 64.3% 62.7%
* Cash earnings and cash payout ratio represent non-IFRS financial information.
IAG's full year dividend payout policy is to pay dividends equivalent to approximately 60-80% (31 December 2015-60-80%) ofreported full year cash earnings in respect of any given financial year.
The Board has determined to pay a fully franked interim dividend of 13 cents per ordinary share (cps) (31 December 2015-13.0 cpsand a fully franked special dividend of 10.0 cps). The interim dividend is payable on 30 March 2017 to shareholders registered asat 5pm on 1 March 2017.
9

The Company's Dividend Reinvestment Plan (DRP) will operate for the interim dividend by acquiring shares on-market with nodiscount applied. The DRP Issue Price will be based on a volume weighted average share price as defined in the DRP terms. IAGhas set a minimum participation level for the DRP for the 2017 interim dividend, meaning only shareholders with at least 85ordinary shares can participate in the DRP on this occasion. This means that some shareholders who might ordinarily participate inthe DRP will receive a cash dividend for the 2017 interim dividend instead of being allocated additional shares under the DRP. Thelast date for the receipt of an election notice for participation in the Company's DRP is 2 March 2017. Information about IAG’s DRPis available at www.iag.com.au/shareholder-centre/dividends/reinvestment.
SIGNIFICANT CHANGES IN STATE OF AFFAIRSDuring the half year, the following changes became effective: On 10 October 2016, IAG completed its ordinary share off-market buy-back, with IAG acquiring 64 million shares (representing
2.6% of IAG's issued share capital) for a consideration of $316 million (including transaction costs). The buy-back price pershare was $4.91, which comprised a capital component of $2.99 and a fully franked dividend of $1.92.
On 15 December 2016, IAG redeemed NZ$187 million of subordinated bonds ($179 million as of the redemption date).
On 21 December 2016, IAG redeemed £100 million of subordinated term notes ($171 million as of the redemption date).
On 22 December 2016, IAG bought back $224 million of convertible preference shares, the proceeds received by holders werereinvested in capital notes (refer below).
On 22 December 2016, IAG issued $404 million of capital notes including the above mentioned reinvestment. The notesqualify as Additional Tier 1 Capital under APRA's Prudential Framework for General Insurance.
EVENTS SUBSEQUENT TO REPORTING DATEDetail of matters subsequent to the end of the half year are set out below and in note 3.6 events subsequent to reporting datewithin the Financial Statements. These include: On 18 February 2017, a large hailstorm event impacted parts of the Northern Sydney region. As at 21 February 2017, IAG had
received more than 13,000 claims in relation to this event. Given the proximity of the occurrence of this event to the reportingdate, it has not yet been possible to reliably determine its cost to the Group. Once determined, this cost will be recognised inthe Group’s results for the second half of the financial year.
On 22 February 2017, the Board determined to pay an interim dividend of 13 cents per share, 100% franked. The dividend willbe paid on 30 March 2017. The dividend reinvestment plan will operate by acquiring shares on-market for participants with nodiscount applied. IAG has set a minimum participation level for the DRP for the 2017 interim dividend, meaning onlyshareholders with at least 85 ordinary shares can participate in the DRP on this occasion. This means that some shareholderswho might ordinarily participate in the DRP will receive a cash dividend for the 2017 interim dividend instead of being allocatedadditional shares under the DRP.
LEAD AUDITOR'S INDEPENDENCE DECLARATION UNDER SECTION 307C OF THE CORPORATIONS ACT2001The lead auditor's independence declaration is set out on page 11 and forms part of the Directors' Report for the half year ended31 December 2016.
Signed at Sydney this 22nd day of February 2017 in accordance with a resolution of the Directors.
Peter HarmerDirector
10 INSURANCE AUSTRALIA GROUP LIMITED

LEAD AUDITOR'SINDEPENDENCE DECLARATIONUNDER SECTION 307C OF THE CORPORATIONS ACT 2001
TO THE DIRECTORS OF INSURANCE AUSTRALIA GROUP LIMITED
I declare that, to the best of my knowledge and belief, in relation to the review for the half year ended 31 December 2016 therehave been: no contraventions of the auditor independence requirements as set out in the Corporations Act 2001 in relation to the review;
and
no contraventions of any applicable code of professional conduct in relation to the review.
KPMG
Andrew YatesPartner
Sydney22 February 2017
11KPMG, an Australian partnership and a member firm of the KPMG network of independent member firms affiliated with KPMG International Cooperative ("KPMGInternational"), a Swiss entity. Liability limited by a scheme approved under Professional Standards Legislation.

CONSOLIDATED FINANCIALSTATEMENTSCONTENTS PAGE
Consolidated statement of comprehensive income 13
Consolidated balance sheet 14
Consolidated statement of changes in equity 15
Consolidated cash flow statement 16NOTES TO THE FINANCIAL STATEMENTS
1 OVERVIEW
1.1 Introduction 17
1.2 About this report 17
1.3 Segment reporting 18
2 SIGNIFICANT EVENTS AND TRANSACTIONS
2.1 Interest bearing liabilities 20
2.2 Notes to the statement of changes in equity 21
2.3 Dividends 21
3 INTERIM DISCLOSURES
3.1 Investments 22
3.2 Earnings per share 22
3.3 Derivatives 23
3.4 Investment in joint venture and associates 23
3.5 Contingencies 24
3.6 Events subsequent to reporting date 24
3.7 Net tangible assets 24
12 INSURANCE AUSTRALIA GROUP LIMITED

CONSOLIDATED STATEMENT OFCOMPREHENSIVE INCOMEFOR THE HALF YEAR ENDED 31 DECEMBER 2016
31 December2016
31 December2015
$m $m
Gross earned premium 5,868 5,734
Outwards reinsurance premium expense (1,624) (1,632)
Net earned premium (i) 4,244 4,102
Claims expense (4,313) (4,366)
Reinsurance and other recoveries revenue 1,688 1,777
Net claims expense (ii) (2,625) (2,589)
Commission expense (526) (531)
Underwriting expense (912) (919)
Reinsurance commission revenue 353 373
Net underwriting expense (iii) (1,085) (1,077)
Underwriting profit/(loss) (i) + (ii) + (iii) 534 436
Investment income on assets backing insurance liabilities 46 185
Investment expenses on assets backing insurance liabilities (9) (11)
Insurance profit/(loss) 571 610
Investment income on shareholders' funds 109 52
Fee and other income 107 107
Share of net profit/(loss) of associates 8 7
Finance costs (51) (51)
Fee based, corporate and other expenses (141) (149)
Net income/(loss) attributable to non-controlling interests in unitholders' funds (3) (3)
Profit/(loss) before income tax 600 573
Income tax (expense)/credit (109) (67)
Profit/(loss) for the period 491 506
OTHER COMPREHENSIVE INCOME AND (EXPENSE)
Items that may be reclassified subsequently to profit or loss:
Net movement in foreign currency translation reserve, net of tax 2 33
Items that will not be reclassified to profit or loss:
Remeasurements of defined benefit plans, net of tax 21 (12)
Other comprehensive income and (expense), net of tax 23 21
Total comprehensive income and (expense) for the period, net of tax 514 527
PROFIT/(LOSS) FOR THE PERIOD ATTRIBUTABLE TO
Shareholders of the Parent 446 466
Non-controlling interests 45 40
Profit/(loss) for the period 491 506
TOTAL COMPREHENSIVE INCOME AND (EXPENSE) FOR THE PERIOD ATTRIBUTABLE TO
Shareholders of the Parent 469 487
Non-controlling interests 45 40
Total comprehensive income/(expense) for the period, net of tax 514 527
NOTE 31 December2016
31 December2015
cents cents
EARNINGS PER SHARE
Basic earnings per ordinary share 3.2 18.61 19.25
Diluted earnings per ordinary share 3.2 17.92 18.64
The above consolidated statement of comprehensive income should be read in conjunction with the notes to the financialstatements.
13

CONSOLIDATED BALANCESHEETAS AT 31 DECEMBER 2016
NOTE 31 December2016
30 June2016
$m $m
ASSETS
Cash held for operational purposes 378 263
Investments 3.1 12,314 12,946
Trade and other receivables 3,767 4,321
Current tax assets 79 54
Reinsurance and other recoveries on outstanding claims 4,940 4,689
Deferred insurance expenses 2,869 2,778
Deferred levies and charges 151 131
Deferred tax assets 555 603
Property and equipment 199 204
Other assets 159 145
Investment in joint venture and associates 3.4 489 486
Goodwill and intangible assets 3,366 3,410
Total assets 29,266 30,030
LIABILITIES
Trade and other payables 2,376 2,346
Current tax liabilities 4 5
Unearned premium liability 6,163 6,220
Outstanding claims liability 11,528 11,741
Non-controlling interests in unitholders' funds 205 247
Provisions 258 370
Other liabilities 343 354
Interest bearing liabilities 2.1 1,778 1,962
Total liabilities 22,655 23,245
Net assets 6,611 6,785
EQUITY
Share capital 2.2 7,082 7,275
Treasury shares held in trust (39) (43)
Reserves 25 32
Retained earnings (680) (701)
Parent interest 6,388 6,563
Non-controlling interests 223 222
Total equity 6,611 6,785
The above consolidated balance sheet should be read in conjunction with the notes to the financial statements.
14 INSURANCE AUSTRALIA GROUP LIMITED
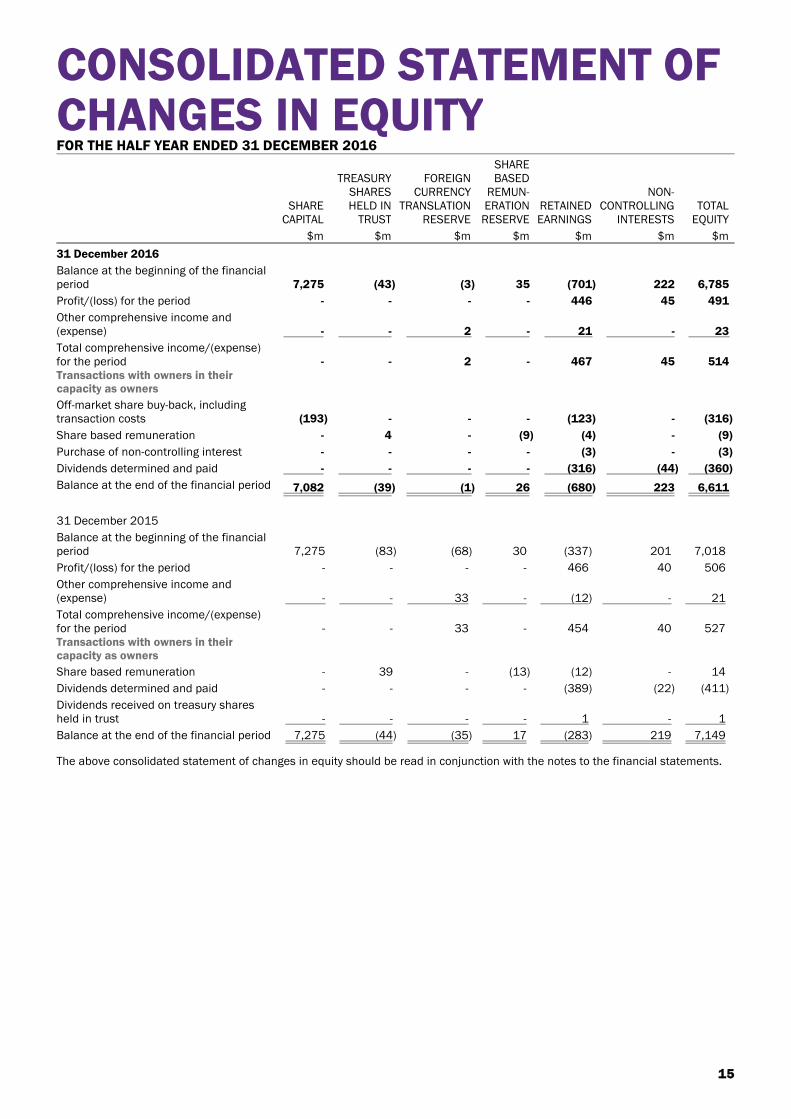
CONSOLIDATED STATEMENT OFCHANGES IN EQUITYFOR THE HALF YEAR ENDED 31 DECEMBER 2016
SHARECAPITAL
TREASURYSHARESHELD IN
TRUST
FOREIGNCURRENCY
TRANSLATIONRESERVE
SHAREBASED
REMUN-ERATION
RESERVERETAINEDEARNINGS
NON-CONTROLLING
INTERESTSTOTAL
EQUITY
$m $m $m $m $m $m $m
31 December 2016
Balance at the beginning of the financialperiod 7,275 (43) (3) 35 (701) 222 6,785
Profit/(loss) for the period - - - - 446 45 491
Other comprehensive income and(expense) - - 2 - 21 - 23
Total comprehensive income/(expense)for the period - - 2 - 467 45 514Transactions with owners in theircapacity as owners
Off-market share buy-back, includingtransaction costs (193) - - - (123) - (316)
Share based remuneration - 4 - (9) (4) - (9)
Purchase of non-controlling interest - - - - (3) - (3)
Dividends determined and paid - - - - (316) (44) (360)
Balance at the end of the financial period 7,082 (39) (1) 26 (680) 223 6,611
31 December 2015
Balance at the beginning of the financialperiod 7,275 (83) (68) 30 (337) 201 7,018
Profit/(loss) for the period - - - - 466 40 506
Other comprehensive income and(expense) - - 33 - (12) - 21
Total comprehensive income/(expense)for the period - - 33 - 454 40 527Transactions with owners in theircapacity as owners
Share based remuneration - 39 - (13) (12) - 14
Dividends determined and paid - - - - (389) (22) (411)
Dividends received on treasury sharesheld in trust - - - - 1 - 1
Balance at the end of the financial period 7,275 (44) (35) 17 (283) 219 7,149
The above consolidated statement of changes in equity should be read in conjunction with the notes to the financial statements.
15
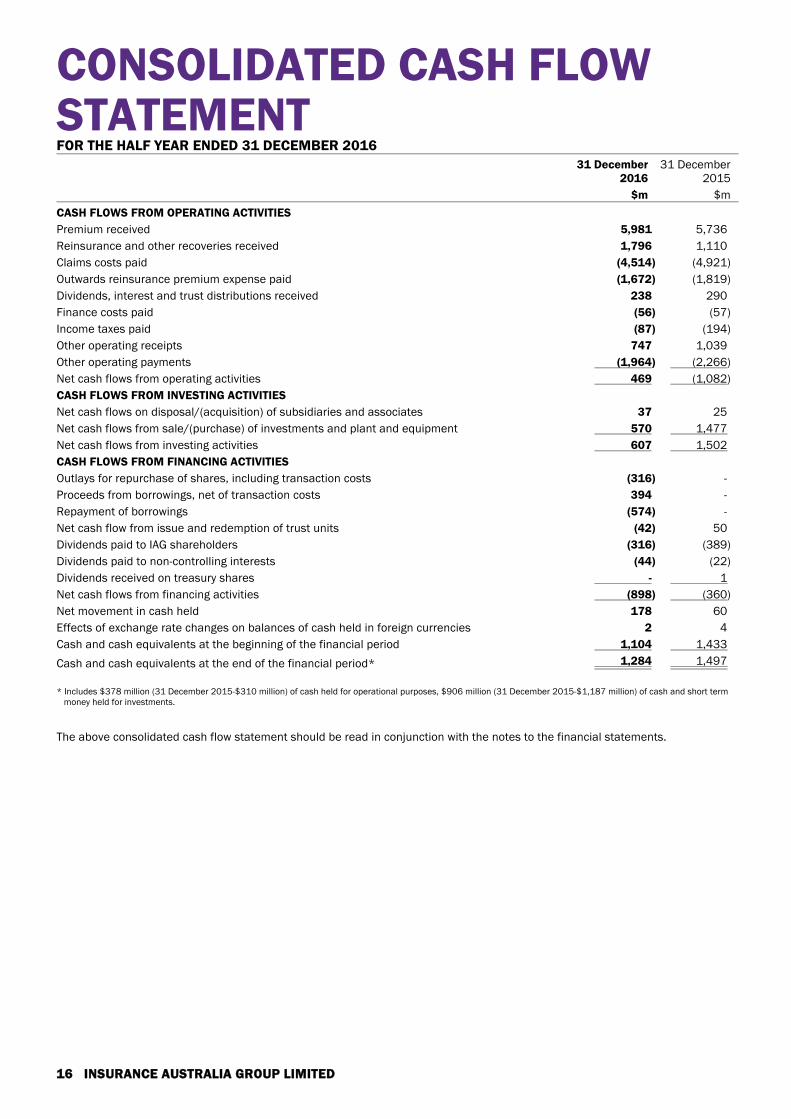
CONSOLIDATED CASH FLOWSTATEMENTFOR THE HALF YEAR ENDED 31 DECEMBER 2016
31 December2016
31 December2015
$m $m
CASH FLOWS FROM OPERATING ACTIVITIES
Premium received 5,981 5,736
Reinsurance and other recoveries received 1,796 1,110
Claims costs paid (4,514) (4,921)
Outwards reinsurance premium expense paid (1,672) (1,819)
Dividends, interest and trust distributions received 238 290
Finance costs paid (56) (57)
Income taxes paid (87) (194)
Other operating receipts 747 1,039
Other operating payments (1,964) (2,266)
Net cash flows from operating activities 469 (1,082)
CASH FLOWS FROM INVESTING ACTIVITIES
Net cash flows on disposal/(acquisition) of subsidiaries and associates 37 25
Net cash flows from sale/(purchase) of investments and plant and equipment 570 1,477
Net cash flows from investing activities 607 1,502
CASH FLOWS FROM FINANCING ACTIVITIES
Outlays for repurchase of shares, including transaction costs (316) -
Proceeds from borrowings, net of transaction costs 394 -
Repayment of borrowings (574) -
Net cash flow from issue and redemption of trust units (42) 50
Dividends paid to IAG shareholders (316) (389)
Dividends paid to non-controlling interests (44) (22)
Dividends received on treasury shares - 1
Net cash flows from financing activities (898) (360)
Net movement in cash held 178 60
Effects of exchange rate changes on balances of cash held in foreign currencies 2 4
Cash and cash equivalents at the beginning of the financial period 1,104 1,433
Cash and cash equivalents at the end of the financial period* 1,284 1,497
* Includes $378 million (31 December 2015-$310 million) of cash held for operational purposes, $906 million (31 December 2015-$1,187 million) of cash and short termmoney held for investments.
The above consolidated cash flow statement should be read in conjunction with the notes to the financial statements.
16 INSURANCE AUSTRALIA GROUP LIMITED

NOTES TO THEFINANCIAL STATEMENTS1. OVERVIEWNOTE 1.1 INTRODUCTIONThe financial report is structured to provide prominence to the disclosures that are considered most relevant to the users'understanding of the operations, results and financial position of the Group.
The financial report has been organised into the following sections:1. Overview - contains information that impacts the financial report as a whole, as well as segment reporting disclosures.
2. Significant events and transactions – disclosure of significant changes in the Group’s financial position and performance.
3. Interim disclosures - other disclosures required to comply with Australian Accounting Standard AASB 134 Interim FinancialReporting.
NOTE 1.2 ABOUT THIS REPORTA. CORPORATE INFORMATIONInsurance Australia Group Limited (IAG, Parent or Company), the ultimate parent entity in the Consolidated entity, is a for-profitcompany incorporated and domiciled in Australia and limited by shares publicly traded on the Australian Securities Exchange (ASX).Its registered office and principal place of business is Level 26, 388 George Street, Sydney, NSW 2000, Australia. This financialreport covers the consolidated financial statements for the Company and its subsidiaries (Group or Consolidated entity) for the halfyear ended 31 December 2016.
This report is also to be read in conjunction with the annual report for the year ended 30 June 2016 and any public announcementsmade by Insurance Australia Group Limited during the reporting period in accordance with the continuous disclosure requirementsof the Corporations Act 2001 and the ASX Listing Rules.
A description of the nature of the Group's operations and its principal activities is included in the Directors' Report.
B. STATEMENT OF COMPLIANCEThis general purpose half year financial report was authorised by the Board of Directors for issue on 22 February 2017 andcomplies with Australian Accounting Standard AASB 134 Interim Financial Reporting and the recognition and measurementrequirements of other applicable Australian Accounting Standards adopted by the Australian Accounting Standards Board (AASB),the Corporations Act 2001 and the ASX Listing Rules.
The current IFRS standard for insurance contracts does not include a comprehensive set of recognition and measurement criteria.The IASB continues to work on a project to issue a standard that does include such criteria. Until the issuance and implementationof that standard, the financial reports of insurers in different countries that comply with IFRS may not be comparable in terms ofthe recognition and measurement of insurance contracts.
C. BASIS OF PREPARATIONThe financial statements have been prepared on the basis of historical cost principles, as modified by certain exceptions, with theprincipal exceptions being the measurement of all investments and derivatives at fair value and the measurement of theoutstanding claims liability and related reinsurance and other recoveries at present value. All values are rounded to the nearestmillion dollars, unless otherwise stated, in accordance with ASIC Corporations Instrument 2016/191.
The balance sheet is prepared with the assets and liabilities presented broadly in order of liquidity.
The financial report is presented in Australian dollars, which is the functional currency of the Company.
Changes to comparativesAs a result of the reorganisation of the financial report, certain comparative items have been reclassified from the Consolidatedentity’s prior period financial report to conform to the current period’s presentation.
D. SIGNIFICANT ACCOUNTING POLICIES ADOPTEDThe accounting policies adopted in the preparation of this financial report have been applied consistently by all entities in theGroup and are the same as those applied for the previous reporting year, unless otherwise stated. The financial statements ofentities operating outside Australia that maintain accounting records in accordance with overseas accounting principles areadjusted where necessary to comply with the significant accounting policies of the Consolidated entity. The significant accountingpolicies adopted in the preparation of this financial report are set out within the relevant note in the annual report for the yearended 30 June 2016.
17
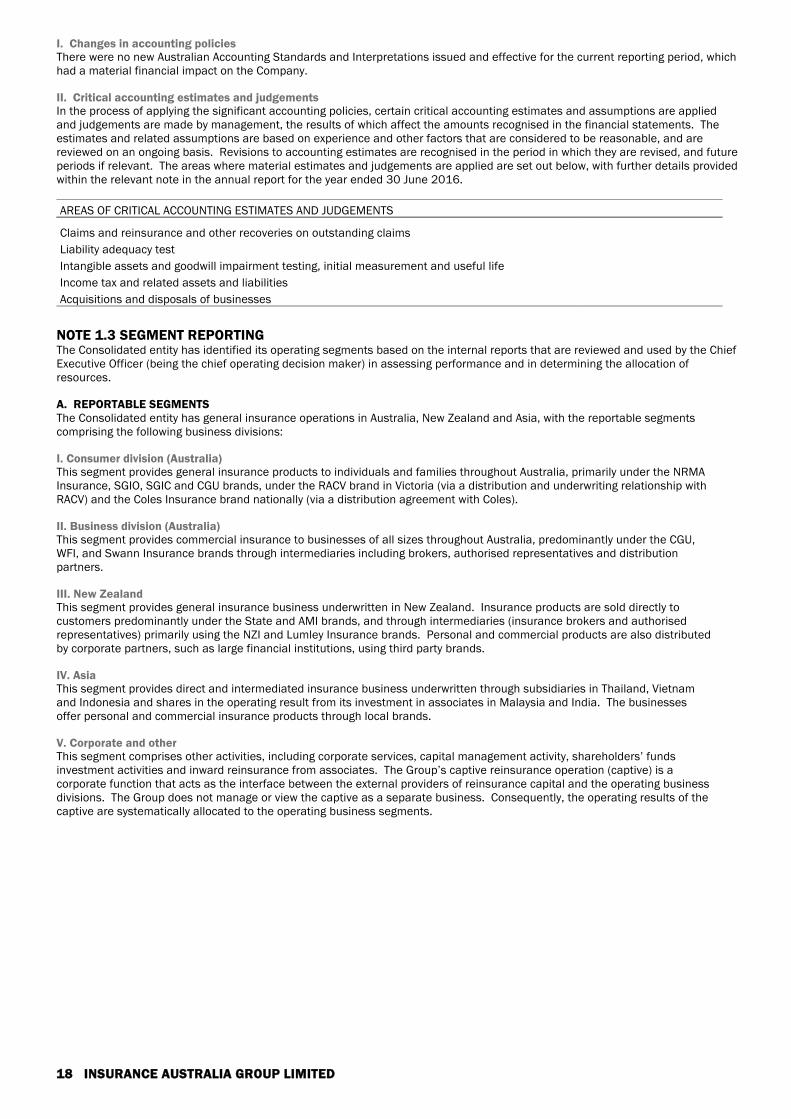
I. Changes in accounting policiesThere were no new Australian Accounting Standards and Interpretations issued and effective for the current reporting period, whichhad a material financial impact on the Company.
II. Critical accounting estimates and judgementsIn the process of applying the significant accounting policies, certain critical accounting estimates and assumptions are appliedand judgements are made by management, the results of which affect the amounts recognised in the financial statements. Theestimates and related assumptions are based on experience and other factors that are considered to be reasonable, and arereviewed on an ongoing basis. Revisions to accounting estimates are recognised in the period in which they are revised, and futureperiods if relevant. The areas where material estimates and judgements are applied are set out below, with further details providedwithin the relevant note in the annual report for the year ended 30 June 2016.
AREAS OF CRITICAL ACCOUNTING ESTIMATES AND JUDGEMENTS
Claims and reinsurance and other recoveries on outstanding claims
Liability adequacy test
Intangible assets and goodwill impairment testing, initial measurement and useful life
Income tax and related assets and liabilities
Acquisitions and disposals of businesses
NOTE 1.3 SEGMENT REPORTINGThe Consolidated entity has identified its operating segments based on the internal reports that are reviewed and used by the ChiefExecutive Officer (being the chief operating decision maker) in assessing performance and in determining the allocation ofresources.
A. REPORTABLE SEGMENTSThe Consolidated entity has general insurance operations in Australia, New Zealand and Asia, with the reportable segmentscomprising the following business divisions:
I. Consumer division (Australia)This segment provides general insurance products to individuals and families throughout Australia, primarily under the NRMAInsurance, SGIO, SGIC and CGU brands, under the RACV brand in Victoria (via a distribution and underwriting relationship withRACV) and the Coles Insurance brand nationally (via a distribution agreement with Coles).
II. Business division (Australia)This segment provides commercial insurance to businesses of all sizes throughout Australia, predominantly under the CGU,WFI, and Swann Insurance brands through intermediaries including brokers, authorised representatives and distributionpartners.
III. New ZealandThis segment provides general insurance business underwritten in New Zealand. Insurance products are sold directly tocustomers predominantly under the State and AMI brands, and through intermediaries (insurance brokers and authorisedrepresentatives) primarily using the NZI and Lumley Insurance brands. Personal and commercial products are also distributedby corporate partners, such as large financial institutions, using third party brands.
IV. AsiaThis segment provides direct and intermediated insurance business underwritten through subsidiaries in Thailand, Vietnamand Indonesia and shares in the operating result from its investment in associates in Malaysia and India. The businessesoffer personal and commercial insurance products through local brands.
V. Corporate and otherThis segment comprises other activities, including corporate services, capital management activity, shareholders’ fundsinvestment activities and inward reinsurance from associates. The Group’s captive reinsurance operation (captive) is acorporate function that acts as the interface between the external providers of reinsurance capital and the operating businessdivisions. The Group does not manage or view the captive as a separate business. Consequently, the operating results of thecaptive are systematically allocated to the operating business segments.
18 INSURANCE AUSTRALIA GROUP LIMITED

B. FINANCIAL INFORMATION
AUSTRALIA
CONSUMERDIVISION
BUSINESSDIVISION
NEWZEALAND ASIA
CORPORATEAND OTHER TOTAL
$m $m $m $m $m $m
31 December 2016
I. Financial performance
Total external revenue(a) 3,983 1,954 1,837 278 127 8,179
Underwriting profit/(loss) 447 76 23 (12) - 534
Net investment income on technicalreserves 14 5 13 5 - 37
Insurance profit/(loss) 461 81 36 (7) - 571
Net investment income on shareholders'funds - - - - 105 105
Share of net profit/(loss) of associates - - - 9 (1) 8
Finance costs - - - - (51) (51)
Other net operating result - 2 - - (35) (33)
Total segment result 461 83 36 2 18 600
Income tax expense (109)
Profit/(loss) for the period 491
II. Other segment information
Capital expenditure(b) - - - - 46 46
Depreciation and amortisation expense 28 28 25 2 - 83
31 December 2015
I. Financial performance
Total external revenue(a) 4,035 2,372 1,518 246 64 8,235
Underwriting profit/(loss) 414 25 (6) 1 2 436
Net investment income on technicalreserves 81 75 17 2 (1) 174
Insurance profit/(loss) 495 100 11 3 1 610
Net investment income on shareholders'funds - - - - 38 38
Share of net profit/(loss) of associates - 1 - 7 (1) 7
Finance costs - - - - (51) (51)
Other net operating result - 11 1 - (43) (31)
Total segment result 495 112 12 10 (56) 573
Income tax expense (67)
Profit/(loss) for the period 506
II. Other segment information
Capital expenditure(b) - - - - 94 94
Depreciation and amortisation expense 28 45 26 1 - 100
(a) Total external revenue comprises premium revenue, reinsurance and other recoveries, reinsurance commission revenue, investment income on assets backinginsurance liabilities, investment income on shareholders' funds, fee and other income and share of net profit/(loss) of associates.
(b) Capital expenditure includes acquisitions of property and equipment, intangibles and other non-current segment assets.
19

2. SIGNIFICANT EVENTS AND TRANSACTIONSSECTION INTRODUCTIONThis section comprises disclosures on the events and transactions that are significant to an understanding of the changes in theGroup's financial position and performance since the end of the last annual reporting period. Information disclosed in relation tothose events and transactions provides an update on the relevant information presented in the most recent annual financialreport.
NOTE 2.1 INTEREST BEARING LIABILITIES31 December 2016 30 June 2016
CARRYINGVALUE
$mFAIR VALUE
$m
CARRYINGVALUE
$mFAIR VALUE
$m
A. COMPOSITION
I. Capital nature
a. ADDITIONAL TIER 1 REGULATORY CAPITAL(a)
Convertible preference shares 153 156 377 383
Reset exchangeable securities 550 572 550 550
Capital notes 404 419 - -
b. TIER 2 REGULATORY CAPITAL
GBP subordinated term notes - - 178 177
NZD subordinated bonds - - 179 180
AUD subordinated convertible term notes 350 354 350 352
NZD subordinated convertible term notes(b) 337 326 335 329
II. Operational nature
Other interest bearing liabilities 2 2 2 2
Less: capitalised transaction costs (18) (9)
1,778 1,962
(a) Instruments issued prior to 1 January 2013 are eligible for inclusion in the relevant category of regulatory capital up to limits prescribed by APRA under transitionalarrangements. Any capital that is ineligible to be included in Additional Tier 1 Capital as a consequence may be included in Tier 2 capital to the extent there is residualcapacity within Tier 2 transitional limits.
(b) At the reporting date, the Company recognised accrued interest of $9 million (30 June 2016-$1 million) which is presented within trade and other payables.
B. RECOGNITION AND MEASUREMENTThe interest bearing liabilities are initially measured at fair value (net of transaction costs) and subsequently measured atamortised cost. Based on market conditions at any point in time, the carrying value of the liabilities may not be representative ofthe fair value of the liabilities. The fair value for all interest bearing liabilities is calculated using their quoted market price (fairvalue hierarchy level 1).
C. SIGNIFICANT MOVEMENTS DURING THE PERIODSignificant movements in the interest bearing liabilities since 30 June 2016 are as follows: On 15 December 2016, IAG redeemed NZ$187 million of subordinated bonds ($179 million as of the redemption date).
On 21 December 2016, IAG redeemed £100 million of subordinated term notes ($171 million as of the redemption date).
On 22 December 2016, IAG bought back $224 million of convertible preference shares, the proceeds received by holders werereinvested in capital notes.
On 22 December 2016, IAG issued $404 million of capital notes including the above mentioned reinvestment. The notesqualify as Additional Tier 1 Capital under APRA's Prudential Framework for General Insurance.
The significant terms and conditions of the issued capital notes are as follows:
face value of $404 million and issued by the Company on 22 December 2016;
all remain outstanding as at the reporting date;
non-cumulative floating rate distribution payable quarterly and expected to be fully franked;
distribution rate equals the sum of three month bank bill swap rate (BBSW) plus margin of 4.70% per annum multiplied by (1 –tax rate);
payments of distributions can only be made subject to meeting certain conditions, if no distribution is made, no dividends canbe paid and no returns of capital can be made on ordinary shares until the next distribution payment date;
IAG may exchange or redeem capital notes on the exchange date, or upon occurrence of certain events, subject to APRAapproval. The first optional exchange date is 15 June 2023;
the capital notes are scheduled for conversion into a variable number of IAG ordinary shares (subject to a maximum number of140.6 million shares) on 16 June 2025 and at each subsequent distribution payment date provided the mandatory conversionconditions are satisfied; and
the capital notes must be converted into a variable number of IAG ordinary shares (subject to a maximum of 351.1 millionshares) or written off if APRA determines the Company to be non-viable.
20 INSURANCE AUSTRALIA GROUP LIMITED

NOTE 2.2 NOTES TO THE STATEMENT OF CHANGES IN EQUITY31 December
201630 June
201631 December
201630 June
2016
Number ofshares in
millions
Number ofshares in
millions $m $m
SHARE CAPITAL
I. Ordinary shares
Balance at the beginning of the financial period 2,431 2,431 7,275 7,275
Off-market share buy-back, including transaction costs (64) - (193) -
Balance at the end of the financial period 2,367 2,431 7,082 7,275
All ordinary shares on issue are fully paid. Ordinary shares entitle the holder to a vote at the general meeting of the Company andto participate in the dividends and the proceeds on winding up of the Company in proportion to the number of, and amounts paidon, the shares held. Dividends, if declared, are subject to there being distributable profits available and not breaching APRA capitaladequacy requirements.
II. Changes during the periodOn 10 October 2016, IAG completed its ordinary share off-market buy-back, with IAG acquiring 64 million shares (representing 2.6%of IAG's issued share capital) for a consideration of $316 million (including transaction costs). The buy-back price per share was$4.91, which comprised a capital component of $2.99 and a fully franked dividend of $1.92.
NOTE 2.3 DIVIDENDS31 December
201631 December
2015
$m $m
A. ORDINARY SHARES
Dividend component of off-market share buy-back (paid 17 October 2016): $1.92 (2015-nil) perordinary share fully franked at 30% 123 -
2016 final dividend (paid 5 October 2016): $0.13 (2015-$0.16) per ordinary share fully franked at30% 316 389
B. DIVIDEND NOT RECOGNISED AT REPORTING DATE2017 interim dividend: $0.13 (2016-$0.13) per ordinary share fully franked at 30% to be paid on 30March 2017 308 316Special dividend: nil (2016-$0.10) per ordinary share fully franked at 30% - 243
308 559
C. DIVIDEND REINVESTMENTA Dividend Reinvestment Plan (DRP) operates which allows eligible shareholders with ordinary shares to elect to receive theirdividend entitlement in the form of IAG shares. The price of DRP shares is the volume weighted average share price, less adiscount if determined by the Directors, calculated over the pricing period (which is at least five trading days) as determined by theDirectors for each dividend payment date. A copy of the terms and conditions for the DRP is available atwww.iag.com.au/shareholder-centre/dividends/reinvestment.
The DRP for the 2016 final dividend paid on 5 October 2016 was settled with the on-market purchase of 10.3 million shares pricedat $5.3287 per share (based on a daily volume weighted average price for 10 trading days from 9 September 2016 to 22September 2016 inclusive, with no discount applied).
21

3. INTERIM DISCLOSURES SECTION INTRODUCTIONThis section includes other information to be disclosed in accordance with the interim reporting Accounting Standard (AASB 134),Corporations Act and ASX listing rules, but which are considered less relevant to understanding the changes in the Group’sfinancial position and performance since the end of the last annual reporting period.
NOTE 3.1 INVESTMENTSThe inputs used to determine the fair value for securities recognised under each level of the fair value hierarchy is set out below.
I. Level 1 quoted pricesThe fair value is determined by reference to quoted prices (mid-market) in active markets for identical assets and liabilities. ForIAG, this category includes government securities and listed equities.
II. Level 2 other observable inputsThe fair value is determined by reference to quoted prices in active markets for similar assets or liabilities or by reference to othersignificant inputs that are not quoted prices but are based on observable market data, for example interest rate yield curvesobservable at commonly quoted intervals. For IAG, this category primarily includes corporate and other fixed interest securitieswhere the market is considered to be lacking sufficient depth to be considered active.
III. Level 3 unobservable inputsThe fair value is determined using valuation techniques in which a number of the significant inputs are not based on observablemarket data. Level 3 investments are primarily unlisted private equity funds where the fair value of investments is determined onthe basis of published redemption values of those funds. This category also includes IAG's unlisted equity interest in BohaiProperty Insurance Company Limited (Bohai). The fair value of Bohai is supported by comparable transaction multiples observed inthe local market.
The table below separates the total investment balance by hierarchy category:
LEVEL 1 LEVEL 2 LEVEL 3 TOTAL
$m $m $m $m
31 December 2016
Interest bearing investments 1,709 8,724 1 10,434
Equity investments 1,129 364 157 1,650
Other investments 4 225 1 230
2,842 9,313 159 12,314
30 June 2016
Interest bearing investments 2,047 9,086 1 11,134
Equity investments 1,021 313 157 1,491
Other investments 14 306 1 321
3,082 9,705 159 12,946
NOTE 3.2 EARNINGS PER SHARE31 December
201631 December
2015
cents centsA. REPORTING PERIOD VALUES
Basic earnings per ordinary share(a) 18.61 19.25
Diluted earnings per ordinary share(b) 17.92 18.64
(a) The basic earnings per ordinary share is determined by dividing the profit or loss attributable to shareholders of the Parent by the weighted average number of sharesof the Parent on issue during the reporting period. The treasury shares held in trust are deducted, but earnings attributable to those shares are included.
(b) Diluted earnings per share is determined by dividing the profit or loss attributable to shareholders of the Parent, adjusted for the finance costs of dilutive convertibleinstruments, by the weighted average number of ordinary shares and dilutive potential ordinary shares, primarily as a result of debt instruments that possess aconversion feature.
31 December2016
31 December2015
$m $mB. RECONCILIATION OF EARNINGS USED IN CALCULATING EARNINGS PER SHARE
Profit/(loss) attributable to shareholders of the Parent which is used in calculating basic anddiluted earnings per share 446 466
Finance costs of convertible securities, net of tax 18 12
Profit/(loss) attributable to shareholders of the Parent which is used in calculating dilutedearnings per share 464 478
22 INSURANCE AUSTRALIA GROUP LIMITED

31 December2016
31 December2015
Number ofshares in
millions
Number ofshares in
millionsC. RECONCILIATION OF WEIGHTED AVERAGE NUMBER OF ORDINARY SHARES
USED IN CALCULATING EARNINGS PER SHARE
Weighted average number of ordinary shares on issue (adjusted for treasury shares held in trust)used in the calculation of basic earnings per share 2,397 2,421
Weighted average number of dilutive potential ordinary shares relating to:
Convertible securities 187 134
Unvested share based remuneration rights supported by treasury shares held in trust 5 10
2,589 2,565
NOTE 3.3 DERIVATIVES31 December 2016 30 June 2016
Effectiveexposure
Fair valueasset
Fair valueliability
Effectiveexposure
Fair valueasset
Fair valueliability
$m $m $m $m $m $m
A. REPORTING DATE POSITIONS
I. Net investment hedges (hedge accounting applied)
Forward foreign exchange contracts 913 10 (20) 1,627 7 (21)
II. Investment related derivatives (derivatives withouthedge accounting applied)
Bond futures 2,316 - - 1,920 - -
Share price index futures (81) 2 - 40 - -
Forward foreign exchange contracts 1,792 - (37) 1,624 30 (7)
Options (89) 2 - - - -
III. Treasury related derivatives (derivatives withouthedge accounting applied)
Forward foreign exchange contracts 2,142 17 (12) 1,851 20 (30)
Interest rate swaps 337 - (12) 335 2 -
B. RECOGNITION AND MEASUREMENTI. Hedge accountingThe foreign currency exposures arising on translation of net investments in foreign operations are hedged (net investment hedge)using forward exchange contracts and the designation of certain foreign currency borrowings as hedging instruments. The fairvalue is determined using observable inputs (level 2 in the fair value hierarchy).
II. Derivatives without hedge accounting appliedThe fair value of the bond futures, share price index futures and options are measured using a quoted price in an active market(level 1 in the fair value hierarchy), whilst the fair value of the interest rate swaps and forward foreign exchange contracts aredetermined using observable inputs (level 2 in the fair value hierarchy).
NOTE 3.4 INVESTMENT IN JOINT VENTURE AND ASSOCIATESSummarised information of interests in material joint venture and associates accounted for on an equity basis is as follows:
COUNTRY OFINCORPORATION/FORMATION
PRINCIPALACTIVITY CARRYING VALUE OWNERSHIP INTEREST
31 December2016
30 June2016
31 December2016
30 June2016
$m $m % %
AmGeneral Holdings Berhad(AmGeneral) Malaysia
Insuranceunderwriting 342 360 49.00 49.00
SBI General InsuranceCompany Limited (SBI General) India
Insuranceunderwriting 131 111 26.00 26.00
Other 16 15
489 486
23
NOTE 3.5 CONTINGENCIESThere have been no material changes in the Group’s contingent liabilities or contingent assets since 30 June 2016.
NOTE 3.6 EVENTS SUBSEQUENT TO REPORTING DATEAs the following matters occurred after reporting date and did not relate to conditions existing at reporting date, no account hasbeen taken of them in the financial statements for the current half year ended 31 December 2016. These include: On 18 February 2017, a large hailstorm event impacted parts of the Northern Sydney region. As at 21 February 2017, IAG had
received more than 13,000 claims in relation to this event. Given the proximity of the occurrence of this event to the reportingdate, it has not yet been possible to reliably determine its cost to the Group. Once determined, this cost will be recognised inthe Group’s results for the second half of the financial year.
On 22 February 2017, the Board determined to pay an interim dividend of 13 cents per share, 100% franked. The dividend willbe paid on 30 March 2017. The dividend reinvestment plan will operate by acquiring shares on-market for participants with nodiscount applied. IAG has set a minimum participation level for the DRP for the 2017 interim dividend, meaning onlyshareholders with at least 85 ordinary shares can participate in the DRP on this occasion. This means that some shareholderswho might ordinarily participate in the DRP will receive a cash dividend for the 2017 interim dividend instead of being allocatedadditional shares under the DRP.
NOTE 3.7 NET TANGIBLE ASSETS31 December
201630 June
2016
$ $
Net tangible assets per ordinary share 1.28 1.30
Net tangible assets per ordinary share have been determined using the net assets on the balance sheet adjusted for non-controlling interests, intangible assets and goodwill.
24 INSURANCE AUSTRALIA GROUP LIMITED
DIRECTORS' DECLARATIONIn the opinion of the Directors of Insurance Australia Group Limited:
the financial statements and notes 1 to 3.7 are in accordance with the Corporations Act 2001 including:
giving a true and fair view of the financial position of the Consolidated entity as at 31 December 2016 and of itsperformance, as represented by the results of its operations and its cash flows, for the half year ended on that date; and
complying with Australian Accounting Standard AASB 134 Interim Financial Reporting and the Corporations Regulations 2001; and
there are reasonable grounds to believe that the Company will be able to pay its debts as and when they become due andpayable.
Signed at Sydney this 22nd day of February 2017 in accordance with a resolution of the Directors.
Peter HarmerDirector
25
INDEPENDENTAUDITOR'S REVIEW REPORTTO THE EQUITY HOLDERS OF INSURANCE AUSTRALIA GROUP LIMITED
REPORT ON THE FINANCIAL REPORTWe have reviewed the accompanying half year financial report of Insurance Australia Group Limited (Company), which comprisesthe consolidated balance sheet as at 31 December 2016, consolidated statement of comprehensive income, consolidatedstatement of changes in equity and consolidated cash flow statement for the half year ended on that date, notes 1 to 3.7comprising a summary of significant accounting policies and other explanatory information and the Directors’ Declaration of theConsolidated entity comprising the Company and the entities it controlled at the half year’s end or from time to time during the halfyear.
DIRECTORS' RESPONSIBILITY FOR THE HALF YEAR FINANCIAL REPORTThe Directors of the Company are responsible for the preparation of the half year financial report that gives a true and fair view inaccordance with Australian Accounting Standards and the Corporations Act 2001 and for such internal control as the Directorsdetermine is necessary to enable the preparation of the half year financial report that is free from material misstatement, whetherdue to fraud or error.
AUDITOR'S RESPONSIBILITY FOR THE REVIEW OF THE HALF YEAR FINANCIAL REPORTOur responsibility is to express a conclusion on the half year financial report based on our review. We conducted our review inaccordance with Auditing Standard on Review Engagements ASRE 2410 Review of a Financial Report Performed by the IndependentAuditor of the Entity, in order to state whether, on the basis of the procedures described, we have become aware of any matter thatmakes us believe that the half year financial report is not in accordance with the Corporations Act 2001 including: giving a true andfair view of the Consolidated entity’s financial position as at 31 December 2016 and its performance for the half year ended on thatdate; and complying with Australian Accounting Standard AASB 134 Interim Financial Reporting and the Corporations Regulations2001. As auditor of Insurance Australia Group Limited, ASRE 2410 requires that we comply with the ethical requirements relevantto the audit of the annual financial report.
A review of a half year financial report consists of making enquiries, primarily of persons responsible for financial and accountingmatters, and applying analytical and other review procedures. A review is substantially less in scope than an audit conducted inaccordance with Australian Auditing Standards and consequently does not enable us to obtain assurance that we would becomeaware of all significant matters that might be identified in an audit. Accordingly, we do not express an audit opinion.
INDEPENDENCEIn conducting our review, we have complied with the independence requirements of the Corporations Act 2001.
AUDITOR'S OPINIONBased on our review, which is not an audit, we have not become aware of any matter that makes us believe that the half yearfinancial report of Insurance Australia Group Limited is not in accordance with the Corporations Act 2001, including: giving a true and fair view of the Consolidated entity’s financial position as at 31 December 2016 and of its performance for
the half year ended on that date; and
complying with Australian Accounting Standard AASB 134 Interim Financial Reporting and the Corporations Regulations 2001.
KPMG
Andrew Yates Ian Moyser
Partner PartnerSydney22 February 2017
26 INSURANCE AUSTRALIA GROUP LIMITEDKPMG, an Australian partnership and a member firm of the KPMG network of independent member firms affiliated with KPMG International Cooperative ("KPMGInternational"), a Swiss entity. Liability limited by a scheme approved under Professional Standards Legislation.