
INSULATION MATERIAL FOR A MODEL HOUSE IN ZAOUIAT SIDI ...
51
SCHOOL OF SCIENCE & ENGINEERING – AL AKHAWAYN UNIVERSITY SCHOOL OF SCIENCE AND ENGINEERING INSULATION MATERIAL FOR A MODEL HOUSE IN ZAOUIAT SIDI ABDESSALAM Spring 2017
Transcript of INSULATION MATERIAL FOR A MODEL HOUSE IN ZAOUIAT SIDI ...
SCHOOL OF SCIENCE & ENGINEERING – AL AKHAWAYN UNIVERSITY
SCHOOL OF SCIENCE AND ENGINEERING
INSULATION MATERIAL FOR A MODEL HOUSE IN
ZAOUIAT SIDI ABDESSALAM
Spring 2017
ii
INSULATION MATERIAL FOR A MODEL HOUSE IN ZAOUIAT SIDI ABDESSALAM
Capstone Report
Student Statement:
I have applied ethics to the design process and in the selection of the final proposed design.
And that, I have held the safety of the public to be paramount and have addressed this in the
presented design wherever may be applicable.
_____________________________________________________
Bencheikh Chaimaa
Approved by the Supervisor
_____________________________________________________
Dr. Asmae Khaldoun

iii
AKNOLEDGMENT
First of all, I would like to express my sincere gratitude to my supervisor Dr. Asmae
Khaldoun for guiding me, standing by my side, devoting her time to my project and helping
me in each step in my capstone. In fact, her instructions and critics allowed me to work on a
regular basis for a noble cause which is helping the citizens of Zaouiat Sidi Abdessalam.
After that, I would like to thank Dr. Khebbazi, professor at L’école Supérieure de
Technolgie of Salé and Fatima Zohra Elwardi, PhD student, for helping me through the
experimental part.
Then, I would like to thank the citizens of Zaouiat Sidi Abdessalam for being so
welcoming and making me discover this beautiful region.
Finally, I would like to thank my family and friends for always encouraging me, and
fighting so that I never want for anything and always standing by my side.
iv
CONTENT
AKNOLEDGMENT ................................................................................................................ iii
CONTENT ................................................................................................................................ iv
TABLE OF FIGURES ............................................................................................................... v
TABLE OF TABLES ............................................................................................................... vi
ABSTRACT ............................................................................................................................. vii
1. INTRODUCTION .......................................................................................................... 1
1.1 Project Description ...................................................................................................... 2
1.2 STEEPLE Analysis ..................................................................................................... 2
1.2.1 Social Implications: ............................................................................................. 2
1.2.2 Technological Implications:................................................................................. 3
1.2.3 Environmental Implications: ................................................................................ 3
1.2.4 Economic Implications: ....................................................................................... 3
1.2.5 Political Implications: .......................................................................................... 3
1.2.6 Legal Implications: .............................................................................................. 4
1.2.7 Ethical Implications: ............................................................................................ 4
2. METHODOLOGY ......................................................................................................... 4
3. THEORITICAL STUDY ................................................................................................ 5
3.1 Properties ..................................................................................................................... 5
3.1.1 Density ................................................................................................................. 5
3.1.2 Thermal conductivity ........................................................................................... 5
3.1.3 Thermal diffusivity .............................................................................................. 6
3.1.4 Specific Heat Capacity ......................................................................................... 7
3.1.5 Thermal Effusivity ............................................................................................... 8
3.2 Construction Materials ................................................................................................ 8
3.2.1 Clay ...................................................................................................................... 8
3.2.2 Stone .................................................................................................................... 9
3.2.3 Cob ..................................................................................................................... 10
3.2.4 Concrete ............................................................................................................. 10
3.3 Insulation Materials ................................................................................................... 11
3.3.1 Industrial Materials ............................................................................................ 11
3.3.2 Natural Materials ............................................................................................... 13
4. STATE OF THE ART .................................................................................................. 15
v
5. EXPERIMENTAL STUDY.......................................................................................... 16
5.1 Experimental procedures ........................................................................................... 17
5.1.1 Materials used .................................................................................................... 17
5.1.2 Samples’ creation ............................................................................................... 18
5.1.3 Results and Discussions ..................................................................................... 23
6. SIMULATION .............................................................................................................. 27
6.1 Building Chosen ........................................................................................................ 27
6.2 Simulation Procedures............................................................................................... 29
6.3 Results and discussion ............................................................................................... 30
7. CONCLUSION ............................................................................................................. 33
8. REFERENCES ............................................................................................................. 34
9. APPENDIX ................................................................................................................... 35
1. Flash method graphs ..................................................................................................... 35
2. Design Builder graphs................................................................................................... 38
TABLE OF FIGURES
Figure 1: the three pillars of sustainable development .............................................................. 1
Figure 2: Fourier's law of heat conduction ................................................................................ 5
Figure 3: the asymmetrical hot plate method ............................................................................. 6
Figure 4: the flash method's process .......................................................................................... 6
Figure 5: graph obtained from the data given by Benchlink ..................................................... 7
Figure 6: Clay in form of blocks ................................................................................................ 8
Figure 7: igneous rock ............................................................................................................... 9
Figure 8: sedimentary rock ........................................................................................................ 9
Figure 9: metamorphic rock ....................................................................................................... 9
Figure 10: cob .......................................................................................................................... 10
Figure 11: Concrete brick ........................................................................................................ 10
Figure 12: Fiberglass................................................................................................................ 11
Figure 13: Rock Wool .............................................................................................................. 12
Figure 14: Cellulose ................................................................................................................. 12
Figure 15 : Cork ....................................................................................................................... 13
Figure 16: Sheep's Wool .......................................................................................................... 14
Figure 17: Straw Bale .............................................................................................................. 14
Figure 18: Sawdust .................................................................................................................. 15
vi
Figure 19: Clay's X-rays results ............................................................................................... 17
Figure 20: Mixture 1 (15%cork+85%clay) .............................................................................. 19
Figure 21: Mixture 2 (7%cork+43%clay+50%mortar) ........................................................... 20
Figure 22: Mixture 3(5%cork+29%clay+66%mortar) ............................................................ 20
Figure 23: Mixture 4 (4%cork+22%clay+75%mortar) ........................................................... 21
Figure 24: mixture 5 (4%cork+50%clay)+(4%cork+42%mortar)........................................... 21
Figure 25: mixture 6 (8%straw+92%clay) ............................................................................... 22
Figure 26: mixture 7 (4%straw+96%clay) ............................................................................... 22
Figure 27: Mixture 8 (3%straw+62%clay+35%mortar) .......................................................... 23
Figure 28: Building chosen to renovate ................................................................................... 28
Figure 29: Realistic model done in Design Builder ................................................................. 28
TABLE OF TABLES
Table 1: chemical composition of clay used in experiment ..................................................... 17
Table 2: Masses and densities of the materials used................................................................ 19
Table 3: The mixtures' densities .............................................................................................. 23
Table 4: The mixtures' thermal conductivities ......................................................................... 24
Table 5: Mixture's thermal diffusivity ..................................................................................... 25
Table 6: The mixtures' specific heat capacity .......................................................................... 26
Table 7: The mixtures' thermal effusivity ................................................................................ 27
vii
ABSTRACT
To make the lives of people living in Zaouiat Sidi Abdessalam better, my teammates and I will
renovate and transform a model house to an ecofriendly one. It will help them go through the
harsh weather that the Zaouiat faces in winter. To do so, I will be in charge of finding a suitable
material for the renovation and the insulation of the house so that to limit the energy
consumption on its heating.
My capstone project will be divided into three parts. The first one is about understanding the
materials used in construction and insulation in Morocco, especially the region near Ifrane, by
conducting a bibliographic study. It contains construction and insulation materials, their
properties, advantages and disadvantages.
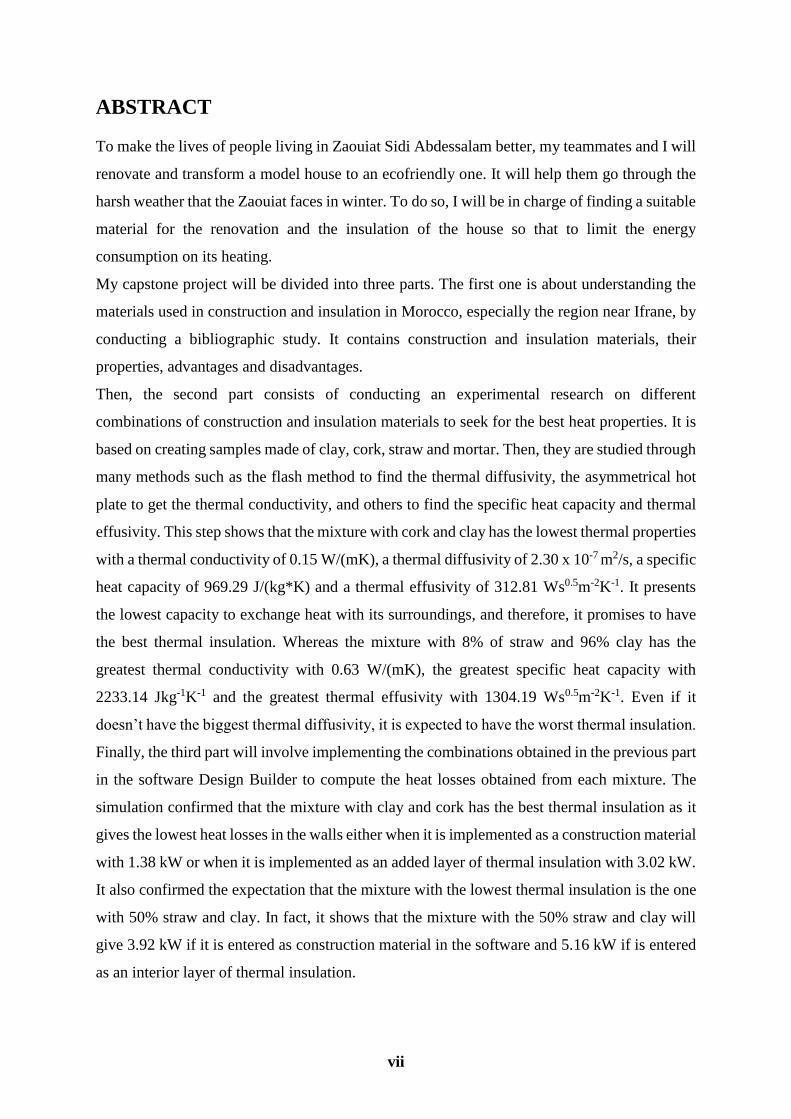
Then, the second part consists of conducting an experimental research on different
combinations of construction and insulation materials to seek for the best heat properties. It is
based on creating samples made of clay, cork, straw and mortar. Then, they are studied through
many methods such as the flash method to find the thermal diffusivity, the asymmetrical hot
plate to get the thermal conductivity, and others to find the specific heat capacity and thermal
effusivity. This step shows that the mixture with cork and clay has the lowest thermal properties
with a thermal conductivity of 0.15 W/(mK), a thermal diffusivity of 2.30 x 10⁻⁷ m2/s, a specific
heat capacity of 969.29 J/(kg*K) and a thermal effusivity of 312.81 Ws0.5m-2K-1. It presents
the lowest capacity to exchange heat with its surroundings, and therefore, it promises to have
the best thermal insulation. Whereas the mixture with 8% of straw and 96% clay has the
greatest thermal conductivity with 0.63 W/(mK), the greatest specific heat capacity with
2233.14 Jkg-1K-1 and the greatest thermal effusivity with 1304.19 Ws0.5m-2K-1. Even if it
doesn’t have the biggest thermal diffusivity, it is expected to have the worst thermal insulation.
Finally, the third part will involve implementing the combinations obtained in the previous part
in the software Design Builder to compute the heat losses obtained from each mixture. The
simulation confirmed that the mixture with clay and cork has the best thermal insulation as it
gives the lowest heat losses in the walls either when it is implemented as a construction material
with 1.38 kW or when it is implemented as an added layer of thermal insulation with 3.02 kW.
It also confirmed the expectation that the mixture with the lowest thermal insulation is the one
with 50% straw and clay. In fact, it shows that the mixture with the 50% straw and clay will
give 3.92 kW if it is entered as construction material in the software and 5.16 kW if is entered
as an interior layer of thermal insulation.

1
1. INTRODUCTION
Sustainable development deals with providing the basic needs of the present generation without
compromising and affecting the future generations’ ability to provide their needs [1]. It has
three pillars: social, environmental and economic pillar. The social pillar stands for the
society’s and people’s ability to create a good and healthy social care and wellbeing for the
citizens. The environmental pillar means that the people are living through the natural resources
our earth is offering them and they need to consume them moderately. Finally, the economic
pillar stands for the profit a country is making by using resources in an effective, efficient and
sustainable manner. In order to have a perfect sustainable development, all the pillars should
be balanced and should work together. Unfortunately, there is always a lack in one or more
pillars, and the one that is in great danger and generally needs the greatest care is the
environmental one.
Lately, Morocco has acknowledged the huge danger the environment is facing and is striving
to improve environmental sustainability for the future generations by raising awareness of
ongoing decrease on non-renewable energies and increase of electricity and water costs [1].
Moreover, the country is constantly encouraging research in renewable energies and finding
solutions to improve the building sector. In fact, the biggest CO2 emissions and energy
consumption come from this sector.
So, one way to help the environment decrease the energy consumption related to the building
sector is to increase the use and efficiency of the insulation, improve the construction material
and increase the awareness of the importance of using an insulation . People tend to think that
it is only a waste of money to install an insulation in their house when they are more wasting
money on buying a huge load of heating means.
Figure 1: the three pillars of sustainable development
2
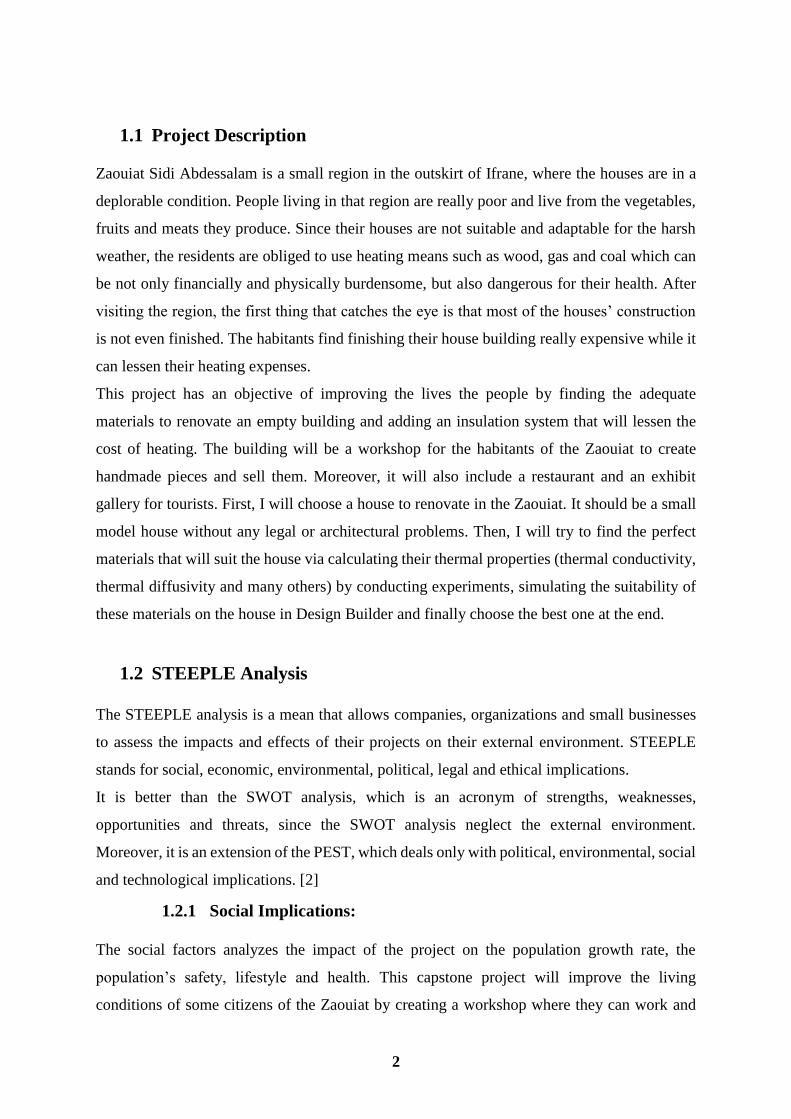
1.1 Project Description
Zaouiat Sidi Abdessalam is a small region in the outskirt of Ifrane, where the houses are in a
deplorable condition. People living in that region are really poor and live from the vegetables,
fruits and meats they produce. Since their houses are not suitable and adaptable for the harsh
weather, the residents are obliged to use heating means such as wood, gas and coal which can
be not only financially and physically burdensome, but also dangerous for their health. After
visiting the region, the first thing that catches the eye is that most of the houses’ construction
is not even finished. The habitants find finishing their house building really expensive while it
can lessen their heating expenses.
This project has an objective of improving the lives the people by finding the adequate
materials to renovate an empty building and adding an insulation system that will lessen the
cost of heating. The building will be a workshop for the habitants of the Zaouiat to create
handmade pieces and sell them. Moreover, it will also include a restaurant and an exhibit
gallery for tourists. First, I will choose a house to renovate in the Zaouiat. It should be a small
model house without any legal or architectural problems. Then, I will try to find the perfect
materials that will suit the house via calculating their thermal properties (thermal conductivity,
thermal diffusivity and many others) by conducting experiments, simulating the suitability of
these materials on the house in Design Builder and finally choose the best one at the end.
1.2 STEEPLE Analysis
The STEEPLE analysis is a mean that allows companies, organizations and small businesses
to assess the impacts and effects of their projects on their external environment. STEEPLE
stands for social, economic, environmental, political, legal and ethical implications.
It is better than the SWOT analysis, which is an acronym of strengths, weaknesses,
opportunities and threats, since the SWOT analysis neglect the external environment.
Moreover, it is an extension of the PEST, which deals only with political, environmental, social
and technological implications. [2]
1.2.1 Social Implications:
The social factors analyzes the impact of the project on the population growth rate, the
population’s safety, lifestyle and health. This capstone project will improve the living
conditions of some citizens of the Zaouiat by creating a workshop where they can work and

3
help them go through the harsh and cold weather of Zaouiat Sidi Abdessalam. Construct
buildings using natural resources can limit the risks of some health problems as well. Moreover,
the renovated building will be a place where people can gather and share some moments
together.
1.2.2 Technological Implications:
The technological factors deal with any new inventions and technologies related to the project.
This project can improve the building sector as it will be about finding an innovative mixture
of construction and insulation materials. Concerning the technologies used in the capstone, the
simulation of many mixtures will be done thanks to Design Builder and the data obtained
experimentally will be gathered thanks to BenchLink.
1.2.3 Environmental Implications:
The environmental factors study the positive and negative effects of the project on the
environment. The main goal of the project is to design and build an ecofriendly model building.
So, I will find solutions to limit the energy and heat consumption by increasing the efficiency
and effectiveness of the building and insulation materials. Moreover, decreasing the energy
consumption will lead to a decrease of the CO2 emissions.
1.2.4 Economic Implications:
Concerning the economic factors, they deal with the impact of the project on the economic
growth, inflation, interest rate, savings, investments and many business related themes. The
workshop will be a smart building, i.e. it needs to generate the costs of electricity and heating
so that almost all the profit gained from the tourist buying the art pieces and the restaurant will
go to the citizens of the Zaouiat. Besides, this workshop will bring tourists and motivate people
to invest in the Zaouiat to transform it a touristic village with hotels and many other activities
and so generate a lot of profit for the poor people of the Zaouiat.
1.2.5 Political Implications:
The political factors of the project analyses the effects of the project on the governmental
organization and the political stability. The goal of the Moroccan government lately is to
improve the sustainable development of the country by encouraging researches on how to
decrease the energy consumption. This project can be seen as helping the government
achieving its goals as it is about transforming a model house into an eco-friendly one and limit

4
its energy consumption. Moreover, this project was funded by the region of Fes and Meknes
as it was found to be interesting.
1.2.6 Legal Implications:
The legal implications see how the project may affect the tax policies, employment laws and
environmental regulations. Before choosing a building to renovate for the capstone, it was
made sure that it has no legal problems and that it follows all the construction laws. Moreover,
the capstone will not break any safety regulation. All the decisions regarding the constructing
and renovation of the house will follow the standards drawn by our country.
1.2.7 Ethical Implications:
The ethics are a set of morals and values that guide people essentially through their decision
making. In order to work on this project ethically, I need to be honest with the citizens of the
Zaouiat, keep them informed on the progress of the project and explain to them the role of each
material used and its importance. Moreover, I need to keep in mind that I should follow the
academic integrity and take it seriously. This project is an original work, and all references that
helped build this project are cited.
2. METHODOLOGY
As mentioned before, the aim of this capstone project is to find a suitable and affordable
material for the renovation and insulation of model house in Zaouiat Sidi Abdessalam in order
to reduce the energy consumption. To do so, many steps need to be followed:
The first step will be about getting a deep understanding of the materials used in the
building sectors. It is necessary to go through a bibliographic study and literature review
to first have a list of all materials used in building and insulation, know their
composition, their properties, their advantages and their disadvantages. After that, the
list of materials will be narrowed leaving only the materials that I can work with.
The second step will be experimental. In other words, it will report all the trials of the
experiments conducted with samples of mixed materials and present the result obtained
from them. This step is primordial as it will help find the thermal properties of some
combinations of materials. It will be conducted in L’Ecole Supérieure de Technologie
as they have the machines needed to do the flash and the asymmetrical hot plate
methods. In fact, Dr. Khebbazi, professor at the ESTS, and Fatima Zohra Elwardi, PhD
5
student, assisted me and guided me through the creation of the samples and extraction
of their properties.
The third steps will be a simulation in Design Builder. I will implement the mixtures of
construction and insulation materials in a small model of the renovated house and test
the efficiency and effectiveness of this materials to see if they will suit the conditions
of Zaouiat Sidi Abdessalam and choose the best mixture according the software. All
the results of the software will be enumerated in this step.
3. THEORITICAL STUDY
3.1 Properties
3.1.1 Density
The density, also known as the volumetric mass density, stands for the mass of a material
over its volume. It is usually denoted by ρ and its SI unit is Kg/m3.
ρ =𝑚
𝑉
m: the mass of the material in Kg
V: the volume of the material in m3
Ρ: the density in Kg/m3
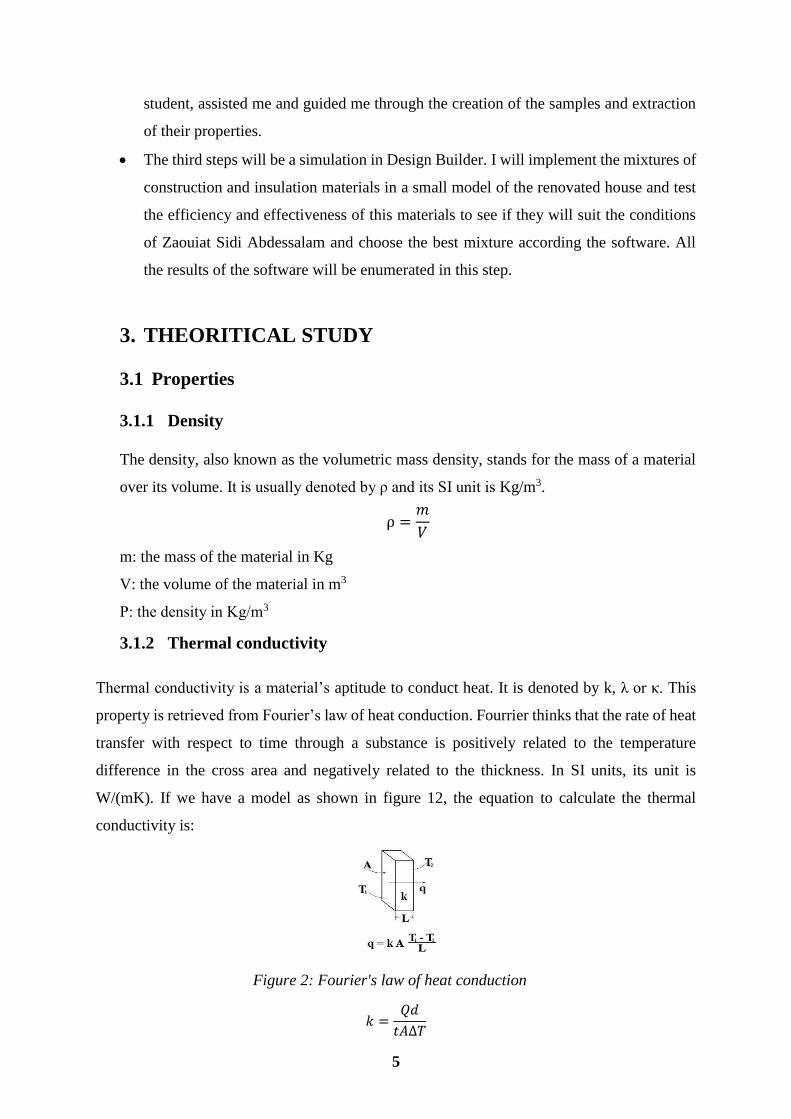
3.1.2 Thermal conductivity
Thermal conductivity is a material’s aptitude to conduct heat. It is denoted by k, λ or κ. This
property is retrieved from Fourier’s law of heat conduction. Fourrier thinks that the rate of heat
transfer with respect to time through a substance is positively related to the temperature
difference in the cross area and negatively related to the thickness. In SI units, its unit is
W/(mK). If we have a model as shown in figure 12, the equation to calculate the thermal
conductivity is:
𝑘 =𝑄𝑑
𝑡𝐴∆𝑇
Figure 2: Fourier's law of heat conduction
6
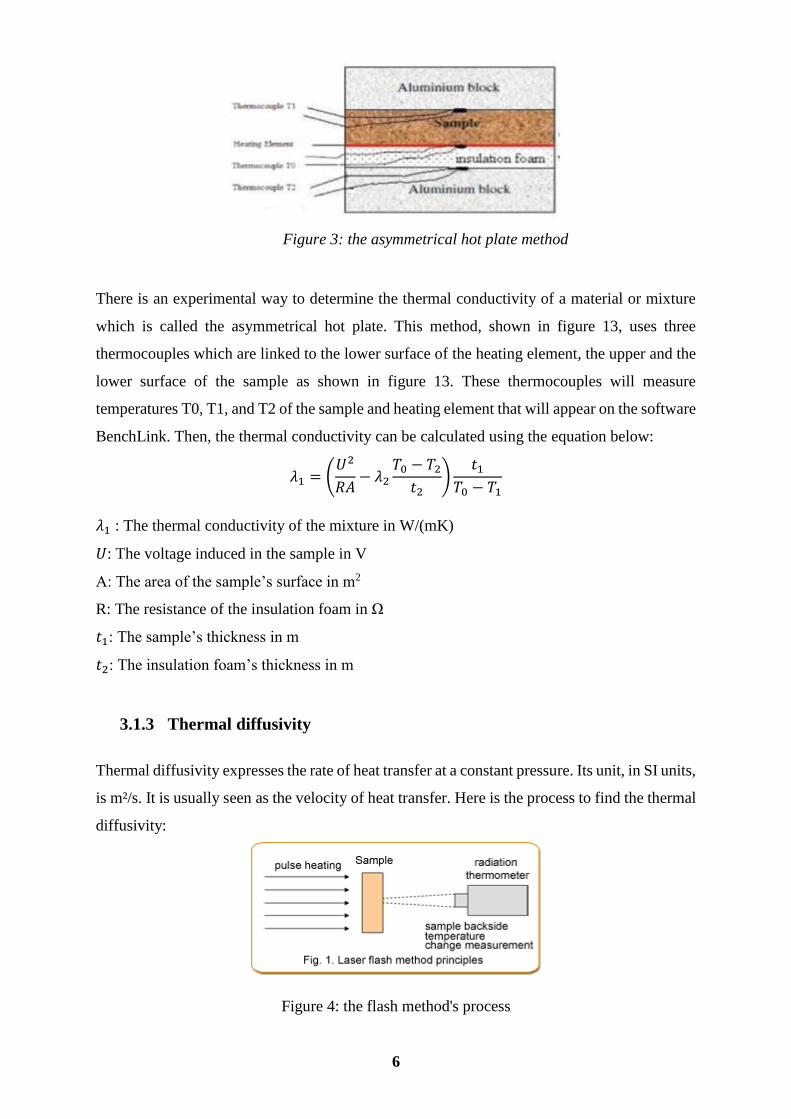
There is an experimental way to determine the thermal conductivity of a material or mixture
which is called the asymmetrical hot plate. This method, shown in figure 13, uses three
thermocouples which are linked to the lower surface of the heating element, the upper and the
lower surface of the sample as shown in figure 13. These thermocouples will measure
temperatures T0, T1, and T2 of the sample and heating element that will appear on the software
BenchLink. Then, the thermal conductivity can be calculated using the equation below:
𝜆1 = (𝑈2
𝑅𝐴− 𝜆2
𝑇0 − 𝑇2
𝑡2)
𝑡1
𝑇0 − 𝑇1
𝜆1 : The thermal conductivity of the mixture in W/(mK)
𝑈: The voltage induced in the sample in V
A: The area of the sample’s surface in m2
R: The resistance of the insulation foam in Ω
𝑡1: The sample’s thickness in m
𝑡2: The insulation foam’s thickness in m
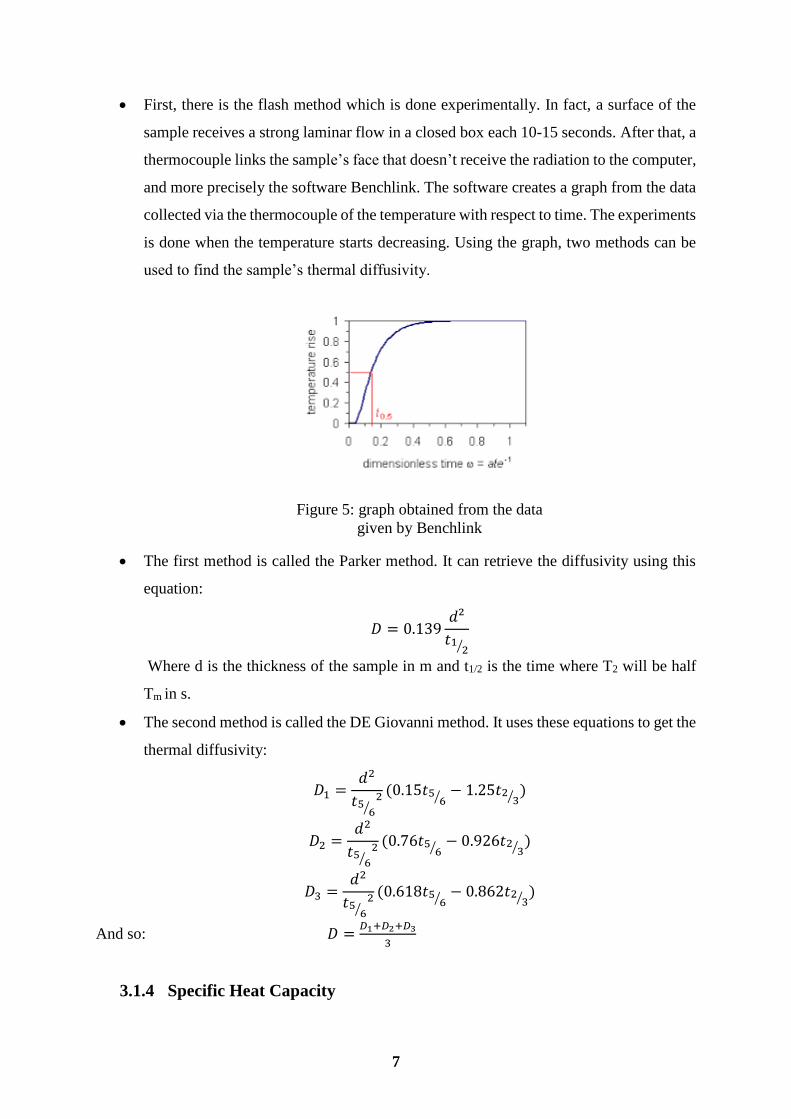
3.1.3 Thermal diffusivity
Thermal diffusivity expresses the rate of heat transfer at a constant pressure. Its unit, in SI units,
is m²/s. It is usually seen as the velocity of heat transfer. Here is the process to find the thermal
diffusivity:
Figure 4: the flash method's process
Figure 3: the asymmetrical hot plate method
7
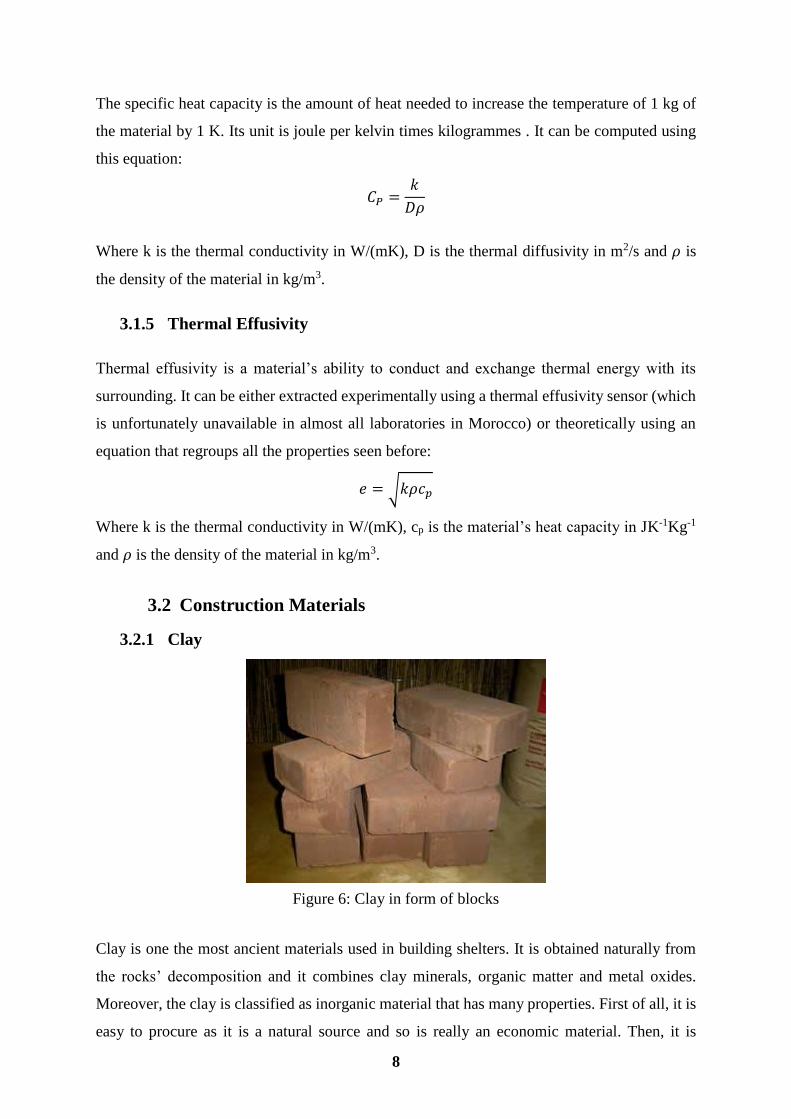
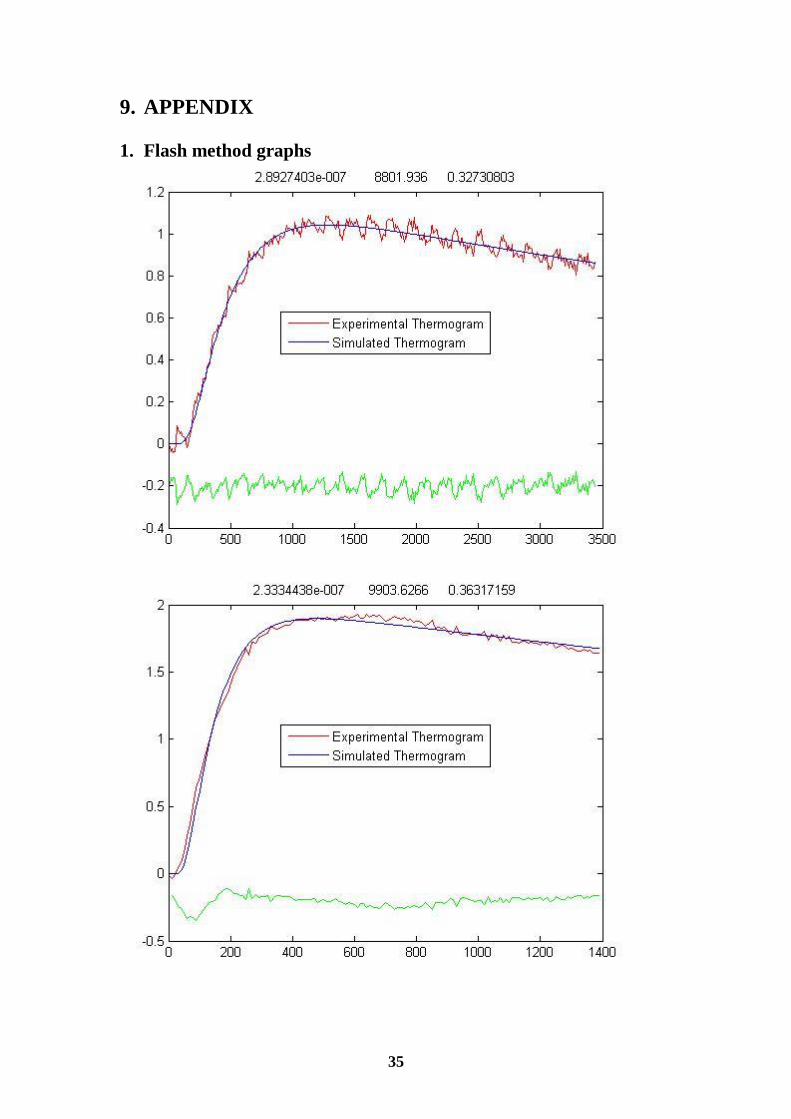
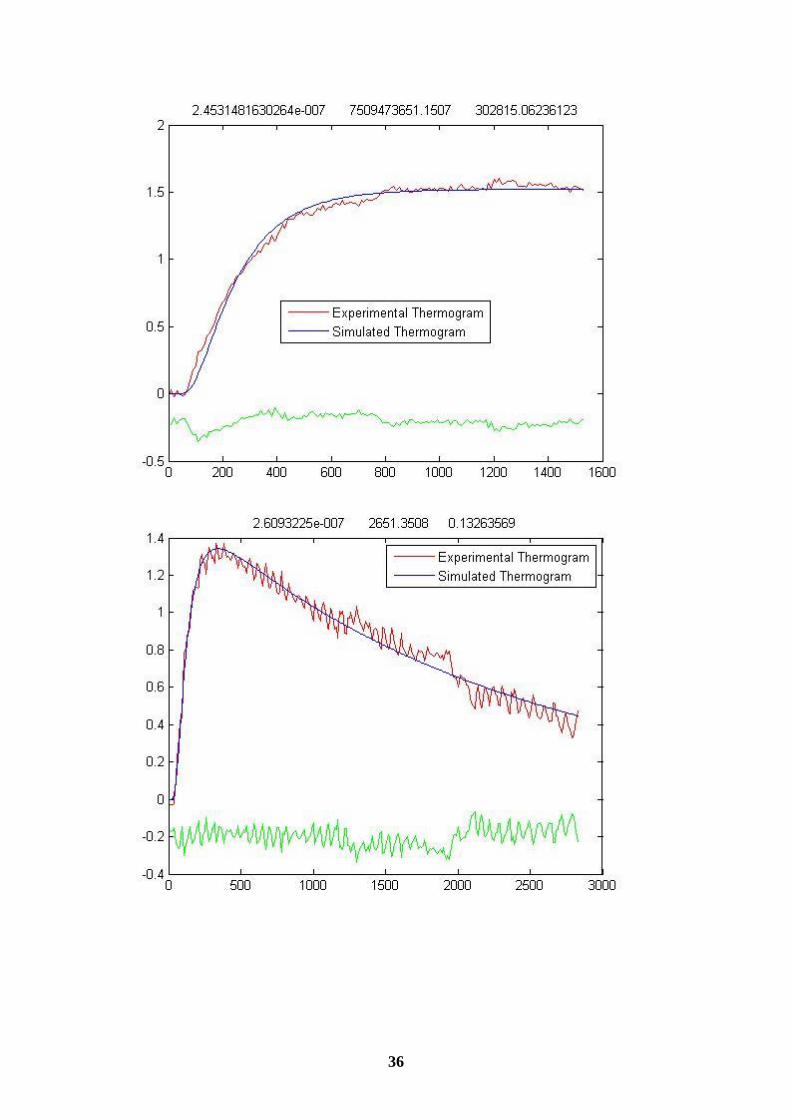
First, there is the flash method which is done experimentally. In fact, a surface of the
sample receives a strong laminar flow in a closed box each 10-15 seconds. After that, a
thermocouple links the sample’s face that doesn’t receive the radiation to the computer,
and more precisely the software Benchlink. The software creates a graph from the data
collected via the thermocouple of the temperature with respect to time. The experiments
is done when the temperature starts decreasing. Using the graph, two methods can be
used to find the sample’s thermal diffusivity.
The first method is called the Parker method. It can retrieve the diffusivity using this
equation:
𝐷 = 0.139𝑑²
𝑡12⁄
Where d is the thickness of the sample in m and t1/2 is the time where T2 will be half
Tm in s.
The second method is called the DE Giovanni method. It uses these equations to get the
thermal diffusivity:
𝐷1 =𝑑2
𝑡56⁄
2 (0.15𝑡56⁄ − 1.25𝑡2
3⁄ )
𝐷2 =𝑑2
𝑡56⁄
2 (0.76𝑡56⁄ − 0.926𝑡2
3⁄ )
𝐷3 =𝑑2
𝑡56⁄
2 (0.618𝑡56⁄ − 0.862𝑡2
3⁄ )
And so: 𝐷 =𝐷1+𝐷2+𝐷3
3
3.1.4 Specific Heat Capacity
Figure 5: graph obtained from the data
given by Benchlink
8
The specific heat capacity is the amount of heat needed to increase the temperature of 1 kg of
the material by 1 K. Its unit is joule per kelvin times kilogrammes . It can be computed using
this equation:
𝐶𝑃 =𝑘
𝐷𝜌
Where k is the thermal conductivity in W/(mK), D is the thermal diffusivity in m2/s and 𝜌 is
the density of the material in kg/m3.
3.1.5 Thermal Effusivity
Thermal effusivity is a material’s ability to conduct and exchange thermal energy with its
surrounding. It can be either extracted experimentally using a thermal effusivity sensor (which
is unfortunately unavailable in almost all laboratories in Morocco) or theoretically using an
equation that regroups all the properties seen before:
𝑒 = √𝑘𝜌𝑐𝑝
Where k is the thermal conductivity in W/(mK), cp is the material’s heat capacity in JK-1Kg-1
and 𝜌 is the density of the material in kg/m3.
3.2 Construction Materials
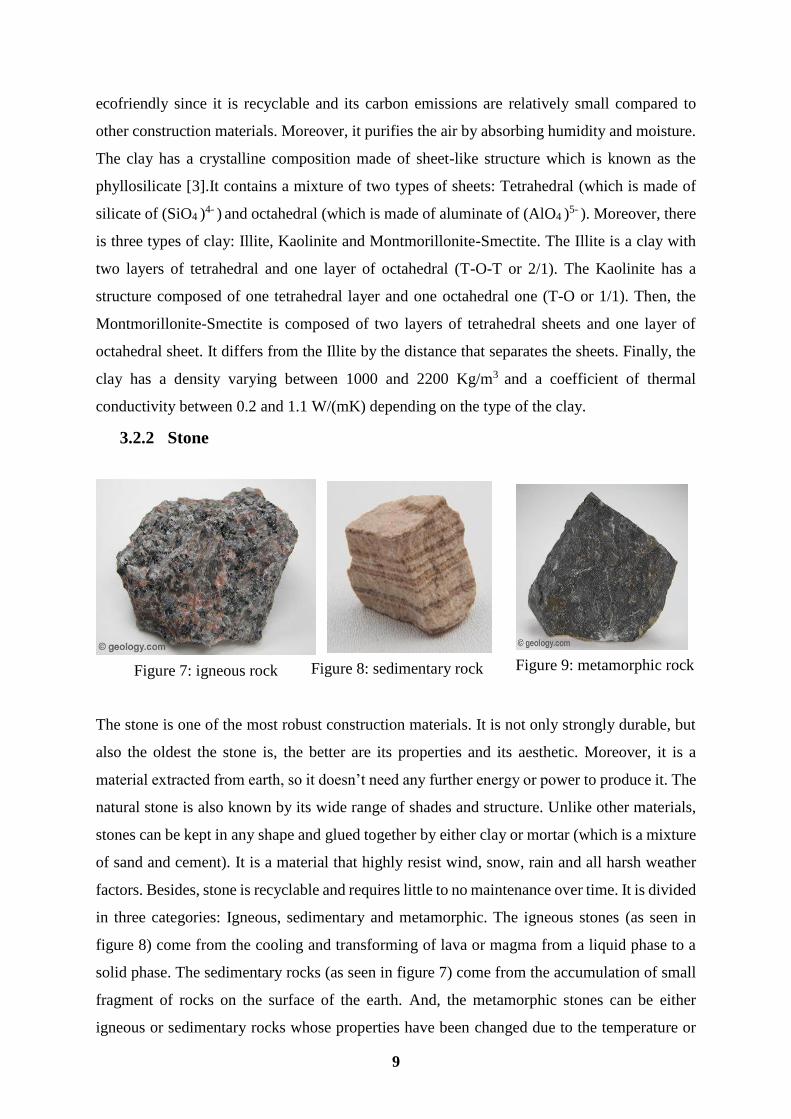
3.2.1 Clay
Clay is one the most ancient materials used in building shelters. It is obtained naturally from
the rocks’ decomposition and it combines clay minerals, organic matter and metal oxides.
Moreover, the clay is classified as inorganic material that has many properties. First of all, it is
easy to procure as it is a natural source and so is really an economic material. Then, it is
Figure 6: Clay in form of blocks
9
ecofriendly since it is recyclable and its carbon emissions are relatively small compared to
other construction materials. Moreover, it purifies the air by absorbing humidity and moisture.
The clay has a crystalline composition made of sheet-like structure which is known as the
phyllosilicate [3].It contains a mixture of two types of sheets: Tetrahedral (which is made of
silicate of (SiO4 )4- ) and octahedral (which is made of aluminate of (AlO4 )
5- ). Moreover, there
is three types of clay: Illite, Kaolinite and Montmorillonite-Smectite. The Illite is a clay with
two layers of tetrahedral and one layer of octahedral (T-O-T or 2/1). The Kaolinite has a
structure composed of one tetrahedral layer and one octahedral one (T-O or 1/1). Then, the
Montmorillonite-Smectite is composed of two layers of tetrahedral sheets and one layer of
octahedral sheet. It differs from the Illite by the distance that separates the sheets. Finally, the
clay has a density varying between 1000 and 2200 Kg/m3 and a coefficient of thermal
conductivity between 0.2 and 1.1 W/(mK) depending on the type of the clay.
3.2.2 Stone
The stone is one of the most robust construction materials. It is not only strongly durable, but
also the oldest the stone is, the better are its properties and its aesthetic. Moreover, it is a
material extracted from earth, so it doesn’t need any further energy or power to produce it. The
natural stone is also known by its wide range of shades and structure. Unlike other materials,
stones can be kept in any shape and glued together by either clay or mortar (which is a mixture
of sand and cement). It is a material that highly resist wind, snow, rain and all harsh weather
factors. Besides, stone is recyclable and requires little to no maintenance over time. It is divided
in three categories: Igneous, sedimentary and metamorphic. The igneous stones (as seen in
figure 8) come from the cooling and transforming of lava or magma from a liquid phase to a
solid phase. The sedimentary rocks (as seen in figure 7) come from the accumulation of small
fragment of rocks on the surface of the earth. And, the metamorphic stones can be either
igneous or sedimentary rocks whose properties have been changed due to the temperature or
Figure 7: igneous rock Figure 8: sedimentary rock Figure 9: metamorphic rock

10
the pressure they were created in [4]. Finally, stone has a density between 2300 and 2800 kg/m3
and a thermal conductivity of about 1.7 W/(mK).
3.2.3 Cob
Cob is a material composed of clay, sand, straw and sometimes soil, as shown in figure 10.
These ingredients are mixed together with specific amounts to get a dough that is left to dry
after the house is built. Each ingredient is important and has a unique job. For example, the
clay (and sometimes with soil) plays the role of the glue that holds all the other ingredients
together and the straw gives the walls made of cob its tensile strength. The cob is a good
material for building construction as is it very inexpensive and hence affordable to many. It has
an excellent thermal mass and so it will keep the houses warm in winter and cold in summer.
Moreover, the cob is very easy to use, doesn’t require any special equipment or training and
can last very long. Finally, even if it depends on the amount of each ingredient, the cob’s
average density is 1685 kg/m3 and its average thermal conductivity is 1.1 W/mK [5].
3.2.4 Concrete
The concrete is one of the most used materials in construction. It is cheap and easily found in
most places. Moreover, it can be shaped in any way possible, but it is usually used as bricks as
shown in figure 11. The durability of concrete is very high and it helps prevent fires as it is a
Figure 11: Concrete brick
Figure 10: cob
11
non-combustible material. This material is mainly made of aggregate, which is a mixture of
gravel and rocks. There are two types of concrete depending on the type of aggregate it
contains: lightweight and heavyweight concrete. The lightweight concrete contains aggregate
with a density less than 2080 kg/m3 due to its porous nature. Which means that it has a high
water absorber. The heavyweight concrete contains aggregate that have a density greater than
2080 kg/m3. So, unlike lightweight concrete, it is really less porous and have a greater mass-
to-volume ratio [6].
3.3 Insulation Materials
3.3.1 Industrial Materials
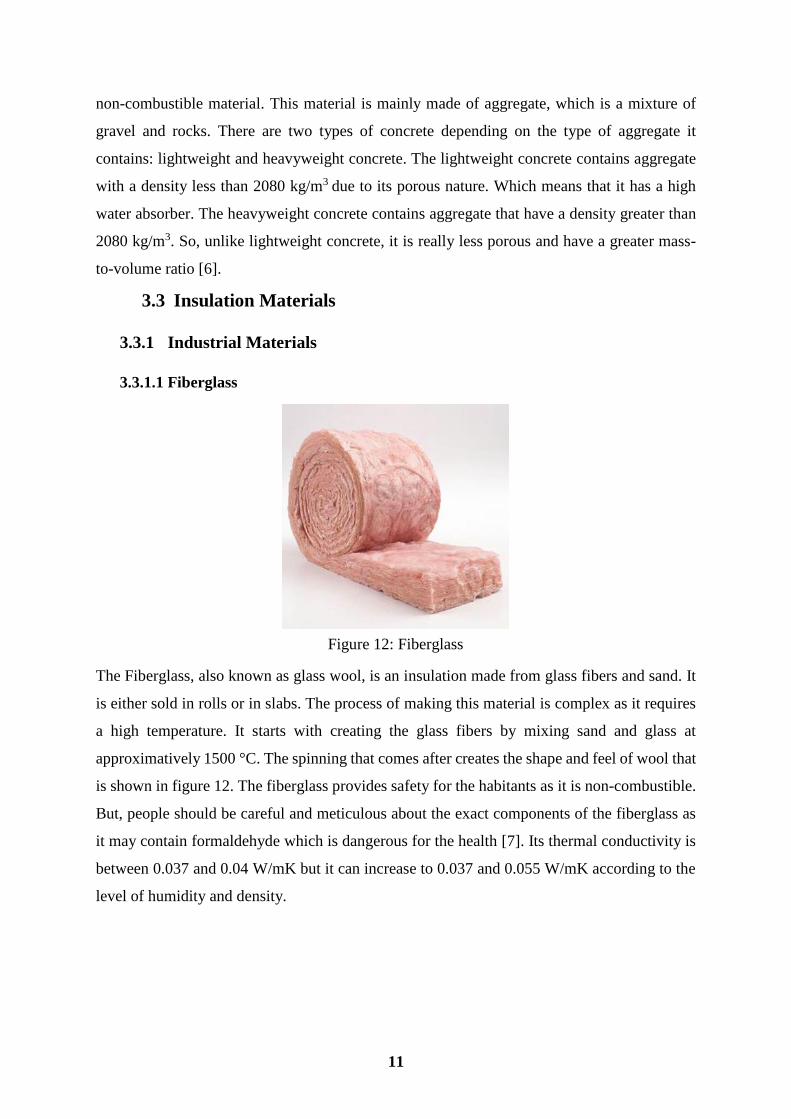
3.3.1.1 Fiberglass
The Fiberglass, also known as glass wool, is an insulation made from glass fibers and sand. It
is either sold in rolls or in slabs. The process of making this material is complex as it requires
a high temperature. It starts with creating the glass fibers by mixing sand and glass at
approximatively 1500 °C. The spinning that comes after creates the shape and feel of wool that
is shown in figure 12. The fiberglass provides safety for the habitants as it is non-combustible.
But, people should be careful and meticulous about the exact components of the fiberglass as
it may contain formaldehyde which is dangerous for the health [7]. Its thermal conductivity is
between 0.037 and 0.04 W/mK but it can increase to 0.037 and 0.055 W/mK according to the
level of humidity and density.
Figure 12: Fiberglass

12
3.3.1.2 Rock Wool:
The rock wool, also known as mineral wool, is an insulation material which is similar to
fiberglass but using molten rock to produce fibers. In fact, the manufacture process starts with
melting rocks at a temperature of about 1600°C. Just like the fiberglass, the spinning procedure
after creates the wool texture of the insulation material, as shown in figure 13. The rock wool
is not a great resistant of fire as it can burst into flames, but it remains a resistant to moisture
and continues to do its insulation work even when humid. Moreover, the insulation material
can regulate not only the exchange of heat, but also the exchange of sounds with the
surroundings. However, it can create a feeling of irritation which can worsen to become lung
cancer. The mineral wool’s thermal conductivity is slightly bigger than the fiberglass’ thermal
conductivity. [8]
3.3.1.3 Cellulose
Cellulose insulation is a material made from paper or wood fibers. It is made by crashing the
newspaper waste to small pieces thanks to a hammer mill as seen in figure 14. The cellulose
Figure 13: Rock Wool
Figure 14: Cellulose
13
insulation is the most resistant insulation material to fire and provides also a good sound
insulation. Moreover, it is made of about 80% recycled matter. Its density is 56 kg/m3 and its
thermal conductivity is 0.040 and 0.066 W/mK. [9]
3.3.2 Natural Materials
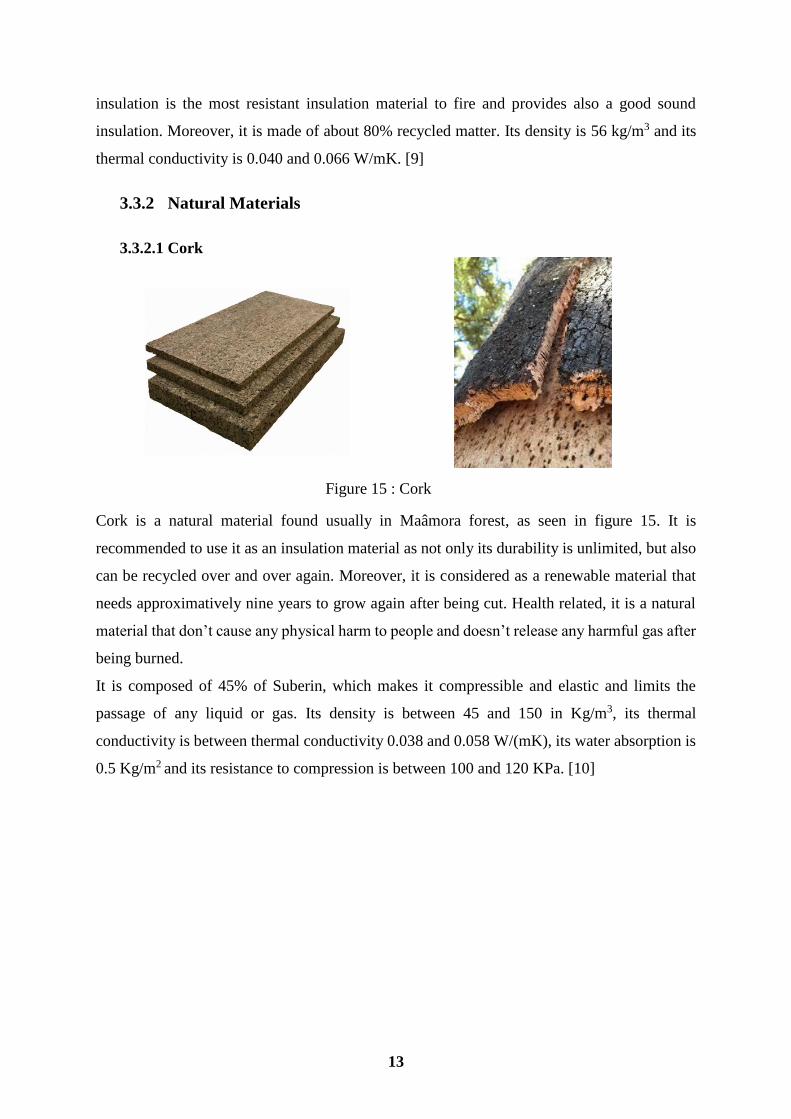
3.3.2.1 Cork
Cork is a natural material found usually in Maâmora forest, as seen in figure 15. It is
recommended to use it as an insulation material as not only its durability is unlimited, but also
can be recycled over and over again. Moreover, it is considered as a renewable material that
needs approximatively nine years to grow again after being cut. Health related, it is a natural
material that don’t cause any physical harm to people and doesn’t release any harmful gas after
being burned.
It is composed of 45% of Suberin, which makes it compressible and elastic and limits the
passage of any liquid or gas. Its density is between 45 and 150 in Kg/m3, its thermal
conductivity is between thermal conductivity 0.038 and 0.058 W/(mK), its water absorption is
0.5 Kg/m2 and its resistance to compression is between 100 and 120 KPa. [10]
Figure 15 : Cork
14
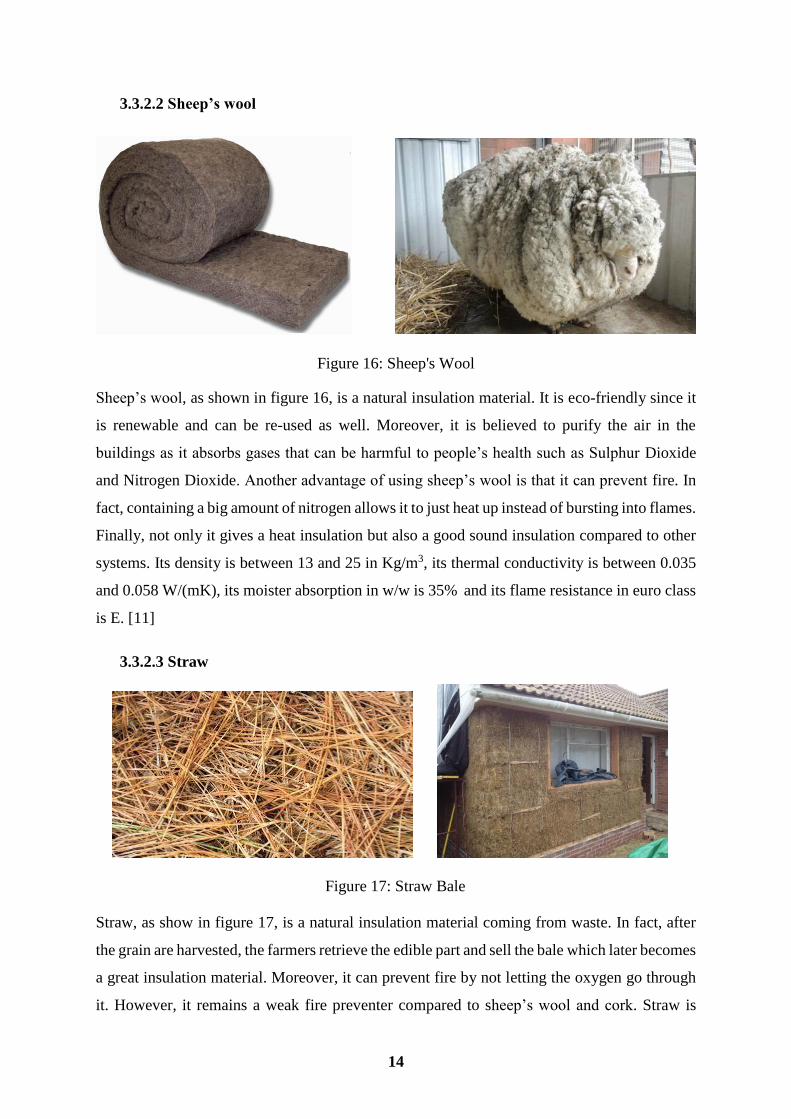
3.3.2.2 Sheep’s wool
Figure 16: Sheep's Wool
Sheep’s wool, as shown in figure 16, is a natural insulation material. It is eco-friendly since it
is renewable and can be re-used as well. Moreover, it is believed to purify the air in the
buildings as it absorbs gases that can be harmful to people’s health such as Sulphur Dioxide
and Nitrogen Dioxide. Another advantage of using sheep’s wool is that it can prevent fire. In
fact, containing a big amount of nitrogen allows it to just heat up instead of bursting into flames.
Finally, not only it gives a heat insulation but also a good sound insulation compared to other
systems. Its density is between 13 and 25 in Kg/m3, its thermal conductivity is between 0.035
and 0.058 W/(mK), its moister absorption in w/w is 35% and its flame resistance in euro class
is E. [11]
3.3.2.3 Straw
Straw, as show in figure 17, is a natural insulation material coming from waste. In fact, after
the grain are harvested, the farmers retrieve the edible part and sell the bale which later becomes
a great insulation material. Moreover, it can prevent fire by not letting the oxygen go through
it. However, it remains a weak fire preventer compared to sheep’s wool and cork. Straw is
Figure 17: Straw Bale
15
usually used as it gives thick walls that, using other materials, can be really expensive and that
helps in the aesthetic of the house. Finally, straw bale, as an insulation material, is affordable
and easy to find. Its density is between 90 and 180 in Kg/m3, its thermal conductivity is between
thermal conductivity 0.044 and 0.063 W/(mK). [12]
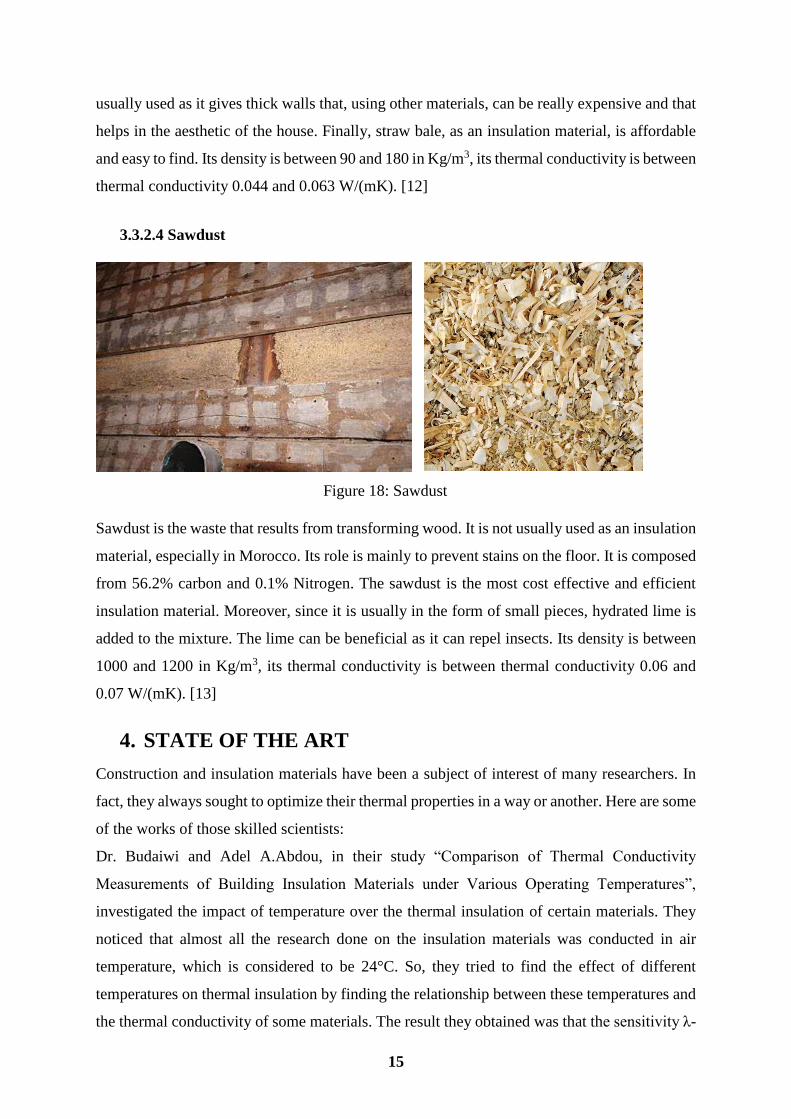
3.3.2.4 Sawdust
Sawdust is the waste that results from transforming wood. It is not usually used as an insulation
material, especially in Morocco. Its role is mainly to prevent stains on the floor. It is composed
from 56.2% carbon and 0.1% Nitrogen. The sawdust is the most cost effective and efficient
insulation material. Moreover, since it is usually in the form of small pieces, hydrated lime is
added to the mixture. The lime can be beneficial as it can repel insects. Its density is between
1000 and 1200 in Kg/m3, its thermal conductivity is between thermal conductivity 0.06 and
0.07 W/(mK). [13]
4. STATE OF THE ART
Construction and insulation materials have been a subject of interest of many researchers. In
fact, they always sought to optimize their thermal properties in a way or another. Here are some
of the works of those skilled scientists:
Dr. Budaiwi and Adel A.Abdou, in their study “Comparison of Thermal Conductivity
Measurements of Building Insulation Materials under Various Operating Temperatures”,
investigated the impact of temperature over the thermal insulation of certain materials. They
noticed that almost all the research done on the insulation materials was conducted in air
temperature, which is considered to be 24°C. So, they tried to find the effect of different
temperatures on thermal insulation by finding the relationship between these temperatures and
the thermal conductivity of some materials. The result they obtained was that the sensitivity λ-
Figure 18: Sawdust

16
value of the materials to different temperatures is related to the density of the material. To be
more precise, they found that the lower the density of a material, the bigger are the impacts of
temperature on the thermal conductivity of the material. Dr.Budaiwi and Adel A.Abdou
focused their work on industrial insulation materials such as fiberglass, wood wool,
polyethylene and others, while I’m more interested by natural materials as they are healthier,
cheaper and recyclable.
Another talented researcher was interested by the thermal insulation. Bjørn Petter Jelle in his
research project “Traditional, state-of-the-art and future thermal building insulation materials
and solutions – Properties, requirements and possibilities”, started by finding the advantages
and disadvantages of many industrial and natural insulation materials. Then, he Int deeper by
retrieving some thermal properties such as thermal conductivity, perforation, robustness,
emission during fire and fire resistivity and climate aging of some industrial materials such as
expanded and extruded polystyrene, polyurethane, mineral wools and many others. He noticed
that, from the materials stated before, there is almost no one that achieve all the requirements
of a good thermal insulation. So, he turned toward future thermal building insulation materials
such as vacuum insulation and Nano insulation materials, tried to find their strengths and
weaknesses and compared them to the previous insulation materials. Once again, this research
is more focused on industrial and futuristic insulation materials even if it mentioned a little bit
natural insulation systems. The main goal of this capstone is to build an ecofriendly building,
and the most ecofriendly materials are the natural ones.
Finally, there is the work of Dr. Soumia Mounir which is a little bit close to my capstone. In
her research project “Experimental approach of measuring thermal properties for ecological
materials based on additives cork or wool and Illite”, she worked on extracting the thermal
properties (thermal conductivity, thermal effusivity and thermal diffusivity) of the clay when
it is mixed with the cork, the sheep’s wool or plastic waste experimentally. Then, she studied
thermal inertia of some materials to calculate the delay temperature and heat flow densities of
the mixtures. Finally, she conducted a simulation in a software called TRNSYS to determine
the effect of those mixtures on the energy efficiency of a model house. She found, from the
simulation, that the mixture requiring the least amount of heating in winter is the mixture of
clay and sheep’s wool. The difference between my capstone project and Dr. Soumia’s research
project is that I focused on the cork and straw while she was interested in the cork, the sheep’s
wool and the waste plastic.
5. EXPERIMENTAL STUDY
17
5.1 Experimental procedures
5.1.1 Materials used
5.1.1.1 Clay
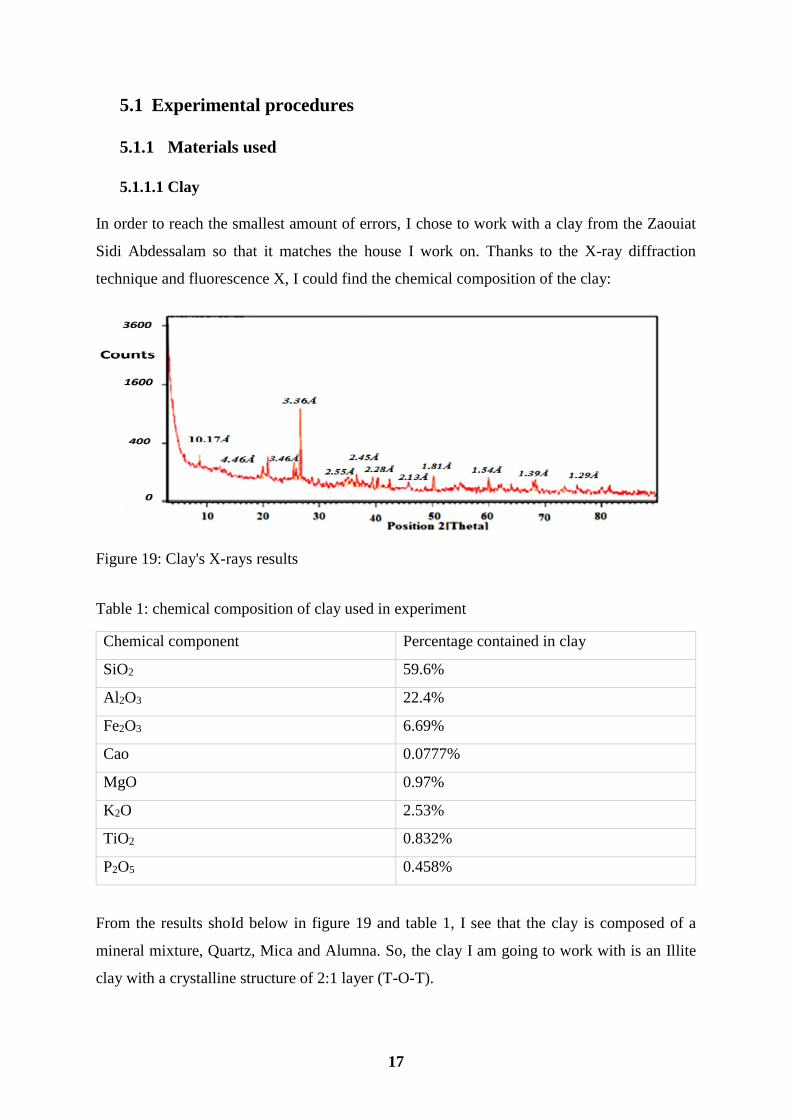
In order to reach the smallest amount of errors, I chose to work with a clay from the Zaouiat
Sidi Abdessalam so that it matches the house I work on. Thanks to the X-ray diffraction
technique and fluorescence X, I could find the chemical composition of the clay:
Figure 19: Clay's X-rays results
Table 1: chemical composition of clay used in experiment
Chemical component Percentage contained in clay
SiO2 59.6%
Al2O3 22.4%
Fe2O3 6.69%
Cao 0.0777%
MgO 0.97%
K2O 2.53%
TiO2 0.832%
P2O5 0.458%
From the results shoId below in figure 19 and table 1, I see that the clay is composed of a
mineral mixture, Quartz, Mica and Alumna. So, the clay I am going to work with is an Illite
clay with a crystalline structure of 2:1 layer (T-O-T).
18
I chose clay as it is abundant in the area, and so it would be easy and cheap to procure.
Moreover, since it is an Illite clay, it has many advantages such as low water absorption, low
shrinkage, chemical stability, thermal and electrical insulation and many others.
5.1.1.2 Cork
I decided to work with the cork as a substitute of rock used to build the house. It is a material
in form of aggregate retrieved from Mâamora forest. Even if it is not really accessible to the
villagers of Zaouiat Sidi Abdessalam, I chose this material for its good thermal properties. It is
really light and can be compressed easily. Moreover, according to Khabbazi [14], the cork,
when mixed to cement, contribute to increase the energy efficiency of the house.
5.1.1.3 Straw
The straw, as seen in the theoretical study, has many advantages. The main important advantage
for our research is its good thermal insulation. I chose straw over many other insulation
materials as it is cheap and easy to afford. Moreover, it would not need any other transportation
costs as it is found everywhere, especially in small villages where they raise sheep. Moreover,
for this project, it would be beneficial to have two components to compare to and to choose
from at the end.
5.1.1.4 Mortar
Mortar is the combination of sand, cement and water. It has many uses, either serve as a binder
and so links the construction materials together, or serve as a protection layer for the
construction materials. Since I want to use clay as a binder in the mixtures, I will mainly add
mortar to the mixture as a protection layer.
5.1.2 Samples’ creation
The samples Ire created thanks to a wooden mold of approximately 11.5x11.5x3.5 cm. I created
8 samples with different mixtures in each samples. Then, I left the samples to dry in the air for
a long period of time first. After that, I put them in an oven with a temperature of 40° C to get
rid of any humidity remaining in them. Before mixing the materials together, I measured the
amount needed to have the ingredient filling the whole mold three times and calculated their
average. After that, I calculated the volume of the wooden mold which is:
𝑉𝑚𝑜𝑙𝑑 = ℎ𝑖𝑔ℎ𝑡 ∗ 𝑤𝑖𝑑𝑡ℎ ∗ 𝑙𝑒𝑛𝑔𝑡ℎ
= 3.5 ∗ 11.5 ∗ 11.5
= 462.875 𝑐𝑚3
= 462.875 ∗ 10−6𝑚3

19
Then, I calculated the density of using the average mass over the volume of the mold to get the
density of the sample. The masses and densities obtained are shoId in table 2.
Table 2: Masses and densities of the materials used
Material Mass to fill the mold Volume of the mold Density of material
Clay (dry) 520.5 g 462.875 cm3 1124.49 kg/m3
Cork 35.7 g 462.875 cm3 77.13 kg/m3
Straw 18.95 g 462.875 cm3 40.94 kg/m3
Mortar 815.59 g 462.875 cm3 1762 kg/m3
This step was done so that I can see if the results obtained from the mixtures are correct or not
as their densities need to be between the smallest and greatest densities of their ingredients.
After that, I came up with the mixtures, each different in the choice of materials, thickness or
both.
Mixture 1:
For the first mixture, I chose the cork, as shown in figure 20. In order to find the best fit of cork
with the clay, I tried many ratios. So, for this mixture, I decided to have the full amount of cork
to fill the mold (which means an amount of 35.7 g) and half the amount of clay needed to fill
the mold (which gave us approximatively 208g) with a water ratio of 0.5 W/g (which is 104 ml
of water). I mixed very well the clay with the cork until I was sure that each piece of cork will
stick with the other, I added the mixture in the mold and left it to dry in the air. It contains 15%
of cork and 85% of clay.
Figure 20: Mixture 1 (15%cork+85%clay)
20
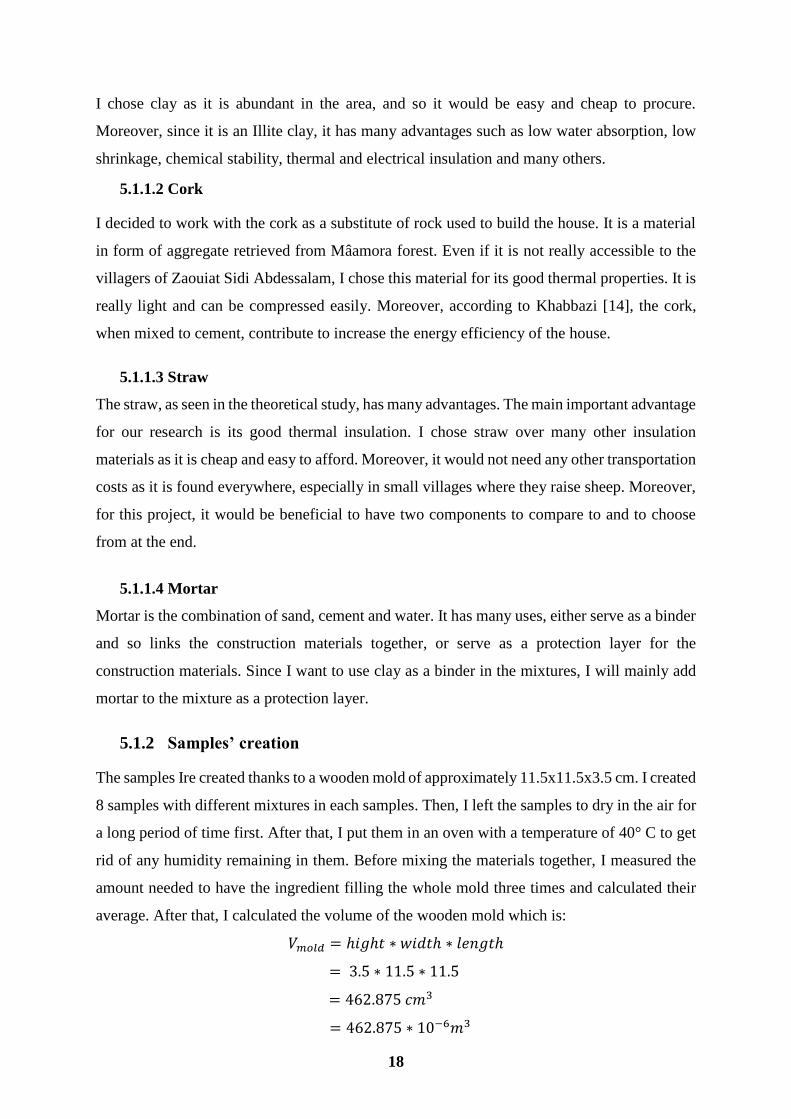
Mixture 2:
In the second mixture, I wanted first to change the ratio of cork and clay. But, after second
thoughts, I preferred to keep the same mixture but change the thickness instead. So, I prepared
the same mixture but with smaller amount. In other words, I divided both the amount of clay
and cork used in mixture 2 in half, i.e. I worked with 104.4g of clay with a ratio of 0.4 W/g (I
reduced the water to clay ratio as I noticed that in mixture 2 the clay was too liquid and watery).
With this amount, I filled 2 cm of thickness from the mold which originally have a thickness
of 3.5 cm. After that, I decided to add a protection layer of mortar. After trying many ratios,
the one that gave a mortar which is viscous is one amount of sand, one amount of cement and
0.25 amount of water. After mixing 60g of sand, 60g of cement and 30ml of water, I added it
on top of the clay-cork mixture which gave a thickness of 0.5cm, as shown in figure 18. This
mixtures contains 7% of cork, 43% of clay and 50% of mortar
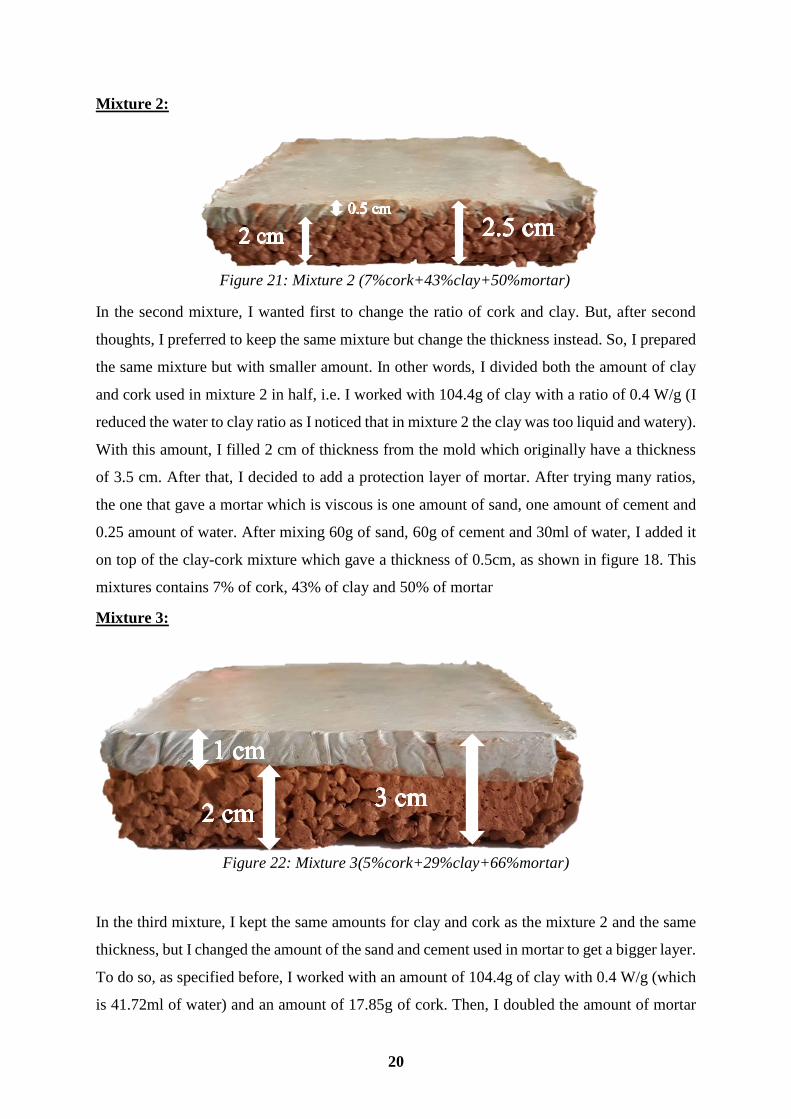
Mixture 3:
Figure 22: Mixture 3(5%cork+29%clay+66%mortar)
In the third mixture, I kept the same amounts for clay and cork as the mixture 2 and the same
thickness, but I changed the amount of the sand and cement used in mortar to get a bigger layer.
To do so, as specified before, I worked with an amount of 104.4g of clay with 0.4 W/g (which
is 41.72ml of water) and an amount of 17.85g of cork. Then, I doubled the amount of mortar
Figure 21: Mixture 2 (7%cork+43%clay+50%mortar)
21
used in mixture 3 using another ratio. As I wanted a mixture of mortar that is mushier, I used
one amount of sand, one amount of cement and 0.2 amount of water instead of 0.25. So I
worked with 120g of sand, 120g of cement and 48 ml of water. It gave approximatively 2cm
of clay-cork mixture and 1cm of mortar as seen in figure 19. It has 5% of cork, 29% of clay
and 66% of mortar.
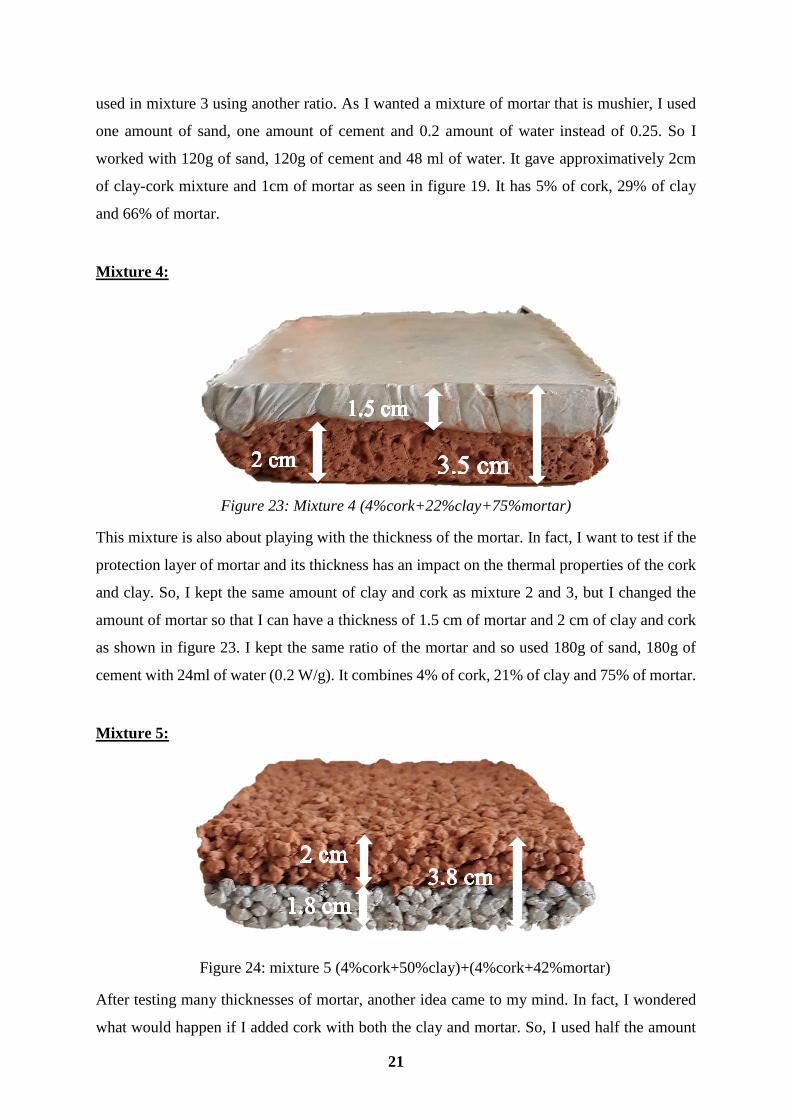
Mixture 4:
This mixture is also about playing with the thickness of the mortar. In fact, I want to test if the
protection layer of mortar and its thickness has an impact on the thermal properties of the cork
and clay. So, I kept the same amount of clay and cork as mixture 2 and 3, but I changed the
amount of mortar so that I can have a thickness of 1.5 cm of mortar and 2 cm of clay and cork
as shown in figure 23. I kept the same ratio of the mortar and so used 180g of sand, 180g of
cement with 24ml of water (0.2 W/g). It combines 4% of cork, 21% of clay and 75% of mortar.
Mixture 5:
After testing many thicknesses of mortar, another idea came to my mind. In fact, I wondered
what would happen if I added cork with both the clay and mortar. So, I used half the amount
Figure 23: Mixture 4 (4%cork+22%clay+75%mortar)
Figure 24: mixture 5 (4%cork+50%clay)+(4%cork+42%mortar)

22
needed to fill the mold of cork (which is 17.85g) with half the amount used to fill the mold of
clay (which gives 208g) with 90g of sand, 90g of cement and 36ml of water (0.2 W/g) mixed
with the same amount of cork used before. It has 4% of cork with 50% of clay and 4% of cork
with 42% of mortar.
Mixture 6:
After using the cork as first substitute to the stones used in the model house, I replaced it again
with straw. For this mixture, I choose to have the straw predominant over the clay. Hence, I
used the full amount of straw to fill the mold (which gives 18.95g) and half the amount of clay
used to fill the mold (which is 208g). Then, I mixed all the ingredient together and pushed the
clay and straw into the mold until I got a surface which is neat and horizontal. I noticed that
the amount of straw was really bigger than the clay and that it might not hold very well (as
shows figure 25), but I decided to leave it that way. It contains 8% of straw and 92% of clay.
Mixture 7
Figure 25: mixture 6 (8%straw+92%clay)
Figure 26: mixture 7 (4%straw+96%clay)
23
As mentioned before, using the full amount of straw to fill the mold was not very efficient. So,
I added this mixture to use another straw to clay ratio. For this mixture, I used the same amount
of clay as mixture 6 (which is 208g) with 0.3 W/g (which gives 62.4ml of water), and I added
half the amount of straw used in mixture 6 (which is 9.475g). Then I pushed the mixture into
the mold as done before to give it a well-ordered surface. This mixture is better than the
previous one as there was enough clay to hold the straw together, as shown in figure 26. It has
4% of straw and 96% of clay
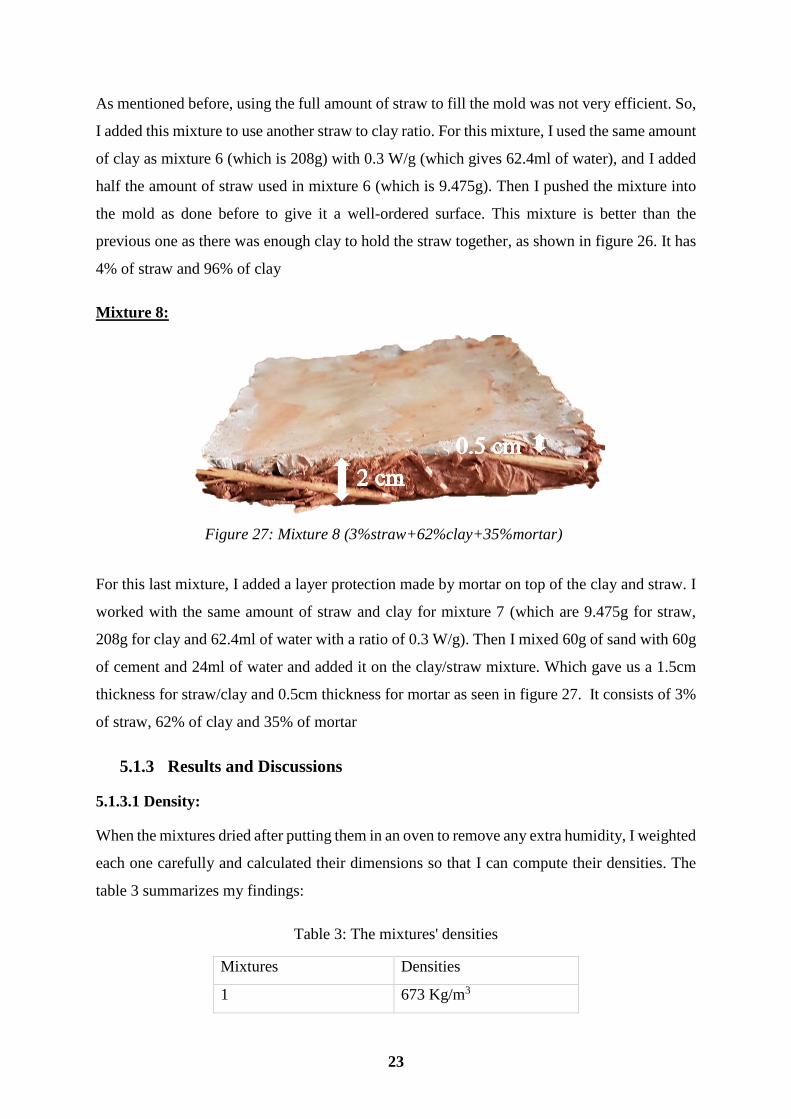
Mixture 8:
For this last mixture, I added a layer protection made by mortar on top of the clay and straw. I
worked with the same amount of straw and clay for mixture 7 (which are 9.475g for straw,
208g for clay and 62.4ml of water with a ratio of 0.3 W/g). Then I mixed 60g of sand with 60g
of cement and 24ml of water and added it on the clay/straw mixture. Which gave us a 1.5cm
thickness for straw/clay and 0.5cm thickness for mortar as seen in figure 27. It consists of 3%
of straw, 62% of clay and 35% of mortar
5.1.3 Results and Discussions
5.1.3.1 Density:
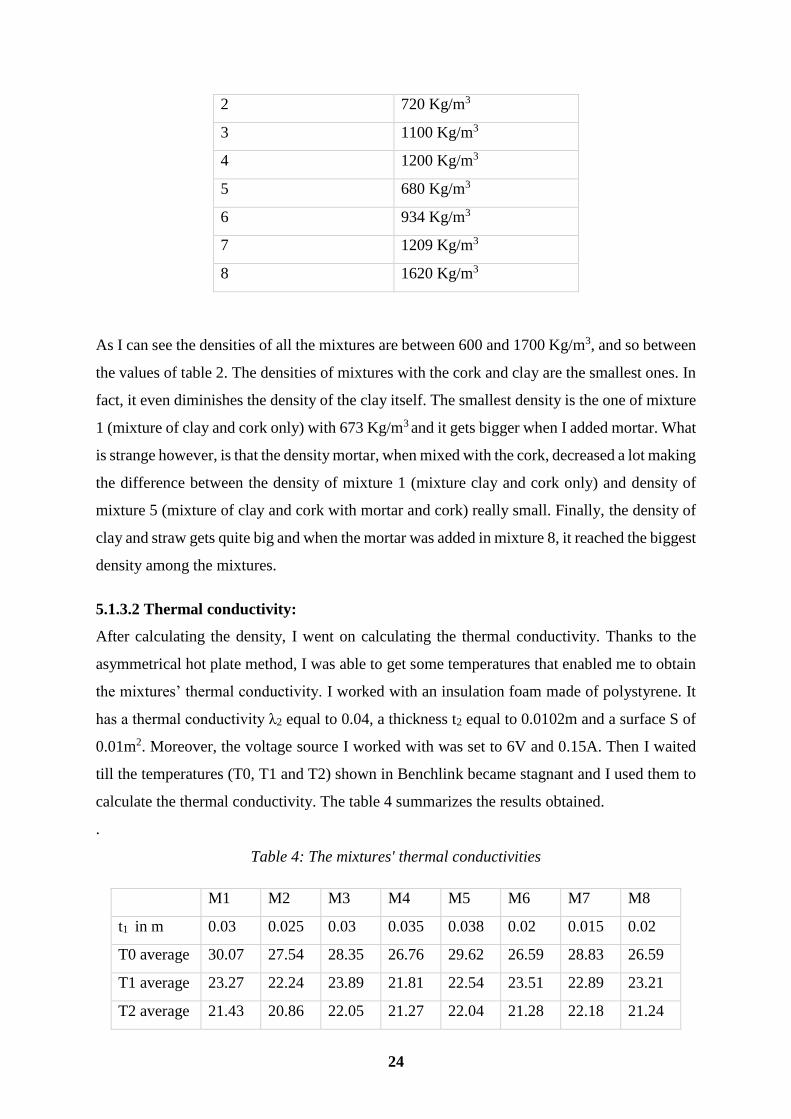
When the mixtures dried after putting them in an oven to remove any extra humidity, I weighted
each one carefully and calculated their dimensions so that I can compute their densities. The
table 3 summarizes my findings:
Table 3: The mixtures' densities
Mixtures Densities
1 673 Kg/m3
Figure 27: Mixture 8 (3%straw+62%clay+35%mortar)
24
2 720 Kg/m3
3 1100 Kg/m3
4 1200 Kg/m3
5 680 Kg/m3
6 934 Kg/m3
7 1209 Kg/m3
8 1620 Kg/m3
As I can see the densities of all the mixtures are between 600 and 1700 Kg/m3, and so between
the values of table 2. The densities of mixtures with the cork and clay are the smallest ones. In
fact, it even diminishes the density of the clay itself. The smallest density is the one of mixture
1 (mixture of clay and cork only) with 673 Kg/m3 and it gets bigger when I added mortar. What
is strange however, is that the density mortar, when mixed with the cork, decreased a lot making
the difference between the density of mixture 1 (mixture clay and cork only) and density of
mixture 5 (mixture of clay and cork with mortar and cork) really small. Finally, the density of
clay and straw gets quite big and when the mortar was added in mixture 8, it reached the biggest
density among the mixtures.
5.1.3.2 Thermal conductivity:
After calculating the density, I went on calculating the thermal conductivity. Thanks to the
asymmetrical hot plate method, I was able to get some temperatures that enabled me to obtain
the mixtures’ thermal conductivity. I worked with an insulation foam made of polystyrene. It
has a thermal conductivity λ2 equal to 0.04, a thickness t2 equal to 0.0102m and a surface S of
0.01m2. Moreover, the voltage source I worked with was set to 6V and 0.15A. Then I waited
till the temperatures (T0, T1 and T2) shown in Benchlink became stagnant and I used them to
calculate the thermal conductivity. The table 4 summarizes the results obtained.
.
Table 4: The mixtures' thermal conductivities
M1 M2 M3 M4 M5 M6 M7 M8
t1 in m 0.03 0.025 0.03 0.035 0.038 0.02 0.015 0.02
T0 average 30.07 27.54 28.35 26.76 29.62 26.59 28.83 26.59
T1 average 23.27 22.24 23.89 21.81 22.54 23.51 22.89 23.21
T2 average 21.43 20.86 22.05 21.27 22.04 21.28 22.18 21.24
25
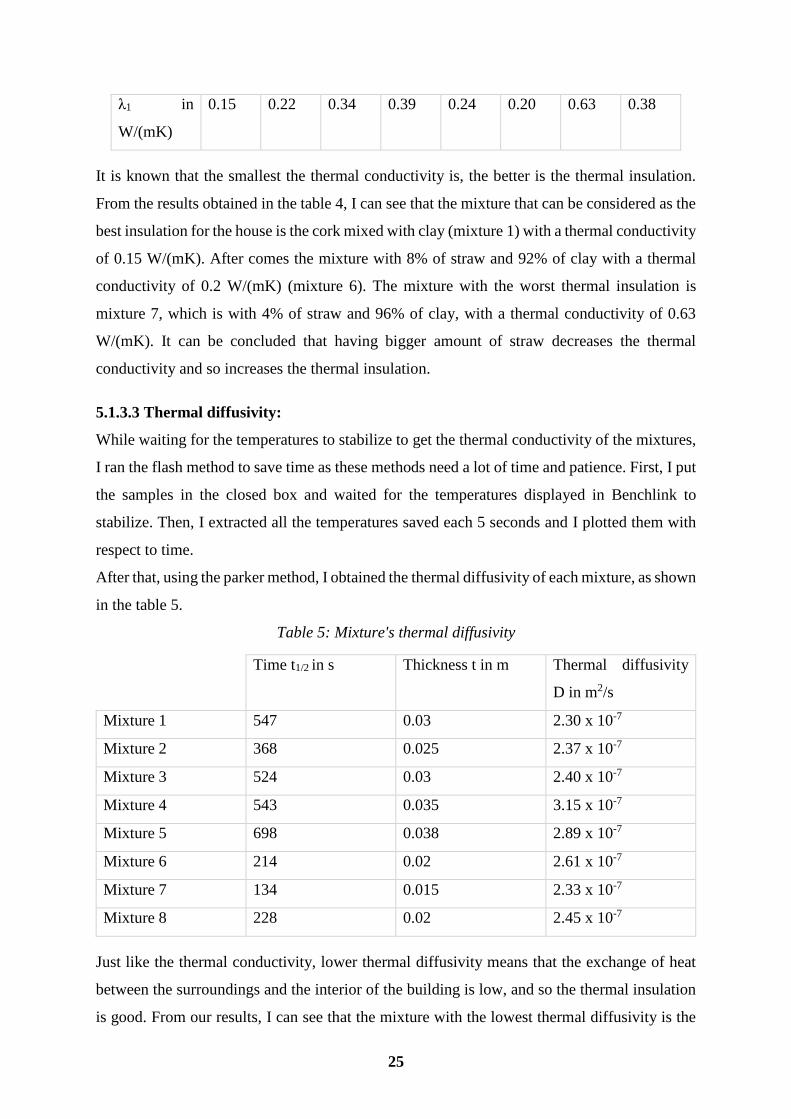
λ1 in
W/(mK)
0.15 0.22 0.34 0.39 0.24 0.20 0.63 0.38
It is known that the smallest the thermal conductivity is, the better is the thermal insulation.
From the results obtained in the table 4, I can see that the mixture that can be considered as the
best insulation for the house is the cork mixed with clay (mixture 1) with a thermal conductivity
of 0.15 W/(mK). After comes the mixture with 8% of straw and 92% of clay with a thermal
conductivity of 0.2 W/(mK) (mixture 6). The mixture with the worst thermal insulation is
mixture 7, which is with 4% of straw and 96% of clay, with a thermal conductivity of 0.63
W/(mK). It can be concluded that having bigger amount of straw decreases the thermal
conductivity and so increases the thermal insulation.
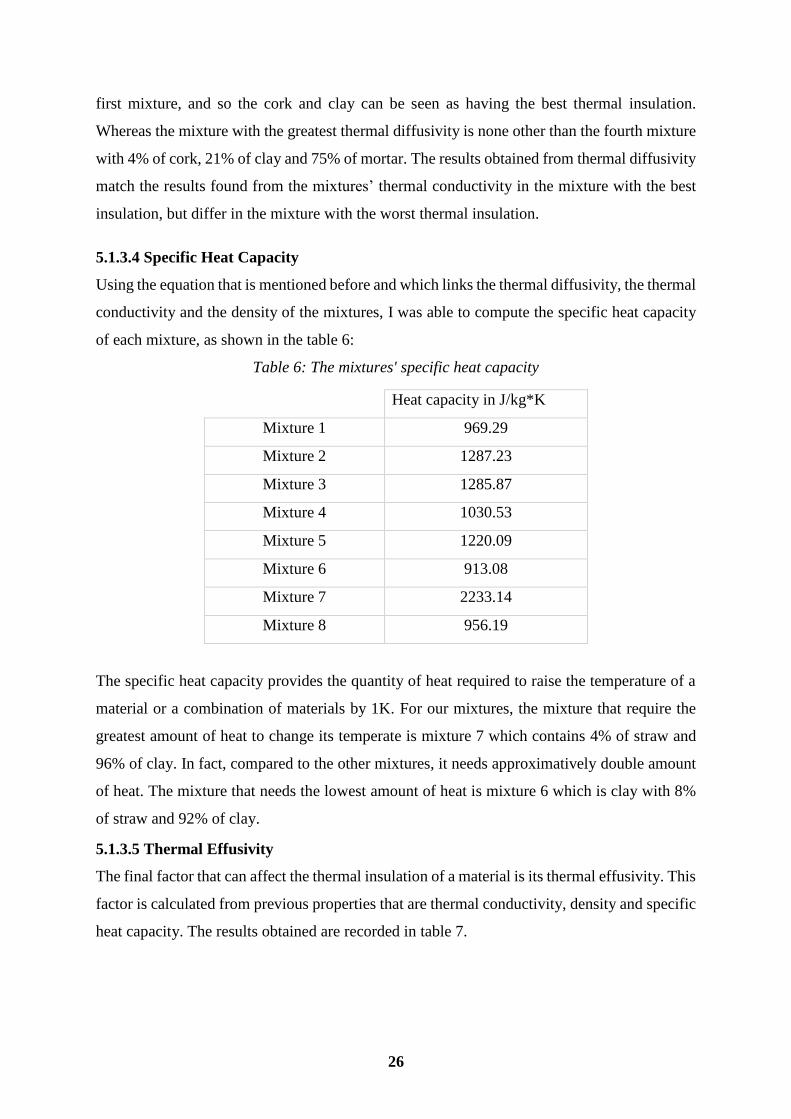
5.1.3.3 Thermal diffusivity:
While waiting for the temperatures to stabilize to get the thermal conductivity of the mixtures,
I ran the flash method to save time as these methods need a lot of time and patience. First, I put
the samples in the closed box and waited for the temperatures displayed in Benchlink to
stabilize. Then, I extracted all the temperatures saved each 5 seconds and I plotted them with
respect to time.
After that, using the parker method, I obtained the thermal diffusivity of each mixture, as shown
in the table 5.
Table 5: Mixture's thermal diffusivity
Time t1/2 in s Thickness t in m Thermal diffusivity
D in m2/s
Mixture 1 547 0.03 2.30 x 10⁻⁷
Mixture 2 368 0.025 2.37 x 10⁻⁷
Mixture 3 524 0.03 2.40 x 10⁻⁷
Mixture 4 543 0.035 3.15 x 10⁻⁷
Mixture 5 698 0.038 2.89 x 10⁻⁷
Mixture 6 214 0.02 2.61 x 10⁻⁷
Mixture 7 134 0.015 2.33 x 10⁻⁷
Mixture 8 228 0.02 2.45 x 10⁻⁷
Just like the thermal conductivity, lower thermal diffusivity means that the exchange of heat
between the surroundings and the interior of the building is low, and so the thermal insulation
is good. From our results, I can see that the mixture with the lowest thermal diffusivity is the
26
first mixture, and so the cork and clay can be seen as having the best thermal insulation.
Whereas the mixture with the greatest thermal diffusivity is none other than the fourth mixture
with 4% of cork, 21% of clay and 75% of mortar. The results obtained from thermal diffusivity
match the results found from the mixtures’ thermal conductivity in the mixture with the best
insulation, but differ in the mixture with the worst thermal insulation.
5.1.3.4 Specific Heat Capacity
Using the equation that is mentioned before and which links the thermal diffusivity, the thermal
conductivity and the density of the mixtures, I was able to compute the specific heat capacity
of each mixture, as shown in the table 6:
Table 6: The mixtures' specific heat capacity
Heat capacity in J/kg*K
Mixture 1 969.29
Mixture 2 1287.23
Mixture 3 1285.87
Mixture 4 1030.53
Mixture 5 1220.09
Mixture 6 913.08
Mixture 7 2233.14
Mixture 8 956.19
The specific heat capacity provides the quantity of heat required to raise the temperature of a
material or a combination of materials by 1K. For our mixtures, the mixture that require the
greatest amount of heat to change its temperate is mixture 7 which contains 4% of straw and
96% of clay. In fact, compared to the other mixtures, it needs approximatively double amount
of heat. The mixture that needs the lowest amount of heat is mixture 6 which is clay with 8%
of straw and 92% of clay.
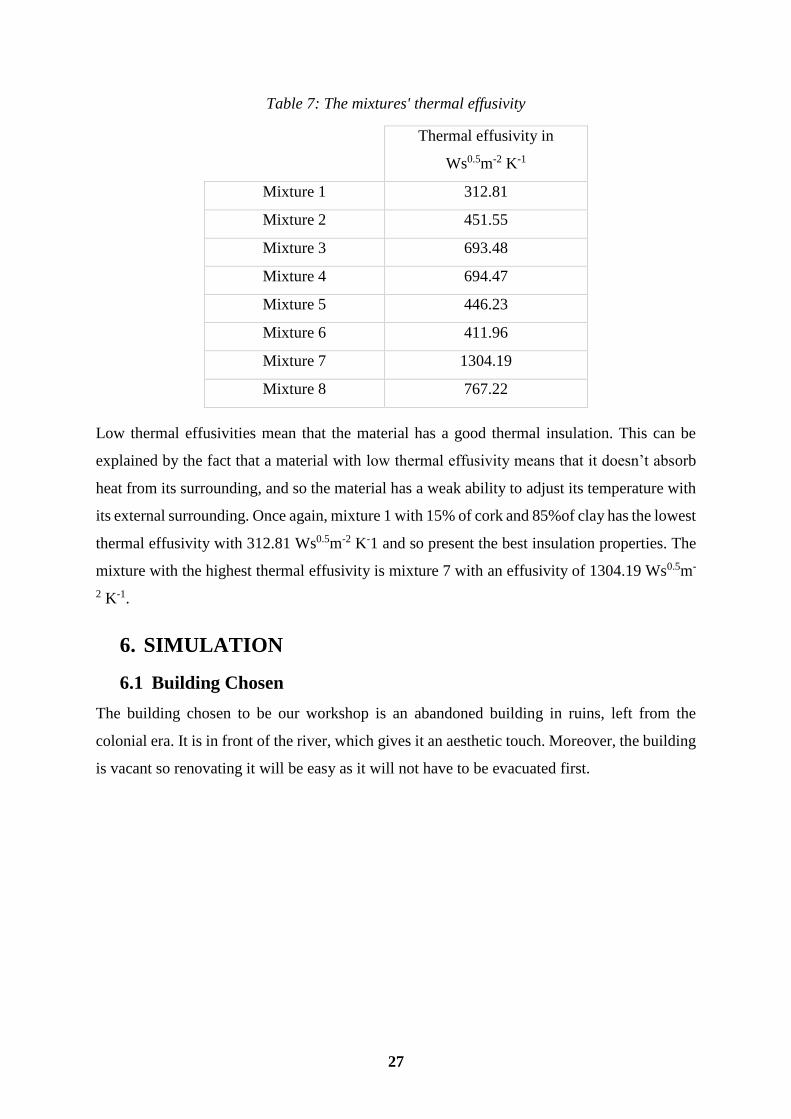
5.1.3.5 Thermal Effusivity
The final factor that can affect the thermal insulation of a material is its thermal effusivity. This
factor is calculated from previous properties that are thermal conductivity, density and specific
heat capacity. The results obtained are recorded in table 7.
27
Table 7: The mixtures' thermal effusivity
Thermal effusivity in
Ws0.5m-2 K-1
Mixture 1 312.81
Mixture 2 451.55
Mixture 3 693.48
Mixture 4 694.47
Mixture 5 446.23
Mixture 6 411.96
Mixture 7 1304.19
Mixture 8 767.22
Low thermal effusivities mean that the material has a good thermal insulation. This can be
explained by the fact that a material with low thermal effusivity means that it doesn’t absorb
heat from its surrounding, and so the material has a weak ability to adjust its temperature with
its external surrounding. Once again, mixture 1 with 15% of cork and 85%of clay has the lowest
thermal effusivity with 312.81 Ws0.5m-2 K-1 and so present the best insulation properties. The
mixture with the highest thermal effusivity is mixture 7 with an effusivity of 1304.19 Ws0.5m-
2 K-1.
6. SIMULATION
6.1 Building Chosen
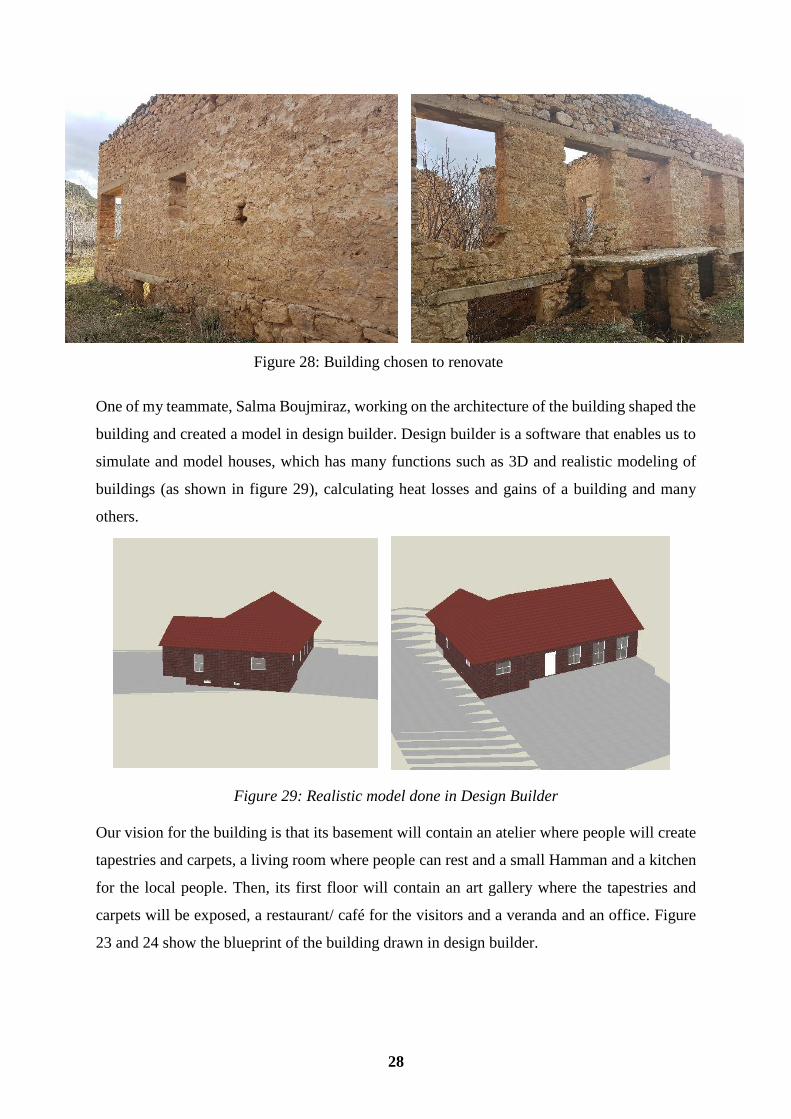
The building chosen to be our workshop is an abandoned building in ruins, left from the
colonial era. It is in front of the river, which gives it an aesthetic touch. Moreover, the building
is vacant so renovating it will be easy as it will not have to be evacuated first.
28
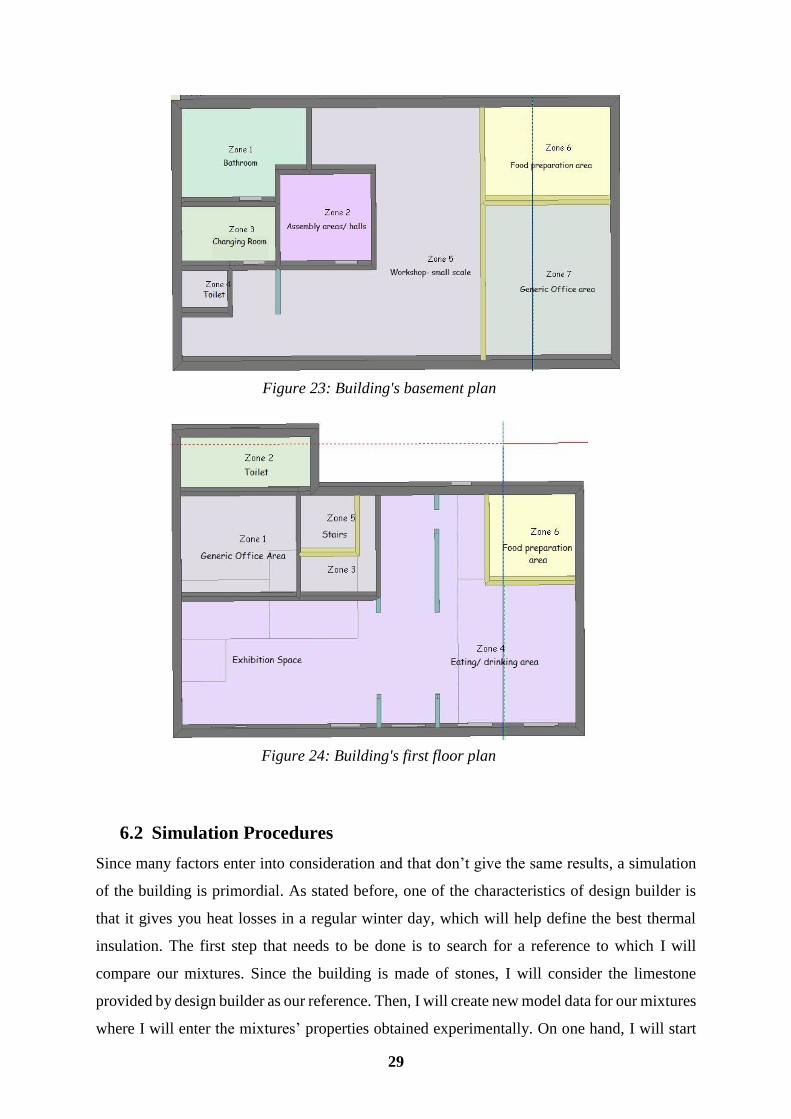
One of my teammate, Salma Boujmiraz, working on the architecture of the building shaped the
building and created a model in design builder. Design builder is a software that enables us to
simulate and model houses, which has many functions such as 3D and realistic modeling of
buildings (as shown in figure 29), calculating heat losses and gains of a building and many
others.
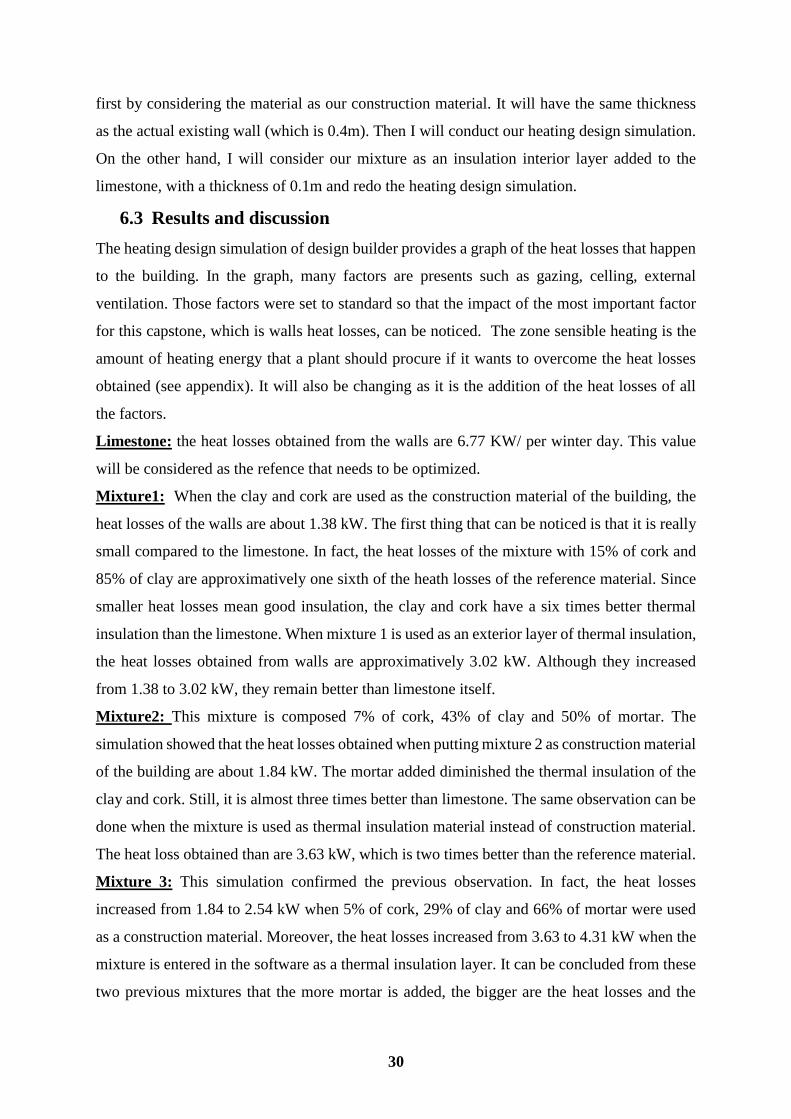
Our vision for the building is that its basement will contain an atelier where people will create
tapestries and carpets, a living room where people can rest and a small Hamman and a kitchen
for the local people. Then, its first floor will contain an art gallery where the tapestries and
carpets will be exposed, a restaurant/ café for the visitors and a veranda and an office. Figure
23 and 24 show the blueprint of the building drawn in design builder.
Figure 28: Building chosen to renovate
Figure 29: Realistic model done in Design Builder
29
6.2 Simulation Procedures
Since many factors enter into consideration and that don’t give the same results, a simulation
of the building is primordial. As stated before, one of the characteristics of design builder is
that it gives you heat losses in a regular winter day, which will help define the best thermal
insulation. The first step that needs to be done is to search for a reference to which I will
compare our mixtures. Since the building is made of stones, I will consider the limestone
provided by design builder as our reference. Then, I will create new model data for our mixtures
where I will enter the mixtures’ properties obtained experimentally. On one hand, I will start
Figure 23: Building's basement plan
Figure 24: Building's first floor plan
30
first by considering the material as our construction material. It will have the same thickness
as the actual existing wall (which is 0.4m). Then I will conduct our heating design simulation.
On the other hand, I will consider our mixture as an insulation interior layer added to the
limestone, with a thickness of 0.1m and redo the heating design simulation.
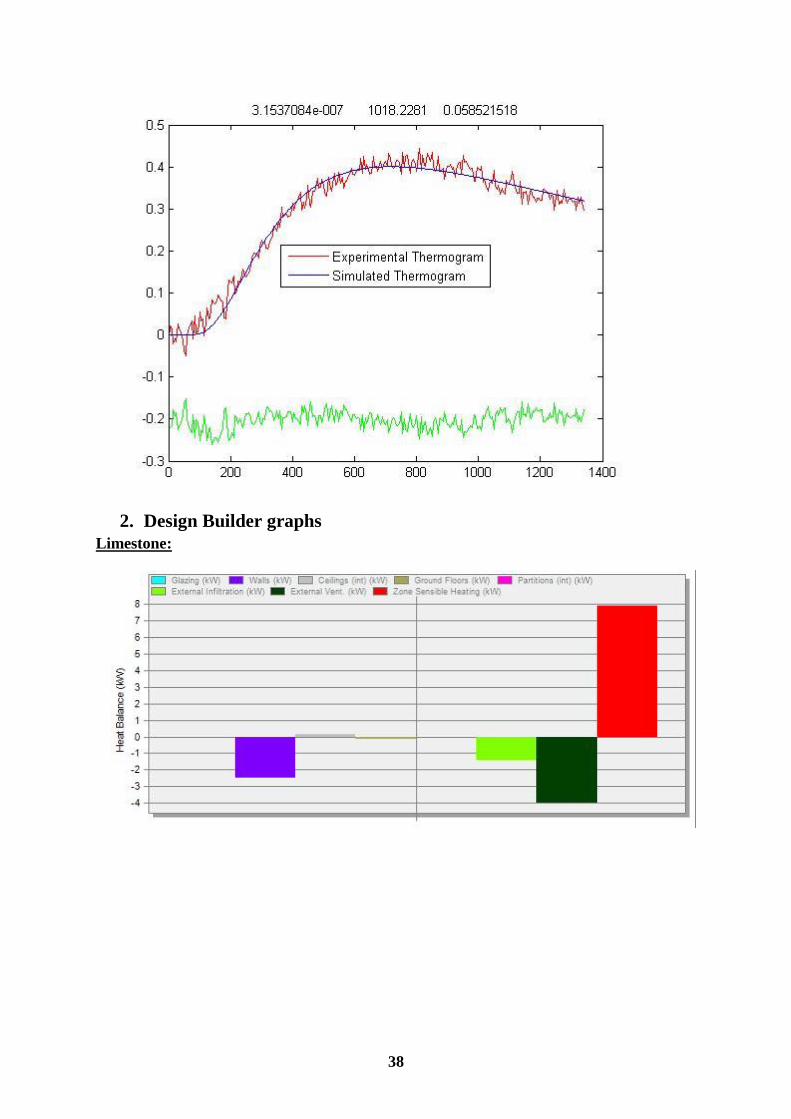
6.3 Results and discussion
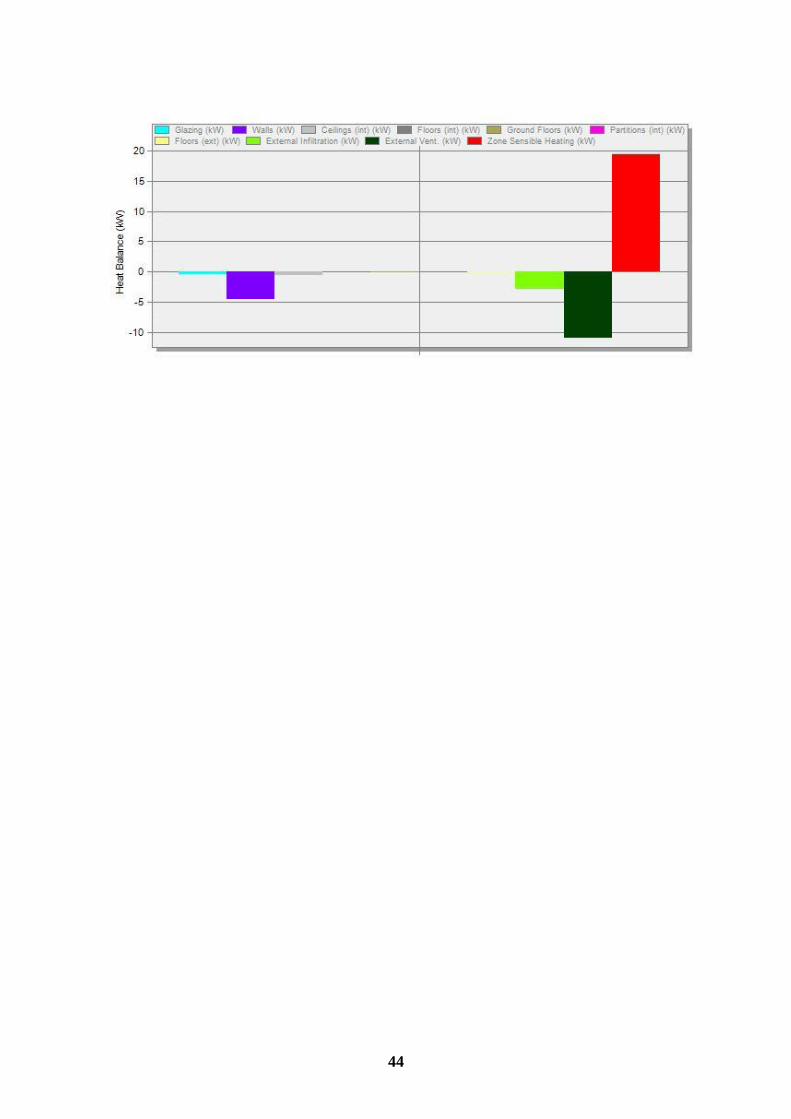
The heating design simulation of design builder provides a graph of the heat losses that happen
to the building. In the graph, many factors are presents such as gazing, celling, external
ventilation. Those factors were set to standard so that the impact of the most important factor
for this capstone, which is walls heat losses, can be noticed. The zone sensible heating is the
amount of heating energy that a plant should procure if it wants to overcome the heat losses
obtained (see appendix). It will also be changing as it is the addition of the heat losses of all
the factors.
Limestone: the heat losses obtained from the walls are 6.77 KW/ per winter day. This value
will be considered as the refence that needs to be optimized.
Mixture1: When the clay and cork are used as the construction material of the building, the
heat losses of the walls are about 1.38 kW. The first thing that can be noticed is that it is really
small compared to the limestone. In fact, the heat losses of the mixture with 15% of cork and
85% of clay are approximatively one sixth of the heath losses of the reference material. Since
smaller heat losses mean good insulation, the clay and cork have a six times better thermal
insulation than the limestone. When mixture 1 is used as an exterior layer of thermal insulation,
the heat losses obtained from walls are approximatively 3.02 kW. Although they increased
from 1.38 to 3.02 kW, they remain better than limestone itself.
Mixture2: This mixture is composed 7% of cork, 43% of clay and 50% of mortar. The
simulation showed that the heat losses obtained when putting mixture 2 as construction material
of the building are about 1.84 kW. The mortar added diminished the thermal insulation of the
clay and cork. Still, it is almost three times better than limestone. The same observation can be
done when the mixture is used as thermal insulation material instead of construction material.
The heat loss obtained than are 3.63 kW, which is two times better than the reference material.
Mixture 3: This simulation confirmed the previous observation. In fact, the heat losses
increased from 1.84 to 2.54 kW when 5% of cork, 29% of clay and 66% of mortar were used
as a construction material. Moreover, the heat losses increased from 3.63 to 4.31 kW when the
mixture is entered in the software as a thermal insulation layer. It can be concluded from these
two previous mixtures that the more mortar is added, the bigger are the heat losses and the
31
smaller is the thermal insulation. However, both the results obtained with this mixture remain
better than using limestone.
Mixture 4: As expected, when I increased mortar in this mixture, the heat losses increased as
well. The results obtained in this simulation are 2.82 kW when the mixture is used to build the
house and 4.52 kW when the cork, clay and mortar are used only as an interior insulation layer.
Just like with the three previous mixtures, the results obtained with mixture 4 are better than
what was obtained when limestone was used to build the house.
Mixture 5: When adding the cork to the mortar, it diminished the heat losses obtained in
mixture 4 almost by half. In fact, the simulation showed that the heat losses of the building’
walls in a regular winter day will be 1.97 kW if the mixture is to be used in building the house
and 3.47 kW if it is to be used as a thermal insulation layer. It is still less efficient then having
only the cork and clay. However, it is more effective than almost all the mixtures where the
principal ingredients are cork, clay and mortar, and more efficient than the limestone.
Mixture 6: When I replaced the cork with straw in this mixture, the simulation gave the second
best results right after mixture 2. It showed that if I use this 8% of straw with 92% of clay to
hold it, the heat losses will be 1.71 kW if it is used to build the house and 3.47 kW if it is used
as interior thermal insulation.
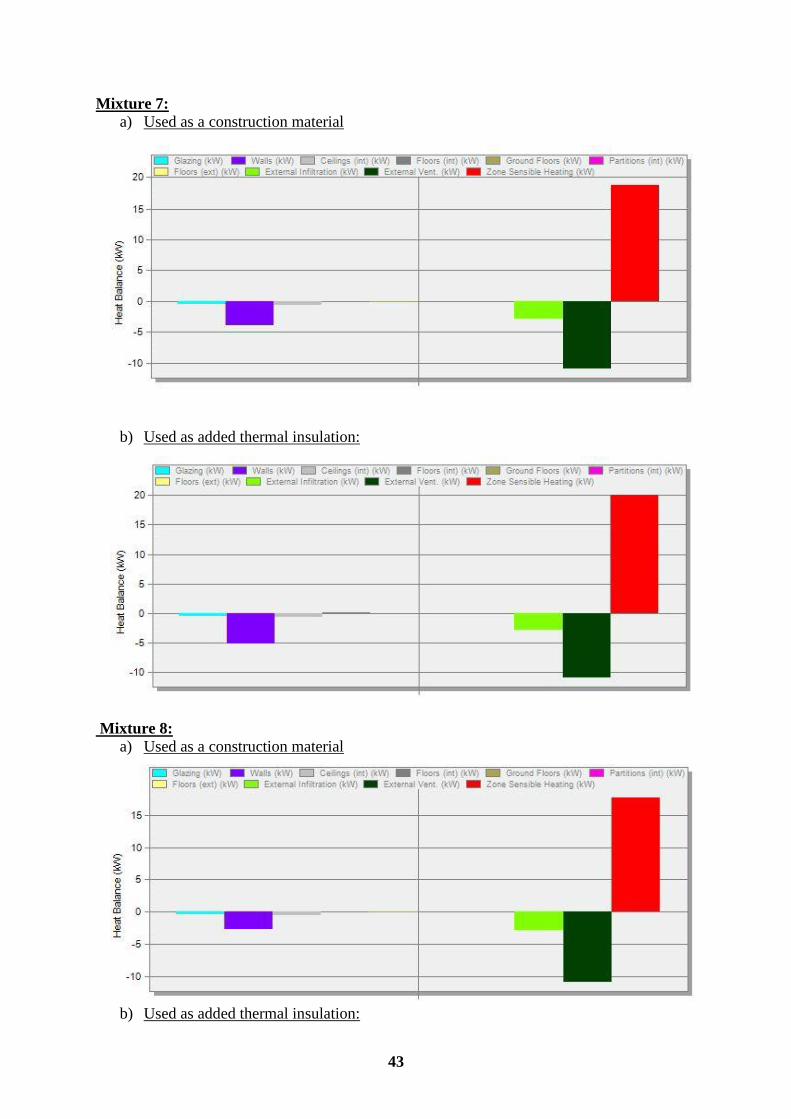
Mixture 7: After thinking that the previous mixture might not hold, I added this one where the
clay is predominant over the straw. The heat losses obtained almost doubled from the previous
mixture and so its thermal insulation seriously diminished. Even if its thermal properties are
better than limestone, it gives the worst insulation from the eight mixtures with 3.92 kW if it is
used in constructing the building and 5.16 kW if it is used as a thermal insulation layer. It can
be concluded that the greater the amount of straw, the greater the thermal insulation will be.
Mixture 8: After running the simulation of the final mixture, I noticed that it contradicted one
of the previous observations. This mixture contains approximatively the same amount of clay
and straw than the previous mixture, and a small layer of mortar was added. What was noticed
earlier is that when the mortar is added to the mixture, it diminishes its thermal insulation.
However, this mixture gave smaller heat losses than mixture 7 with 4% of straw and 96% of
clay. The simulation showed that the heat losses will be 2.75 kW and 4.48 kW if this mixture
was used as a construction material and as an added insulation system respectively. So, I can
conclude that the mortar decreases only the cork’s ability of thermal insulation.
From this simulation, it can be concluded that if I choose any one of this mixture as either a
construction material or as an added interior insulation system, its thermal properties will be
better than those of the existent wall’s limestone. The simulation showed that the best mixture
32
to use is the one with 15% of cork and 85% of clay (mixture 1) followed by the one with the
one with 8% of straw and 92% of clay (mixture 6). It also presented mixture 7 (which is made
of 4% of straw and 96% of clay) as having the worst thermal properties among all the mixtures.
It also showed that the mortar diminishes the thermal insulation of cork, however, it helps
increase the thermal insulation of straw. It can be explained by the thermal insulation of mortar
being between the thermal insulation of cork and straw. Therefore, it decreases the insulation
of cork when added to it as it has lower insulation ability and increases the insulation of straw
since it has a greater insulation system.
For the Zaouiat, the best fit would be using the first mixture with 8% of straw and 92% of clay
as a construction material, but it would be better to use it as an exterior insulation material since
the limestone wall is already built and seems strong. Moreover, using it as an insulation can be
more affordable for the Zaouiat’s habitants.
33
7. CONCLUSION
This Capstone’s aim is to find a suitable and reasonable construction and isolation material for
a model house in Zaouiat Sidi Abdessalam. To achieve this goal, many parts were completed.
First, the capstone’s first part deals with a theoretical study that gives information for a better
understanding of the construction and insulation materials, their thermal properties, their
advantages and even their disadvantages. Then, its second part will be an experimental part
where mixtures from cork, clay, straw and mortar were created, and their thermal properties
retrieved through the flash method and the asymmetrical hot plate. From this part, the mixture
with cork and clay distinguished itself with its outstanding thermal properties and so promised
a good thermal insulation. Then, the third contained a simulation done in design builder. Each
mixture was either entered as construction material of the house or as a layer of insulation
materials and after a heating simulation was conducted. The simulation affirmed that the
mixture with the best insulation is 15% of cork with 85% of clay, followed by the mixture with
8% of straw and 92% of clay. Finally, I choose the mixture with cork and clay as an interior
insulation of the building to renovate as it would be more accessible for the habitant of the
Zaouiat.
34
8. REFERENCES
[1] Sustainable Development in Morocco Achievements and perspectives, from Rio to Rio 20.
Retrieved June, 2012.
[2] DIFFERENCE BETIEN SWOT, PEST, STEEP AND STEEPLE ANALYSIS. Retrieved
from: http://pestleanalysis.com/difference-swot-pest-steep-steeple-analysis/
[3] GEORGE, G. Structural Mineralogy of clays. STONE MASONRY IN SOUTH
AUSTRALIA. Technical note 3.6.
[4] DEPARTMENT OF ENVIRONMENT AND NATURAL RESOUCES.
[5] GOODHEW , S. M. (2000). THE THERMAL PROPERTIES OF COB BUILDINGS OF
DEVON.
[6] Samadar Salim. Lightweight & Heavyweight concrete. 2013. Retrieved from:
https://fr.slideshare.net/SEMEDARSALIM/lightweight-and-heavyweight-concrete
[7]CertainTeed. Fiber Glass Insulation Product Knowledge
[8]Rockwood Technical insulation. Retrieved from
http://www.rockwool.ru/files/RW_RUS/In%20English/Products/ROCKWOOL_Tech
nical_Insulation _ENG_06.2015.pdf
[9] Fisette, P. (n.d.). Cellulose insulation - a smart choice. Retrieved from
https://bct.eco.umass.edu/publications/articles/cellulose-insulation -a-smart-choice/.
[10] Amorim Isolamentos, SA. 100% Natural cork insulation . Retrieved from
https://www.ecosupplycenter.com/assets/docs/thermacork_brochure_2016.pdf
[11] NATURAL SHEEP’S WOOL INSULATION . Retrieved from
http://www.blackmountaininsulation .com/NatuWool_Brochure.pdf
[12] Thermal properties of straw bale walls. Retrieved from
http://www.strawcottage.co.uk/pdfs/Danish%20english%20only.pdf
[13] TREATMENT OF SAWDUST INSULATION FOR PROTECTION AGAINST, MOLD,
DECAY, INSECTS, RODENTS AND FIRE. Retrieved from
[14] A. KHABBAZI et all. Thermal properties of a new ecological building material / Granular
cork embedded in white cement. Matec Web conferences 11. 2004.
35
9. APPENDIX
1. Flash method graphs
36

37
38
2. Design Builder graphs
Limestone:

39
Mixture 1:
a) Used as a construction material:
b) Used as added thermal insulation:
Mixture 2:
a) Used as a construction material:

40
b) Used as added thermal insulation:
Mixture 3:
a) Used as a construction material:
b) Used as added thermal insulation:

41
Mixture 4:
a) Used as a construction material
b) Used as added thermal insulation:
Mixture 5:
a) Used as a construction material
b) Used as added thermal insulation:

42
Mixture 6:
a) Used as a construction material
b) Used as added thermal insulation:
43
Mixture 7:
a) Used as a construction material
b) Used as added thermal insulation:
Mixture 8:
a) Used as a construction material
b) Used as added thermal insulation:
44