
Instrumenting, Introspection, and Debugging with QEMU · 2017-12-14 · GDB protocol •GDB...
28
Instrumenting, Introspection, and Debugging with QEMU Pavel Dovgalyuk Institute for System Programming of the Russian Academy of Sciences
Transcript of Instrumenting, Introspection, and Debugging with QEMU · 2017-12-14 · GDB protocol •GDB...

Instrumenting, Introspection, and Debugging with QEMU
Pavel Dovgalyuk
Institute for System Programming of the Russian Academy of Sciences

Our projects
• Working on QEMU projects since 2010 (version 0.13)
• Software analysis for x86
• Deterministic replay
• Reverse debugging
• Now working on introspection and debugging projects
2

In-VM software development and debugging
• Creating new kernels/drivers
• Simulating new platforms
• Reverse engineering
3
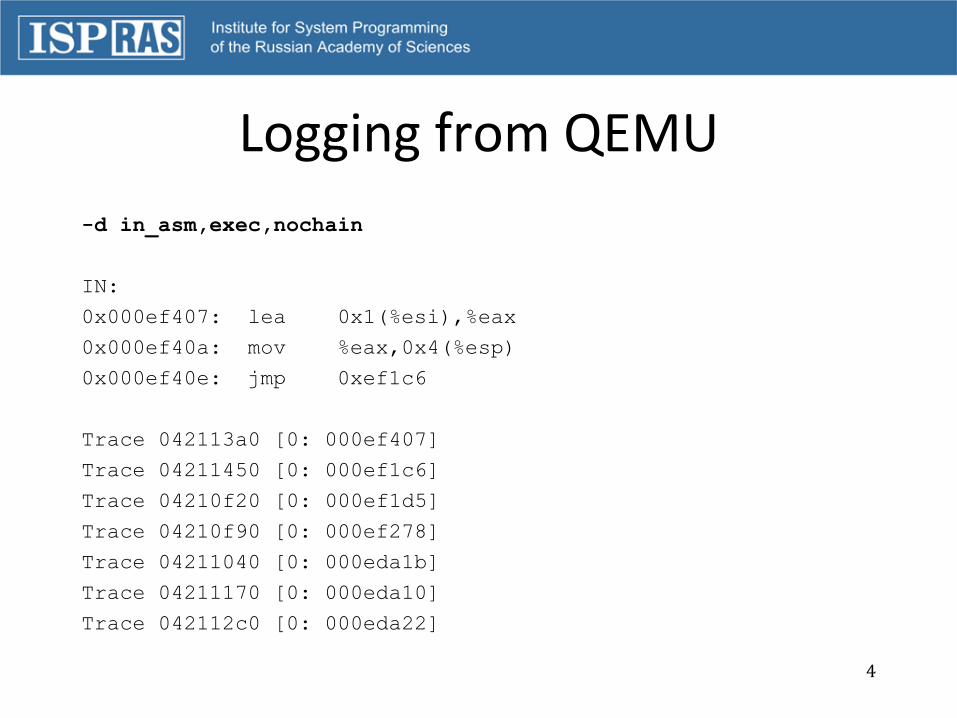
Logging from QEMU
-d in_asm,exec,nochain
IN:
0x000ef407: lea 0x1(%esi),%eax
0x000ef40a: mov %eax,0x4(%esp)
0x000ef40e: jmp 0xef1c6
Trace 042113a0 [0: 000ef407]
Trace 04211450 [0: 000ef1c6]
Trace 04210f20 [0: 000ef1d5]
Trace 04210f90 [0: 000ef278]
Trace 04211040 [0: 000eda1b]
Trace 04211170 [0: 000eda10]
Trace 042112c0 [0: 000eda22]
4

Analyzing dumps with Volatility
• Scripts to extract information from the dumps
• Only static analysis
5
$ python vol.py -f win7.vmem --profile=Win7SP1x86 pslist Volatility
Foundation Volatility Framework 2.4
Offset(V) Name PID PPID Thds Hnds Sess Wow64 Start Exit
0x84133630 System 4 0 93 420 ------ 0 2011-10-20 15:25:11 UTC+0000
0x852add40 smss.exe 276 4 4 29 ------ 0 2011-10-20 15:25:11 UTC+0000
0x851d9530 csrss.exe 364 356 9 560 0 0 2011-10-20 15:25:15 UTC+0000
0x859c8530 wininit.exe 404 356 7 88 0 0 2011-10-20 15:25:16 UTC+0000
0x859cf530 csrss.exe 416 396 10 236 1 0 2011-10-20 15:25:16 UTC+0000
[snip]

GDB
• Remote debugging
• Can load binaries and sources to get debug information – Not very easy with enabled ASLR
• Guest system is executed as a single program
• Process information is not available
• Cannot break on interrupts/exceptions and other events
• Single-stepping may change the execution result
6

Deterministic and reverse debugging
• It’s gonna take you back to the past
• icount for deterministic timers
• VM snapshots for faster rewind to the desired moment of execution
• GDB reverse debugging commands
– reverse-continue, step, next, finish
• Still work-in-progress for mainline QEMU
7

GDB protocol
• GDB interacts with QEMU using complex packets
• Conditional breakpoints lead to many VM stops and debugger-QEMU communication
– stop, request registers, recover the context, evaluate equation, continue execution
• Very slow for runtime analysis
– Using conditional breakpoints inside the inner loops is not practical
8

WinDbg
• Support stealth Windows debugging with WinDbg
• More information than in GDB
• Communication is also slow
• Submitted to qemu-devel
• https://github.com/ispras/qemu/tree/windbg
9
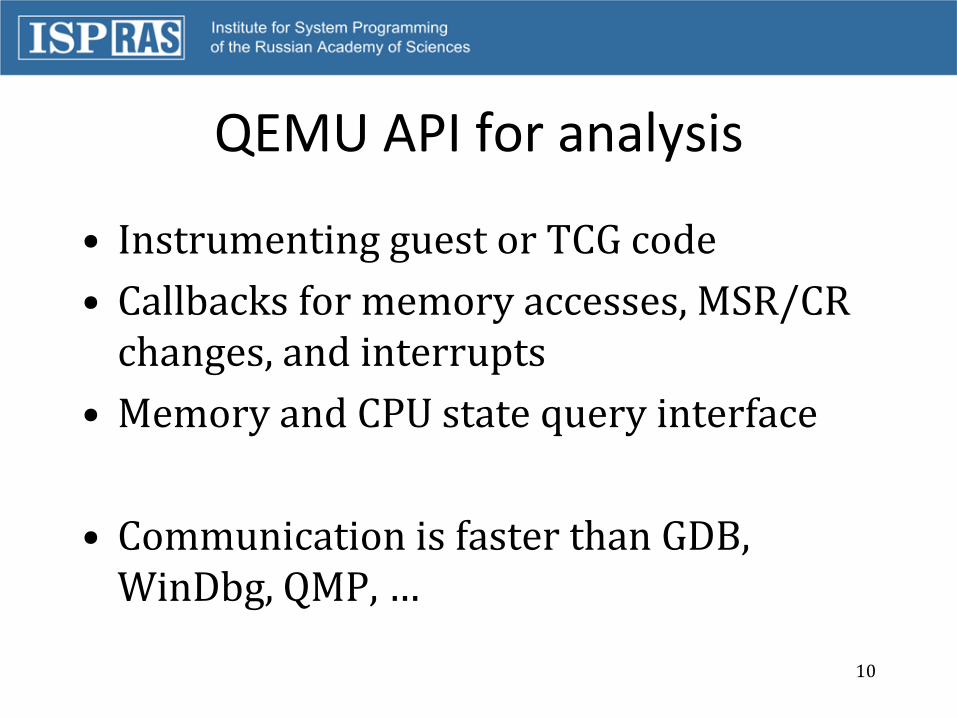
QEMU API for analysis
• Instrumenting guest or TCG code
• Callbacks for memory accesses, MSR/CR changes, and interrupts
• Memory and CPU state query interface
• Communication is faster than GDB, WinDbg, QMP, …
10

QEMU-based dynamic analysis frameworks
• PyREBox
• PANDA
• DECAF
• ISP RAS
• and other less mature systems
11

PyREBox
• PyREBox – Python scriptable Reverse Engineering sandbox
• QEMU 2.10
• Uses Volatility memory forensics
• Python scripting for automated analysis
• https://github.com/Cisco-Talos/pyrebox/
12

PANDA
• Platform for Architecture-Neutral Dynamic Analysis
• QEMU 2.8.50
• VM introspection plugins
• Taint analysis
• CPU record-replay
• https://github.com/panda-re/panda 13
DECAF
• Dynamic Executable Code Analysis Framework
• QEMU 1.0
• VM introspection plugins
• Taint analysis
• https://github.com/sycurelab/DECAF
14

ISP RAS
• Our own approach
• QEMU 2.8.50
• Subsystem for dynamically loaded plugins
• Plugins for syscall and API logging in i386 Windows/Linux
• https://github.com/ispras/qemu/tree/plugins
15

Requirements for QEMU analysis API
• Translation events
• Memory operation events
• Execution events
• Exception events
• Disk and DMA events
• Keyboard and network events
• TLB events
• Monitor commands
16

Instruction instrumentation
• Instrument at translation – check whether callback is needed
– Specific instructions
– Specific addresses
– Specific process
• Get callbacks at execution
17

Instruction instrumentation
0xb7707010: mov %ebx,%edx
0xb7707012: mov 0x8(%esp),%ecx
0xb7707016: mov 0x4(%esp),%ebx
0xb770701a: mov $0x21,%eax
0xb770701f: int $0x80
---- b770701f 00000000
movi_i64 tmp13,$0xb7707020
movi_i64 tmp14,$0x7fef9a788670
call start_system_call, $0x0,$0,tmp13,tmp14
movi_i32 tmp3,$0xffffffffb770701f
st_i32 tmp3,env,$0x20
movi_i32 tmp11,$0x2
movi_i32 tmp12,$0x80
call raise_interrupt, $0x0,$0,env,tmp12,tmp11
set_label $L0
exit_tb $0x7fef8e6dca13
18

Instruction instrumentation requirements
• Translation callback
– cpu, pc, tcg_ctx
• Memory read function
• TCG functions
– variable allocation, code generation
19

TCG Instrumentation
• Platform-independent instrumentation
• Used for taint analysis in DECAF and PANDA
• Not complete because of helpers
– PANDA instruments them with LLVM
20

Memory accesses instrumentation
• Memory ops performed through softmmu-callbacks and translated code
– From cpu_ldst_template.h – invoke the callback
– From tcg_op.c – embed the callback into TB
• Memory forensics through exported load functions
21

Memory accesses instrumentation
• Logging
• Cache simulator
• Forensics
• Anomalies detection
22

Memory log sample
Load 0x84@8 virt:ef1cd phys:ef1cd
Load 0xd2@8 virt:ef1ce phys:ef1ce
Load 0xf@8 virt:ef1cf phys:ef1cf
Load 0x84@8 virt:ef1d0 phys:ef1d0
Load 0x23e@32 virt:ef1d1 phys:ef1d1
----------------
IN:
0x000ef1c6: mov 0x4(%esp),%esi
0x000ef1ca: movsbl (%esi),%edx
0x000ef1cd: test %dl,%dl
0x000ef1cf: je 0xef413
Trace 043b1450 [0: 000ef1c6]
Load 0xf357d@32 virt:6fa4 phys:6fa4
Load 0x65@8 virt:f357d phys:f357d
23

Generated code problems
• TCG buffer overflow protection is weak
24
#define MAX_OPC_PARAM (4 + (MAX_OPC_PARAM_PER_ARG *
MAX_OPC_PARAM_ARGS))
#define OPC_BUF_SIZE 640
#define OPC_MAX_SIZE (OPC_BUF_SIZE - MAX_OP_PER_INSTR)
Buffer
Last instruction
Instrumented last instruction
OPC_MAX_SIZE
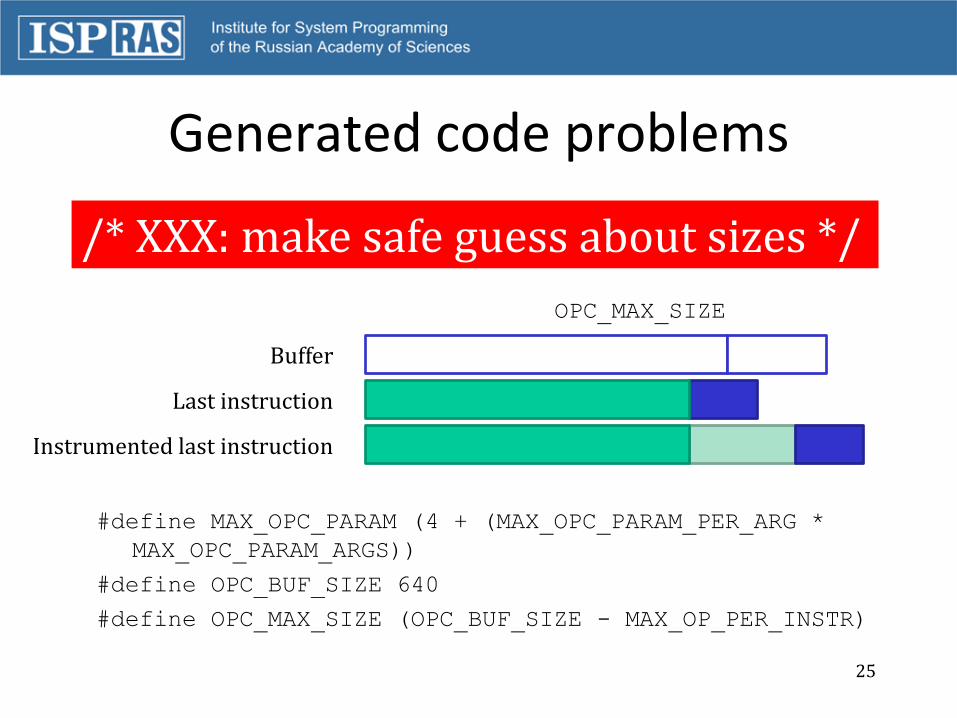
Generated code problems
• TCG buffer overflow protection is weak
25
#define MAX_OPC_PARAM (4 + (MAX_OPC_PARAM_PER_ARG *
MAX_OPC_PARAM_ARGS))
#define OPC_BUF_SIZE 640
#define OPC_MAX_SIZE (OPC_BUF_SIZE - MAX_OP_PER_INSTR)
Buffer
Last instruction
Instrumented last instruction
OPC_MAX_SIZE
/* XXX: make safe guess about sizes */
Interrupts and exceptions
• Only asynchronous callbacks
• Logging peripheral interrupts
• Detecting page mapping
26

Instrumentation applications
• Logging syscalls
• Logging API
• Logging memory accesses
– for cache simulator
– for complementing in_asm+exec log
• Building more complex introspection tools
27

QEMU instrumentation API
• 10+ attempts to add instrumentation API
• Does it have to be included into mainline?
• QEMU interface may be very narrow
– ~20 callbacks
– ~50 exported functions
28
QEMU API Dynamically
loaded plugin Dynamically
loaded plugin/tool


![Developing Linux inside QEMU/KVM Virtual Machines · Python Helpers for Kernel Debugging gdb 7 gained Python binding – let's use it! ... [ 0.000000] Linux version 3.1.0-dbg+ (jan@mchn199C.mch](https://static.fdocuments.in/doc/165x107/5ed1c9173725a67cd23bde86/developing-linux-inside-qemukvm-virtual-machines-python-helpers-for-kernel-debugging.jpg)


![GDB telux ver090906 - cs.tau.ac.il · (gdb) watch expr –stops whenever the value of the expression changes (gdb ) i b (gdb) clear [arg ] (gdb) delete [bnum ] Without arguments deletes](https://static.fdocuments.in/doc/165x107/5ae0abbc7f8b9ab4688daeeb/gdb-telux-ver090906-cstauacil-gdb-watch-expr-stops-whenever-the-value-of.jpg)
