Instrumentation and Measurement of a Power Distribution System Laboratory for Meter Placement and...
7
1224 IEEE TRANSACTIONS ON INSTRUMENTATION AND MEASUREMENT, VOL. 56, NO. 4, AUGUST 2007 Instrumentation and Measurement of a Power Distribution System Laboratory for Meter Placement and Network Reconfiguration Studies Valentina Cecchi, Student Member, IEEE, Xiaoguang Yang, Student Member, IEEE, Karen Miu, Member, IEEE, and Chika O. Nwankpa, Senior Member, IEEE Abstract—At Drexel University, instrumentation and measure- ment of the Reconfigurable Distribution Automation and Control Laboratory include hardware and software instruments which together form an automated measurement and control system. This system contains special features that were included to enable meter placement and network reconfiguration studies. This paper presents an outline of the measurement and control system for the general laboratory and then focuses on the capa- bilities purposely added for the meter placement and network reconfiguration studies. Index Terms—Control system, energy management system, instrumentation, laboratory, measurement, meter placement, network reconfiguration, power distribution systems. I. I NTRODUCTION I NSTALLATION of metering and monitoring systems in electric power distribution networks has been growing rapidly for several reasons. These reasons include the desire for automated meter readers and customer billing and the increasing need to maintain and improve reliability and energy efficiency, often through optimal control of distribution sys- tems. In conjunction, the monitoring capabilities and automa- tion level in power distribution systems has been significantly improved with advancements in digital signal processing and computer- and web-based technologies [1]–[4]. The integration of measurement capabilities is expected to continue. This will lead to the need for coordinated studies of instrumentation and measurement systems for power distribution systems under various conditions. Two examples where an improved instrumentation and mea- surement system will have beneficial effects are the areas of network reconfiguration and meter placement. Network recon- figuration is the process of enabling topological changes of the network for improved energy efficiency and for maintaining reliability [5], [6]. Network topologies are often changed to perform, for example, load balancing and service restoration. Achievable configurations depend on the location and the con- trol capabilities of network switches. As such, careful design Manuscript received June 30, 2006; revised March 20, 2007. The authors are with the Center for Electric Power Engineering, Electrical and Computer Engineering Department, Drexel University, Philadelphia, PA 19104 USA. Color versions of one or more of the figures in this paper are available online at http://ieeexplore.ieee.org. Digital Object Identifier 10.1109/TIM.2007.900420 of the distribution network is required to enable the recon- figuration of the network. Issues include the instrumentation for the monitoring and control of network switches, switch- placement studies, and the need for a flexible measurement system to enable appropriate meter placement for the various topologies. In meter placement studies, the goal is usually to obtain an optimal monitoring system for the purposes of event ob- servability and state and load estimation. Recently, algorithmic development of meter placement studies in power distribution systems has increased beyond the substation. In the study in [5]–[8], meter placement techniques were proposed for state estimation. For load estimation studies, the authors of [9] and [10] presented respective problem formulations and placed me- ters based on observability constraints and estimation accuracy. However, the above methods were typically based on networks with a given topological structure. As such, in the study in [11] and [12], integer-programming methods were used to main- tain the observability of network states and parameters under contingencies and loss of measurements. A Genetic Algorithm was proposed for meter placement in [13] to obtain reliable estimates of system operating conditions under various network topologies. These studies show how diverse the area of meter placement is, where advancements in technologies related to instrumentation and measurement schemes will only benefit. To evaluate meter placement techniques for different net- work topologies, hardware tests are desired in independent laboratories. At some universities, advanced measurement and monitoring systems have been created to investigate power-quality problems [14], [15]. In addition, distribution- automation laboratories have been developed to provide students with hands-on experience on distribution systems [16]–[20]. Network reconfiguration studies have been con- ducted at Drexel University through the Reconfigurable Dis- tribution Automation and Control (RDAC) Laboratory [20]. In addition, it has been used to perform various operating and planning studies, including power flow [19]. However, the design of the measurement system itself for power-system studies has not been the focus in [14]–[20]. This paper proposes a flexible instrumentation and mea- surement system for power distribution system studies, which was designed for and integrated into the RDAC Laboratory. Initially addressed in [21], software and hardware instruments required to perform network reconfiguration were introduced, 0018-9456/$25.00 © 2007 IEEE
Transcript of Instrumentation and Measurement of a Power Distribution System Laboratory for Meter Placement and...

1224 IEEE TRANSACTIONS ON INSTRUMENTATION AND MEASUREMENT, VOL. 56, NO. 4, AUGUST 2007
Instrumentation and Measurement of a PowerDistribution System Laboratory for Meter Placement
and Network Reconfiguration StudiesValentina Cecchi, Student Member, IEEE, Xiaoguang Yang, Student Member, IEEE, Karen Miu, Member, IEEE,
and Chika O. Nwankpa, Senior Member, IEEE
Abstract—At Drexel University, instrumentation and measure-ment of the Reconfigurable Distribution Automation and ControlLaboratory include hardware and software instruments whichtogether form an automated measurement and control system.This system contains special features that were included toenable meter placement and network reconfiguration studies.This paper presents an outline of the measurement and controlsystem for the general laboratory and then focuses on the capa-bilities purposely added for the meter placement and networkreconfiguration studies.
Index Terms—Control system, energy management system,instrumentation, laboratory, measurement, meter placement,network reconfiguration, power distribution systems.
I. INTRODUCTION
INSTALLATION of metering and monitoring systems inelectric power distribution networks has been growing
rapidly for several reasons. These reasons include the desirefor automated meter readers and customer billing and theincreasing need to maintain and improve reliability and energyefficiency, often through optimal control of distribution sys-tems. In conjunction, the monitoring capabilities and automa-tion level in power distribution systems has been significantlyimproved with advancements in digital signal processing andcomputer- and web-based technologies [1]–[4]. The integrationof measurement capabilities is expected to continue. This willlead to the need for coordinated studies of instrumentationand measurement systems for power distribution systems undervarious conditions.
Two examples where an improved instrumentation and mea-surement system will have beneficial effects are the areas ofnetwork reconfiguration and meter placement. Network recon-figuration is the process of enabling topological changes of thenetwork for improved energy efficiency and for maintainingreliability [5], [6]. Network topologies are often changed toperform, for example, load balancing and service restoration.Achievable configurations depend on the location and the con-trol capabilities of network switches. As such, careful design
Manuscript received June 30, 2006; revised March 20, 2007.The authors are with the Center for Electric Power Engineering, Electrical
and Computer Engineering Department, Drexel University, Philadelphia, PA19104 USA.
Color versions of one or more of the figures in this paper are available onlineat http://ieeexplore.ieee.org.
Digital Object Identifier 10.1109/TIM.2007.900420
of the distribution network is required to enable the recon-figuration of the network. Issues include the instrumentationfor the monitoring and control of network switches, switch-placement studies, and the need for a flexible measurementsystem to enable appropriate meter placement for the varioustopologies.
In meter placement studies, the goal is usually to obtainan optimal monitoring system for the purposes of event ob-servability and state and load estimation. Recently, algorithmicdevelopment of meter placement studies in power distributionsystems has increased beyond the substation. In the study in[5]–[8], meter placement techniques were proposed for stateestimation. For load estimation studies, the authors of [9] and[10] presented respective problem formulations and placed me-ters based on observability constraints and estimation accuracy.However, the above methods were typically based on networkswith a given topological structure. As such, in the study in [11]and [12], integer-programming methods were used to main-tain the observability of network states and parameters undercontingencies and loss of measurements. A Genetic Algorithmwas proposed for meter placement in [13] to obtain reliableestimates of system operating conditions under various networktopologies. These studies show how diverse the area of meterplacement is, where advancements in technologies related toinstrumentation and measurement schemes will only benefit.
To evaluate meter placement techniques for different net-work topologies, hardware tests are desired in independentlaboratories. At some universities, advanced measurementand monitoring systems have been created to investigatepower-quality problems [14], [15]. In addition, distribution-automation laboratories have been developed to providestudents with hands-on experience on distribution systems[16]–[20]. Network reconfiguration studies have been con-ducted at Drexel University through the Reconfigurable Dis-tribution Automation and Control (RDAC) Laboratory [20].In addition, it has been used to perform various operatingand planning studies, including power flow [19]. However,the design of the measurement system itself for power-systemstudies has not been the focus in [14]–[20].
This paper proposes a flexible instrumentation and mea-surement system for power distribution system studies, whichwas designed for and integrated into the RDAC Laboratory.Initially addressed in [21], software and hardware instrumentsrequired to perform network reconfiguration were introduced,
0018-9456/$25.00 © 2007 IEEE
CECCHI et al.: INSTRUMENTATION AND MEASUREMENT OF A POWER DISTRIBUTION SYSTEM LABORATORY 1225
Fig. 1. System architecture of the measurement and control system.
and subsequent measurement instruments were presented. Thispaper expands on the study in [21] by
1) directly addressing the design and operation of measure-ment systems via meter placement;
2) introducing software and hardware instruments requiredto perform meter placement;
3) describing more in depth software and hardware instru-ments required to perform network reconfiguration;
4) further discussing a unique instrumentation and measure-ment system which can adapt for a variety of power-system planning and operating scenarios;
5) demonstrating application of the system to test variousmeter placement schemes under different network con-figurations.
We note that the purpose of this paper and the laboratory isnot to promote one meter placement technique over another,nor one network reconfiguration technique over another. Rather,the subsequent laboratory allows for the testing of differenttechniques and, consequently, is an effective research andeducational tool. This paper will present an overview of themeasurement and control system for the general laboratoryand then will focus on capabilities purposely added for meterplacement and network reconfiguration.
II. PROPOSED APPROACH
At Drexel University, an automated measurement and controlsystem has been designed and constructed for distribution sys-tem analysis. It is applied to the RDAC Laboratory, which is a43.2-kW, 208-V, three-phase, 36-bus scaled-down distributionsystem [18]. This measurement and control system, whichincludes hardware and software instruments, is composed offour remote-terminal units (RTUs). The general architecture ofthe system is shown in Fig. 1. Each RTU consists of 1) hardwareinstruments: data acquisition (DAQ) and control circuits basedon a National Instruments (NI) SCXI signal conditioning andinstrumentation system [22], and 2) software instruments: adistribution energy management system (DEMS) with a graphi-cal user interface (GUI) developed using NI Component Works[23] and Microsoft Visual Basic 6.0 [24].
In order to evaluate the power-system performance and toperform meter placement and network reconfiguration studies,the following main measurement and control capabilities needto be addressed:
1) multiple user-selected three-phase measurementlocations;
2) simultaneous voltage and current measurements;3) rms, phase angle, and power calculations;4) control of system components, such as network switches,
and devices used to create faults.
To perform electric power network reconfiguration studies,the measurement and control system needs to adapt to differentnetwork topologies. Thus, actuation devices must be adequatelydistributed to create different network configurations. Sensingand monitoring resources must be sufficient for these differenttopologies and should capture both transient and steady-statebehavior, as well as sense unbalanced conditions across phases.Thus, the placement of metering devices should also allow forboth state and event observability. Hence, multiple simulta-neous measurement points are needed to provide redundancy.
Studies of different distribution systems can be performed.The data and subsequent results can be applied to determinenetwork reconfiguration-control schemes for improved energyefficiency and reliability. Then, hardware instruments can beactuated to realize the configuration of the network and thedesired placement of the meters.
The above needs to identify several desired characteristicsof the measurement and control system of RDAC. For itsmeasurement capability, the system must perform a series oftasks, including the following:
1) sensing three-phase and neutral voltage and current sig-nals at each measurement bus;
2) monitoring up to 16 user-selected buses;3) signal attenuation, filtering, isolation, and suppression;4) capturing harmonic signals up to 1000 Hz (i.e., up to
the 15th harmonic at 60 Hz) to allow for capacitive loadstudies;
5) storing and displaying real-time voltage and currentwaveforms;
1226 IEEE TRANSACTIONS ON INSTRUMENTATION AND MEASUREMENT, VOL. 56, NO. 4, AUGUST 2007
Fig. 2. Top-view of RDAC nine-bus distribution feeder box, showing power hardware and measurement hardware.
6) calculating, storing, and displaying rms and angles ofvoltages and currents, frequency, power factor, and realand reactive power.
In addition, for its control capability, the system needs toperform a series of tasks that includes
1) operating controllable network devices such as automaticswitches;
2) allowing for both single- and three-phase switching;3) visualizing actual distribution system setups.The resulting design of RDAC’s measurement and control
system is presented in the next section. A description of itsapplications is also discussed.
III. AUTOMATED MEASUREMENT AND CONTROL SYSTEM
A set of hardware and software instruments was developedfor RDAC. As alluded to in the previous section, RDACconsists of four identical stations, each of which is a nine-bus distribution feeder with four three-phase normally closedsectionalizing switches, up to four three-phase normally opentie switches, and multiphase loads (see Fig. 2 for a top viewof the nine-bus distribution feeder box, which illustrates boththe power hardware and embedded sensor and measurementnetwork). The measurement and control system on each RDACstation is capable of automatically measuring three-phase andneutral voltages and currents at up to four user-selected busesfor a total of 32 signals per station. The system can alsoremotely operate digital relays, which provides capabilities ofreconfiguring system structure, switching capacitors ON/OFF,and creating various types of faults. The measurement andcontrol hardware is operated by the DEMS, which is a soft-ware platform that runs on the RTU. Details of the hardwareand software instruments used for the flexible and automatedmeasurement and control system are now discussed.
A. Hardware Instruments: DAQ and Control
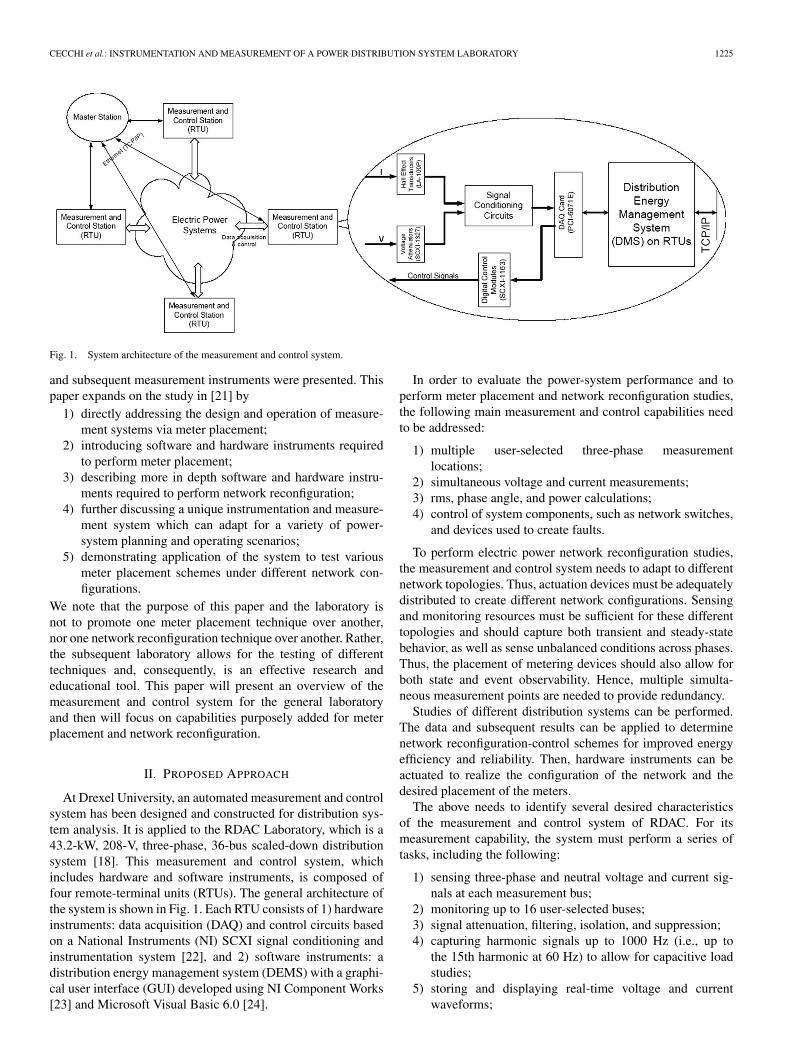
The hardware on each measurement and control stationwas developed around an NI SCXI signal conditioning andinstrumentation system to allow the system to perform tasksone through four, seven, and eight in the proposed approachsection [see Fig. 3(a) and (b)].
Fig. 3. (a) SCXI Rack—SCBs and digital-control boards, connected to thedistribution feeder box by in-house-made cables. (b) Side-view of the distribu-tion feeder box, showing measurement and control ports.
The measurement hardware on each station consists ofvoltage and current sensors, four signal-conditioning boards(SCBs), and a DAQ card.
NI SCXI-1327 voltage attenuators [25] transform three-phase and neutral voltages from up to 250 V to levels acceptableto the DAQ card (< 10 V) at 100 : 1 ratio. These voltageattenuators have a typical gain error of ±0.035%, a maximumgain error of ±0.08%, and an offset error of ±0.51-mV/gainrespect to input (RTI) (with respect to the input). Three-phase and neutral currents are measured using 100-A LiaisonsElectroniques-Mécaniques (LEM) LA-100P hall-effect currenttransducers [26], which have a 2000 : 1 ratio and a 0.45%

CECCHI et al.: INSTRUMENTATION AND MEASUREMENT OF A POWER DISTRIBUTION SYSTEM LABORATORY 1227
Fig. 4. Voltage and current signal-conditioning circuits [30].
accuracy. The attenuated voltage and current signals are thensent to eight channel SCBs. The signal-conditioning circuit hasfour stages and provides the following functions: 1) attenuatingsignals, 2) suppressing voltage spikes, 3) preventing groundloops, and 4) filtering high-frequency noise over 1000 Hz. Aschematic of the signal-conditioning circuit is shown in Fig. 4.Repetitive testing was performed to establish the SCBs’ output-to-input ratios. The average ratio for the four voltage channelswas found to be 0.985, while the ratio for the four currentchannels was determined to be 1.002. Each RTU is programmedto capture 32 filtered voltage and current signals using a 12-b1.25-MHz NI PCI-6071E DAQ card [27].
Each RTU also uses its DAQ card and two NI SCXI-1163digital-control modules [28] to remotely operate 55 controllableswitching devices, which are mimicked using Crydom D2475and D2475B [29], normally open and normally closed digitalrelays, respectively.
B. Software Instruments: DEMS
A DEMS was designed to remotely monitor and control theabove hardware and to enable performance evaluation of thepower system. The DEMS was implemented on a PC usingNI Component Works and Microsoft Visual Basic 6.0. TheDEMS includes virtual measurement and control instrumentsand provides system-control functions as well as data processand display capabilities. More specifically, it allows the accom-plishment of tasks five through nine in the proposed approachsection.
In order to link the measurement hardware and the software,a measurement interface was created, as shown in Fig. 5(a). Itallows users to specify the locations of measurements placedin the hardware, which can be determined by meter placementstudies. In order to link power hardware and software controlinstruments for network reconfiguration, the user is able toselect and specify the desired switch location, as shown inFig. 5(b).
The DEMS provides a nine-bus distribution system dia-gram that reflects the actual experimental setup on each RTU.A screen shot of the main GUI of a general three-phase
Fig. 5. (a) Measurement selection window with Feeder Bus, Bus A1, Bus B1,and Bus B3 selected. (b) Tie-switch location-selection window.
1228 IEEE TRANSACTIONS ON INSTRUMENTATION AND MEASUREMENT, VOL. 56, NO. 4, AUGUST 2007
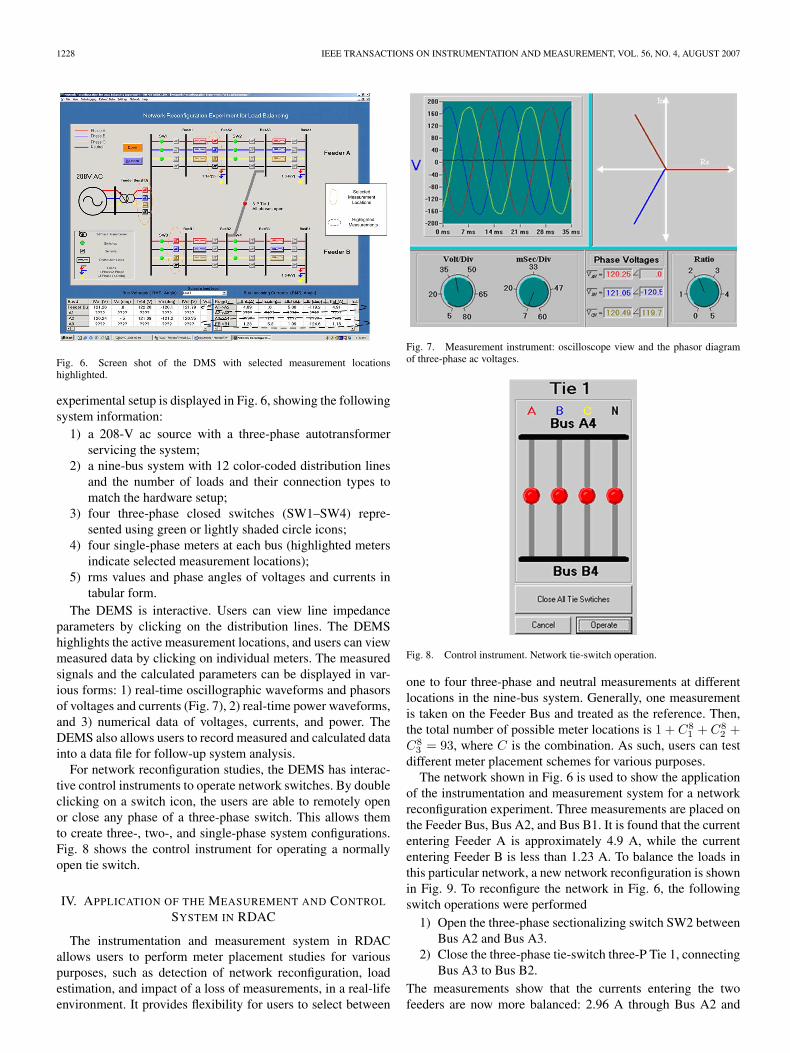
Fig. 6. Screen shot of the DMS with selected measurement locationshighlighted.
experimental setup is displayed in Fig. 6, showing the followingsystem information:
1) a 208-V ac source with a three-phase autotransformerservicing the system;
2) a nine-bus system with 12 color-coded distribution linesand the number of loads and their connection types tomatch the hardware setup;
3) four three-phase closed switches (SW1–SW4) repre-sented using green or lightly shaded circle icons;
4) four single-phase meters at each bus (highlighted metersindicate selected measurement locations);
5) rms values and phase angles of voltages and currents intabular form.
The DEMS is interactive. Users can view line impedanceparameters by clicking on the distribution lines. The DEMShighlights the active measurement locations, and users can viewmeasured data by clicking on individual meters. The measuredsignals and the calculated parameters can be displayed in var-ious forms: 1) real-time oscillographic waveforms and phasorsof voltages and currents (Fig. 7), 2) real-time power waveforms,and 3) numerical data of voltages, currents, and power. TheDEMS also allows users to record measured and calculated datainto a data file for follow-up system analysis.
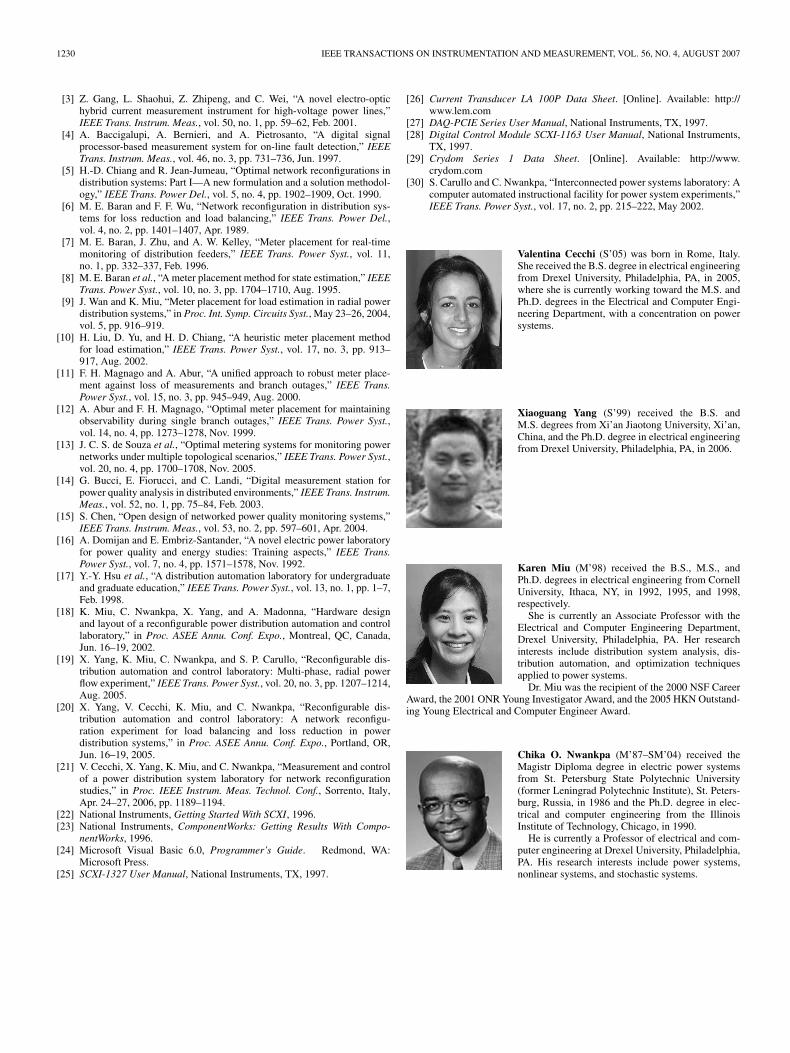
For network reconfiguration studies, the DEMS has interac-tive control instruments to operate network switches. By doubleclicking on a switch icon, the users are able to remotely openor close any phase of a three-phase switch. This allows themto create three-, two-, and single-phase system configurations.Fig. 8 shows the control instrument for operating a normallyopen tie switch.
IV. APPLICATION OF THE MEASUREMENT AND CONTROL
SYSTEM IN RDAC
The instrumentation and measurement system in RDACallows users to perform meter placement studies for variouspurposes, such as detection of network reconfiguration, loadestimation, and impact of a loss of measurements, in a real-lifeenvironment. It provides flexibility for users to select between
Fig. 7. Measurement instrument: oscilloscope view and the phasor diagramof three-phase ac voltages.
Fig. 8. Control instrument. Network tie-switch operation.
one to four three-phase and neutral measurements at differentlocations in the nine-bus system. Generally, one measurementis taken on the Feeder Bus and treated as the reference. Then,the total number of possible meter locations is 1 + C8
1 + C82 +
C83 = 93, where C is the combination. As such, users can test
different meter placement schemes for various purposes.The network shown in Fig. 6 is used to show the application
of the instrumentation and measurement system for a networkreconfiguration experiment. Three measurements are placed onthe Feeder Bus, Bus A2, and Bus B1. It is found that the currententering Feeder A is approximately 4.9 A, while the currententering Feeder B is less than 1.23 A. To balance the loads inthis particular network, a new network reconfiguration is shownin Fig. 9. To reconfigure the network in Fig. 6, the followingswitch operations were performed
1) Open the three-phase sectionalizing switch SW2 betweenBus A2 and Bus A3.
2) Close the three-phase tie-switch three-P Tie 1, connectingBus A3 to Bus B2.
The measurements show that the currents entering the twofeeders are now more balanced: 2.96 A through Bus A2 and

CECCHI et al.: INSTRUMENTATION AND MEASUREMENT OF A POWER DISTRIBUTION SYSTEM LABORATORY 1229
Fig. 9. Screen shot of the DMS after network reconfiguration with SW2 openand three-P Tie 1 closed.
Fig. 10. Screen shot of the DMS with selected measurement locations high-lighted for load estimation.
3.13 A through Bus B1. It can be seen that both the meterson Bus A2 and Bus B1 can detect the network reconfigurationevent by capturing the changes of the line currents.
On the other hand, the current meter placement scheme(Feeder Bus, Bus A2, and Bus B1) might be inappropriate whenthe objective is to estimate the loads in the system. Assumingthat the loads may vary with time, it is noted that we have thefollowing: 1) The loads on Bus A2 and A4 in Fig. 6 cannotbe determined using the three meters, and 2) the loads onBus A4 and Bus B4 in Fig. 9 cannot be determined after thereconfiguration.
A more appropriate meter placement for this particular loadestimation case, using three meters, is provided in Fig. 10. Themeters are placed on the Feeder Bus, Bus A2, and Bus A4,respectively. Using the three meters, all of the loads can be es-timated before and after network reconfiguration. For example,the load on Bus A2 in Fig. 10 can be determined by subtractingthe current measured on Bus A2 by the current measured onBus A4. It is approximately equal to 4.88 − 1.68 = 3.2 A onphase A.
The impact of the loss of measurements on system monitor-ing and operation can also be studied in RDAC. For the networkreconfiguration example in Fig. 6, both the meters on Bus A2and Bus B1 capture the changes in the network structure Fig. 9.Thus, this meter placement can detect network reconfigurationeven if one of the three meters does not function. For theload estimation in Fig. 10, the meter setup will not be able toestimate the loads if one of the three meters does not function.For instance, the load on Bus B4 is unknown if the meter onthe Feeder bus does not function. Thus, this meter placementscheme with the three meters might not be sufficient whenloss of measurements is considered, and more meters shouldbe installed, e.g., one meter on Bus B2.
It is noted that the proposed instrumentation and measure-ment has been utilized in several educational experiments.These experiments are performed within a three-course se-quence at Drexel University, focusing on the distribution systemanalysis. Laboratory modules have been utilized for under-graduate, graduate, and professional training and education. Inaddition, the laboratory facility provides a test bed for researchin the planning and operation of electric power and energysystems.
V. CONCLUSION
Several hardware and software instruments have been specif-ically designed and implemented to allow for meter placementand network reconfiguration studies. The instruments providemeasurement and control capabilities for distribution systemsof different configurations. The hardware and software instru-ments have been combined with measurement instruments toform the unique and flexible instrumentation and measure-ment system of the RDAC Laboratory at Drexel University.Instrumentation and measurement capabilities of the labora-tory include the following: monitoring up to 16 user-selectedlocations, recording and displaying real-time measured volt-age, current, and power waveforms, and remotely operatingcontrollable devices, such as digital relays, to reconfigure thenetwork structure. These characteristics enable event and stateestimation. The resulting laboratory can be applied to studymeter placement and network reconfiguration and can be uti-lized for research, as well as for educational purposes. Futurework includes the integration of a remote master station, wherethe recorded data and control signal can be transferred throughthe Ethernet, allowing for larger system studies and remote-laboratory operation.
ACKNOWLEDGMENT
The authors would like to thank S. Currie, A. Deese,D. Williams, A. Madonna, M. Kleinberg, and M. Basu for theirefforts in the development of the laboratory.
REFERENCES
[1] J. Ge, L. Tong, Q. Chen, G. Han, and Z. Tang, “Unmanned substationsemploy multimedia network RTUs,” IEEE Comput. Appl. Power, vol. 15,no. 2, pp. 36–40, Apr. 2002.
[2] K. Streett, “Utility merges mission—Critical network,” Transmission Dis-tribution World, pp. 18–25, 2004.
1230 IEEE TRANSACTIONS ON INSTRUMENTATION AND MEASUREMENT, VOL. 56, NO. 4, AUGUST 2007
[3] Z. Gang, L. Shaohui, Z. Zhipeng, and C. Wei, “A novel electro-optichybrid current measurement instrument for high-voltage power lines,”IEEE Trans. Instrum. Meas., vol. 50, no. 1, pp. 59–62, Feb. 2001.
[4] A. Baccigalupi, A. Bernieri, and A. Pietrosanto, “A digital signalprocessor-based measurement system for on-line fault detection,” IEEETrans. Instrum. Meas., vol. 46, no. 3, pp. 731–736, Jun. 1997.
[5] H.-D. Chiang and R. Jean-Jumeau, “Optimal network reconfigurations indistribution systems: Part I—A new formulation and a solution methodol-ogy,” IEEE Trans. Power Del., vol. 5, no. 4, pp. 1902–1909, Oct. 1990.
[6] M. E. Baran and F. F. Wu, “Network reconfiguration in distribution sys-tems for loss reduction and load balancing,” IEEE Trans. Power Del.,vol. 4, no. 2, pp. 1401–1407, Apr. 1989.
[7] M. E. Baran, J. Zhu, and A. W. Kelley, “Meter placement for real-timemonitoring of distribution feeders,” IEEE Trans. Power Syst., vol. 11,no. 1, pp. 332–337, Feb. 1996.
[8] M. E. Baran et al., “A meter placement method for state estimation,” IEEETrans. Power Syst., vol. 10, no. 3, pp. 1704–1710, Aug. 1995.
[9] J. Wan and K. Miu, “Meter placement for load estimation in radial powerdistribution systems,” in Proc. Int. Symp. Circuits Syst., May 23–26, 2004,vol. 5, pp. 916–919.
[10] H. Liu, D. Yu, and H. D. Chiang, “A heuristic meter placement methodfor load estimation,” IEEE Trans. Power Syst., vol. 17, no. 3, pp. 913–917, Aug. 2002.
[11] F. H. Magnago and A. Abur, “A unified approach to robust meter place-ment against loss of measurements and branch outages,” IEEE Trans.Power Syst., vol. 15, no. 3, pp. 945–949, Aug. 2000.
[12] A. Abur and F. H. Magnago, “Optimal meter placement for maintainingobservability during single branch outages,” IEEE Trans. Power Syst.,vol. 14, no. 4, pp. 1273–1278, Nov. 1999.
[13] J. C. S. de Souza et al., “Optimal metering systems for monitoring powernetworks under multiple topological scenarios,” IEEE Trans. Power Syst.,vol. 20, no. 4, pp. 1700–1708, Nov. 2005.
[14] G. Bucci, E. Fiorucci, and C. Landi, “Digital measurement station forpower quality analysis in distributed environments,” IEEE Trans. Instrum.Meas., vol. 52, no. 1, pp. 75–84, Feb. 2003.
[15] S. Chen, “Open design of networked power quality monitoring systems,”IEEE Trans. Instrum. Meas., vol. 53, no. 2, pp. 597–601, Apr. 2004.
[16] A. Domijan and E. Embriz-Santander, “A novel electric power laboratoryfor power quality and energy studies: Training aspects,” IEEE Trans.Power Syst., vol. 7, no. 4, pp. 1571–1578, Nov. 1992.
[17] Y.-Y. Hsu et al., “A distribution automation laboratory for undergraduateand graduate education,” IEEE Trans. Power Syst., vol. 13, no. 1, pp. 1–7,Feb. 1998.
[18] K. Miu, C. Nwankpa, X. Yang, and A. Madonna, “Hardware designand layout of a reconfigurable power distribution automation and controllaboratory,” in Proc. ASEE Annu. Conf. Expo., Montreal, QC, Canada,Jun. 16–19, 2002.
[19] X. Yang, K. Miu, C. Nwankpa, and S. P. Carullo, “Reconfigurable dis-tribution automation and control laboratory: Multi-phase, radial powerflow experiment,” IEEE Trans. Power Syst., vol. 20, no. 3, pp. 1207–1214,Aug. 2005.
[20] X. Yang, V. Cecchi, K. Miu, and C. Nwankpa, “Reconfigurable dis-tribution automation and control laboratory: A network reconfigu-ration experiment for load balancing and loss reduction in powerdistribution systems,” in Proc. ASEE Annu. Conf. Expo., Portland, OR,Jun. 16–19, 2005.
[21] V. Cecchi, X. Yang, K. Miu, and C. Nwankpa, “Measurement and controlof a power distribution system laboratory for network reconfigurationstudies,” in Proc. IEEE Instrum. Meas. Technol. Conf., Sorrento, Italy,Apr. 24–27, 2006, pp. 1189–1194.
[22] National Instruments, Getting Started With SCXI, 1996.[23] National Instruments, ComponentWorks: Getting Results With Compo-
nentWorks, 1996.[24] Microsoft Visual Basic 6.0, Programmer’s Guide. Redmond, WA:
Microsoft Press.[25] SCXI-1327 User Manual, National Instruments, TX, 1997.
[26] Current Transducer LA 100P Data Sheet. [Online]. Available: http://www.lem.com
[27] DAQ-PCIE Series User Manual, National Instruments, TX, 1997.[28] Digital Control Module SCXI-1163 User Manual, National Instruments,
TX, 1997.[29] Crydom Series 1 Data Sheet. [Online]. Available: http://www.
crydom.com[30] S. Carullo and C. Nwankpa, “Interconnected power systems laboratory: A
computer automated instructional facility for power system experiments,”IEEE Trans. Power Syst., vol. 17, no. 2, pp. 215–222, May 2002.
Valentina Cecchi (S’05) was born in Rome, Italy.She received the B.S. degree in electrical engineeringfrom Drexel University, Philadelphia, PA, in 2005,where she is currently working toward the M.S. andPh.D. degrees in the Electrical and Computer Engi-neering Department, with a concentration on powersystems.
Xiaoguang Yang (S’99) received the B.S. andM.S. degrees from Xi’an Jiaotong University, Xi’an,China, and the Ph.D. degree in electrical engineeringfrom Drexel University, Philadelphia, PA, in 2006.
Karen Miu (M’98) received the B.S., M.S., andPh.D. degrees in electrical engineering from CornellUniversity, Ithaca, NY, in 1992, 1995, and 1998,respectively.
She is currently an Associate Professor with theElectrical and Computer Engineering Department,Drexel University, Philadelphia, PA. Her researchinterests include distribution system analysis, dis-tribution automation, and optimization techniquesapplied to power systems.
Dr. Miu was the recipient of the 2000 NSF CareerAward, the 2001 ONR Young Investigator Award, and the 2005 HKN Outstand-ing Young Electrical and Computer Engineer Award.
Chika O. Nwankpa (M’87–SM’04) received theMagistr Diploma degree in electric power systemsfrom St. Petersburg State Polytechnic University(former Leningrad Polytechnic Institute), St. Peters-burg, Russia, in 1986 and the Ph.D. degree in elec-trical and computer engineering from the IllinoisInstitute of Technology, Chicago, in 1990.
He is currently a Professor of electrical and com-puter engineering at Drexel University, Philadelphia,PA. His research interests include power systems,nonlinear systems, and stochastic systems.