Instrumentation An Essential Ingredient for Performance Tuning
27
Instrumentation An Essential Ingredient for Performance Tuning Chris Roderick, BE/CO IT/DB Oracle Lectures, June 2012 1
Transcript of Instrumentation An Essential Ingredient for Performance Tuning

InstrumentationAn Essential Ingredient for Performance Tuning
Chris Roderick, BE/CO
IT/DB Oracle Lectures, June 2012
1

2
LDB
Accelerator Logging Service Overview
MDB
Equipment – DAQ – FEC
f f f f f f f f f f
Rad
BLM
BETS BIC
BCT BPM
FGC MS MK
VAC
Equipment – DAQ – PLC
f f f f f f f f f f
QPS PIC
SU
Coll
CNGS
Exp
Cryo CIET
WIC
VAC
PL/
SQ
L A
PI
RAMSES
<Data User>
7 Days raw data
>20 Years filtered dataPL/SQL
filtered data transfer
Data Providers
Data Persistence
Data Consumers
Extraction API
~ 250’000 Signals~ 16 data loading processes~ 5.4 billion records per day~ 275 GB per dayà 100 TB per year throughput
<Data User><Data User>
<Data User>
PL/
SQ
L A
PI
f
~ 856’000 signals~ 300 data loading processes~ 4 billion records per day~ 140 GB per dayà 50 TB per year stored> 100 custom applications
> 3 million extraction requests per day
> 500 registered users
TIM

3
Mission Critical Service !
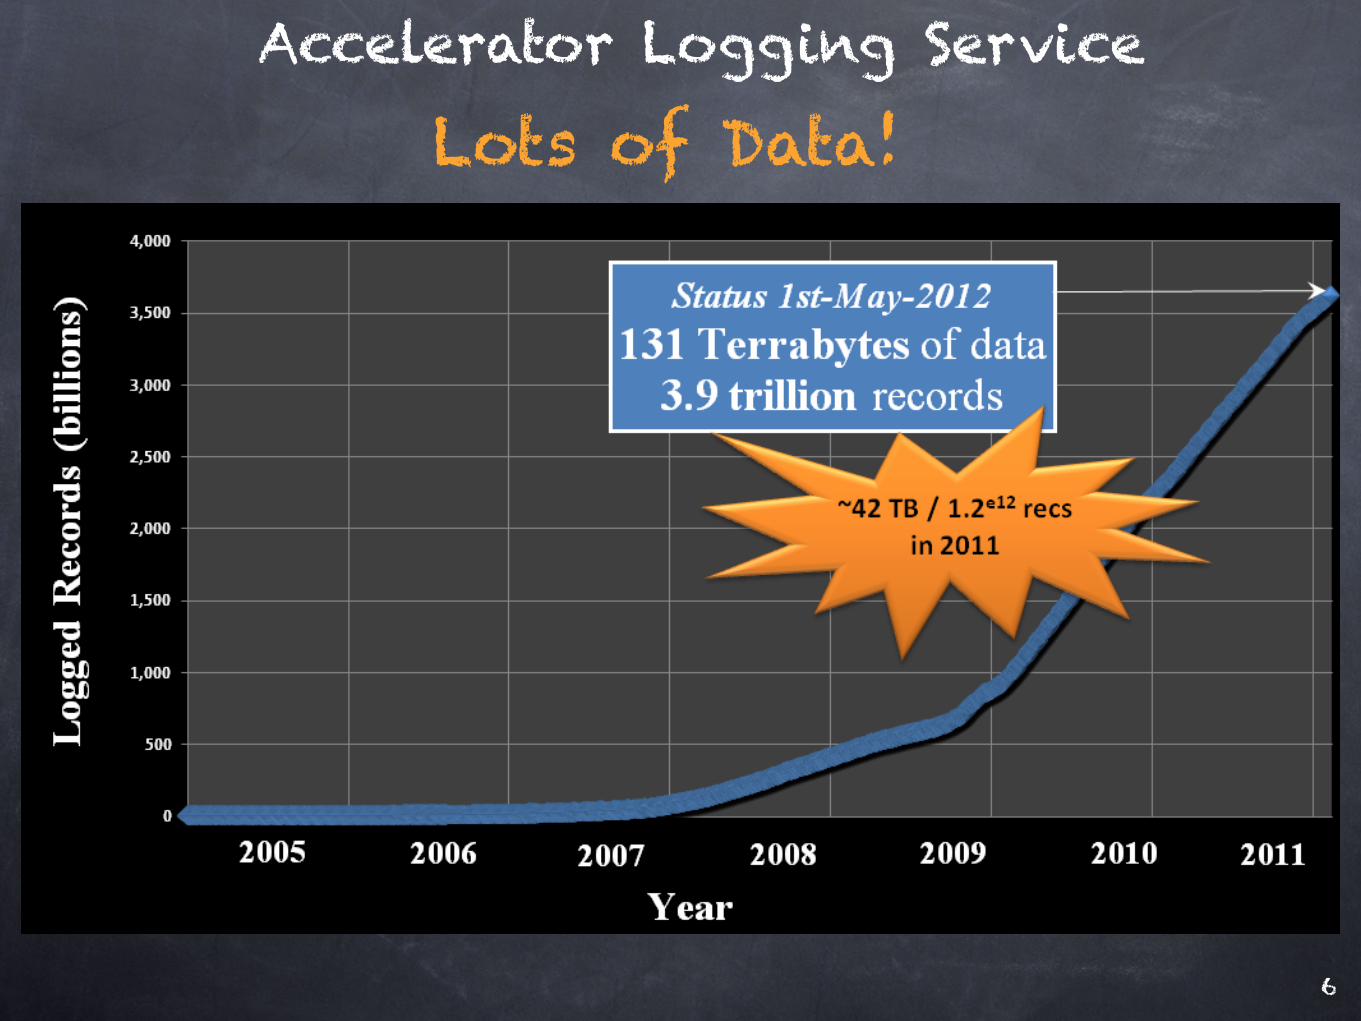
Lots of Data !!
Lots of Users !!!

Be wary of the users!
4

5
Big difference between how:
Users tell you they intend to read/write data
Users actually read/write data
You think users will read/write data
6
Accelerator Logging Service
Lots of Data!

7
System misuse
can have severe
negative impact on stability

Instrument everything!
8

What is Instrumentation?
9
Capturing information about system activity in real time
(& over time)Who? What? Where? How? How Long?

10
We know what the system is doing
We know how the system is performing
Throughput & Response times

11
ASH (using v$session, v$session_wait - real time)
AWR (constant data capture over time)
ADDM (analysis of AWR data)
Tracing (on demand, per session, to file)
OEM (exposing all of the above in a nice GUI)
Oracle is heavily instrumented out of the box

12
Already foreseen MODULE, ACTION, CLIENT_INFODBMS_APPLICATION_INFO.SET_MODULE ( module_name IN VARCHAR2, action_name IN VARCHAR2);
DBMS_APPLICATION_INFO.SET_ACTION ( action_name IN VARCHAR2);
DBMS_APPLICATION_INFO.SET_CLIENT_INFO ( client_info IN VARCHAR2);
Non-transactional
Minimal performance impact (ms)
Oracle instrumentation does not include contextual information

13
DBMS_APPLICATION_INFO in action
Set via DBMS_APPLICATION_INFO

14
BigBrother Java package
BIG_BROTHER PL/SQL package
DBMS_APPLICATION_INFO
provides transparent hooks to other uses:
audit trails (custom logging, profiling)
session tracing (via DBMS_MONITOR)
resource management (using Resource Manager)
access control (e.g. VPD / RLS)
Accurate instrumentation in 3-Tier environment
Accelerator Logging Service
DBMS_MONITOR.SERV_MOD_ACT_STAT_ENABLE( service_name IN VARCHAR2, module_name IN VARCHAR2, action_name IN VARCHAR2 DEFAULT ALL_ACTIONS);
DBMS_MONITOR.SERV_MOD_ACT_TRACE_ENABLE( service_name IN VARCHAR2, module_name IN VARCHAR2 DEFAULT ANY_MODULE, action_name IN VARCHAR2 DEFAULT ANY_ACTION, waits IN BOOLEAN DEFAULT TRUE, binds IN BOOLEAN DEFAULT FALSE, instance_name IN VARCHAR2 DEFAULT NULL);

15
BigBrother Java package
BIG_BROTHER PL/SQL package
DBMS_APPLICATION_INFO
provides transparent hooks to other uses:
audit trails (custom logging, profiling)
session tracing (via DBMS_MONITOR)
resource management (using Resource Manager)
access control (e.g. VPD / RLS)
Accurate instrumentation in 3-Tier environment
Accelerator Logging Service

16
CERN Accelerator Logging Service
Spring HTTP Remoting
10g AS
Spring HTTP Remoting metadata
JDBC TS Data
JDBC TS Data
JDBC Metadata
TIMBER
LDB
MDB
RMI Servers
Spring Remoting
Spring Remoting JDBC TS Data
JDBC TS Data
JDBC Metadata
Database Instrumentation Example
Client API obliges provision of username/application name.
Automatically picks up IP/host.
Server API instruments actions using BigBrother calls to BIG_BROTHER.
BIG_BROTHER package wraps calls to DBMS_APPLICATION_INFO.

17

18
good_performance = ((time_spent / work) <= user_expectation)
Track context specific system workload Vs time spent, over time:
Measure work being done
Time taken to do it
Record the results (details & aggregates)
What about specific Performance Instrumentation?

19
Who - username
What - module, action
Where - IP, host
How - application, method, parameters
How long - elapsed time for every action
Contextual Information (dimensions affecting performance) e.g.
How many records
How many signals
Time window
data manipulations or filters
Operation type - INSERT or MERGE (4x slower)
Accelerator Logging Service

MDB
20
Data Loading Instrumentation Example
Data Writing API
JAPC Monitoring
Equipment – DAQ – FEC
f f f f f f f f f f
Rad
BLM
BETS BIC
BCT BPM
FGC MS MK
VAC
Logging Client
Capture details of every send: #records, #variables, datatypes, time spent, etc. Buffer in memory Write in batches every 5’
Batches of data sent every 30”
Aggregates details, stores as hourly time series
Accessible via TIMBER

MDB
8x jobsrunning every 5’
21
LDB
Measurements to Logging Transfer7 Days raw data
>20 Years filtered data
PL/
SQ
L A
PI
~ 95 % data reductionMillions of records per minute
PL/SQL - bulk read data by category - apply custom filters- bulk transfer
f

22
MDB to LDB Transfer Instrumentation
Capture details of every process execution #records read, #records transferred, time spent, etc. Keep details during 7 days
Hourly Aggregates of resultsStore as time series
Accessible via TIMBER

23
CERN Accelerator Logging Service
Spring HTTP Remoting
10g AS
Spring HTTP Remoting metadata
JDBC TS Data
JDBC TS Data
JDBC Metadata
TIMBER
LDB
MDB
Server API uses generic Tracing Component to instrument actions & measure performance. Delayed batch writes of results to DB, analysis via APEX app.
RMI Servers
Spring Remoting
Spring Remoting JDBC TS Data
JDBC TS Data
JDBC Metadata
Data Extraction Instrumentation Example

24
Accelerator Logging Service
All based on understanding of system usage - through instrumentation
Many Performance Enhancements over the years

Conclusions?
25

26
Good Instrumentation...
Facilitates Performance Tuning, Scalability Planning, & Diagnostics
Enhances System Stability
Enables rapid reactive & proactive Support

Questions?
27
Code Examples
Generic Java Tracing Component
DBMS_APPLICATION_INFO wrapper
Additional Use Cases