Instrumental Texture Analysis Parameters as Markers of Table … · The texture analyzer can use...
18
11 Am. J. Enol. Vitic. 63:1 (2012) The International Organization for Standardization (ISO) defines food texture (in the mouth) as “all the mechanical, geometrical, surface and body attributes of a product percep- tible by means of kinesthetic and somesthetic receptors, and (where appropriate) visual and auditory receptors from the first bite to final swallowing” (ISO 5492:2008). This defini- tion of food texture is similar to a previous one: “the sensory and functional manifestation of the structural, mechanical and surface properties of food detected through the senses of vision, hearing, touch and kinesthetics” (Szczesniak 2002). In accordance with terminology of ISO 5492:2008, mechanical attributes are those related to the reaction of the product to stress: hardness, cohesiveness, viscosity, elasticity, and ad- hesiveness. Geometrical attributes are those related to the size, shape, and arrangement of the particles within a prod- uct. Surface attributes involve the sensations produced in the mouth by the moisture and/or fat in and near the surface of the products, and body attributes are those related to the sensations produced in the mouth by the moisture and/or fat in the substance of the products and the way in which these constituents are released. Since texture consists of a number of different physical sensations, it is preferable to talk about “textural properties,” which infer a group of related proper- ties rather than a single parameter as texture (Bourne 2002). In fruits and vegetables, product quality encompasses sen- sory properties (appearance, texture, taste, and aroma), nutri- tive values, chemical constituents, mechanical characteristics, functional properties, and defects (Abbott 1999). However, particularly for the consumption of fresh fruits, texture is an important attribute in consumer acceptance (Tunick 2011). Many instrumental measurements are correlated with sen- sory descriptors and consumer preferences and can be used as predictors of consumer acceptability (Abbott 1999). For this reason, instrumental texture analysis is a well-established analytical technique in the food industry for evaluating me- chanical and physical characteristics of both raw ingredients and finished products, for pre- and post-cooking quality con- trol, and for monitoring quality during ripening, postharvest, and shelf life. These instrumental texture measurements are typically preferred to sensory evaluations because they reduce the variability associated with subjective judgments and can be easily conducted (Sato and Yamada 2003). In general, the instrumental techniques of studying the rheo- logical behavior of food can be classified into three groups ac- cording to the type of information obtained by the test: funda- mental, empirical, and imitative (Voisey 1976, Bourne 2002). Fundamental tests determine one or more physical constants to describe exactly the properties of food in terms of well-defined rheological parameters. Empirical tests usually measure pa- rameters that are poorly defined in rheological terms but, from practical experience, are closely related to the property of inter- est. Imitative tests aim to reproduce the mechanical operations applied in the human evaluation of food, which are closely cor- related with sensory assessment (Bourne 2002). 1 DIVAPRA, Microbiology and Food Technology Sector, University of Turin, Via L. da Vinci 44, 10095 Grugliasco, Torino, Italy; and 2 Ecole Supérieure d’Agriculture d’Angers, UMT Vinitera, Unité de Recherche GRAPPE, 55 Rue Rabelais, 49007 Angers, France. *Corresponding author (email: [email protected]) Acknowledgments: The authors thank S. Giacosa and G. Iacurti for technical assistance. Manuscript submitted Jun 2011, revised Sept 2011, accepted Sept 2011 Copyright © 2012 by the American Society for Enology and Viticulture. All rights reserved. doi: 10.5344/ajev.2011.11059 Instrumental Texture Analysis Parameters as Markers of Table-Grape and Winegrape Quality: A Review Luca Rolle, 1 * René Siret, 2 Susana Río Segade, 1 Chantal Maury, 2 Vincenzo Gerbi, 1 and Frédérique Jourjon 2 Abstract: Texture analysis is a well-established analytical technique in the food industry for evaluating the mechanical and physical characteristics of both raw ingredients and finished products. Instrumental mechanical properties of table grapes, acquired using universal testing machines equipped with specific probes, may be of interest in the viticulture and postharvest sectors to recognize the potential of each variety and help satisfy market requirements. The measured parameters are related to some sensory properties and, therefore, indirectly to consumer acceptability of the product. As texture analysis is a rapid and low-cost analytical technique, it can also be favorably applied in enology as a routine tool for monitoring winegrape quality. Among the different mechanical parameters measurable, berry skin thickness and hardness are indices that reflect anthocyanin extractability and dehydration kinetics with adequate reliability. This review collects the most recent research results from grape texture studies, emphasizes the potentiality and limits of this analytical technique when applied to grape studies, and highlights trends that require further understanding. Key words: universal testing machine, texture profile analysis, puncture test, skin hardness, seed hardness, berry firmness, phenol extractability
Transcript of Instrumental Texture Analysis Parameters as Markers of Table … · The texture analyzer can use...
11Am. J. Enol. Vitic. 63:1 (2012)
The International Organization for Standardization (ISO) defines food texture (in the mouth) as “all the mechanical, geometrical, surface and body attributes of a product percep-tible by means of kinesthetic and somesthetic receptors, and (where appropriate) visual and auditory receptors from the first bite to final swallowing” (ISO 5492:2008). This defini-tion of food texture is similar to a previous one: “the sensory and functional manifestation of the structural, mechanical and surface properties of food detected through the senses of vision, hearing, touch and kinesthetics” (Szczesniak 2002). In accordance with terminology of ISO 5492:2008, mechanical attributes are those related to the reaction of the product to stress: hardness, cohesiveness, viscosity, elasticity, and ad-hesiveness. Geometrical attributes are those related to the size, shape, and arrangement of the particles within a prod-uct. Surface attributes involve the sensations produced in the mouth by the moisture and/or fat in and near the surface of the products, and body attributes are those related to the sensations produced in the mouth by the moisture and/or fat in the substance of the products and the way in which these constituents are released. Since texture consists of a number
of different physical sensations, it is preferable to talk about “textural properties,” which infer a group of related proper-ties rather than a single parameter as texture (Bourne 2002).
In fruits and vegetables, product quality encompasses sen-sory properties (appearance, texture, taste, and aroma), nutri-tive values, chemical constituents, mechanical characteristics, functional properties, and defects (Abbott 1999). However, particularly for the consumption of fresh fruits, texture is an important attribute in consumer acceptance (Tunick 2011). Many instrumental measurements are correlated with sen-sory descriptors and consumer preferences and can be used as predictors of consumer acceptability (Abbott 1999). For this reason, instrumental texture analysis is a well-established analytical technique in the food industry for evaluating me-chanical and physical characteristics of both raw ingredients and finished products, for pre- and post-cooking quality con-trol, and for monitoring quality during ripening, postharvest, and shelf life. These instrumental texture measurements are typically preferred to sensory evaluations because they reduce the variability associated with subjective judgments and can be easily conducted (Sato and Yamada 2003).
In general, the instrumental techniques of studying the rheo-logical behavior of food can be classified into three groups ac-cording to the type of information obtained by the test: funda-mental, empirical, and imitative (Voisey 1976, Bourne 2002). Fundamental tests determine one or more physical constants to describe exactly the properties of food in terms of well-defined rheological parameters. Empirical tests usually measure pa-rameters that are poorly defined in rheological terms but, from practical experience, are closely related to the property of inter-est. Imitative tests aim to reproduce the mechanical operations applied in the human evaluation of food, which are closely cor-related with sensory assessment (Bourne 2002).
1DIVAPRA, Microbiology and Food Technology Sector, University of Turin, Via L. da Vinci 44, 10095 Grugliasco, Torino, Italy; and 2Ecole Supérieure d’Agriculture d’Angers, UMT Vinitera, Unité de Recherche GRAPPE, 55 Rue Rabelais, 49007 Angers, France.*Corresponding author (email: [email protected])Acknowledgments: The authors thank S. Giacosa and G. Iacurti for technical assistance.Manuscript submitted Jun 2011, revised Sept 2011, accepted Sept 2011Copyright © 2012 by the American Society for Enology and Viticulture. All rights reserved.doi: 10.5344/ajev.2011.11059
Instrumental Texture Analysis Parameters as Markers of Table-Grape and Winegrape Quality: A Review
Luca Rolle,1* René Siret,2 Susana Río Segade,1 Chantal Maury,2 Vincenzo Gerbi,1 and Frédérique Jourjon2
Abstract: Texture analysis is a well-established analytical technique in the food industry for evaluating the mechanical and physical characteristics of both raw ingredients and finished products. Instrumental mechanical properties of table grapes, acquired using universal testing machines equipped with specific probes, may be of interest in the viticulture and postharvest sectors to recognize the potential of each variety and help satisfy market requirements. The measured parameters are related to some sensory properties and, therefore, indirectly to consumer acceptability of the product. As texture analysis is a rapid and low-cost analytical technique, it can also be favorably applied in enology as a routine tool for monitoring winegrape quality. Among the different mechanical parameters measurable, berry skin thickness and hardness are indices that reflect anthocyanin extractability and dehydration kinetics with adequate reliability. This review collects the most recent research results from grape texture studies, emphasizes the potentiality and limits of this analytical technique when applied to grape studies, and highlights trends that require further understanding.
Key words: universal testing machine, texture profile analysis, puncture test, skin hardness, seed hardness, berry firmness, phenol extractability
12 – Rolle et al.
Am. J. Enol. Vitic. 63:1 (2012)
The first grape studies based on texture analysis were conducted on table-grape varieties in the 1980s (Bernstein and Lustig 1981, Lang and During 1990). Instrumental as-sessment of pulp compactness and berry skin consistency provides relevant information for customer acceptance (Sims and Halbrooks 1986, Laszlo and Saayman 1991, Mencarelli et al. 1994, Uys 1996, Sato et al. 1997, Sato and Yamada 2003), and the firmness of the berry is considered a measure-ment of its freshness (Vargas et al. 2001). For table grapes, particular attention has focused on the mechanical proper-ties of pulp. Crispness is the most desirable texture for table use, and cultivars with a crisp flesh texture are important genetic materials for table-grape breeding (Sato et al. 2000, 2006). Instrumental texture parameters are also frequently used to investigate the effects of vineyard practices (Sato et al. 2004, Peppi et al. 2006, Baiano et al. 2011) and to evaluate postharvest conditions and methods (Ahumada et al. 1996, Deng et al. 2005, Valero et al. 2006, Jang and Lee 2009, Miguel et al. 2009).
Although texture studies on winegrapes were also begun in the 1980s with the aim of describing the changes in berry me-chanical properties during ripening (Lee and Bourne 1980), this field has found new applications. In wine production, berry composition at the moment of picking is an important determinant of grape quality (Bisson 2001) and, in particular, the production of high-quality red wines requires the assess-ment of grape phenolic maturity through the determination of phenolic compound concentration and their extractability during winemaking. Knowledge of grape phenol characteris-tics, content, and extractability may allow winemakers to best exploit the grape potential reached in the vineyard (Sacchi et al. 2005). In this sense, the necessity of investigating new parameters in order to understand and predict quickly and at low cost the phenol extractability from the skin and seeds has likely stimulated, in recent years, a rediscovery of instrumen-tal texture analysis applied to winegrapes (Le Moigne et al. 2008a, Río Segade et al. 2008, Rolle et al. 2008).
Therefore, the goals of this review are to collect the most recent scientific knowledge related to the mechanical proper-ties of table grapes and winegrapes acquired by instrumental texture analysis and to discuss the limits and opportunities of the technological information supplied from these parameters.
Instrumental Measurements of Texture and Mechanical Parameters
for Grape CharacterizationFood texture methods are performed under well-defined
and controlled conditions in the laboratory, although some particular measurements of cell turgor of grape berry can be carried out directly in the vineyard (Thomas et al. 2006, Mat-thews et al. 2009). Some of these conditions are guaranteed by the instruments used: viscometers, rheometers, powder flow testers, and texture analyzers (Bourne 2002). The lat-ter instruments, generally called universal testing machines (UTMs), are those currently used in texture tests applied in grape studies and provide precise measures of force, time, distance, and deformation.
There are more than 10 companies that manufacture com-puter-controlled UTMs with many useful features for operat-ing the machine and acquiring, storing, analyzing, and report-ing the data. However, some UTMs do not provide test cells for food applications (<50 kg).
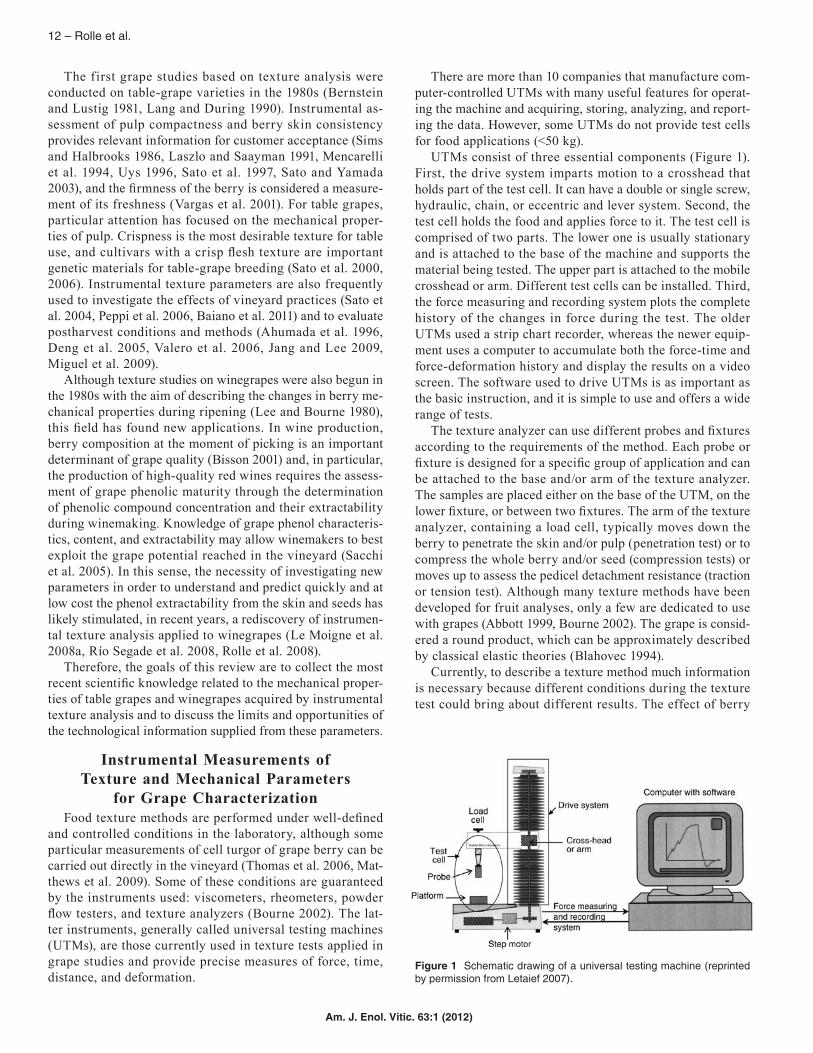
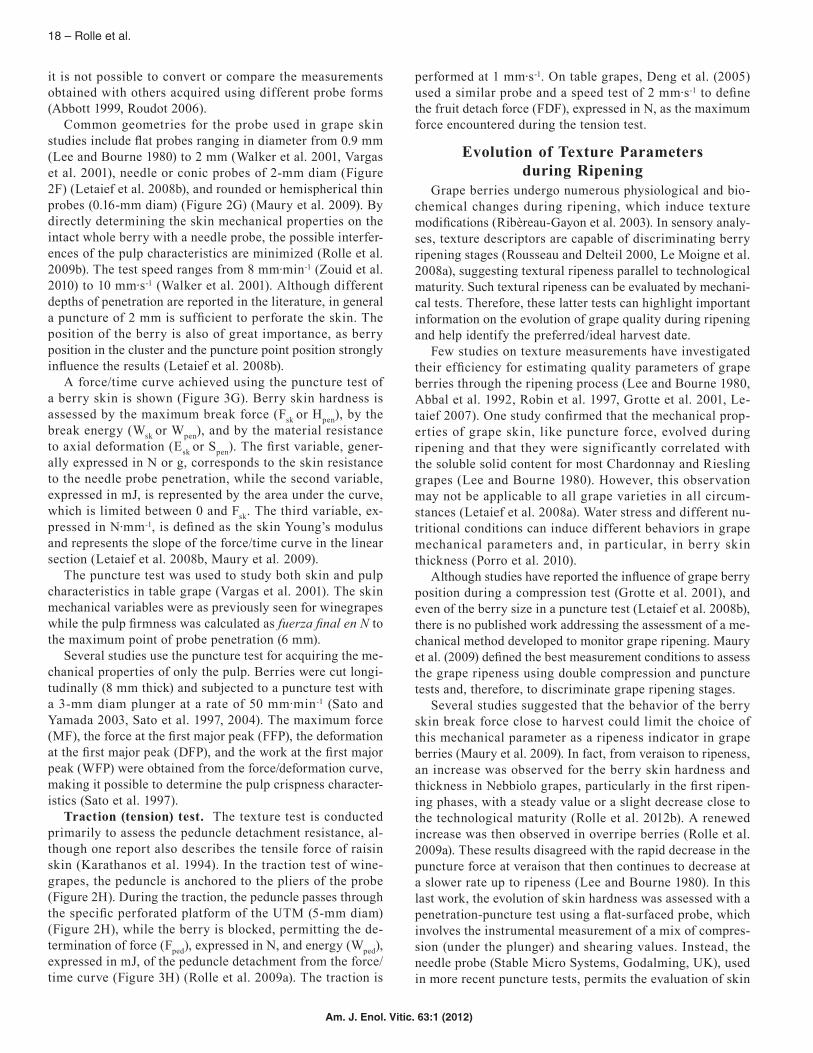
UTMs consist of three essential components (Figure 1). First, the drive system imparts motion to a crosshead that holds part of the test cell. It can have a double or single screw, hydraulic, chain, or eccentric and lever system. Second, the test cell holds the food and applies force to it. The test cell is comprised of two parts. The lower one is usually stationary and is attached to the base of the machine and supports the material being tested. The upper part is attached to the mobile crosshead or arm. Different test cells can be installed. Third, the force measuring and recording system plots the complete history of the changes in force during the test. The older UTMs used a strip chart recorder, whereas the newer equip-ment uses a computer to accumulate both the force-time and force-deformation history and display the results on a video screen. The software used to drive UTMs is as important as the basic instruction, and it is simple to use and offers a wide range of tests.
The texture analyzer can use different probes and fixtures according to the requirements of the method. Each probe or fixture is designed for a specific group of application and can be attached to the base and/or arm of the texture analyzer. The samples are placed either on the base of the UTM, on the lower fixture, or between two fixtures. The arm of the texture analyzer, containing a load cell, typically moves down the berry to penetrate the skin and/or pulp (penetration test) or to compress the whole berry and/or seed (compression tests) or moves up to assess the pedicel detachment resistance (traction or tension test). Although many texture methods have been developed for fruit analyses, only a few are dedicated to use with grapes (Abbott 1999, Bourne 2002). The grape is consid-ered a round product, which can be approximately described by classical elastic theories (Blahovec 1994).
Currently, to describe a texture method much information is necessary because different conditions during the texture test could bring about different results. The effect of berry
Figure 1 Schematic drawing of a universal testing machine (reprinted by permission from Letaief 2007).
Grape Texture Analysis – 13
Am. J. Enol. Vitic. 63:1 (2012)
temperature, the number of berries or of their parts (skins, seeds) by sample, and berry position on the platform are among the most important conditions, but detailed experi-mental conditions are not always reported. Grape berries are generally analyzed at ambient temperature (20 ± 2°C) and, prior to the test, thermal conditioning in a thermostati-cally controlled chamber is highly recommended (Rolle et al. 2009a).
An accurate and representative grape sampling must be conducted in the field. A published general sampling method has often been suggested for texture studies (Carbonneau et al. 1991). Moreover, the sample size has to be carefully chosen to guarantee the desired degree of confidence in the results and conclusions. Sample size reported in the literature for a single test ranges from 5 (Sato et al. 2004) to 50 berries (Le Moigne et al. 2008a), and it is suggested that a sample size of 20 berries could be enough to perform a compression test on Cabernet franc grapes (Maury et al. 2009). A higher number of berries did not decrease the coefficient of variation for the different mechanical parameters. The same authors reported that 15 berries could be sufficient to successfully complete a puncture test on the berry skin. As noted (Dell et al. 2002), the number of berries to be tested is based on experience and guesswork because no prior data help to estimate the correct value. In general, three variables must be known or fixed to calculate sample size: the confidence interval width (representing the maximum difference between the sample mean and the real population mean); the population standard deviation (if not known, it is estimated as the sample standard deviation); and the desired confidence level (from 90 to 99%). The sample size is calculated using the following equation (Snedecor and Cochran 1989):
where tn-1,α is the value from the t-distribution for n-1 de-grees of freedom and 1-α confidence level, s is the standard deviation of the sample, L is the width of the full expected confidence interval, and N is the sample size. In applying this formula, a maximum of 49 berries are reportedly necessary to assess correctly the skin break force for Nebbiolo, Pinot noir, and Cabernet Sauvignon grapes in a puncture test (L = 0.020; confidence level = 95%) (Letaief et al. 2008b). Therefore, too large a sample would require excessive time and resources, but too small a sample would not guarantee the significance of the statistical results.
In general, compression and penetration/puncture tests are conducted on the lateral side of the whole berry, positioned on the base of the texture analyzer (pedicel positioned hori-zontally) (Letaief et al. 2008a, Maury et al. 2009). However, using a perforated platform, it is possible to work with the berry positioned vertically (Figure 2A) (Letaief et al. 2008b). To acquire information only on the pulp mechanical proper-ties, the berry can be partially (Lee and Bourne 1980) or totally peeled (Deng et al. 2005). However, close to harvest, this operation is practically impossible for winegrapes.
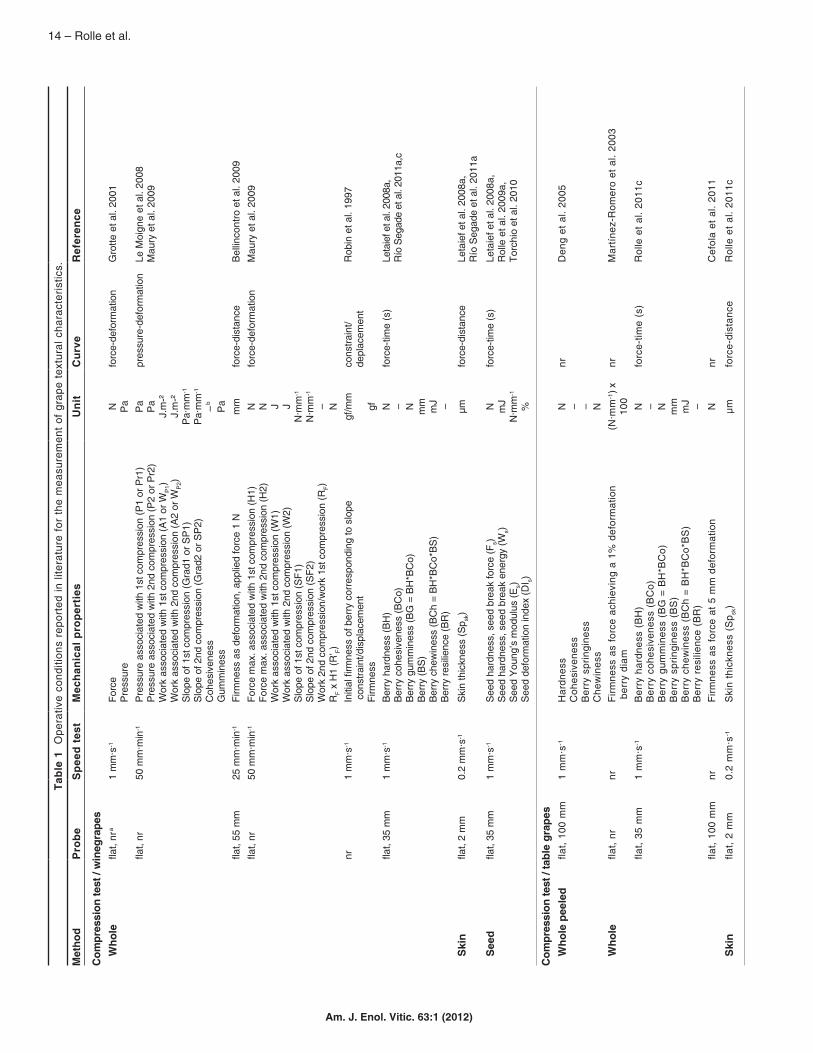
In addition to these preliminary considerations, it is neces-sary to define the operative conditions of a texture test such as the platform and load cell used (from 0.5 to 50 kg), the test speed (expressed in mm∙s-1 or mm∙min-1), the probe charac-teristics, the frequency of acquisition by the UMT software (from 100 to 400 Hz) in the different types of curve (force/time, stress/strain, force/distance, force/deformation, pres-sure/deformation), and the mechanical properties required in-cluding their correct units. Some of the main texture methods dedicated to grape studies are summarized (Table 1).
Compression test. With the compression test, the influ-ence of the pulp and skin properties on the berry mechanical characteristics is aggregate. This test can be invasive, with a simple destructive compression of the sample, or noninva-sive (Grotte et al. 2001). Texture profile analysis (TPA) is a typical nondestructive compression test (Deng et al. 2005,
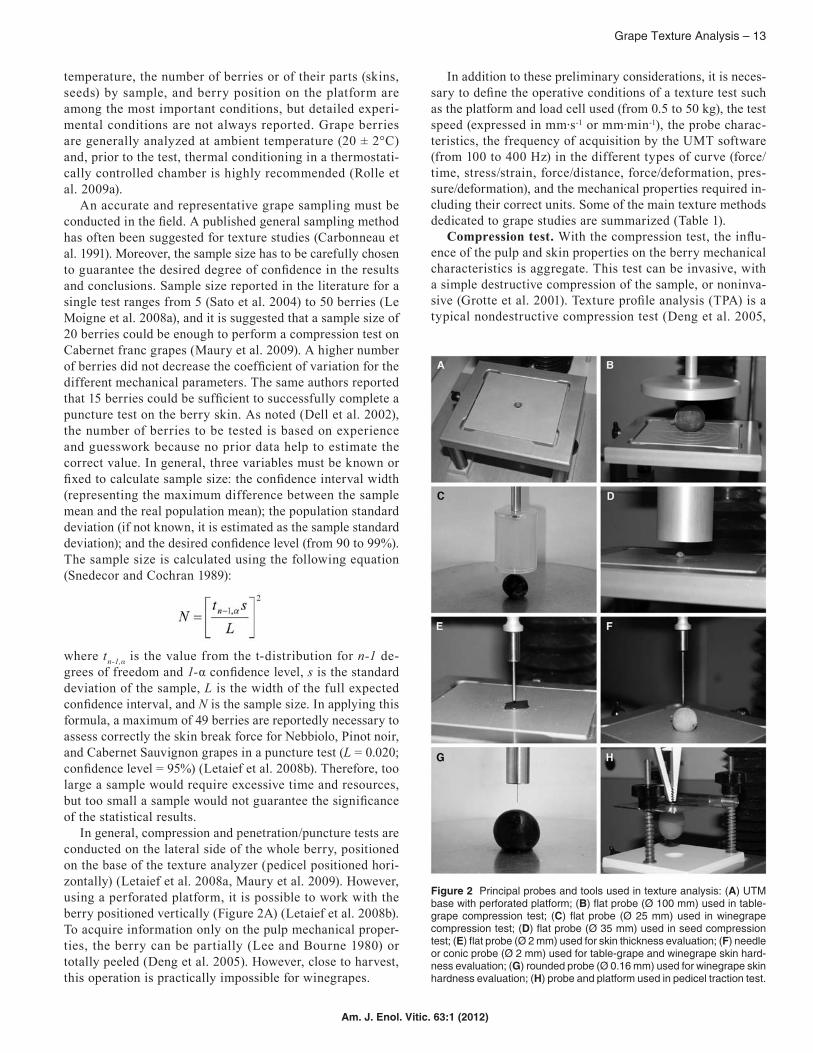
Figure 2 Principal probes and tools used in texture analysis: (A) UTM base with perforated platform; (B) flat probe (Ø 100 mm) used in table-grape compression test; (C) flat probe (Ø 25 mm) used in winegrape compression test; (D) flat probe (Ø 35 mm) used in seed compression test; (E) flat probe (Ø 2 mm) used for skin thickness evaluation; (F) needle or conic probe (Ø 2 mm) used for table-grape and winegrape skin hard-ness evaluation; (G) rounded probe (Ø 0.16 mm) used for winegrape skin hardness evaluation; (H) probe and platform used in pedicel traction test.
14 – Rolle et al.
Am. J. Enol. Vitic. 63:1 (2012)
Tabl
e 1
Ope
rativ
e co
nditi
ons
repo
rted
in li
tera
ture
for
the
mea
sure
men
t of
gra
pe t
extu
ral c
hara
cter
istic
s.
Met
hod
Pro
beS
peed
tes
tM
echa
nica
l pro
pert
ies
Uni
tC
urve
Ref
eren
ce
Com
pres
sion
test
/ w
ineg
rape
s W
hole
flat,
nra
1 m
m∙s
-1Fo
rce
Pre
ssur
eN Pa
forc
e-de
form
atio
nG
rotte
et a
l. 20
01
flat,
nr50
mm
∙min
-1P
ress
ure
asso
ciat
ed w
ith 1
st c
ompr
essi
on (P
1 or
Pr1
)P
ress
ure
asso
ciat
ed w
ith 2
nd c
ompr
essi
on (P
2 or
Pr2
)W
ork
asso
ciat
ed w
ith 1
st c
ompr
essi
on (A
1 or
WP
1)W
ork
asso
ciat
ed w
ith 2
nd c
ompr
essi
on (A
2 or
WP
2)S
lope
of 1
st c
ompr
essi
on (G
rad1
or S
P1)
Slo
pe o
f 2nd
com
pres
sion
(Gra
d2 o
r SP
2)C
ohes
iven
ess
Gum
min
ess
Pa
Pa
J.m
-²J.
m-²
Pa∙
mm
-1
Pa∙
mm
-1
– b
Pa
pres
sure
-def
orm
atio
nLe
Moi
gne
et a
l. 20
08M
aury
et a
l. 20
09
flat,
55 m
m25
mm
∙min
-1Fi
rmne
ss a
s de
form
atio
n, a
pplie
d fo
rce
1 N
mm
forc
e-di
stan
ceB
ellin
cont
ro e
t al.
2009
flat,
nr50
mm
∙min
-1Fo
rce
max
. ass
ocia
ted
with
1st
com
pres
sion
(H1)
Forc
e m
ax. a
ssoc
iate
d w
ith 2
nd c
ompr
essi
on (H
2)W
ork
asso
ciat
ed w
ith 1
st c
ompr
essi
on (W
1)W
ork
asso
ciat
ed w
ith 2
nd c
ompr
essi
on (W
2)S
lope
of 1
st c
ompr
essi
on (S
F1)
Slo
pe o
f 2nd
com
pres
sion
(SF2
)W
ork
2nd
com
pres
sion
/wor
k 1s
t com
pres
sion
(RF)
RF
x H
1 (R
’ F)
N N J JN
∙mm
-1
N∙m
m-1
– N
forc
e-de
form
atio
nM
aury
et a
l. 20
09
nr1
mm
∙s-1
Initi
al fi
rmne
ss o
f ber
ry c
orre
spon
ding
to s
lope
c
onst
rain
t/dis
plac
emen
tFi
rmne
ss
gf/m
m
gf
cons
train
t/ de
plac
emen
tR
obin
et a
l. 19
97
flat,
35 m
m1
mm
∙s-1
Ber
ry h
ardn
ess
(BH
)B
erry
coh
esiv
enes
s (B
Co)
Ber
ry g
umm
ines
s (B
G =
BH
*BC
o)B
erry
(BS
)B
erry
che
win
ess
(BC
h =
BH
*BC
o*B
S)
Ber
ry re
silie
nce
(BR
)
N – N mm
mJ –
forc
e-tim
e (s
)Le
taie
f et a
l. 20
08a,
R
ío S
egad
e et
al.
2011
a,c
Ski
nfla
t, 2
mm
0.2
mm
∙s-1
Ski
n th
ickn
ess
(Sp sk
)µm
forc
e-di
stan
ceLe
taie
f et a
l. 20
08a,
R
ío S
egad
e et
al.
2011
a
See
dfla
t, 35
mm
1 m
m∙s
-1S
eed
hard
ness
, see
d br
eak
forc
e (F
s)S
eed
hard
ness
, see
d br
eak
ener
gy (W
s)S
eed
You
ng’s
mod
ulus
(Es)
See
d de
form
atio
n in
dex
(DI s)
N mJ
N∙m
m-1
%
forc
e-tim
e (s
)Le
taie
f et a
l. 20
08a,
R
olle
et a
l. 20
09a,
To
rchi
o et
al.
2010
Com
pres
sion
test
/ ta
ble
grap
esW
hole
pee
led
flat,
100
mm
1 m
m∙s
-1H
ardn
ess
Coh
esiv
enes
s B
erry
spr
ingi
ness
Che
win
ess
N – – N
nrD
eng
et a
l. 20
05
Who
lefla
t, nr
nrF
irmne
ss a
s fo
rce
achi
evin
g a
1% d
efor
mat
ion
b
erry
dia
m(N
∙mm
-1) x
10
0nr
Mar
tínez
-Rom
ero
et a
l. 20
03
flat,
35 m
m1
mm
∙s-1
Ber
ry h
ardn
ess
(BH
)B
erry
coh
esiv
enes
s (B
Co)
Ber
ry g
umm
ines
s (B
G =
BH
*BC
o)B
erry
spr
ingi
ness
(B
S)
Ber
ry c
hew
ines
s (B
Ch
= B
H*B
Co*
BS
)B
erry
res
ilien
ce (
BR
)
N – N mm
mJ –
forc
e-tim
e (s
)R
olle
et
al.
2011
c
flat,
100
mm
nrF
irmne
ss a
s fo
rce
at 5
mm
def
orm
atio
nN
nrC
efol
a et
al.
2011
Ski
nfla
t, 2
mm
0.2
mm
∙s-1
Ski
n th
ickn
ess
(Sp sk
)µm
forc
e-di
stan
ceR
olle
et
al.
2011
c
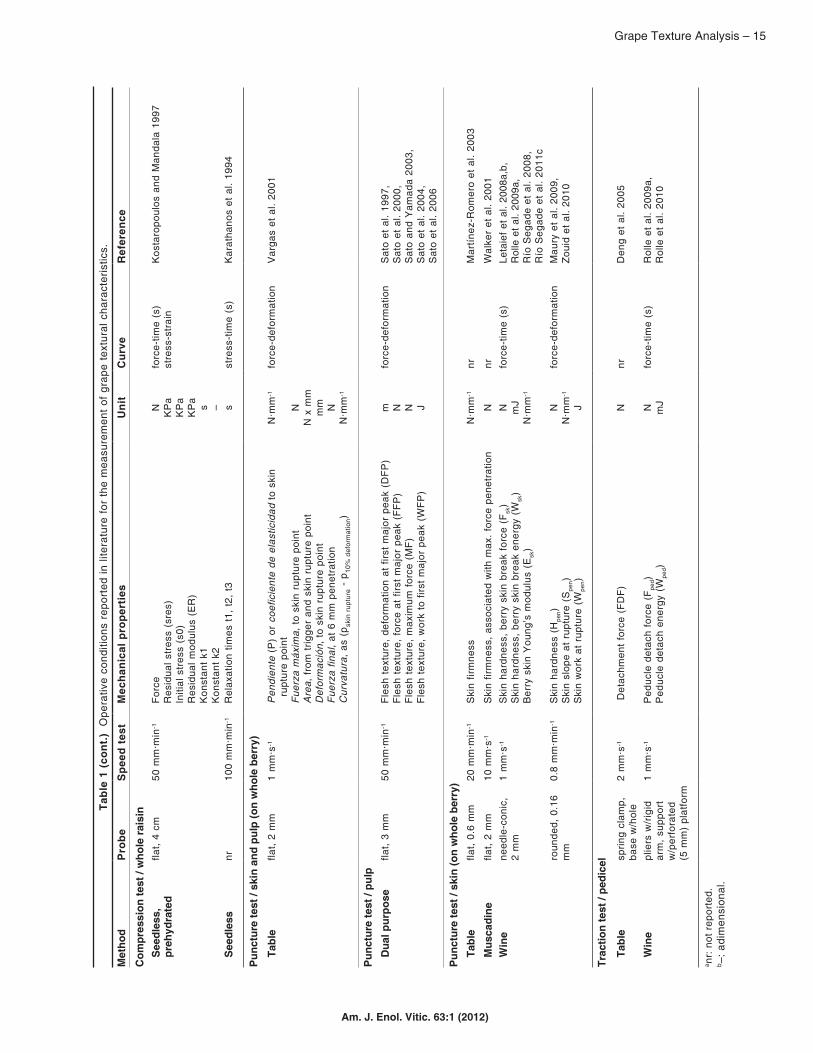
Grape Texture Analysis – 15
Am. J. Enol. Vitic. 63:1 (2012)
Tabl
e 1
(con
t.)
Ope
rativ
e co
nditi
ons
repo
rted
in li
tera
ture
for
the
mea
sure
men
t of
gra
pe t
extu
ral c
hara
cter
istic
s.
Met
hod
Pro
beS
peed
tes
tM
echa
nica
l pro
pert
ies
Uni
tC
urve
Ref
eren
ce
Com
pres
sion
test
/ w
hole
rai
sin
See
dles
s,pr
ehyd
rate
dfla
t, 4
cm50
mm
∙min
-1F
orce
Res
idua
l str
ess
(sre
s)In
itial
str
ess
(s0)
Res
idua
l mod
ulus
(E
R)
Kon
stan
t k1
Kon
stan
t k2
N KP
aK
Pa
KP
as –
forc
e-tim
e (s
)
stre
ss-s
trai
nK
osta
ropo
ulos
and
Man
dala
199
7
See
dles
snr
100
mm
∙min
-1R
elax
atio
n tim
es t
1, t
2, t
3s
stre
ss-t
ime
(s)
Kar
atha
nos
et a
l. 19
94
Pun
ctur
e te
st /
skin
and
pul
p (o
n w
hole
ber
ry)
Tabl
efla
t, 2
mm
1 m
m∙s
-1P
endi
ente
(P
) or
coe
ficie
nte
de e
last
icid
ad t
o sk
in
ru
ptur
e po
int
Fue
rza
máx
ima,
to
skin
rup
ture
poi
ntA
rea,
fro
m t
rigge
r an
d sk
in r
uptu
re p
oint
Def
orm
ació
n, t
o sk
in r
uptu
re p
oint
Fue
rza
final
, at
6 m
m p
enet
ratio
nC
urva
tura
, as
(p sk
in r
uptu
re -
p10
% d
efor
mat
ion)
N∙m
m-1
NN
x m
m
mm N
N∙m
m-1
forc
e-de
form
atio
nV
arga
s et
al.
2001
Pun
ctur
e te
st /
pulp
Dua
l pur
pose
flat,
3 m
m50
mm
∙min
-1F
lesh
tex
ture
, de
form
atio
n at
firs
t m
ajor
pea
k (D
FP
)F
lesh
tex
ture
, fo
rce
at f
irst
maj
or p
eak
(FF
P)
Fle
sh t
extu
re,
max
imum
for
ce (
MF
)F
lesh
tex
ture
, w
ork
to f
irst
maj
or p
eak
(WF
P)
m N N J
forc
e-de
form
atio
nS
ato
et a
l. 19
97,
S
ato
et a
l. 20
00,
Sat
o an
d Y
amad
a 20
03,
S
ato
et a
l. 20
04,
S
ato
et a
l. 20
06
Pun
ctur
e te
st /
skin
(on
who
le b
erry
)Ta
ble
flat,
0.6
mm
20 m
m∙m
in-1
Ski
n fir
mne
ssN
∙mm
-1nr
Mar
tínez
-Rom
ero
et a
l. 20
03
Mus
cadi
nefla
t, 2
mm
10 m
m∙s
-1S
kin
firm
ness
, as
soci
ated
with
max
. fo
rce
pene
trat
ion
Nnr
Wal
ker
et a
l. 20
01
Win
ene
edle
-con
ic,
2 m
m1
mm
∙s-1
Ski
n ha
rdne
ss,
berr
y sk
in b
reak
for
ce (
Fsk
)S
kin
hard
ness
, be
rry
skin
bre
ak e
nerg
y (W
sk)
Ber
ry s
kin
You
ng’s
mod
ulus
(E
sk)
N mJ
N∙m
m-1
forc
e-tim
e (s
)Le
taie
f et a
l. 20
08a,
b,
Rol
le e
t al.
2009
a,
Río
Seg
ade
et a
l. 20
08,
R
ío S
egad
e et
al.
2011
cro
unde
d, 0
.16
mm
0.8
mm
∙min
-1
Ski
n ha
rdne
ss (
Hpe
n)S
kin
slop
e at
rup
ture
(S
pen)
Ski
n w
ork
at r
uptu
re (
Wpe
n)
NN
∙mm
-1
J
forc
e-de
form
atio
nM
aury
et
al.
2009
, Z
ouid
et
al.
2010
Trac
tion
test
/ pe
dice
l
Tabl
esp
ring
clam
p,
base
w/h
ole
2 m
m∙s
-1 D
etac
hmen
t fo
rce
(FD
F)
Nnr
Den
g et
al.
2005
Win
epl
iers
w/r
igid
ar
m,
supp
ort
w
/per
fora
ted
(5 m
m)
plat
form
1 m
m∙s
-1P
educ
le d
etac
h fo
rce
(Fpe
d)P
educ
le d
etac
h en
ergy
(W
ped)
N mJ
forc
e-tim
e (s
)R
olle
et
al.
2009
a,R
olle
et
al.
2010
a nr:
not
rep
orte
d.
b –: a
dim
ensi
onal
.
16 – Rolle et al.
Am. J. Enol. Vitic. 63:1 (2012)
Letaief et al. 2008a), also called the double compression test (Maury et al. 2009). The waiting time between the two cycles of compression must be specified. For grape studies, it is generally 2 sec (Letaief et al. 2008a) or 3 sec (Deng et al. 2005), although this information is often lacking.
For whole berry, the level of compression is dependent on the grape variety and the study. The berry is compressed by using two parallel plates (UTM platform and flat probe, Fig-ure 2B, 2C) to 1% (Martínez-Romero et al. 2003), 10% (Robin et al. 1997), 20% (Maury et al. 2009), 25% (Río Segade et al. 2011b, 2011c), or 40% (Kostaropoulos and Mandala 1997) of berry height. The compression could reach 60% (Karathanos et al. 1994) with the invasive method. However, for some vari-eties, a 25% deformation can cause skin breakage. Seed hard-ness was determined with a 50% deformation with the use of a cylindrical flat probe (Torchio et al. 2010) (Figure 2D).
The diameter of the probe can vary given the study: 6.3 mm (Artès-Hernandez et al 2004), 40 mm (Kostaropoulos and Mandala 1997), and 100 mm (Deng et al. 2005, Cefola et al. 2011). While the dimension of the flat probe does not influ-ence the results, different test speeds can prevent compari-son among grape studies. The literature shows a wide range for this operative condition: 25 mm∙min-1 (Bellincontro et al. 2009), 0.5 mm∙s-1 (Bares et al. 1994), 50 mm∙min-1 (Maury et al. 2009), 1 mm∙s-1 (Letaief et al. 2008a, Torchio et al. 2010), and 100 mm∙min-1 (Karathanos et al. 1994).
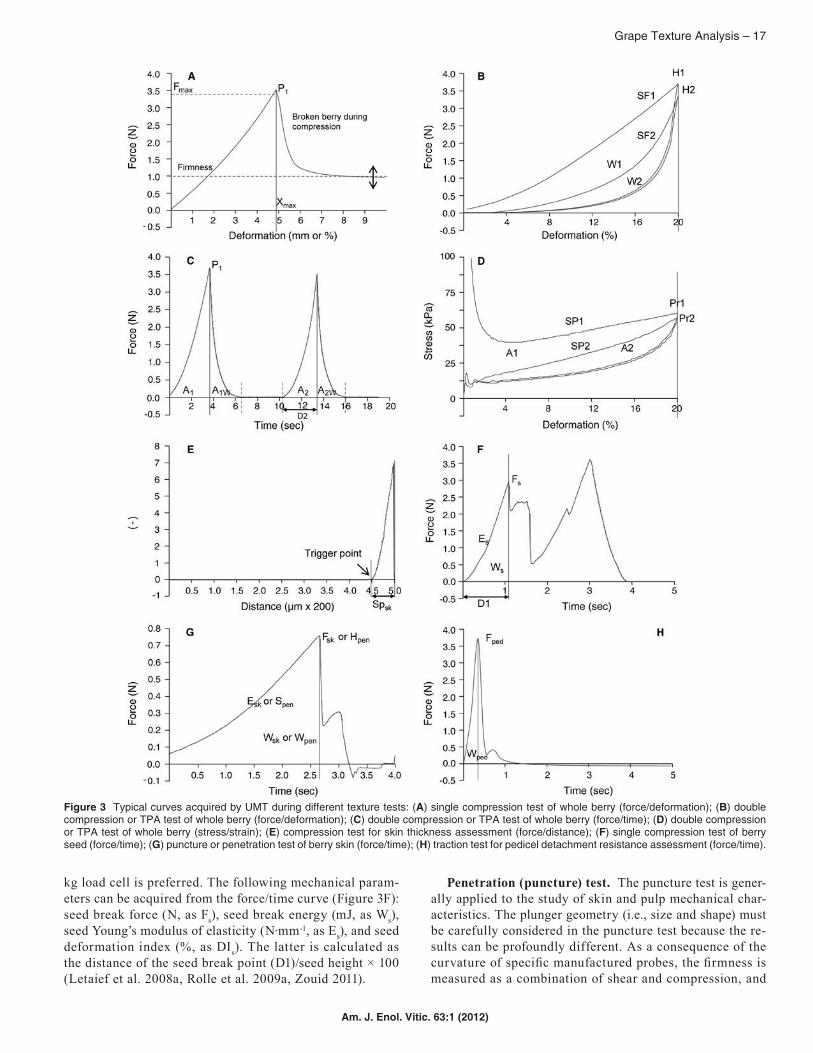
The mechanical parameters of the whole berry obtainable after a single compression test or TPA are extracted by ana-lyzing the curves acquired during the tests (Figure 3). The same mechanical attributes are often labeled differently by various authors; thus a comparison of results can be difficult.
During a single compression test, berry firmness was de-fined as mm of deformation under a force of 1 N (Bellincontro et al. 2009) (Figure 3A). Conversely, Fermeté initiale de la baie and Fermeté were defined as F10/X10 (force necessary to obtain a deformation of 10%, expressed in g) and Fmax/Xmax (force in g to the distance of the skin rupture), respectively (Robin et al. 1997). Similarly, for table grapes this parameter was expressed as the force (N) required to obtain 5 mm de-formation (Cefola et al. 2011).
In a double compression test (TPA) conducted on wine-grapes, eight mechanical parameters were determined in a force/strain curve (Maury et al. 2009) (Figure 3B). These parameters were the hardness associated with the first com-pression, corresponding to the maximal force (H1), and with the second compression (H2), labeled force, hardness, or firmness; the work associated with H1 (W1) and with H2 (W2), which is the energy of the system; the slopes of the first (SF1) and the second compression (SF2), labeled Young’s modulus of elasticity; and the ratios RF = W2/W1 and R’F = RF x H1, labeled cohesiveness and gumminess, respectively (Breene 1975). In the same test, from the force/time curve (Figure 3C), several authors have characterized the mechani-cal behavior of winegrape and table-grape cultivars using nomenclature reminiscent of food science. The first maxi-mum compression force is defined by P1 as berry hardness (BH), whereas the D2 value (BS, berry springiness) is the
distance recovered by the sample during the time between the end of the first bite and the start of the second bite. The variables A1, A1W, A2, and A2W correspond to the areas under compression and withdrawal portions of the first bite and the second bite curve. From them, berry cohesiveness (BCo) or strength of the internal bonds comprising the berry body is calculated as (A2+A2W)/(A1+A1W). Berry gumminess (BG) and berry chewiness (BCh) are the force and energy, respectively, necessary to chew a semisolid food until ready for swallow-ing and they are calculated as BH*BCo and BH*BCo*BS, respectively. Finally, berry resilience (BR), a dimensionless parameter that represents how well the berry succeeds in regaining its original position, is evaluated from the curve by A1W/A1 ratio (Deng et al. 2005, Letaief et al. 2008a, Rolle et al. 2011c).
Several authors have suggested that the influence of berry size on the force developed is of great importance and data have to be expressed in stress (Grotte et al. 2001, Le Moigne et al. 2008a, Maury et al. 2009). In this case, the stress/strain curve gives another eight parameters (Figure 3D): stress (pressure) associated with the first compression (Pr1) and the second compression (Pr2), area under the curve as-sociated with Pr1 (A1) and with Pr2 (A2), slope of the first compression (SP1) and of the second one (SP2), and ratios RP = A2/A1 and R’P = RP x P1 (Breene 1975). However, Maury et al. (2009) showed that there is no difference between the results expressed in force and in stress. The calculations of the stress are realized by the use of an approximation of the model inducing a lower repeatability of the results. More-over, the parameters RP and R’P are sometimes labeled cohe-siveness and gumminess similarly to the force parameters, which is incorrect as the units are different. Several studies on raisins used relaxation times defined as the time at which 63% of the stress has been relaxed, at a fixed strain, from the generalized Maxwell model (Karathanos et al. 1994, Kosta-ropoulos and Mandala 1997).
Compression measurements were also taken on the skins of Thompson Seedless grapes with a 4.8-mm diam plunger to evaluate the resistance to the compression (Ahumada et al. 1996). A similar compression test was applied to deter-mine berry skin thickness (Spsk) using a lower test speed (0.2 mm∙s-1) and a flat probe of 2-mm diam (Figure 2E) (Le-taief et al. 2008a). The skin thickness (Spsk) is calculated as distance (µm) between the instrument calibration distance, generally 1 mm, and the probe trigger point (Figure 3E). The measurement of this parameter requires the manual separa-tion of a piece of skin from the lateral side of each berry, taking care to remove the pulp from the skin and position the skin sample on the platform to prevent folds. Furthermore, it is convenient to insert an instrumental trigger threshold equal to 0.05 N to enable the plane surface of the probe to adhere completely to the skin sample before acquisition, thus allowing a reduction or elimination of the “tail” effect due to the postponement of the contact point (Río Segade et al. 2011a).
Finally, the compression test can be used to determine the mechanical properties of seeds. For this purpose, a 50
Grape Texture Analysis – 17
Am. J. Enol. Vitic. 63:1 (2012)
Figure 3 Typical curves acquired by UMT during different texture tests: (A) single compression test of whole berry (force/deformation); (B) double compression or TPA test of whole berry (force/deformation); (C) double compression or TPA test of whole berry (force/time); (D) double compression or TPA test of whole berry (stress/strain); (E) compression test for skin thickness assessment (force/distance); (F) single compression test of berry seed (force/time); (G) puncture or penetration test of berry skin (force/time); (H) traction test for pedicel detachment resistance assessment (force/time).
kg load cell is preferred. The following mechanical param-eters can be acquired from the force/time curve (Figure 3F): seed break force (N, as Fs), seed break energy (mJ, as Ws), seed Young’s modulus of elasticity (N∙mm-1, as Es), and seed deformation index (%, as DIs). The latter is calculated as the distance of the seed break point (D1)/seed height × 100 (Letaief et al. 2008a, Rolle et al. 2009a, Zouid 2011).
Penetration (puncture) test. The puncture test is gener-ally applied to the study of skin and pulp mechanical char-acteristics. The plunger geometry (i.e., size and shape) must be carefully considered in the puncture test because the re-sults can be profoundly different. As a consequence of the curvature of specific manufactured probes, the firmness is measured as a combination of shear and compression, and
18 – Rolle et al.
Am. J. Enol. Vitic. 63:1 (2012)
it is not possible to convert or compare the measurements obtained with others acquired using different probe forms (Abbott 1999, Roudot 2006).
Common geometries for the probe used in grape skin studies include flat probes ranging in diameter from 0.9 mm (Lee and Bourne 1980) to 2 mm (Walker et al. 2001, Vargas et al. 2001), needle or conic probes of 2-mm diam (Figure 2F) (Letaief et al. 2008b), and rounded or hemispherical thin probes (0.16-mm diam) (Figure 2G) (Maury et al. 2009). By directly determining the skin mechanical properties on the intact whole berry with a needle probe, the possible interfer-ences of the pulp characteristics are minimized (Rolle et al. 2009b). The test speed ranges from 8 mm∙min-1 (Zouid et al. 2010) to 10 mm∙s-1 (Walker et al. 2001). Although different depths of penetration are reported in the literature, in general a puncture of 2 mm is sufficient to perforate the skin. The position of the berry is also of great importance, as berry position in the cluster and the puncture point position strongly influence the results (Letaief et al. 2008b).
A force/time curve achieved using the puncture test of a berry skin is shown (Figure 3G). Berry skin hardness is assessed by the maximum break force (Fsk or Hpen), by the break energy (Wsk or Wpen), and by the material resistance to axial deformation (Esk or Spen). The first variable, gener-ally expressed in N or g, corresponds to the skin resistance to the needle probe penetration, while the second variable, expressed in mJ, is represented by the area under the curve, which is limited between 0 and Fsk. The third variable, ex-pressed in N∙mm-1, is defined as the skin Young’s modulus and represents the slope of the force/time curve in the linear section (Letaief et al. 2008b, Maury et al. 2009).
The puncture test was used to study both skin and pulp characteristics in table grape (Vargas et al. 2001). The skin mechanical variables were as previously seen for winegrapes while the pulp firmness was calculated as fuerza final en N to the maximum point of probe penetration (6 mm).
Several studies use the puncture test for acquiring the me-chanical properties of only the pulp. Berries were cut longi-tudinally (8 mm thick) and subjected to a puncture test with a 3-mm diam plunger at a rate of 50 mm∙min-1 (Sato and Yamada 2003, Sato et al. 1997, 2004). The maximum force (MF), the force at the first major peak (FFP), the deformation at the first major peak (DFP), and the work at the first major peak (WFP) were obtained from the force/deformation curve, making it possible to determine the pulp crispness character-istics (Sato et al. 1997).
Traction (tension) test. The texture test is conducted primarily to assess the peduncle detachment resistance, al-though one report also describes the tensile force of raisin skin (Karathanos et al. 1994). In the traction test of wine-grapes, the peduncle is anchored to the pliers of the probe (Figure 2H). During the traction, the peduncle passes through the specific perforated platform of the UTM (5-mm diam) (Figure 2H), while the berry is blocked, permitting the de-termination of force (Fped), expressed in N, and energy (Wped), expressed in mJ, of the peduncle detachment from the force/time curve (Figure 3H) (Rolle et al. 2009a). The traction is
performed at 1 mm∙s-1. On table grapes, Deng et al. (2005) used a similar probe and a speed test of 2 mm∙s-1 to define the fruit detach force (FDF), expressed in N, as the maximum force encountered during the tension test.
Evolution of Texture Parameters during Ripening
Grape berries undergo numerous physiological and bio-chemical changes during ripening, which induce texture modifications (Ribèreau-Gayon et al. 2003). In sensory analy-ses, texture descriptors are capable of discriminating berry ripening stages (Rousseau and Delteil 2000, Le Moigne et al. 2008a), suggesting textural ripeness parallel to technological maturity. Such textural ripeness can be evaluated by mechani-cal tests. Therefore, these latter tests can highlight important information on the evolution of grape quality during ripening and help identify the preferred/ideal harvest date.
Few studies on texture measurements have investigated their efficiency for estimating quality parameters of grape berries through the ripening process (Lee and Bourne 1980, Abbal et al. 1992, Robin et al. 1997, Grotte et al. 2001, Le-taief 2007). One study confirmed that the mechanical prop-erties of grape skin, like puncture force, evolved during ripening and that they were significantly correlated with the soluble solid content for most Chardonnay and Riesling grapes (Lee and Bourne 1980). However, this observation may not be applicable to all grape varieties in all circum-stances (Letaief et al. 2008a). Water stress and different nu-tritional conditions can induce different behaviors in grape mechanical parameters and, in particular, in berry skin thickness (Porro et al. 2010).
Although studies have reported the influence of grape berry position during a compression test (Grotte et al. 2001), and even of the berry size in a puncture test (Letaief et al. 2008b), there is no published work addressing the assessment of a me-chanical method developed to monitor grape ripening. Maury et al. (2009) defined the best measurement conditions to assess the grape ripeness using double compression and puncture tests and, therefore, to discriminate grape ripening stages.
Several studies suggested that the behavior of the berry skin break force close to harvest could limit the choice of this mechanical parameter as a ripeness indicator in grape berries (Maury et al. 2009). In fact, from veraison to ripeness, an increase was observed for the berry skin hardness and thickness in Nebbiolo grapes, particularly in the first ripen-ing phases, with a steady value or a slight decrease close to the technological maturity (Rolle et al. 2012b). A renewed increase was then observed in overripe berries (Rolle et al. 2009a). These results disagreed with the rapid decrease in the puncture force at veraison that then continues to decrease at a slower rate up to ripeness (Lee and Bourne 1980). In this last work, the evolution of skin hardness was assessed with a penetration-puncture test using a flat-surfaced probe, which involves the instrumental measurement of a mix of compres-sion (under the plunger) and shearing values. Instead, the needle probe (Stable Micro Systems, Godalming, UK), used in more recent puncture tests, permits the evaluation of skin
Grape Texture Analysis – 19
Am. J. Enol. Vitic. 63:1 (2012)
mechanical characteristics, minimizing possible interferences from the pulp firmness on the results. Since the values of Young’s modulus differed throughout the ripening process for Cabernet franc grapes harvested at different dates, it seems more probable that the riper berries were the springier ones (Zouid et al. 2010). These results agreed with others (Vargas et al. 2001), which concluded that the gradient or elasticity coefficient can be considered as a good berry flesh firmness index for Thompson Seedless grapes.
The hardness of berry seeds also varies during the ripen-ing process because they become harder and, therefore, a high hardness of berry seeds indicates ripeness. Given this reason-ing, the harder seeds would have a more lignified innermost layer, which could be due to a more complete ripening stage (Letaief et al. 2008a).
Since the texture properties of the whole berry depend on different characteristics, like cell wall composition, cell structure, and pulp turgescence, and fruit softening occurs during ripening, a double compression or TPA test can also be useful to monitor grape ripening as pulp and skin data are aggregated. The berry compression parameters discriminated ripening stages of Cabernet franc grapes for different growing locations but could not predict, berry by berry, the ripening ones as a consequence of the grape variability (Le Moigne et al. 2008a). Therefore, these authors suggested that it is essen-tial to work on mean values for compression measurements instead of considering each grape berry separately. Most stud-ies on instrumental texture analysis reported mean values of the mechanical parameters. Although the effect of the harvest date on these rheological properties of Cabernet franc grapes differed among vineyards, all double compression parameters, excepting cohesiveness, generally decreased through the rip-ening process, when they were expressed as mean values, and barely increased again until the harvest date even if the trend was rather irregular (Zouid et al. 2010). These last two studies found an interaction between the ripening effect and vineyard effect for most of the compression parameters.
These texture changes are believed to involve losses in turgor pressure and modifications in the cell wall structure (Goulao and Oliveira 2008). A high cellular turgor required a higher rupture force (De Belie et al. 1999). However, higher force was also required to conduct the compression test close to technological maturity. De Baerdemaeker et al. (1978) sug-gested that the compressive stress at failure increases with the decrease in the water potential and, therefore, with the decrease in the turgor potential, which corresponds to the osmotic pressure generated within the cell sap (Roudot 2006). The degradation of biological membranes during ripening causes an increase in the membrane permeability, resulting in a decrease in cellular and tissue turgor. However, at harvest, the whole berry mechanical parameters can also depend on the viral status of the plants (Santini et al. 2011). In particular, differences in berry cohesiveness and resilience were detected in Nebbiolo grapes simultaneously affected by GLRaV-1 and GVA grapevine virus compared to healthy specimens. In fact, proteomics analysis showed that the virus infection mainly influenced the proteins involved in the cell structure metabo-
lism in the pulp with an increase in the cell wall degradation (Giribaldi et al. 2011).
Most studies related to changes in mechanical parameters during ripening were performed on grapes harvested at dif-ferent dates. Presently, the variability in physiological char-acteristics of grapes in a vineyard at any given date is well known. All grapes do not ripen homogeneously, and berries with different soluble solids content are present in a vineyard (Kontoudakis et al. 2010). In fact, Fournand et al. (2006) proposed the assessment of sampling homogeneity by total soluble solids content. Berries were calibrated according to their density, which was estimated by flotation in different saline solutions (from 100 to 190 g L-1 NaCl) (Fournand et al. 2006). In consequence, the trend in this research field is to verify the real behavior of instrumental texture properties during the ripening process and to evaluate their effective potentiality as ripeness predictors. With this aim, densimetric sorting of grapes is required for each sampling date previous to the texture measurements.
Most published works to date have only reported the in-fluence of soluble solids content and, therefore, of sugar ac-cumulation on the instrumental texture parameters in grape berries harvested at the same date. In the same production area, no significant change was reported in the hardness and stiffness of both berry skins and seeds for Barbera grapes with sugar content of 235, 252, and 269 g L-1 (Torchio et al. 2010). This study also found an increasing trend of berry skin thickness with sugar accumulation (Torchio et al. 2010), whereas other studies indicated that berry skin texture pa-rameters agreed for sugar contents of 176, 193, 210, and 227 g L-1 in Mencía, Brancellao, and Merenzao varieties (Río Segade et al. 2011a, 2011b). These differences in skin thick-ness could be due to the different representativeness of the grape samples analyzed. With Barbera, the four vineyards sampled were in different provinces of Piedmont, but the same clone and rootstock were used (Torchio et al. 2010). Furthermore, vine age varied between 14 and 16 years and the same training and pruning systems were used for all of the vineyards. With Mencía grapes, the seven vineyards sampled were in the same zone, but the vines had differ-ent ages (6 to 14 years) and were cultivated using different practices (Río Segade et al. 2011a). For Mencía, Brancellao, and Merenzao, grape samples were collected from the same vineyard with vines of similar cultural characteristics (Río Segade et al. 2011b).
Some significant differences have been reported in the skin Young’s modulus for sugar content (from 177 to 259 g L-1) in Cabernet franc grapes, but the evolution of this parameter with the sugar accumulation was not clear (Zouid et al. 2011). However, these authors confirmed that the values of the berry skin hardness agree for different soluble solids content.
On the other hand, berry cohesiveness permitted the clas-sification of Mencía, Brancellao, and Merenzao grapes accord-ing to their ripening stage and, therefore, the usefulness of this compression parameter as a ripeness predictor has been veri-fied (Río Segade et al. 2011b). There was a decreasing trend for all compression parameters in the three Galician varieties
20 – Rolle et al.
Am. J. Enol. Vitic. 63:1 (2012)
when the sugar content increased. The effect of ripening stage on compression parameters was also confirmed in Cabernet franc grapes, except for firmness, which was the only rheo-logical property that did not show a significant decrease with the increase in the sugar concentration (Zouid et al. 2011).
The double compression parameters seem more appropri-ate than the puncture parameters to explain differences in cell tissue mechanics among berries belonging to different densimetric classes. The complexity of the cell wall structure of berry tissues and the number of mechanisms possibly in-volved in softening and firmness loss are such that no single theory can perfectly explain the tissue changes occurring dur-ing ripening. Consequently, the development of a mechanical theory would facilitate the prediction and interpretation of such tissue texture approaches.
With the aim of evaluating whether changes occurring in skin mechanical properties during grape ripening are mainly due to the heterogeneity of the berries harvested or to their evolution through the final ripening weeks, a recent study examined Nebbiolo grapes harvested during five consecutive weeks and then separated according to three density classes (1088, 1094, and 1100 kg m-3) (Rolle et al. 2011d). The chang-es observed in the mechanical parameters through the ripen-ing process were more related to berry density than to harvest date. This work highlights that the winemaker has to select berry density according to the objective quality properties of the wine to elaborate. The skin puncture parameters in-creased with berry density at each harvest date studied. How-ever, this increment was not consistently significant. These results agreed with results for Barbera grapes with different soluble solids, where few significant changes were reported in the parameters that characterize berry skin hardness (Fsk and Wsk) and tissue rigidity or stiffness (Esk), but an increas-ing tendency of skin thickness with sugar accumulation was observed (Torchio et al. 2010).
Instrumental Texture Parameters as Varietal Markers
The textural characteristics of a grape variety depend on the structure of tissues at ripeness (Roudot 2006), with genotype the major limiting factor in berry development and composition. The effectiveness of instrumental texture pa-rameters as varietal markers of winegrapes and table grapes has been recently investigated. Berry skin break force and energy represent meaningful mechanical properties for varietal characterization and differentiation. These skin tex-ture parameters allowed the differentiation of 13 red wine-grape varieties from Galicia (northwest Spain) (Río Segade et al. 2008), and they are also little influenced by grape ripening stage (Torchio et al. 2010, Río Segade et al. 2011a, 2011b, Zouid et al. 2011). Instead, berry skin thickness could not be considered a good differentiating attribute because it agreed for all the Galician red cultivars studied (Río Segade et al. 2008, 2011b). In red winegrape varieties cultivated in Italy, such as Barbera, Brachetto, Cabernet Sauvignon, Dolcetto, Freisa, Nebbiolo, and Pinot noir, both hardness and thickness of berry skins differed significantly (Letaief et al. 2008a).
The greater differences in skin thickness for Italian variet-ies in relation to Spanish varieties could be attributed to the different growing locations of the Italian cultivars studied, whereas all of the Spanish varieties were collected in the same vineyard. Moreover, in Nebbiolo grapes, variations in the same cultivar can be imputed to clonal differences (Rolle et al. 2012b).
Since the effect of grape variety on berry skin hardness depends on the puncture position (Letaief et al. 2008b), the puncture test was conducted on the bottom, lateral, and top sides of the berry in order to identify the optimal varietal markers. Berry skin break force and energy measured on the lateral side of grapes best described the differences among Galician red winegrape varieties, particularly Mencía, Bran-cellao, and Merenzao (Río Segade et al. 2011b).
In comparative studies, the skin mechanical properties, particularly skin break force (Fsk), are likely to be varietal markers for white and colored table grapes because of their decisive contribution to varietal differentiation. In 10 Italian white table-grape varieties, Fsk values ranged from 0.560 N for Delizia del Vaprio to 0.425 N for Matilde (Rolle et al. 2011c). In five international red table-grape varieties analyzed using the same instrumental texture methods, the lowest Fsk value was 0.329 N for Black Magic and the highest value was 0.585 N for Alphonse Lavallée (Rolle et al. 2012a). Despite the high variability of the skin thickness (Spsk) data, many differences were found among table-grape varieties. This characteristic may influence the texture desirability of grapes and, in those varieties with thick skins, if not associated with high skin friability, would limit their commercial acceptance (Cliff et al. 1996). On the other hand, skin thickness and toughness are factors that contribute to the resistance of table grapes against fungal pathogens (Rosenquist and Morrison 1988) and to handling injury during harvest, packing, transport, and storage (Kök and Çelik 2004). White table grapes like Regina (266 µm), Sublima Seedless (264 µm), and Pizzutello bianco (260 µm) and colored table grapes like Perlon (305 µm) and Alphonse Lavallée (269 µm) had higher Spsk values (Rolle et al. 2011c, 2012a). In general, no correlations were found between Fsk and Spsk.
The double compression parameters of the whole berry have been also related to the varietal characteristics of grapes. Grape cultivars evidenced different reactions in the double compression test and, therefore, TPA could be more appro-priate to explain varietal differences than the mechanical properties of skins and seeds. Berry hardness, gumminess, springiness, and chewiness are helpful varietal discriminat-ing factors for Italian red winegrape varieties, with berry chewiness the most representative (Letaief et al. 2008a). On the other hand, a significant varietal effect was observed for berry hardness, gumminess, springiness, chewiness, and re-silience in Galician red winegrape varieties (Río Segade et al. 2011b).
In table grapes, particular attention has focused on pulp mechanical characteristics because crispness is the most de-sirable texture for table use and cultivars with a crisp flesh texture are important genetic materials (Sato et al. 1997).
Grape Texture Analysis – 21
Am. J. Enol. Vitic. 63:1 (2012)
White and colored table-grape varieties were also discrimi-nated when attempting to differentiate the double compres-sion parameters of the whole berry. Gumminess, chewiness, and resilience seem to be the best mechanical properties to characterize/differentiate table-grape varieties (Rolle et al. 2011c, 2012a). Double compression parameters enable dis-crimination of the two grape types. In fact, the instrumental flesh texture of table grapes is harder than that of winegrapes (Sato and Yamada 2003).
Effects of Climate, Vintage, and Growing Location on Texture Parameters
The relationship between climate and berry properties has attracted considerable attention; temperature is recognized as the main climatic variable affecting vintage quality (Jack-son and Lombard 1993, Hall and Jones 2009). Nevertheless, the impact of temperature on harvested grape quality can vary for different grapevine cultivars as a consequence of genotype-environment interaction. The length of growing season is also a determining factor in grape composition (Jackson and Lombard 1993, Duchene and Schneider 2005, Webb et al. 2007). Some authors confirmed that earlier ripen-ing periods in a season may have negative effects on grape composition and, therefore, on wine quality (Jones and Davis 2000, Hall and Jones 2009). Furthermore, grape texture is linked to growing location, reflecting a terroir influence on grape quality (Le Moigne et al. 2008a). The relevance of annual variations in climate is emphasized because these, in addition to vineyard location, typically far outweigh any changes in berry attributes introduced by cultural practices and even those arising from differences in soil conditions (van Leeuwen et al. 2004, Downey et al. 2006, Pereira et al. 2006, Keller et al. 2008).
A recent study addressed the relationship among climatic and bioclimatic indices for different grape ripening periods (90 to 120, 45, 31, 15, 7, and 3 days), close to the harvest date, and berry skin texture characteristics at harvest (Rolle et al. 2011b). The influence of annual variations in climate on skin hardness was assessed for 30 colored and white winegrape varieties as a consequence of the genotype-environment interaction, and the most significant relationships among climatic indices and the skin mechanical attributes corre-sponded to seasonal temperature parameters, particularly absolute maximum temperature. The influence of production area was also evaluated in the same season, with precipita-tion parameters in the last ripening weeks the best correlated with berry skin hardness.
The efficiency of instrumental texture parameters for the differentiation of production areas and even vineyards has been recently assessed. Within the same variety, the soil type of the growing location (three French Appellation d’Origine Contrôlée) in the Loire Valley influenced the values of the double compression parameters (e.g., berry hardness, cohe-siveness, and gumminess) of Cabernet franc grapes. A sandy soil with low drainage favored earlier ripeness during a dry summer (Le Moigne et al. 2008a). Other work confirmed the complementarities of the double compression parameters to
describe the texture characteristics of Cabernet franc grape berries cultivated in the Loire Valley, which were also influ-enced by the parcel effect (Maury et al. 2009). Although some parcels were differentiated even when each skin puncture parameter was measured individually, together they had a higher discriminating power and the three parcels were com-pletely differentiated (Maury et al. 2009). The skin puncture parameters, particularly break energy and Young’s modulus, together with berry cohesiveness were able to discriminate Cabernet franc grapes belonging to different Loire Valley vineyards, independently of the sugar accumulated in the berry pulp (Zouid et al. 2010). Therefore, the mechanical properties of Cabernet franc grapes are vineyard dependent through the ripening process. Physiologically, grape texture, particularly that of the skin, is more influenced by terroir than by ripeness at the harvest date (Maury et al. 2009).
The possible use of the texture characteristics as mark-ers for zoning of Mencía grapes was assessed in the Ribeira Sacra Denomination of Origin (DO); a steep-slope viticulture area in Galicia (northwest Spain), which is divided into five subzones (Río Segade et al. 2011c). Results showed that berry skin hardness and stiffness are effective tools to discriminate different subzones, whereas berry skin thickness was of little utility as a differentiating parameter. The effect of vineyard location was also significant on all compression parameters, except for berry springiness. Likewise, berry skin break en-ergy and berry cohesiveness were the best mechanical prop-erties for the differentiation of subzones.
Berry skin mechanical properties, particularly break force, facilitated the discrimination of four vineyards in different provinces of Piedmont (northwest Italy) for Barbera grapes with the same soluble solids content. Grape berries belonging to different growing areas were also differentiated accord-ing to their seed texture characteristics (Torchio et al. 2010). These authors suggested that environmental factors play a dominant role in the characterization of the texture attributes of skins and seeds with respect to sugar accumulation. This observation agrees with the greater influence of vineyard lo-cation on mechanical parameters (Río Segade et al. 2011a) but is not in accordance with the dominating effect of har-vest date on the parcel effect (Le Moigne et al. 2008a). This disagreement could be justified by the better repeatability of the force parameters, which are advocated, than of the stress parameters used in the last work.
The differences in the instrumental texture parameters of grape berries grown in mountainous and hilly vineyards in Piedmont were assessed for Nebbiolo variety (Rolle et al. 2006). Grapes from the mountainous area were character-ized by a higher berry skin break force (+28.7%), skin break energy (+47.3%), and skin thickness (+20.4%) compared to grapes from the hilly area. Higher hardness (+61.2%), gumminess (+57.0%), springiness (+42.3%), and chewiness (+75.2%) of the whole berry were also found in mountainous Nebbiolo grapes.
The reaction of seven red winegrape varieties cultivated in Piedmont to the puncture and compression tests was sea-sonally dependent (Letaief et al. 2008a). In the two years
22 – Rolle et al.
Am. J. Enol. Vitic. 63:1 (2012)
studied, the same vineyards provided grape berries at harvest with different skin mechanical characteristics for each variety because of differences in climatic conditions. This is in ac-cordance with the only current study on the effect of climatic and bioclimatic indices on instrumental texture parameters (Rolle et al. 2011b). The influence of rainfall has also been reported on whole berry mechanical properties of Cabernet franc, providing firmer and more turgescent grapes (Maury et al. 2009) as well as less cohesive ones (Le Moigne et al. 2008a), and on the skin thickness of Mondeuse grapes during on-vine drying (Rolle et al. 2009a), causing a decrease in this puncture parameter.
Instrumental Texture Parameters and Phenol Extractability
The elaboration of high-quality red wines requires a suf-ficient accumulation of phenols in berry skins at harvest and an adequate tendency of the berry skin to yield anthocyanins during the winemaking process. Different chemical methods have been used to evaluate the extractability of phenolic com-pounds, but it is strongly influenced by extraction method. In this sense, the cellular maturity index or extractability index (Glories and Augustine 1993) seems to be sufficiently robust to estimate the extractability of anthocyanins and to predict them in the resulting wines (Romero-Cascales et al. 2005, Cagnasso et al. 2008, Kontoudakis et al. 2010). The two main disadvantages of chemical methods are the complexity and the long treatment time involved (Cagnasso et al. 2008), which fortunately have been minimized by instrumental tex-ture analysis. The success of puncture and compression tests to estimate anthocyanin extractability is due to the fact that the structural and chemical properties of the skin cell walls may determine the mechanical resistance, texture, and ease of processing berries (Barnavon et al. 2000, Ortega-Regules et al. 2006). The facility of releasing anthocyanins is strongly linked to the cell wall disassembly, cell separation, and cell rupture, which contribute to tissue deterioration and grape berry softening (Pinelo et al. 2006).
One recent report assessed the potential of the mechanical properties of berry skin to predict the anthocyanin extract-ability index in Galician winegrapes, at harvest, from the same vineyard (Río Segade et al. 2008). A good multiple linear re-gression was found between anthocyanin extractability index (EA) and berry skin break force (Fsk) and thickness (Spsk). The equation of the regression hyperplane was EA (%) = -42.16 + 110.12 × Fsk (N) + 0.08 × Spsk (µm). Moreover, multiple linear regression analysis also showed that the anthocyanin extract-ability index can be estimated, at harvest, from berry skin thickness and Young’s modulus (Esk). In Mencía winegrapes from seven different vineyards in a Galician DO, the equation proposed was EA (%) = 93.279 – 0.126 × Spsk (µm) – 47.765 × Esk (N∙mm-1) (Río Segade et al. 2011c). Similar behavior was observed for the anthocyanin extractability index and the instrumental texture parameters of berry skin, particularly hardness, stiffness, and thickness, in Barbera winegrapes with different soluble solids content and from four vineyards in Piedmont (Torchio et al. 2010). These last authors suggested
that anthocyanin extractability index and skin mechanical at-tributes are more influenced by growing area than by sugar concentration. Therefore, the skin puncture parameters could be considered the best mechanical properties to predict the anthocyanin extractability index defined by Glories.
Recently, some authors have focused on mechanical prop-erties such as phenol extractability markers, with berry skin break force considered an important instrumental texture pa-rameter to estimate anthocyanin extractability with adequate reliability, at least in Italian winegrape varieties like Brach-etto and Nebbiolo from several vineyards in Piedmont (Rolle et al. 2008, 2009b). Two groups of well-characterized grape berries for each variety were established according to lower and higher values than the medium value of skin break force (0.428 and 0.353 N for Brachetto and Nebbiolo, respectively). Higher skin break force determined an increase in antho-cyanin extraction when the two Italian winegrape varieties, containing the same sugar content (184, 230, or 250 g L-1), were analyzed (Rolle et al. 2008, 2009b). In Brachetto grapes, berry skin hardness also affected the individual anthocyanin composition in the extracts obtained at the end of macera-tion. In terms of concentration, the amount of the different anthocyanin compounds released was generally higher in the harder skins. Nevertheless, the authors suggested that acetyl and cinnamoyl glucosides are independent of this mechanical attribute (Rolle et al. 2009b), which is probably due to the low content in both anthocyanins. Furthermore, significant interactions between ripening stage and berry skin hardness were found in the individual anthocyanin composition of the extracts obtained after 48 hr maceration.
Other work confirmed the relationship between berry skin break force and anthocyanin extraction yield for Neb-biolo winegrapes from one Piedmont vineyard (Rolle et al. 2012b). Those containing 242 g L-1 sugar were classified in two groups according to berry skin hardness (soft, 0.258 ± 0.035 N; hard, 0.465 ± 0.050 N). Some significant differences were found in the anthocyanin profile of the extracts obtained from the soft and hard skins at different extraction times in the first phases of the anthocyanin diffusion. After 10 min, the higher percentages of petunidin-3-glucoside (+0.8%), cyanidin-3-glucoside (+3.6%), and peonidin-3-glucoside (+6.0%) derivatives and the lower percentages of malvidin-3-glucosides (-9.6%) corresponded to the hard skins. This aspect is particularly important for winegrape varieties rich in 3’-hydroxylated anthocyanins because these pigments are extracted preferentially during the initial phase of maceration and may be easily oxidized by the enzymes present in the juice (Di Stefano et al. 1994, González-Neves et al. 2008). Instead, the anthocyanin profile of the extracts obtained at each extraction time greater than 10 minutes agreed between the soft and hard skins.
For the puncture and double compression parameters in Cabernet franc winegrapes, harvested at different dates, from three Loire Valley vineyards, the best predictive model of the anthocyanin extraction yield (EY) was: EY (%) = 902.68 × Wsk (mJ) – 900.86 × Fsk (N) + 317.57 × Esk (N∙mm-1) + 91.39 × W1 (mJ) – 223.98 × W2 (mJ) + 103.74 × E1 (N mm-1) – 6.17
Grape Texture Analysis – 23
Am. J. Enol. Vitic. 63:1 (2012)
× Brix + 211.46 (Zouid et al. 2010). According to this equa-tion, anthocyanin extractability is mainly correlated with berry skin mechanical properties (Fsk, Wsk, Esk), with whole berry texture parameters (W1, W2, E1), and with the amount of soluble solids (Brix). Therefore, the skin puncture param-eters influence anthocyanin extraction and grape berries with higher Young’s modulus (springier and more elastic tissues) release more anthocyanin during the extraction in a model hydroalcoholic solution.
Regarding anthocyanin extraction yield, some work on Cabernet franc winegrapes containing six different sugar contents (177 to 259 g L-1) suggested that the whole berry compression parameters, particularly hardness, cohesive-ness, springiness, gumminess, and chewiness, are mean-ingful variables to predict the likelihood of berry skin to release anthocyanins (Zouid et al. 2011). Despite the lack of significant correlations between anthocyanin extractabil-ity, monitored berry for berry, and the respective skin me-chanical attributes (break force, break energy, and Young’s modulus) in Cabernet franc grapes from one Loire Valley vineyard (Zouid et al. 2011), a mathematical relationship between skin instrumental texture properties and antho-cyanin extractability was found for three different sugar contents (176, 193, and 210 g L-1) in Mencía winegrapes cultivated in several Galician vineyards (northwest Spain) (Río Segade et al. 2011a). Anthocyanin extraction yield was better correlated with skin thickness than with skin hardness when the thickness was separately determined in each berry skin. This consideration agreed with the low correlation fac-tors found for skin break force, break energy, and Young’s modulus in Cabernet franc grapes. Therefore, skin thick-ness appears to be a useful tool for predicting anthocyanin extractability in Mencía grapes through the equation EY (%) = 102.433 – 0.0574 × Spsk (µm). Thinner skins seem to be characterized by a greater release of red pigments. Other studies confirmed that berry skin thickness could influence anthocyanin extractability (Ortega-Regules et al. 2006). In Nebbiolo grapes, GFLV and GFkV and GLRaV-3 and GVA mixed infection induced a change in the mechanical prop-erties of berry skin, most evident in the skin thickening, which decreases phenol extractability in the berries from the infected vines (Santini et al. 2011).
The relationships between mechanical parameters and anthocyanin extraction yield from the berry skin change de-pending on winegrape variety. To confirm these initial ap-proaches, further studies with more ripening stages, vine-yards, and vintages would be necessary. This information should lead to the identification of the key factors for texture modifications facilitating the prediction of anthocyanin ex-tractability during ripening.
A recent study with Nebbiolo grapes evaluated the punc-ture parameters as potential estimators of the facility of berry skins to yield anthocyanins, flavonoids, proanthocyanidins, and flavanols reactive to vanillin, irrespective of the effect of harvest date and/or berry density (Rolle et al. 2011d). Harder grapes provided the higher extractability of flavanols reactive to vanillin, whereas thicker grapes facilitated the extraction
of proanthocyanidins. This first approach demands further research on histological and histochemical changes in berry skins during grape development.
Instrumental Texture Parameters and Grape Sensory Descriptors
Texture is a sensory property in which perception pre-dominantly occurs in the mouth. It is affected by temperature and diluted with chewing and saliva (Szczesniak 2002). Sen-sory attributes such as grittiness, chewiness, stickiness and moistness are used to describe the sensory characteristics of raisins (Angulo et al. 2007). Sensory descriptors such as skin friability, skin thickness, and flesh firmness have been proposed instead to characterize commercial table-grape cultivars (Cliff et al. 1996). The eating texture of Autumn Seedless (Artès-Hernandez et al. 2004), crispness of Crimson Seedless (Jayasena and Cameron 2009), or crunchiness and firmness of Autumn Royal (Valero et al. 2006) are sensory descriptors used to evaluate table-grape quality in different postharvest conditions. On the other hand, with the same aim, berry firmness as an instrumental parameter was measured using different mechanical properties, such as the ratio be-tween the force that achieved 1% deformation of the berry and the berry diameter (N∙mm-1 × 100) (Martínez-Romero et al. 2003) or the modulus of elasticity, expressed in N∙mm-1, after applying a force of 3 N (Mencarelli et al. 1994). In other studies, as already reported, the berry texture of table grapes was measured by a single compression (Vargas et al. 2001) or TPA (Deng et al. 2005). In general, scientific papers re-port separately either sensory characteristics or instrumental properties. No specific work on the relationship among the instrumental and sensory parameters used to define the tex-ture properties of table grapes has been published.
Several studies tried to correlate the terminology used for Vitis vinifera and Vitis labruscana descriptions in older ampelographic texts (slightly fleshy, fleshy, firm, very firm, melting, crisp, tender, meaty) with the instrumental param-eters acquired during a puncture test of the pulp (Sato and Yamada 2003, Sato et al. 1997). There were high correlation coefficients (R > 0.84) between the rating of the breakdown difficulty during mastication in the sensory tests and the deformation at the first major peak (DFP) and between the rating of the flesh firmness in the sensory tests and the in-strumental value of the maximum force (MF).
Sensory analysis of winegrapes is used by many wine professionals and seems to be a good tool for decision sup-port on degree of maturity and harvest date. It allows an overall characterization of the product in terms of texture, taste, odor, and flavor. Several studies have been conducted on the sensory analysis of grape berries, including texture descriptors (Rousseau 2001, Lespinasse et al. 2002, Martinez 2002, Guyot and Dupraz 2004, Winter et al. 2004, Lohitnavy et al. 2010). The sensory method developed by the Institut Coopératif du Vin (ICV, France) for growers and winemak-ers is based on a segmentation analysis of the three main compartments of the berry: pulp, skin, and seeds. Each de-scriptor is quantified according to a structured rating scale
24 – Rolle et al.
Am. J. Enol. Vitic. 63:1 (2012)
(from 1 to 4). Sensory analysis covers three batches of ber-ries simultaneously tasted by segmenting the analysis: visual and tactile examination of the berries, analysis of the pulp and skin, and visual examination and analysis of the seeds (Rousseau and Delteil 2000).
A recent approach combined sensory and instrumental texture measurements (double compression test) to follow the maturity of grapes in three Cabernet franc parcels (Le Moigne et al. 2008a). The same grape samples were submit-ted to both sensory and instrumental methods to evaluate the effects of ripening and parcel type. Sensory evaluation of the grapes was performed by a 12-member panel (Le Moigne et al. 2008b). Training sessions allowed members to develop a final vocabulary based on 30 descriptors, related to texture evaluated by touch, texture evaluated in the mouth, odor, aroma, and taste according to a complete characterization of the berry, skin, and seeds. These descriptors were classified into four maturity types, including 12 attributes for textural maturity (skin fading, elasticity, touch resistance, force to detach the pedicel, berry crunchiness, berry firmness, pulp juiciness, pulp gelatin, skin thickness, skin dilaceration, seed hardness, and seed cracking). The sensory descriptors con-nected to texture were highly correlated with the compres-sion parameters (Le Moigne et al. 2008a). In particular, the pressure in Pa associated with the first compression (P1), the pressure in Pa associated with the second compression (P2), the slope of the second compression (Grad2), and the work in J.m-2 associated with the first compression (A1) were cor-related with elasticity, touch resistance, facility to detach the pedicel, berry firmness, and pulp juiciness. No significant correlations were observed with the slope of the first com-pression (Grad1). The best correlation coefficients for touch resistance and firmness (attributes measuring the sensory firmness of grapes) were obtained with A1 (R = 0.83 and R = 0.82, respectively) and with Grad2 (R = 0.77 and R = 0.81, respectively). The dilaceration descriptor was correlated with the work in J.m-2 associated with the second compres-sion WP2 (R = 0.65). Some descriptors were directly linked with the compression parameters (touch resistance, elasticity, and firmness). For some other descriptors, the relationships could be consequences of internal links (facility to detach the pedicel, dilacerations, or juiciness).
Instrumental Texture Parameters and Grape Dehydration
The grape drying method (off-vine and on-vine drying) and the different chemical pretreatments often used to in-crease dehydration rate influence the appearance attributes and sensory characteristics of dried grapes (Vasquez et al. 1997, Angulo et al. 2007, Esmaiili et al. 2007). Thermally processed biomaterials suffer a texture degradation closely related to enzymatic and nonenzymatic changes in cell wall pectin (Chong et al. 2008). Therefore, drying conditions play an active role in determining the texture properties of dried grapes (Ramos et al. 2004). Air-drying leads to major chang-es in the fruit structure and texture, such as softening or loss of firmness (Bolin and Huxsoll 1987).
Grape withering on the plant involves numerous physi-cal, histological, and biochemical modifications that remain unclear. Berry skin plays a key role in the on-vine drying process, regulating the gas exchange between the berry and the surrounding environment, serving as a protective bar-rier against fungal disease and protecting the grape from UV light and physical injury. The number of layers of small thick-walled cells in the skin of grape berries, their size, and volume are cultivar-specific issues. These different tissue characteristics can explain the differences in the dehydra-tion kinetics among grape varieties (Bellincontro et al. 2004, Esmaiili et al. 2007, Barbanti et al. 2008).
Although very few studies have been performed on the modification of the mechanical characteristics during the grape drying process, the berry skin texture parameters have been already considered efficient indicators of the winegrape suitability for on-vine drying. Despite the high variability of the skin’s mechanical properties, because different berries often show a heterogeneous dehydration, berry skin hardness, assessed by break force and energy, increased progressive-ly during on-vine drying of Mondeuse, Becuét, and Fumin grapes used for icewine production in Piedmont (Rolle et al. 2009a, 2010). However, this phenomenon was more evident for berry skin break energy, particularly in Mondeuse and Becuét grapes. Moreover, a simultaneous decrease in the skin Young’s modulus of elasticity was observed in these overripe grapes. Therefore, the berry skin tends to harden but also to increase its springiness during on-vine drying. A significant increase in berry skin thickness was also found during the on-vine drying of Mondeuse, Becuét, and Fumin grapes. A decreasing trend in berry seed hardness, particularly break force and energy, and in the seed Young’s modulus of elastic-ity was reported during on-vine drying of Mondeuse grapes (Rolle et al. 2009a).
A high resistance to shattering is another important grape characteristic for the success of on-vine drying. Therefore, pedicel detachment force is an effective parameter that should be monitored. It showed a progressive decrease during grape dehydration on the plant for Mondeuse, Becuét, and Fumin varieties (Rolle et al. 2009a, 2010), with a greater propensity to fall with Becuét grapes. Grape berries with insufficient resistance to detachment, at technological maturity, should be excluded from use in icewine production because they must support considerable amounts of snowfall.
The influence of the initial skin hardness on the evolution of berry weight due to dehydration observed during the off-vine drying process under controlled conditions was also investi-gated (Rolle et al. 2011a). These authors confirmed the effect of skin break force of fresh berries, at two different harvest dates, on off-vine dehydration kinetics of Moscato bianco and Erbaluce grapes; two white grape varieties used in Italy for dessert wine production. For each variety, four grape groups were established according to sugar content and berry skin break force. Under the same postharvest storage conditions, the dehydration kinetics was influenced by the grape variety because the varieties characterized by lower berry skin break force values showed a quicker weight loss. On the other hand,
Grape Texture Analysis – 25
Am. J. Enol. Vitic. 63:1 (2012)
no significant differences were found in the berry weight loss-es determined during the grape drying process, among differ-ent skin hardness, for the lower sugar content in both Moscato bianco and Erbaluce cultivars, whereas the soft berry skins corresponding to the higher sugar content were characterized by a significantly higher dehydration. A correlation between skin break force of fresh berries and weight loss determined for different drying days was reported for the ripest grapes in the two varieties studied, possibly because the dehydration rate significantly decreased with increasing berry skin hardness. For each variety, it also involved significantly higher sugar content in dried grapes from the riper fresh berries with soft skins. Therefore, berry skin break force might be an interest-ing instrumental texture parameter to optimize drying condi-tions and to obtain dried grapes with desirable characteristics.
Potentialities and Limits with Instrumental Texture Parameters
The successful application of texture analysis in monitor-ing industrial processes is attributable to its reproducibility, rapidity, and low cost, which are generally requested in the food industry. After the operative conditions of the test, the variable to be measured, and the relative range of acceptabil-ity in the values for each product are defined, the instrumental texture property can be acquired with sufficient facility by UMTs. As a result of the survey of noncompliance of the parameter, the process can be consequently stopped.
The wine industry requires the implementation of simple, reliable, rapid, and cost-effective analytical procedures to determine grape compositional parameters and, in particular for polyphenols, extractability predictive indexes that can be related to potential wine quality. However, on the basis of the scientific literature, there are some limits to the use of these instrumental texture parameters as routine grape quality markers. Variety, vintage, and production zone effects do not permit the establishment of unique target values of reference for all the texture variables, in particular for winegrape skin hardness. Consequently, data interpretation can be difficult for winemakers when the absolute values of texture variables are considered out of the appropriate context. Moreover, the high variability of the mechanical data among different vines, clus-ters, and berries does not consistently show a clear evolution of each variable during grape ripening. Despite these evident limits, as well as the absence of specific correlation studies among instrumental texture parameters and grape quantitative chemical composition, mechanical indices can be used in the winery to compare the performance of different vineyards. Given the potentialities of instrumental texture parameters in the assessment of anthocyanin/tannin extractability and grape dehydration, it is possible to select different parcels in light of this information.
Conversely, the absolute values of other mechanical param-eters, such as skin thickness or pedicel detachment resistance, can be directly used to classify winegrape and table-grape varieties, relative clones, and intraspecific crosses or to assess the suitability of grape variety for withering, respectively. In this sense, every study is useful to expand the data.
The best potentialities, still underutilized, of instrumen-tal texture analysis parameters are in the evaluation of the texture characteristics of table-grape pulp and skin. Many mechanical parameters acquired by TPA are related to the sensory perception of consumers. In the table-grape sector, this aspect is of fundamental importance. In these types of studies, the absolute values of the instrumental variable can be directly interpreted by technical operators and used to determine harvest date or to manage postharvest processes.
However, bibliographic data are not necessarily comparable because of different operative conditions. Building an inter-national databank of varietal texture properties requires that different research groups apply a unique operative protocol, which should be defined. It then might be possible to consider the instrumental texture properties as new ampelographic pa-rameters and to request their admission into the “Descriptor list for grape varieties and Vitis species” (OIV 2009).
Further Research NeedsBased on this review, it appears essential to address several
areas of further research. The first is the effect of histological and histochemical changes occurring in berry tissues during the ripening and dehydration processes on the mechanical properties of grapes. The main goal should be to establish a mathematical model that explains the relation between tissue histological and mechanical characteristics and to propose a simple, reliable, and rapid determination of the index of grape maturity. In the field of varietal characterization, the use of instrumental texture parameters as varietal markers requires performing more complete studies on the mechanical prop-erties of a higher number of grape varieties from different production areas and harvested in several years.
Further studies are also needed on the impact of environ-mental factors like soil characteristics, climatic, and biocli-matic indices or vineyard culture practices on grape mechani-cal features. Particularly in winegrapes, it would provide a better understanding of the possible expression of the climate change on berry attributes for the production of high-quality wines. Finally, in seed studies, important progress is needed on mechanical and acoustic characteristics (Duizer 2001) and to correlate their changes with grape development and seed phenol extractability. Such information would undoubtedly constitute a great advance in winemaking technology and be a valuable tool for winemakers.
Literature CitedAbbal, P., J.C. Boulet, and M. Moutounet. 1992. Utilisation de parame-
tres physiques pour la caratérisation de la véraison des baies de raisin. J. Int. Sci. Vigne Vin 26:231-237.
Abbott, J.A. 1999. Quality measurement of fruits and vegetables. Postharvest Biol. Technol. 15:207-225.
Ahumada, M.H., E.J. Mitcham, and D.G. Moore. 1996. Postharvest quality of ‘Thompson seedless’ grapes after insecticidal controlled-atmosphere treatments. HortScience 31:833-836.
Angulo, O., M.W. Fidelibus, and H. Heymann. 2007. Grape cultivar and drying method affect sensory characteristics and consumer preferences of raisins. J. Sci. Food Agric. 87:865-870.
Artès-Hernandez, F., E. Aguayo, and F. Artès. 2004. Alternative atmosphere treatments for keeping quality of ‘Autumn seedless’
26 – Rolle et al.
Am. J. Enol. Vitic. 63:1 (2012)
table grapes during long-term cold storage. Postharvest Biol. Tech-nol. 31:59-67.
Baiano, A., E. La Notte, A. Coletta, C. Terracone, and D. Antonacci. 2011. Effects of irrigation volume and nitrogen fertilization on Redglobe and Michele Palieri table-grape cultivars. Am. J. Enol. Vitic. 62:57-65.
Barbanti, D., B. Mora, R. Ferrarini, G.B. Tornielli, and M. Cipriani. 2008. Effect of various thermo-hygrometric conditions on the with-ering kinetics of grapes used for the production of ‘‘Amarone’’ and ‘‘Recioto’’ wines. J. Food Eng. 85:350-358.
Barnavon, L., T. Doco, N. Terrier, A. Ageorges, C. Romieu, and P. Pellerin. 2000. Analysis of cell wall neutral sugar composition, β-galactosidase activity and a related cDNA clone throughout the development of Vitis vinifera grape berries. Plant Phys. Biochem. 38:289-300.
Bares, J., K. Lejckova, K. Patocka, and J. Blahovec. 1994. Role of skin in compression of berry-like fruits between two plates. Int. Agrophysics 8:381-387.
Bellincontro, A., D. De Santis, R. Botondi, I. Villa, and F. Mencarelli. 2004. Different postharvest dehydration rates affect quality charac-teristics and volatile compounds of Malvasia, Trebbiano and Sangio-vese grapes for wine production. J. Sci. Food Agric. 84:1791-1800.
Bellincontro, A., I. Nicoletti, M. Valentini, A. Tomas, D. De Santis, D. Corradini, and F. Mencarelli. 2009. Integration of nondestruc-tive techniques with destructive analyses to study postharvest water stress of winegrapes. Am. J. Enol. Vitic. 60:57-65.
Bernstein, Z., and I. Lustig. 1981. A new method of firmness measure-ment of grape berries and other juicy fruits. Vitis 20:15-21.
Bisson, L. 2001. In search of optimal grape maturity. Pract. Winery Vineyard Jul/Aug:32-43.
Blahovec, J. 1994. Elastic and strength properties of round agricultural products. Int. Agrophysics 8:543-546.
Bolin, H.R., and C.C. Huxsoll. 1987. Scanning electron microscope/image analyzer determination of dimensional postharvest changes in fruit cells. J. Food Sci. 6:1649-1650.
Bourne, M.C. 2002. Food Texture and Viscosity: Concept and Mea-surement. 2d ed. Academic Press, New York.
Breene, W.M. 1975. Application of texture profile analysis to instru-mental food texture evaluation. J. Texture Stud. 6:53-82.
Cagnasso, E., L. Rolle, A. Caudana, and V. Gerbi. 2008. Relationship between grape phenolic maturity and red wine phenolic composition. Ital. J. Food Sci. 20:365-381.
Carbonneau, A., A. Moueix, N. Leclair, and J.L. Renoux. 1991. Propo-sition d’une méthode de prélèvement de raisins à partir de l’analyse de l’hétéréogénéité de maturation sur un cep. Bull. OIV 64:679-690.
Cefola, M., B. Pace, D. Buttaro, P. Santamaria, and F. Serio. 2011. Postharvest evaluation of soilless-grown table grape during storage in modified atmosphere. J. Sci. Food Agric. 91:2153-2159.
Chong, C.H., C.L. Law, M. Cloke, L.C. Abdullah, and W.R.W. Daud. 2008. Drying kinetics, texture, color, and determination of effec-tive diffusivities during sun drying of Chempedak. Dry. Technol. 26:1286-1293.
Cliff, M.A., M.C. Dever, and A.G. Reynolds. 1996. Descriptive profil-ing of new and commercial British Columbia table grape cultivars. Am. J. Enol. Vitic. 47:301-308.
De Baerdemaeker, J., L.J. Sederlind, H. Murase, and G.E. Merva. 1978. Water potential effect on tensile and compressive failure stresses of apple and potato tissue. ASAE paper No. 78-3057. ASAE, St. Joseph, MI.
De Belie, N., K. Tu, P. Jancsok, and J. De Baerdemaeker. 1999. Prelimi-nary study on the inf luence of turgor pressure on body ref lectance of red laser light as a ripeness indicator for apples. Postharvest Biol. Technol. 16:279-284.
Dell, R.B., S. Holleran, and R. Ramakrishnan. 2002. Sample size determination. ILAR J. 43:207-213.
Deng, Y., Y. Wu, and Y. Li. 2005. Effects of high O2 levels on post-harvest quality and shelf life of table grapes during long-term storage. Eur. Food Res. Technol. 221:392-397.
Di Stefano, R., D. Borsa, and N. Gentilini. 1994. Estrazione degli antociani dalle bucce dell’uva durante la fermentazione. Enotecnico 30:76-83.
Downey, M.O., N.K. Dokoozlian, and M.P. Krstic. 2006. Cultural prac-tice and environmental impacts on the flavonoid composition of grapes and wine: A review of recent research. Am. J. Enol. Vitic. 57:257-268.
Duchene, E., and C. Schneider. 2005. Grapevine and climatic changes: A glance at the situation in Alsace. Agron. Sust. Devel. 25:93-99.
Duizer, L. 2001. A review of acoustic research for studying the sensory perception of crisp, crunchy and crackly textures. Trends Food Sci. Technol. 12:17-24.
Esmaiili, M., R. Sotudeh-Gharebagh, K. Cronin, M.A.E. Mousavi, and G. Rezazadeh. 2007. Grape drying: A review. Food Rev. Int. 23:257-280.
Fournand, D., A. Vicens, L. Sidhoum, J.M. Souquet, M. Moutounet, and V. Cheynier. 2006. Accumulation and extractability of grape skin tannins and anthocyanins at different advanced physiological stages. J. Agric. Food Chem. 54:7331-7338.
Giribaldi, M., M. Purrotti, D. Pacifico, D. Santini, F. Mannini, P. Caciagli, L. Rolle, L. Cavallarin, M.G. Giuffrida, and C. Marzachì. 2011. A multidisciplinary study on the effects of phloem-limited viruses on the agronomical performance and berry quality of Vitis vinifera cv. Nebbiolo. J. Proteomics 75:306-315.
Glories, Y., and M. Augustine. 1993. Maturité phénolique du raisin, consèquences technologiques: Applications aux millésimes 1991 et 1992. In Actes du Colloque Journée Technique du CIVB, pp. 56-61. CIVB, Bordeaux.
González-Neves, G., G. Gil, and L. Barreiro. 2008. Influence of grape variety on the extraction of anthocyanins during the fermentation on skins. Eur. Food Res. Technol. 226:1349-1355.
Goulao, L.F., and C.M. Oliveira. 2008. Cell wall modifications dur-ing fruit ripening: When a fruit is not the fruit. Trends Food Sci. Technol. 19:4-25.
Grotte, M., Y. Cadot, A. Poussier, D. Loonis, E. Pietri, F. Duprat, and G. Barbeau. 2001. Determination of the maturity status of grape berry (Vitis vinifera) from physical measurement: Methodology. J. Int. Sci. Vigne Vin 35:87-98.
Guyot, C., and P. Dupraz. 2004. Déguster les baies pour suivre la maturité des raisins. Rev. Suisse Vitic. Arboric. Hortic. 36:231-234.
Hall, A., and G.V. Jones. 2009. Effect of potential atmospheric warm-ing on temperature-based indices describing Australian winegrape growing conditions. Aust. J. Grape Wine Res. 15:97-119.
IOS (International Organization for Standardization). 2009. Sensory Analysis–Vocabulary. ISO 5492:2009.
Jackson, D.I., and P.B. Lombard. 1993. Environmental and manage-ment practices affecting grape composition and wine quality – A review. Am. J. Enol. Vitic. 44:409-430.
Jang, S., and S.K. Lee. 2009. Current research status of postharvest technology of grape. Korean J. Hortic. Sci. Technol. 27:426-431.
Jayasena, V., and I. Cameron. 2009. The effect of ethephon and clone on physical characteristics and sensory quality of Crimson Seedless table grape after 1 month storage. Int. J. Food Sci. Technol. 44:409-414.
Jones, G.V., and R.E. Davis. 2000. Climate inf luences on grapevine phenology, grape composition, and wine production and quality for Bordeaux, France. Am. J. Enol. Vitic. 51:249-261.
Grape Texture Analysis – 27
Am. J. Enol. Vitic. 63:1 (2012)
Karathanos, V.T., A.E. Kostaropoulos, and G.D. Saravacos. 1994. Viscoelastic properties of raisins. J. Food Eng. 23:481-490.
Keller, M., R.P. Smithyman, and L.J. Mills. 2008. Interactive effects of deficit irrigation and crop load on Cabernet Sauvignon in an arid climate. Am. J. Enol. Vitic. 59:221-234.
Kök, D., and S. Çelik. 2004. Determination of characteristics of grape berry skin in some table grape cultivars (V. vinifera L.). J. Agron. 3:141-146.
Kontoudakis, N., M. Esteruelas, F. Fort, J.M. Canals, and F. Zamora. 2010. Comparison of methods for estimating phenolic maturity in grapes: Correlations between predicted and obtained parameters. Anal. Chim. Acta 660:127-133.
Kostaropoulos, A.E., and I.G. Mandala. 1997. Rheological properties of beds of raisins. J. Texture Stud. 28:305-317.
Lang, A., and H. During. 1990. Grape berry splitting and some me-chanical properties of the skin. Vitis 29:61-70.
Laszlo J.C., and D. Saayman. 1991. Optimum harvesting stages for Dan-ben-Hannah, La Rochelle and Bonheur table grape cultivar. Deciduous Fruit Grower 41:257-263.
Lee, C.Y., and M. Bourne. 1980. Changes in grape firmness during maturation. J. Texture Stud. 11:163-171.
Le Moigne, M., C. Maury, D. Bertrand, and F. Jourjon. 2008a. Sensory and instrumental characterisation of Cabernet Franc grapes according to ripening stages and growing location. Food Qual. Pref. 19:220-231.
Le Moigne, M., R. Symoneaux, and F. Jourjon. 2008b. How to follow grape maturity for wine professionals with a seasonal judge training? Food Qual. Pref. 19:672-681.
Lespinasse, N., D. Scandella, P. Vaysse, and B. Navez. 2002. Mémento évaluation sensorielle des fruits et légumes frais. CTIFL, Paris.
Lohitnavy, N., S. Bastian, and C. Collins. 2010. Berry sensory at-tr ibutes correlate with compositional changes under different viticultural management of Semillon (Vitis vinifera L.). Food Qual. Pref. 21:711-719.
Letaief, H. 2007. Application of chemical-physical and mechanical tests for the definition of wine grape quality. Thesis, University of Turin, Italy.
Letaief, H., L. Rolle, and V. Gerbi. 2008a. Mechanical behavior of winegrapes under compression tests. Am. J. Enol. Vitic. 59:323-329.
Letaief, H., L. Rolle, G. Zeppa, and V. Gerbi. 2008b. Assessment of grape skin hardness by a puncture test. J. Sci. Food Agric. 88:1567-1575.
Martinez, L. 2002. La dégustation des baies de raisin. Rev. Oenol. 105:19-21.
Martínez-Romero, D., F. Guillén, S. Castillo, D. Valero, and M. Ser-rano. 2003. Modified atmosphere packaging maintains quality of table grapes. J. Food Sci. 68:1838-1843.
Matthews, M.A., T.R. Thomas, and K.A. Shackel. 2009. Fruit ripening in Vitis vinifera L.: Possible relation of veraison to turgor and berry softening. Aust. J. Grape Wine Res. 15:278-283.
Maury, C., E. Madieta, M. Le Moigne, E. Mehinagic, R. Siret, and F. Jourjon. 2009. Development of a mechanical texture test to evalu-ate the ripening process of Cabernet Franc grapes. J. Texture Stud. 40:511-535.
Mencarelli, F., R. Massantini, L. Lanzarotta, and R. Botondi. 1994. Accurate detection of firmness and colour changes in the packing of table grapes with paper dividers. J. Hort. Sci. 69:299-304.
Miguel, A.C.A., J.R.P. Dias, S. Albertini, and M.H.F. Spoto. 2009. Pós-colhita de uva “Itália” revestida com filmes à base de alginato de sódio e armazenada sob refrigeração. Ciènc. Tecnol. Aliment. Campinas 29:277-282.
OIV. 2009. OIV Descriptor List for Grape Varieties and Vitis Species. 2d ed. Organisation Internationale de la Vigne et du Vin, Paris.
Ortega-Regules, A., I. Romero-Cascales, J.M. Ros-García, J.M. López-Roca, and E. Gómez-Plaza. 2006. A first approach towards the relationship between grape skin cell-wall composition and an-thocyanin extractability. Anal. Chim. Acta 563:26-32.
Peppi, M.C., M.W. Fidelibus, and N. Dokoozlian. 2006. Abscisic acid application timing and concentration affect firmness, pigmentation, and color of ‘Flame Seedless’ grapes. HortScience 41:1440-1445.
Pereira, G.E., J.P. Gaudillere, C. van Leeuwen, G. Hilbert, M. Maucourt, C. Deborde, A. Moing, and D. Rolin. 2006. 1H NMR metabolite fin-gerprints of grape berry: Comparison of vintage and soil effects in Bordeaux grapevine growing areas. Anal. Chim. Acta 563:346-352.
Pinelo, M., A. Arnous, and A.S. Meyer. 2006. Upgrading of grape skins: Significance of plant cell-wall structural components and extraction techniques for phenol release. Trends Food Sci. Technol. 17:579-590.
Porro, D., M. Ramponi, T. Tomasi, L. Rolle, and S. Poni. 2010. Nutri-tional implications of water stress in grapevine and modifications of mechanical properties of berries. Acta Hort. 868:73-80.
Ramos, I.N., C.L.M. Silva, A.M. Sereno, and J.M. Aguilera. 2004. Quantification of microstructural changes during first stage air drying of grape tissue. J. Food Eng. 62:159-164.
Ribéreau-Gayon, P., Y. Glories, A. Maujean, and D. Dubourdieu. 2003. Compuestos fenólicos en Tratado de Enología. In Química del vino. Estabilización y tratamientos. Vol. 2. Ed. Hemisferio Sur, Buenos Aires.
Río Segade, S., S. Giacosa, V. Gerbi, and L. Rolle. 2011a. Berry skin thickness as main texture parameter to predict anthocyanin extract-ability in winegrapes. LWT–Food Sci. Technol. 44:392-398.
Río Segade, S., I. Orriols, S. Giacosa, and L. Rolle. 2011b. Instrumen-tal texture analysis parameters as winegrapes varietal markers and ripeness predictors. Int. J. Food Prop. 14:1318-1329.
Río Segade, S., L. Rolle, V. Gerbi, and I. Orriols. 2008. Phenolic ripe-ness assessment of grape skin by texture analysis. J. Food Comp. Anal. 21:644-649.
Río Segade, S., E. Soto Vázquez, I. Orriols, S. Giacosa, and L. Rolle. 2011c. Possible use of texture characteristics of winegrapes as mark-ers for zoning and their relationship with anthocyanin extractability index. Int. J. Food Sci. Technol. 46:386-394.
Robin, J.P., P. Abbal, and J.M. Salmon. 1997. Fermeté et maturation du raisin. Définition et évolution de différents paramètres rhéologiques au cours de la maturation. J. Int. Sci. Vigne Vin 31:127-138.
Rolle, L., A. Caudana, S. Giacosa, V. Gerbi, and S. Río Segade. 2011a. Inf luence of skin hardness on dehydration kinetics of wine grapes. J. Sci. Food Agric. 91:505-511.
Rolle, L., V. Gerbi, A. Schneider, F. Spanna, and S. Río Segade. 2011b. Varietal relationship between instrumental skin hardness and climate for grapevines (Vitis vinifera L.). J. Agric. Food. Chem. 59:10624-10634.
Rolle, L., S. Giacosa, V. Gerbi, M. Bertolino, and V. Novello. 2012a. Varietal comparison among the chemical, physical and mechanical properties of five colored table grape cultivars. Int. J. Food Prop. doi: 10.1080/10942912.2011.558231.
Rolle, L., S. Giacosa, V. Gerbi, and V. Novello. 2011c. Comparative study of texture properties, color characteristics, and chemical composition of ten white table-grape varieties. Am. J. Enol. Vitic. 62:49-56.
Rolle, L., H. Letaief, E. Cagnasso, D. Ghirardello, G. Zeppa, and V. Gerbi. 2006. Studio delle proprietà meccaniche di uve Nebbiolo coltivate in ambienti diversi. Quad. Sci. Vitic. Enol. 28:185-194.
Rolle, L., S. Río Segade, F. Torchio, S. Giacosa, E. Cagnasso, F. Marengo, and V. Gerbi. 2011d. Inf luence of grape density and har-vest date on changes in phenolic composition, phenol extractability
28 – Rolle et al.
Am. J. Enol. Vitic. 63:1 (2012)
indices, and instrumental texture properties during ripening. J. Agric. Food. Chem. 59:8796-8805.
Rolle, L., F. Torchio, E. Cagnasso, and V. Gerbi. 2010. Evolution of mechanical variables of winegrapes for icewine production during on-vine drying. Ital. J. Food Sci. 22:143-149.
Rolle, L., F. Torchio, A. Ferrandino, and S. Guidoni. 2012b. Influence of wine-grape skin hardness on the kinetics of anthocyanin extrac-tion. Int. J. Food Prop. doi: 10.1080/10942911003778022.
Rolle, L., F. Torchio, S. Giacosa, and V. Gerbi. 2009a. Modification of mechanical characteristics and phenolic composition in berry skins and seeds of Mondeuse winegrapes throughout the on-vine drying process. J. Sci. Food Agric. 89:1973-1980.
Rolle, L., F. Torchio, G. Zeppa, and V. Gerbi. 2008. Anthocyanin extractability assessment of grape skins by texture analysis. J. Int. Sci. Vigne Vin 42:157-162.
Rolle, L., F. Torchio, G. Zeppa, and V. Gerbi. 2009b. Relationship between skin break force and anthocyanin extractability at different ripening stages. Am. J. Enol. Vitic. 60:93-97.
Romero-Cascales, I., A. Ortega-Regules, J.M. López-Roca, J.I. Fernández-Fernández, and E. Gómez-Plaza. 2005. Differences in anthocyanin extractability from grapes to wines according to variety. Am. J. Enol. Vitic. 56:212-219.
Rosenquist, J.K., and J.C. Morrison. 1988. The development of the cuticle and epicuticular wax of the grape berry. Vitis 27:63-70.
Roudot, A.C. 2006. Some considerations for a theory of plant tissue mechanics. Sci. Aliments 26:409-426.
Rousseau, J. 2001. Suivi de la maturité des raisins par analyse sen-sorielle descriptive quantifiée des baies. Relation avec les profils sensoriels des vins et les attentes des consommateurs. Bull. OIV 849-850:719-728.
Rousseau, J., and D. Delteil. 2000. Présentation d’une method d’analyse sensorielle des raisins. Principe, method et grille d’interprétation. Rev. Fr. Oenol. 183:10-13.
Sacchi, K.L., L.F. Bisson, and D.O. Adams. 2005. A review of the ef-fect of winemaking techniques on phenolic extraction in red wines. Am. J. Enol. Vitic. 56:197-206.
Santini, D., L. Rolle, P. Cascio, and F. Mannini. 2011. Modifications in chemical, physical and mechanical properties of Nebbiolo (Vitis vinifera L.) grape berries induced by mixed virus infection. S. Afr. J. Enol. Vitic. 32:183-189.
Sato, A., and M. Yamada. 2003. Berry texture of table, wine, and dual-purpose grape cultivars quantified. HortScience 38:578-581.
Sato, A., M. Yamada, I. Hiroshi, and N. Hirakawa. 2000. Optimal spatial and temporal measurement repetition for reducing environ-mental variation of berry traits in grape breeding. Sci. Hort. 85:75-83.
Sato, A., M. Yamada, H. Iwanami, and N. Mitani. 2004. Quantitative and instrumental measurements of grape f lesh texture as affected by gibberellic acid application. J. Japan. Soc. Hort. Sci. 73:7-11.
Sato, A., M. Yamada, and I. Iwanami. 2006. Estimation of the proposi-tion of offspring having genetically crispy f lesh in grape breeding. J. Am. Soc. Hort. Sci. 131:46-52.
Sato, A., H. Yamane, N. Hirakawa, K. Otobe, and M. Yamada. 1997. Varietals differences in the texture of grape berries measured by penetration tests. Vitis 36:7-10.
Sims, C.A., and M.C. Halbrooks. 1986. Quality comparison of “Or-lando Seedless” with “Thompson Seedless” grapes. Proc. Florida State Hortic. Soc. 99:193-194.
Snedecor, G.W., and W.G. Cochran. 1989. Statistical Methods. 8th ed., pp. 38-82. Iowa State University Press, Ames.
Szczesniak, A.S. 2002. Texture is a sensory property. Food Qual. Pref. 13:215-225.
Thomas, T., M.A. Matthews, and K.A. Shackel. 2006. Direct in-situ measurement of cell turgor in grape (Vitis vinifera L.) berries dur-ing development and in response to plant water deficit. Plant Cell Environ. 29:993-1001.
Torchio, F., E. Cagnasso, V. Gerbi, and L. Rolle. 2010. Mechanical properties, phenolic composition and extractability indices of Bar-bera grapes of different soluble solids contents from several growing areas. Anal. Chim. Acta 660:183-189.
Tunick, M.H. 2011. Food texture analysis in the 21st century. J. Agric. Food Chem. 59:1477-1480.
Uys, D.C. 1996. Firmness meter for grape berries: How firm are our table grapes really? Decid. Fruit Grower 46:379-383.
van Leeuwen, C., P. Friant, X. Choné, O. Tregoat, S. Koundouras, and D. Dubourdieu. 2004. Inf luence of climate, soil, and cultivar on terroir. Am. J. Enol. Vitic. 55:207-217.
Valero, D., J.M. Valverde, D. Martinez-Romero, F. Guillen, S. Castillo, and M. Serrano. 2006. The combination of modified atmosphere packaging with eugenol or thymol to maintain quality, safety and functional properties of table grapes. Postharvest Biol. Technol. 41:317-327.
Vargas, A., J. Pérez, J.P. Zoffoli, and A. Pérez. 2001. Comparación de variables de textura en la medición de firmeza de bayas de uva Thompson Seedless. Cien. Inv. Agr. 28:37-42.
Vasquez, G., F. Chenlo, R. Moreira, and E. Cruz. 1997. Grape drying in a pilot plant with a heat pump. Dry. Technol. 15:899-920.
Voisey, P.W. 1976. Instrumental measurement of food texture. In Rheology and Texture in Food Quality. J.M. de Man et al. (eds.), pp. 79-141. Van Nostrand Reinhold/AVI, New York.
Walker, T.L., J.R. Morris, R.T. Threlfall, G.L. Main, O. Lamikanra, and S. Leong. 2001. Density separation, storage, shelf life and sen-sory evaluation of ‘Fry’ muscadine grapes. HortScience 36:941-945.
Webb, L.B., P.H. Whetton, and E.W.R. Barlow. 2007. Modeled impact of future climate change on the phenology of winegrapes in Australia. Aust. J. Grape Wine Res. 13:165-175.
Winter, E., J. Whiting, and J. Rousseau. 2004. Winegrape berry sensory assessment in Australia. Winetitles, Adelaide.
Zouid, I., R. Siret, E. Mehinagic, C. Maury, M. Chevalier, and F. Jour-jon. 2010. Evolution of grape berries during ripening: Investigations into the links between their mechanical properties and the extract-ability of their skin anthocyanins. J. Int. Sci. Vigne Vin 44:87-99.
Zouid, I. 2011. Etude de l’evolution et de l’extractibilite des com-poses phenoliques du raisin en milieu hydroalcoolique pedant la maturation – lien avec les proprietes mecaniques de la baie. Thesis, Ecole Supérieure d’Agriculture d’Angers, UMT Vinitera, Unité de Recherche GRAPPE, France.