Instrument Messages and Functional Testsnagui/labequip/speca/files/n1996005.pdf · Instrument...
34
Instrument Messages and Functional Tests Agilent CSA Spectrum Analyzer This manual provides documentation for the following instruments: N1996A-503 (100 kHz to 3 GHz) N1996A-506 (100 kHz to 6 GHz) Manufacturing Part Number: N1996-90005 Printed in USA February 2006 © Copyright 2006 Agilent Technologies, Inc.
Transcript of Instrument Messages and Functional Testsnagui/labequip/speca/files/n1996005.pdf · Instrument...

Instrument Messages and Functional Tests
Agilent CSA Spectrum Analyzer
This manual provides documentation for the following instruments:
N1996A-503 (100 kHz to 3 GHz)N1996A-506 (100 kHz to 6 GHz)
Manufacturing Part Number: N1996-90005
Printed in USA
February 2006
© Copyright 2006 Agilent Technologies, Inc.
NoticeThe information contained in this document is subject to change without notice.
Agilent Technologies makes no warranty of any kind with regard to this material, including but not limited to, the implied warranties of merchantability and fitness for a particular purpose. Agilent Technologies shall not be liable for errors contained herein or for incidental or consequential damages in connection with the furnishing, performance, or use of this material.
Where to Find the Latest InformationDocumentation is updated periodically. For the latest information about Agilent CSA spectrum analyzers, including firmware upgrades and application information, please visit the following Internet URLs:
http://www.agilent.com/find/csa
2

ContentsTab
le of C
on
tents
1. Instrument MessagesIntroduction . . . . . . . . . . . . . . . . . . . . . . . . . . . . . . . . . . . . . . . . . . . . . . . . . . . . . . . . . . . . . . . . . 6
Error Queue . . . . . . . . . . . . . . . . . . . . . . . . . . . . . . . . . . . . . . . . . . . . . . . . . . . . . . . . . . . . . . . 6Error Message Format . . . . . . . . . . . . . . . . . . . . . . . . . . . . . . . . . . . . . . . . . . . . . . . . . . . . . . . 7Error Message Ranges . . . . . . . . . . . . . . . . . . . . . . . . . . . . . . . . . . . . . . . . . . . . . . . . . . . . . . . 8
2. Master Error Message List Advisory Messages (in alphabetical order) . . . . . . . . . . . . . . . . . . . . . . . . . . . . . . . . . . . . . . . 10-400 to -499, Standard SCPI Query Errors . . . . . . . . . . . . . . . . . . . . . . . . . . . . . . . . . . . . . . . 14-300 to -399, Standard SCPI Device-Specific Errors . . . . . . . . . . . . . . . . . . . . . . . . . . . . . . . . 15-200 to -299, Standard SCPI Execution Errors . . . . . . . . . . . . . . . . . . . . . . . . . . . . . . . . . . . . 17-100 to -199, Standard SCPI Command Errors . . . . . . . . . . . . . . . . . . . . . . . . . . . . . . . . . . . . 18101 to 199, Measurement Integrity . . . . . . . . . . . . . . . . . . . . . . . . . . . . . . . . . . . . . . . . . . . . . 19
3. Functional TestsWhat You Will Find in This Chapter . . . . . . . . . . . . . . . . . . . . . . . . . . . . . . . . . . . . . . . . . . . . 22
What Are the Functional Tests? . . . . . . . . . . . . . . . . . . . . . . . . . . . . . . . . . . . . . . . . . . . . . . 22Functional Test Versus Performance Verification . . . . . . . . . . . . . . . . . . . . . . . . . . . . . . . . 22This chapter includes the following: . . . . . . . . . . . . . . . . . . . . . . . . . . . . . . . . . . . . . . . . . . . 22
Before Performing a Functional Test . . . . . . . . . . . . . . . . . . . . . . . . . . . . . . . . . . . . . . . . . . . . 23Test Equipment . . . . . . . . . . . . . . . . . . . . . . . . . . . . . . . . . . . . . . . . . . . . . . . . . . . . . . . . . . . . . 24Displayed Average Noise Level (DANL) . . . . . . . . . . . . . . . . . . . . . . . . . . . . . . . . . . . . . . . . . 26
Test Limits (with 0 dB input attenuation) . . . . . . . . . . . . . . . . . . . . . . . . . . . . . . . . . . . . . . 26Test Description . . . . . . . . . . . . . . . . . . . . . . . . . . . . . . . . . . . . . . . . . . . . . . . . . . . . . . . . . . . 26Procedure . . . . . . . . . . . . . . . . . . . . . . . . . . . . . . . . . . . . . . . . . . . . . . . . . . . . . . . . . . . . . . . . 26
Frequency Response (Flatness) . . . . . . . . . . . . . . . . . . . . . . . . . . . . . . . . . . . . . . . . . . . . . . . . 29Test Limits . . . . . . . . . . . . . . . . . . . . . . . . . . . . . . . . . . . . . . . . . . . . . . . . . . . . . . . . . . . . . . . 29Test Description . . . . . . . . . . . . . . . . . . . . . . . . . . . . . . . . . . . . . . . . . . . . . . . . . . . . . . . . . . . 29Procedure . . . . . . . . . . . . . . . . . . . . . . . . . . . . . . . . . . . . . . . . . . . . . . . . . . . . . . . . . . . . . . . . 30
3

ContentsTa
ble
of
Co
nte
nts
4

Instru
men
t Messag
es
1 Instrument Messages
5

Instrument MessagesIntroduction
Inst
rum
ent
Mes
sag
es
IntroductionError messages are displayed when a particular event triggers them. They appear on the front panel at the bottom of the display. The message will remain until you press the Esc key or another message is displayed in its place. Error messages are also sent to the remote error queue. There are three types of messages.
Sometimes an instrument condition (signals/settings) requires a warning or advisory. These are not single events, but rather are a condition that is detected for a while and then later is cleared. Instrument conditions are annotated on the front panel display. Refer to the front/rear panel descriptions in the Measurement Guide for more details. (An example warning condition might be: an over-range input signal or an external frequency reference unlock. An example of an advisory condition might be too small number of samples per display point for good detection.)
Error Queue
The error queue is viewed/queried and managed remotely.
Errors Error messages appear when a requested operation has failed. (For example, “Measurement not available”, “No peak found”) Error messages are often generated during remote operation when an invalid programming command has been entered. (For example, “Undefined header”)
Warnings Warning messages appear when a requested operation has completed successfully but there are modifications and/or side effects. (For example, if you requested too high a stop frequency then “Data out of range” is displayed and the analyzer sets itself to the highest available stop frequency.)
Advisories Advisory messages tell the front panel user some useful information. (For example, “File saved successfully” or “Making spectrum measurements...”)
Advisory messages appear on the display, but they are not logged in the remote error queue.
Remote interface (LAN)
When an error situation is caused by a command sent over a remote interface, the resulting messages are output to the queue for that interface. To return an error, you must query the queue for that interface. An error event that is caused by a front panel action is not reported to any remote interface queue. However, an on-going status condition is usually caused by an internal event and they are reported to the remote error queue.
Table 1-1. Characteristics of the Error Queue
Characteristic Remote Interface Error Queue
Capacity (maximum number of messages) 100
6 Chapter 1

Instrument MessagesIntroduction
Instru
men
t Messag
es
Error Message Format
The error/warning messages are listed in numerical order according to the error message number. Advisories and informational messages do not have numbers and will be listed in alphabetical order.
An explanation is usually included with each error to further clarify its meaning. Some errors are specified in industry standards and there are references to the IEEE Standard 488.2-1992, IEEE Standard Codes, Formats, Protocols and Common Commands for Use with ANSI/IEEE Std 488.1-1987. New York, NY, 1992.
Error messages are displayed at the bottom of the screen in the status line. The error number is available in the error queue by querying the remote interface.
Figure 1-1. Error Message Example
Overflow HandlingLinear (first-in/first-out)
When the queue is full, additional new errors are replaced with the message: “−350, Queue overflow”
Viewing EntriesSend the SCPI query to the desired interface.
SYSTem:ERRor?
Clearing the QueueSend *CLS command to the desired interface.
Clears errors in the queue for this particular interface only.
Table 1-1. Characteristics of the Error Queue
Characteristic Remote Interface Error Queue
Chapter 1 7

Instrument MessagesIntroduction
Inst
rum
ent
Mes
sag
es
Error Message Ranges
Events do not generate more than one type of error. For example, an event that generates a query error will not generate a device-specific, execution, or command error.
Advisory Messages (in alphabetical order)(Message text with no error numbers)
These are advisory types of error messages. They provide useful information about instrument operation.
-400 to -499, Standard SCPI Query Errors
These errors indicate that the analyzer output queue control has detected a problem with the message exchange protocol described in IEEE 488.2, Chapter 6. Errors in this class set the query error bit (bit 2) in the event status register (IEEE 488.2, section 11.5.1). These errors correspond to message exchange protocol errors described in IEEE 488.2, 6.5. In this case:
• Either an attempt is being made to read data from the output queue when no output is either present or pending, or
• Data in the output queue has been lost.
-300 to -399, Standard SCPI Device-Specific Errors
An error number in the range –399 to –300 indicates that the analyzer has detected an error where some device operations did not properly complete, possibly due to an abnormal hardware or firmware condition. This is not a error in response to a SCPI query or command, or command execution. The occurrence of any error in this class will cause the device-specific error bit (bit 3) in the event status register to be set.
-200 to -299, Standard SCPI Execution Errors
These errors indicate that an error has been detected during analyzer execution.
-100 to -199, Standard SCPI Command Errors
These errors indicate that the analyzer parser detected an IEEE 488.2 syntax error. Errors in this class set the command error bit (bit 5) in the event status register (IEEE 488.2, section 11.5.1). In this case:
• Either an IEEE 488.2 syntax error has been detected by the parser (a control-to-device message was received that is in violation of the IEEE 488.2 standard. Possible violations include a data element which violates device listening formats or whose type is unacceptable to the device.), or
• An unrecognized header was received. These include incorrect device-specific headers and incorrect or unimplemented IEEE 488.2 common commands.
101 to 199, Measurement Integrity
Errors with making measurements: triggering, over range, bad acquisition/data, bad settings.
8 Chapter 1
Master E
rror M
essage L
ist
2 Master Error Message List
9

Master Error Message ListAdvisory Messages (in alphabetical order)
Mas
ter
Err
or
Mes
sag
e L
ist
Advisory Messages (in alphabetical order)An advisory is simply a message that lets you know something useful - for example “File saved successfully” or “Loading return loss measurement...”. Operation completion and running status indications are common types of advisories. Advisories have no number and are not logged in the error queue.
Message Description/Correction Information
1-port insertion loss state initialization complete...
The instrument is ready to perform the 1-port insertion loss measurement.
2-port insertion loss state initialization complete
The instrument is ready to perform the 2-port insertion loss measurement.
Adjacent channel state initialization complete
The instrument is ready to perform the adjacent channel power measurement.
Distance to fault state initialization complete The instrument is ready to perform the distance to fault measurement.
File <filename> saved The file you named or the file auto-named by the instrument has been saved.
Initializing 1-port insertion loss state... The instrument is in the process of setting all states required to perform the 1-port insertion loss measurement. Wait until you see a message stating this task is complete.
Initializing 2-port insertion loss state... The instrument is in the process of setting all states required to perform the 2-port insertion loss measurement. Wait until you see a message stating this task is complete.
Initializing adjacent channel state... The instrument is in the process of setting all states required to perform the adjacent channel power measurement. Wait until you see a message stating this task is complete.
Initializing distance to fault state... The instrument is in the process of setting all states required to perform the distance to fault measurement. Wait until you see a message stating this task is complete.
Initializing power supply monitor The instrument is in the process of setting all states required to monitor the power supply. Wait until you see a message stating this task is complete.
10 Chapter 2

Master Error Message ListAdvisory Messages (in alphabetical order)
Master E
rror M
essage L
ist
Initializing power supply state... The instrument is in the process of setting all states required for the power supply. Wait until you see a message stating this task is complete.
Initializing return loss state... The instrument is in the process of setting all states required to perform the return loss measurement. Wait until you see a message stating this task is complete.
Initializing spectrum analyzer state... The instrument is in the process of setting all states required to perform spectrum analysis measurements. Wait until you see a message stating this task is complete.
Initializing time and frequency reference settings
The instrument is in the process of setting time and frequency references. Wait until you see a message stating this task is complete.
Initializing time and frequency state... The instrument is in the process of setting all states required to perform measurements involving time and frequency. Wait until you see a message stating this task is complete.
Loading 1-port insertion loss measurement... You have selected the 1-port insertion loss measurement. The instrument is preparing to make this measurement.
Loading 2-port insertion loss state... You have selected the 2-port insertion loss measurement. The instrument is preparing to make this measurement.
Loading adjacent channel measurement... You have selected the adjacent channel power measurement. The instrument is preparing to make this measurement.
Loading distance to fault measurement... You have selected the distance to fault measurement. The instrument is preparing to make this measurement.
Loading return loss measurement... You have selected the return loss measurement. The instrument is preparing to make this measurement.
Loading spectrum analyzer measurement... You have selected the spectrum analyzer measurement. The instrument is preparing to make this measurement.
Make calibration connections then press continue
Follow the instructions in the calibration diagram. Press Cont in the menu keys.
Message Description/Correction Information
Chapter 2 11

Master Error Message ListAdvisory Messages (in alphabetical order)
Mas
ter
Err
or
Mes
sag
e L
ist
Making a single 1-port insertion loss measurement and pausing...
The instrument is performing the 1-port insertion loss measurement one time and then is waiting for you to press Cont, Single, or to select another measurement.
Making a single adjacent channel measurement and pausing...
The instrument is performing the adjacent channel power measurement one time and is then waiting for you to press Cont, Single, or to select another measurement.
Making a single distance to fault measurement and pausing...
The instrument is performing the distance to fault measurement one time and is then waiting for you to press Cont, Single, or to select another measurement.
Making a single return loss measurement and pausing...
The instrument is performing the return loss measurement one time and is then waiting for you to press Cont, Single, or to select another measurement.
Making a single spectrum measurement and pausing...
The instrument is performing a spectrum analyzer measurement one time and is then waiting for you to press Cont, Single, or to select another measurement.
Paused, press Cont or Single to continue The instrument has stopped making any measurements. Press Cont or Single from the front-panel keys to start the measurement again.
Performing calibration... The instrument is in the process of calibrating. Wait until you see the calibration is complete message before pressing another key.
Power supply state initialization complete... The instrument is ready to make measurements.
Preamp Gain is not available in this Mode Preamp Gain function is not available in some of the optional measurement Modes.
Preset, recalling power up state: <Powerup> The instrument is setting all functions to those states you set when you saved your “Powerup” user state or the “Powerup” state set at the factory.
Prototype firmware version <string> You are running a pre-release version of the firmware.
Recalled file <filename> A previously saved file is now available for use.
Message Description/Correction Information
12 Chapter 2
Master Error Message ListAdvisory Messages (in alphabetical order)
Master E
rror M
essage L
ist
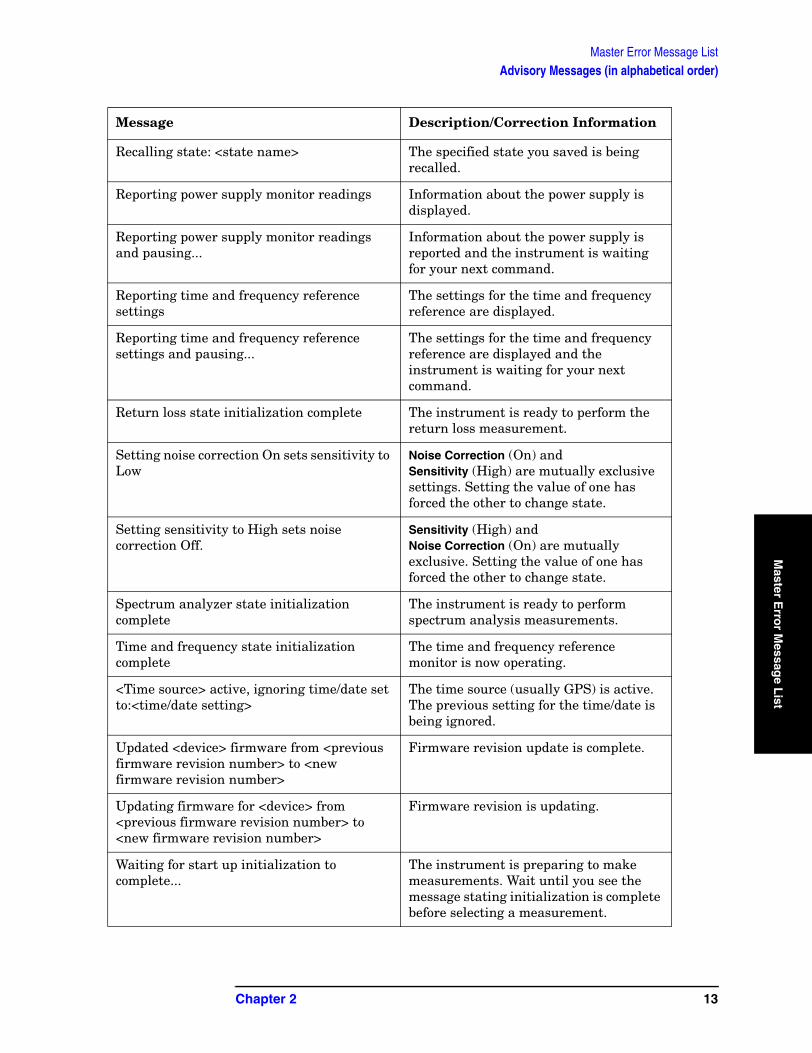
Recalling state: <state name> The specified state you saved is being recalled.
Reporting power supply monitor readings Information about the power supply is displayed.
Reporting power supply monitor readings and pausing...
Information about the power supply is reported and the instrument is waiting for your next command.
Reporting time and frequency reference settings
The settings for the time and frequency reference are displayed.
Reporting time and frequency reference settings and pausing...
The settings for the time and frequency reference are displayed and the instrument is waiting for your next command.
Return loss state initialization complete The instrument is ready to perform the return loss measurement.
Setting noise correction On sets sensitivity to Low
Noise Correction (On) and Sensitivity (High) are mutually exclusive settings. Setting the value of one has forced the other to change state.
Setting sensitivity to High sets noise correction Off.
Sensitivity (High) and Noise Correction (On) are mutually exclusive. Setting the value of one has forced the other to change state.
Spectrum analyzer state initialization complete
The instrument is ready to perform spectrum analysis measurements.
Time and frequency state initialization complete
The time and frequency reference monitor is now operating.
<Time source> active, ignoring time/date set to:<time/date setting>
The time source (usually GPS) is active. The previous setting for the time/date is being ignored.
Updated <device> firmware from <previous firmware revision number> to <new firmware revision number>
Firmware revision update is complete.
Updating firmware for <device> from <previous firmware revision number> to <new firmware revision number>
Firmware revision is updating.
Waiting for start up initialization to complete...
The instrument is preparing to make measurements. Wait until you see the message stating initialization is complete before selecting a measurement.
Message Description/Correction Information
Chapter 2 13

Master Error Message List-400 to -499, Standard SCPI Query Errors
Mas
ter
Err
or
Mes
sag
e L
ist
-400 to -499, Standard SCPI Query Errors
Err# Message Verbose/Correction Information
-400 Query Error There was a problem with a query command. The exact problem cannot be specifically identified.
-410 Query INTERRUPTED Some condition caused an INTERRUPTED query to occur. For example, a query was followed by DAB or GET before a response was completely sent.
-420 Query UNTERMINATED Some condition caused an UNTERMINATED query to occur. For example, the device was addressed to talk and an incomplete program message was received.
-430 Query DEADLOCKED Some condition caused a DEADLOCKED query to occur. For example, both the input buffer and the output buffer are full and the analyzer cannot continue. The analyzer automatically discards output to correct the deadlock.
-440 Query UNTERMINATED after indefinite response
A query was received in the same program message after a query requesting an indefinite response was executed.
14 Chapter 2
Master Error Message List-300 to -399, Standard SCPI Device-Specific Errors
Master E
rror M
essage L
ist
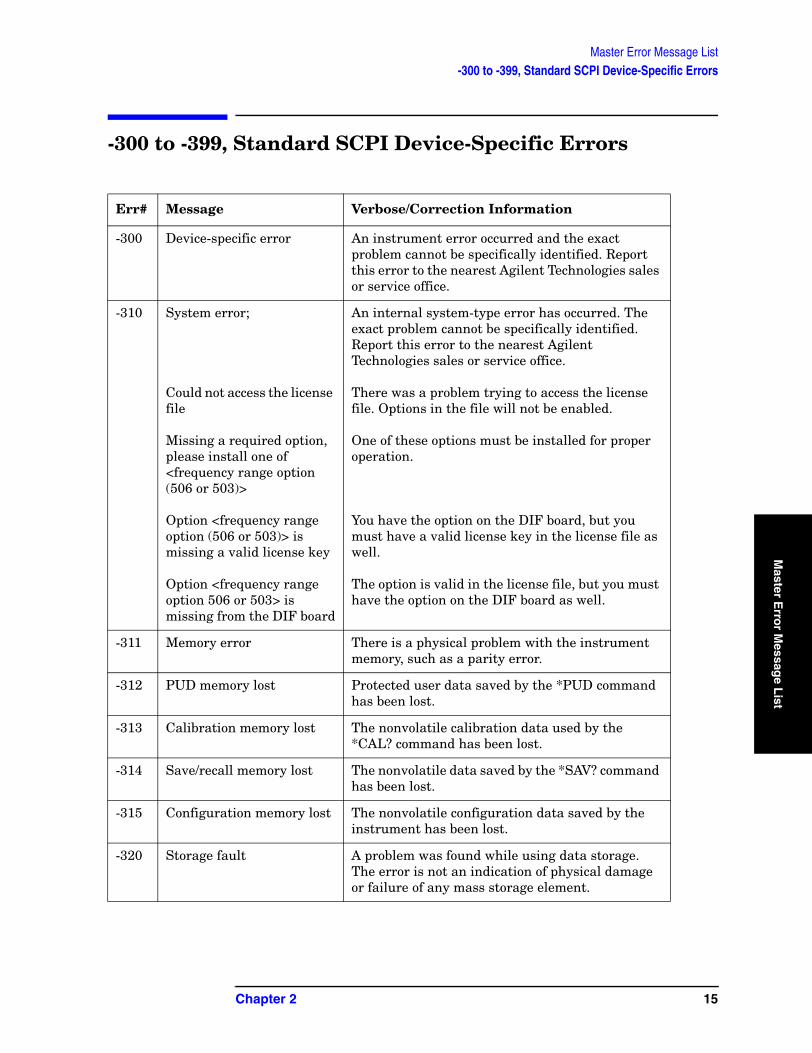
-300 to -399, Standard SCPI Device-Specific Errors
Err# Message Verbose/Correction Information
-300 Device-specific error An instrument error occurred and the exact problem cannot be specifically identified. Report this error to the nearest Agilent Technologies sales or service office.
-310 System error;
Could not access the license file
Missing a required option, please install one of <frequency range option (506 or 503)>
Option <frequency range option (506 or 503)> is missing a valid license key
Option <frequency range option 506 or 503> is missing from the DIF board
An internal system-type error has occurred. The exact problem cannot be specifically identified. Report this error to the nearest Agilent Technologies sales or service office.
There was a problem trying to access the license file. Options in the file will not be enabled.
One of these options must be installed for proper operation.
You have the option on the DIF board, but you must have a valid license key in the license file as well.
The option is valid in the license file, but you must have the option on the DIF board as well.
-311 Memory error There is a physical problem with the instrument memory, such as a parity error.
-312 PUD memory lost Protected user data saved by the *PUD command has been lost.
-313 Calibration memory lost The nonvolatile calibration data used by the *CAL? command has been lost.
-314 Save/recall memory lost The nonvolatile data saved by the *SAV? command has been lost.
-315 Configuration memory lost The nonvolatile configuration data saved by the instrument has been lost.
-320 Storage fault A problem was found while using data storage. The error is not an indication of physical damage or failure of any mass storage element.
Chapter 2 15

Master Error Message List-300 to -399, Standard SCPI Device-Specific Errors
Mas
ter
Err
or
Mes
sag
e L
ist
-321 Out of memory An internal operation needed more memory than was available. Report this error to the nearest Agilent Technologies sales or service office.
-330 Self-test failed; A self-test failure occurred. Report this error to the nearest Agilent Technologies sales or service office.
-340 Calibration failed The instrument requires alignment.
-350 Queue overflow An error occurred that did not get put in the error queue because the queue was full.
-360 Communication error There was a problem with instrument remote communications. The exact problem cannot be specifically identified.
-361 Parity error in program message
A parity bit was not correct when the data was received.
-362 Framing error in program message
A stop bit was not detected when data was received. For example, on a remote bus port.
-363 Input buffer overrun A software or hardware input buffer on a port overflowed with data because of improper or nonexistent pacing.
-365 Time out error There was a time-out problem in the instrument. The exact problem cannot be specifically identified.
Err# Message Verbose/Correction Information
16 Chapter 2
Master Error Message List-200 to -299, Standard SCPI Execution Errors
Master E
rror M
essage L
ist
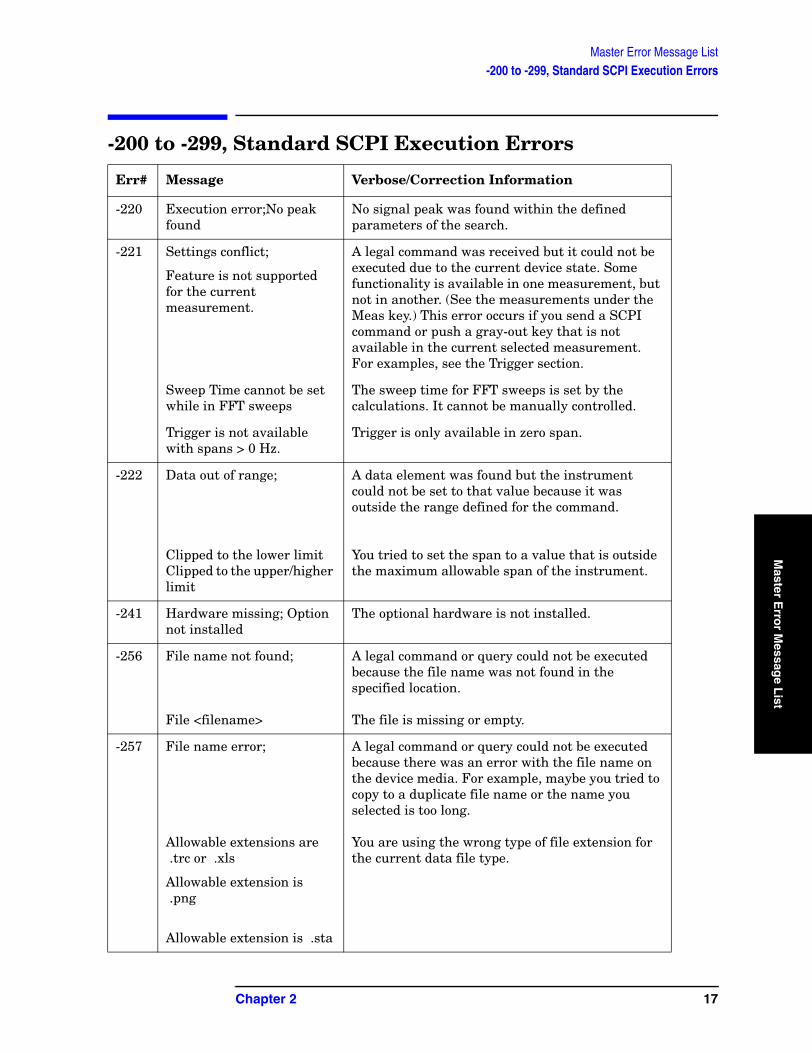
-200 to -299, Standard SCPI Execution Errors
Err# Message Verbose/Correction Information
-220 Execution error;No peak found
No signal peak was found within the defined parameters of the search.
-221 Settings conflict;
Feature is not supported for the current measurement.
A legal command was received but it could not be executed due to the current device state. Some functionality is available in one measurement, but not in another. (See the measurements under the Meas key.) This error occurs if you send a SCPI command or push a gray-out key that is not available in the current selected measurement. For examples, see the Trigger section.
Sweep Time cannot be set while in FFT sweeps
The sweep time for FFT sweeps is set by the calculations. It cannot be manually controlled.
Trigger is not available with spans > 0 Hz.
Trigger is only available in zero span.
-222 Data out of range;
Clipped to the lower limitClipped to the upper/higher limit
A data element was found but the instrument could not be set to that value because it was outside the range defined for the command.
You tried to set the span to a value that is outside the maximum allowable span of the instrument.
-241 Hardware missing; Option not installed
The optional hardware is not installed.
-256 File name not found;
File <filename>
A legal command or query could not be executed because the file name was not found in the specified location.
The file is missing or empty.
-257 File name error;
Allowable extensions are .trc or .xls
Allowable extension is .png
Allowable extension is .sta
A legal command or query could not be executed because there was an error with the file name on the device media. For example, maybe you tried to copy to a duplicate file name or the name you selected is too long.
You are using the wrong type of file extension for the current data file type.
Chapter 2 17

Master Error Message List-100 to -199, Standard SCPI Command Errors
Mas
ter
Err
or
Mes
sag
e L
ist
-100 to -199, Standard SCPI Command Errors
Err# Message Verbose/Correction Information
−109 Missing parameter Fewer parameters were received than what is required for this command.
−120 Numeric data error;
Value not supported
An error was found in a data element that appears to be numeric. The exact problem cannot be identified.
The value you entered is outside the allowable parameters of this function.
18 Chapter 2
Master Error Message List101 to 199, Measurement Integrity
Master E
rror M
essage L
ist
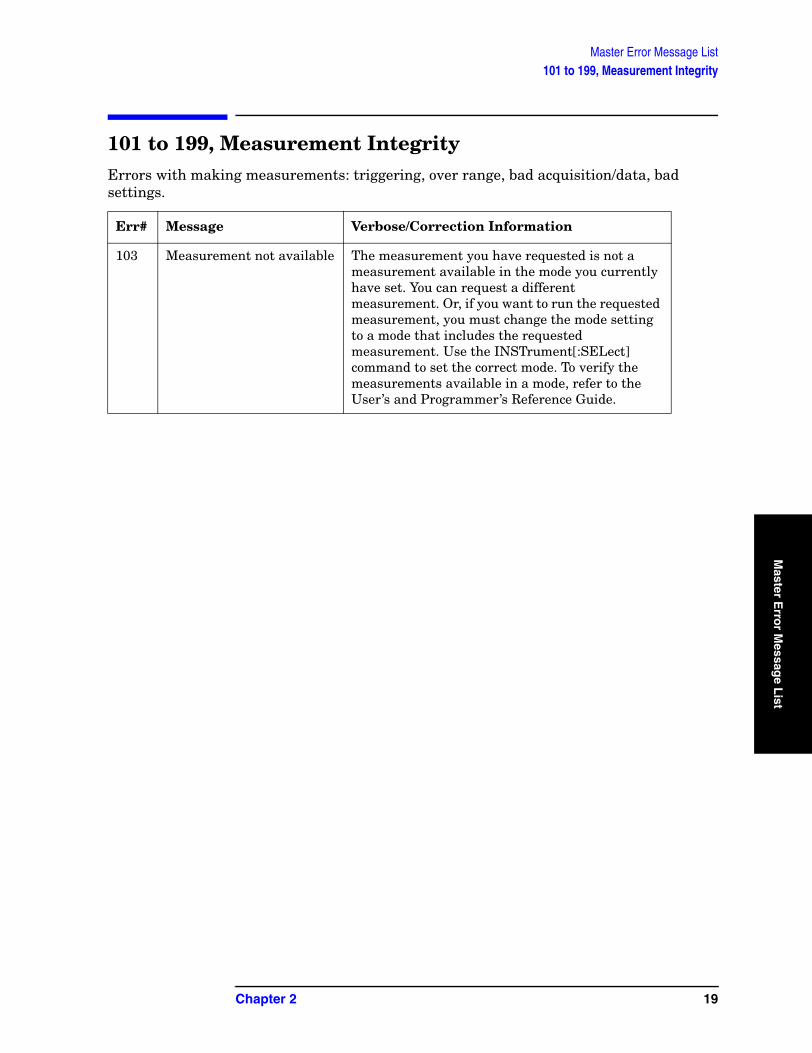
101 to 199, Measurement Integrity Errors with making measurements: triggering, over range, bad acquisition/data, bad settings.
Err# Message Verbose/Correction Information
103 Measurement not available The measurement you have requested is not a measurement available in the mode you currently have set. You can request a different measurement. Or, if you want to run the requested measurement, you must change the mode setting to a mode that includes the requested measurement. Use the INSTrument[:SELect] command to set the correct mode. To verify the measurements available in a mode, refer to the User’s and Programmer’s Reference Guide.
Chapter 2 19

Master Error Message List101 to 199, Measurement Integrity
Mas
ter
Err
or
Mes
sag
e L
ist
20 Chapter 2

Fu
nctio
nal Tests
3 Functional Tests
21
Functional TestsWhat You Will Find in This Chapter
Fu
nct
ion
al T
ests
What You Will Find in This Chapter This chapter describes the functional tests and provides information on how to perform them.
What Are the Functional Tests?
Functional tests are tests of various instrument parameters that give a high degree of confidence that the analyzer is operating correctly. They are recommended as a check of analyzer operation for incoming inspection or after a repair. Measurement uncertainty analysis is not available for functional tests, and the analyzer is checked against limits that are wider than the published specifications. The functional tests are designed to test an analyzer operating within the temperature range defined by the analyzer specifications using a minimum set of test equipment. If a test does not pass, performance tests must be run to confirm a problem exists.
Functional Test Versus Performance Verification
Functional tests use a minimum set of test equipment to check a much smaller range of parameters (and a limited number of data points for each parameter) than do performance verification tests. Functional tests use limits that are wider than the published specifications; measurement uncertainty analysis is not available for functional tests.
NOTE If a functional test does not pass, you must run performance verification tests to confirm that a problem exists.
Performance verification tests span a wide range of instrument parameters and provide the highest level of confidence that the instrument conforms to published specifications. These tests can be time consuming and require extensive test equipment.
This chapter includes the following:
• “Before Performing a Functional Test” on page 23 (what to do first).• “Test Equipment” on page 24 (a list of the equipment required for all of the tests).• Functional Tests:
— “Displayed Average Noise Level (DANL)” on page 26— “Frequency Response (Flatness)” on page 29
Each functional test includes:
• Test limits (pass/fail criteria)• A description of the test• The equipment required for the test• A figure showing how to connect the equipment• Step-by-step instructions• One or more tables in which to record the measurement results
22 Chapter 3
Functional TestsBefore Performing a Functional Test
Fu
nctio
nal Tests
Before Performing a Functional Test
1. Ensure that you have the proper test equipment.
2. Switch on the unit under test (UUT) and let it warm up for 30 minutes.
3. Allow sufficient warm-up time for the required test equipment (refer to individual instrument documentation for warm-up specifications).
4. Ensure that the analyzer’s frequency reference is set to Internal:
a. Press System.
b. If the Freq/Time/Ref menu key does not indicate Int Ref, press Freq/Time/Ref menu key.
c. Using the up and down arrow navigation keys, highlight Internal Reference.
d. Press Select.
NOTE Functional test accuracy depends on the precision of the test equipment used. Ensure that all of the test equipment is calibrated before running a functional test.
Chapter 3 23

Functional TestsTest Equipment
Fu
nct
ion
al T
ests
Test EquipmentThe table below summarizes the test equipment needed to perform all of the functional tests. Alternate equipment model numbers are given in case the recommended equipment is not available.
If neither the recommended nor the alternative test equipment are available, substitute equipment that meets or exceeds the critical specifications listed.
Item Critical Specifications RecommendedAgilent Model
Alternate Agilent Model
Adapters
Type N(m) to Type N(m) Frequency: 10 MHz to 6 GHzVSWR: 1.08:1
1250-1742
Type N(f) to 3.5 mm(f) (for use with 20 GHz or 26.5 GHz source)
Frequency: 10 MHz to 6 GHzVSWR: 1.08:1
1250-1745
Type N(f) to 2.4 mm(f) (for use with >26.5 GHz source)
Frequency: 10 MHz to 6 GHzVSWR: ≤1.08:1
11903B
Cables
Type N(m) to Type N(m), <=36 inches long
Frequency: 10 MHz to 6 GHzVSWR: 1.4:1
11500B
Cable, BNC(m) to BNC(m), ≥36 inches long
Frequency: 10 MHz nominal 10503
Signal Source
Synthesized Sweeper (if 8665B, ESG or PSG is not available)
Frequency Range: 10 MHz to 6 GHzPower Level: -10 to +5 dBm
83620A/B, 83630A/B, 83640A/B, 83650A/B
Synthesized Signal Generator(if 8360-Series sweeper is not used)
Frequency Range: 10 MHz to 6 GHzPower Level: -10 to +5 dBm
8665B, E8257D, E8267D, or
E4438C Opt 506
Miscellaneous Equipment
Power Meter Compatible with power sensor E4419A/B
Power Sensor Frequency Range: 10 MHz to 6 GHzVSWR: <=1.13:1Cal Factor Uncertainty: <2.3%Linearity Uncertainty: 0% at levels <10 dBm
8481A
24 Chapter 3

Functional TestsTest Equipment
Fu
nctio
nal Tests
Power Splitter Frequency Range: 10 MHz to 6 GHzOutput VSWR
10 MHz to 4 GHz: <= 1.10:14 GHz to 6 GHz: <1.20:1
Output Tracking
10 MHz to 4 GHz: <0.15 dB4 GHz to 6 GHz: <0.20 dB
11667A
Termination 50Ω Type-N(m) Frequency: 100 kHz to 6 GHz
909A Option 012
Item Critical Specifications RecommendedAgilent Model
Alternate Agilent Model
Chapter 3 25

Functional TestsDisplayed Average Noise Level (DANL)
Fu
nct
ion
al T
ests
Displayed Average Noise Level (DANL)
Test Limits (with 0 dB input attenuation)
See Table 3-1. for values.
Test Description
The Displayed Average Noise Level (DANL) of the spectrum analyzer is measured within the specified frequency ranges. The analyzer input is terminated into a 50Ω load. The device under test (DUT) is placed in a narrow span. 100 sweeps are averaged, and the marker is used to measure the trace amplitude at the center frequency. A test is performed to assure the measurement is not performed in the presence of a residual response. If a residual response exists, the marker is moved to ensure that the noise level, and not the residual amplitude, is being measured.
This test is performed on all analyzers with the preamp (if available) turned off.
Figure 3-1. DANL Test Setup
Procedure
1. Connect the 50 Ω termination to RF input of the analyzer, as shown in Figure 3-1.
2. Press Mode Preset (restore factory preset values) on the analyzer.
3. Set up the spectrum analyzer by pressing:
FREQ, Center Frequency, 50, MHzSpan, 1, kHzAMPTD, Ref Level, –70, dBm
Item Critical Specifications(for this test)
RecommendedAgilent Model
Termination 50Ω Type-N(m) Frequency: 100 kHz to 6 GHz
909A Option 012
26 Chapter 3
Functional TestsDisplayed Average Noise Level (DANL)
Fu
nctio
nal Tests
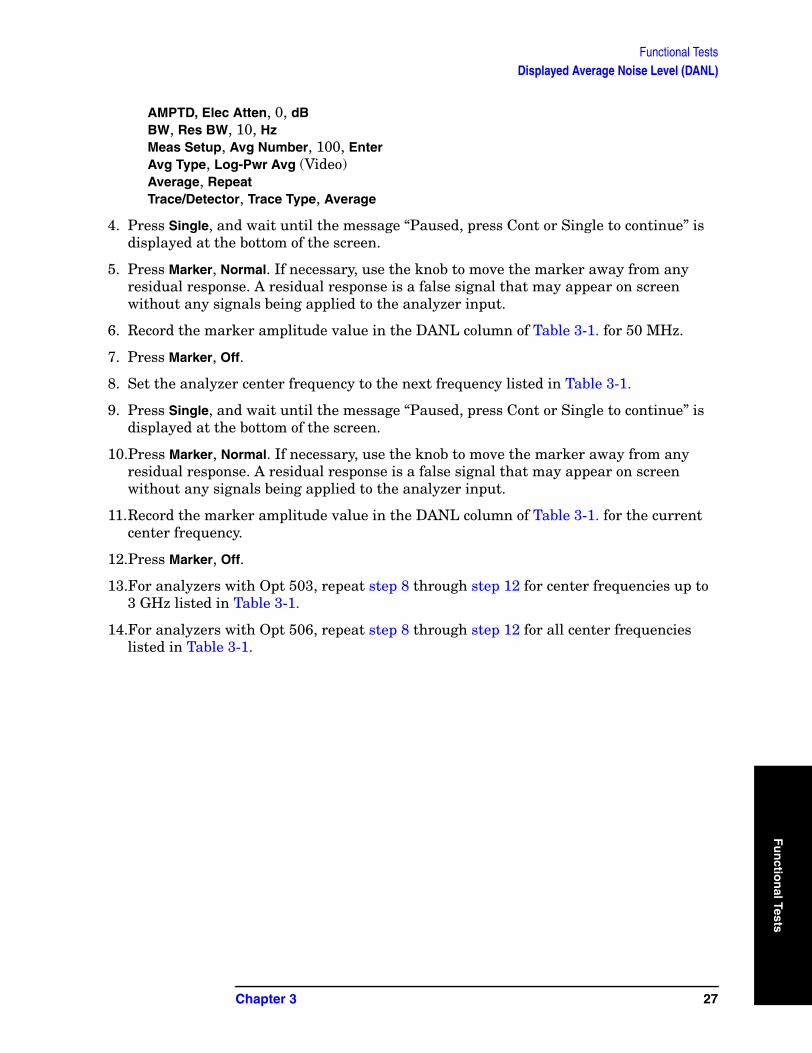
AMPTD, Elec Atten, 0, dBBW, Res BW, 10, HzMeas Setup, Avg Number, 100, EnterAvg Type, Log-Pwr Avg (Video)Average, RepeatTrace/Detector, Trace Type, Average
4. Press Single, and wait until the message “Paused, press Cont or Single to continue” is displayed at the bottom of the screen.
5. Press Marker, Normal. If necessary, use the knob to move the marker away from any residual response. A residual response is a false signal that may appear on screen without any signals being applied to the analyzer input.
6. Record the marker amplitude value in the DANL column of Table 3-1. for 50 MHz.
7. Press Marker, Off.
8. Set the analyzer center frequency to the next frequency listed in Table 3-1.
9. Press Single, and wait until the message “Paused, press Cont or Single to continue” is displayed at the bottom of the screen.
10.Press Marker, Normal. If necessary, use the knob to move the marker away from any residual response. A residual response is a false signal that may appear on screen without any signals being applied to the analyzer input.
11.Record the marker amplitude value in the DANL column of Table 3-1. for the current center frequency.
12.Press Marker, Off.
13.For analyzers with Opt 503, repeat step 8 through step 12 for center frequencies up to 3 GHz listed in Table 3-1.
14.For analyzers with Opt 506, repeat step 8 through step 12 for all center frequencies listed in Table 3-1.
Chapter 3 27

Functional TestsDisplayed Average Noise Level (DANL)
Fu
nct
ion
al T
ests
15.The DANL values recorded should be less than the Test Limits listed in Table 3-1.
Table 3-1. Displayed Average Noise Level (DANL) Results
Center Frequency (MHz)
Displayed Average Noise Level (dBm)
Test Limits (dBm)
Option 503 and 506
50 -123.60
1000 -120.0
2000 -116.21
3000 -120.99
Option 506
3050 -120.82
4000 -117.52
5000 -114.25
6000 -110.88
28 Chapter 3

Functional TestsFrequency Response (Flatness)
Fu
nctio
nal Tests
Frequency Response (Flatness)
Test Limits
See Table 3-2. for values.
Test Description
The frequency response test measures the spectrum analyzer amplitude deviation from the reference value at 50 MHz. The output of a source is fed through a power splitter to a power sensor and the analyzer. The signal source amplitude is measured with a power meter to eliminate error due to source flatness. The frequency response is measured from 10 MHz to either 3 GHz or 6 GHz, depending on the maximum frequency range of your analyzer.
To measure frequency response, the source power level is adjusted at 50 MHz to place the displayed signal approximately two divisions below the reference level. The analyzer marker amplitude and the power meter power level are recorded. This process is repeated at each new source frequency and analyzer center frequency, and all measurements are normalized to the measurement made at 50 MHz.
Item Critical Specifications(for this test)
Recommended Agilent Model
Adaptor, Type N(m) to Type N(m)
Frequency: 10 MHz to 6 GHzVSWR: ≤1.08:1
1250-1472
Adaptor, Type N(f) to 3.5 mm(f) (for use with 20 GHz or 26.5 GHz source)
Frequency: 10 MHz to 6 GHzVSWR: ≤1.08:1
1250-1745
Adaptor, Type N(f) to 2.4 mm(f) (for use with >26.5 GHz source)
Frequency: 10 MHz to 6 GHzVSWR: ≤1.08:1
11903B
Cable, Type N(m) to Type N(m), ≥36 inches long
Frequency: 10 MHz to 6 GHzVSWR: ≤1.4:1
11500B
Cable, BNC (m) to BNC (m), ≥36 inches long
Frequency: 10 MHz nominal 10503
Power Meter Compatible with power sensor E4419A/B
Power Sensor Frequency Range: 10 MHz to 6 GHzVSWR: <=1.13:1Cal Factor Uncertainty: <2.3%Linearity Uncertainty: 0% at levels <10 dBm
8481A
Chapter 3 29

Functional TestsFrequency Response (Flatness)
Fu
nct
ion
al T
ests
Figure 3-2. Frequency Response Test Setup
Procedure
10 MHz to 3 or 6 GHz Frequency Response
1. Zero and calibrate the power meter and power sensor as described in the power meter operation manual.
2. Configure the equipment as shown in Figure 3-2..
Power Splitter Frequency Range: 10 MHz to 6 GHzOutput VSWR
10 MHz to 4 GHz: <= 1.10:14 GHz to 6 GHz: <= 1.20:1
Output Tracking
10 MHz to 4 GHz: <= 0.15 dB4 GHz to 6 GHz: <= 0.20 dB
11667A
Synthesized Sweeper (if 8665B, ESG or PSG is not available)
Frequency Range: 10 MHz to 6 GHzPower Level: -10 to +5 dBm
83620A/B, 83630A/B, 83640A/B, 83650A/B
Synthesized Signal Generator(if 8360-Series sweeper is not used)
Frequency Range: 10 MHz to 6 GHzPower Level: -10 to +5 dBm
8665B, E8257D, E8267D, or E4438C
Opt 506
Item Critical Specifications(for this test)
Recommended Agilent Model
30 Chapter 3
Functional TestsFrequency Response (Flatness)
Fu
nctio
nal Tests
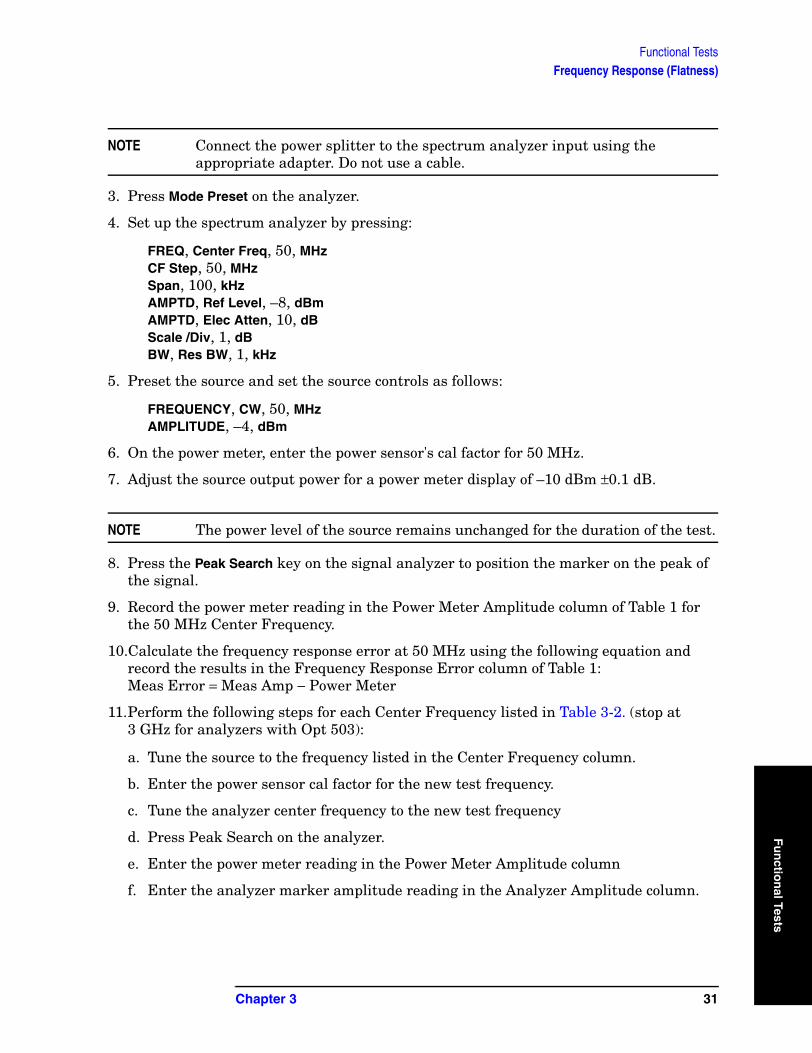
NOTE Connect the power splitter to the spectrum analyzer input using the appropriate adapter. Do not use a cable.
3. Press Mode Preset on the analyzer.
4. Set up the spectrum analyzer by pressing:
FREQ, Center Freq, 50, MHzCF Step, 50, MHzSpan, 100, kHzAMPTD, Ref Level, –8, dBmAMPTD, Elec Atten, 10, dBScale /Div, 1, dBBW, Res BW, 1, kHz
5. Preset the source and set the source controls as follows:
FREQUENCY, CW, 50, MHzAMPLITUDE, –4, dBm
6. On the power meter, enter the power sensor's cal factor for 50 MHz.
7. Adjust the source output power for a power meter display of –10 dBm ±0.1 dB.
NOTE The power level of the source remains unchanged for the duration of the test.
8. Press the Peak Search key on the signal analyzer to position the marker on the peak of the signal.
9. Record the power meter reading in the Power Meter Amplitude column of Table 1 for the 50 MHz Center Frequency.
10.Calculate the frequency response error at 50 MHz using the following equation and record the results in the Frequency Response Error column of Table 1:Meas Error = Meas Amp − Power Meter
11.Perform the following steps for each Center Frequency listed in Table 3-2. (stop at 3 GHz for analyzers with Opt 503):
a. Tune the source to the frequency listed in the Center Frequency column.
b. Enter the power sensor cal factor for the new test frequency.
c. Tune the analyzer center frequency to the new test frequency
d. Press Peak Search on the analyzer.
e. Enter the power meter reading in the Power Meter Amplitude column
f. Enter the analyzer marker amplitude reading in the Analyzer Amplitude column.
Chapter 3 31
Functional TestsFrequency Response (Flatness)
Fu
nct
ion
al T
ests
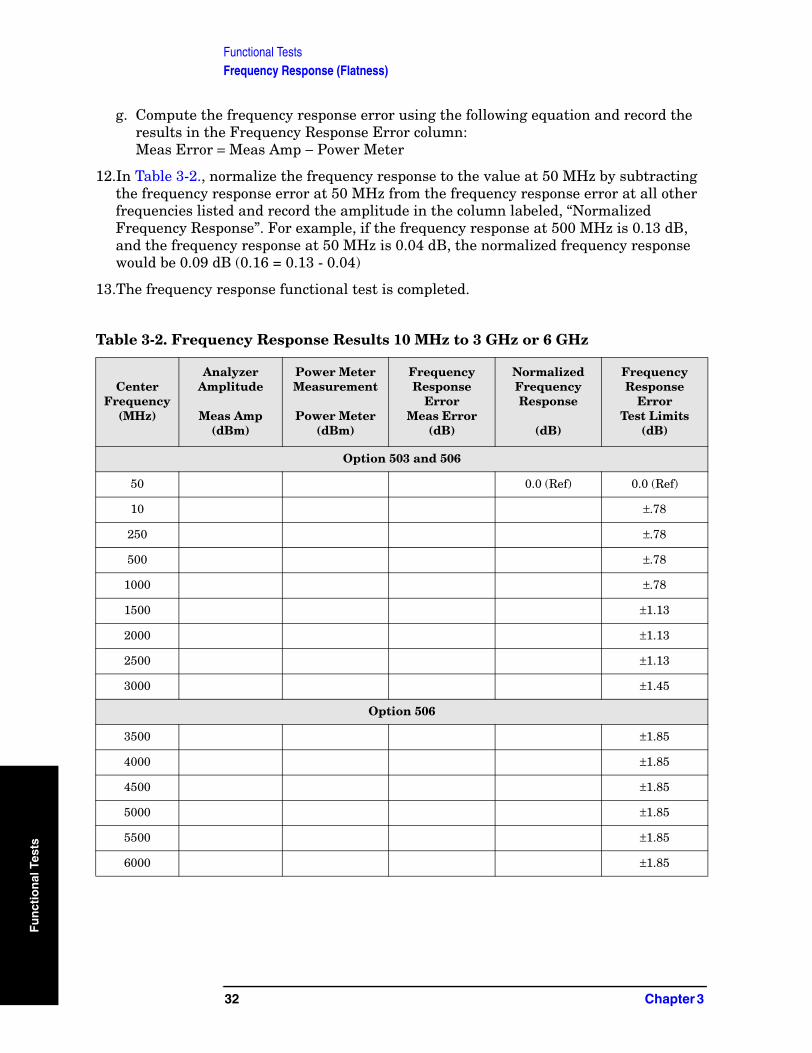
g. Compute the frequency response error using the following equation and record the results in the Frequency Response Error column:Meas Error = Meas Amp − Power Meter
12.In Table 3-2., normalize the frequency response to the value at 50 MHz by subtracting the frequency response error at 50 MHz from the frequency response error at all other frequencies listed and record the amplitude in the column labeled, “Normalized Frequency Response”. For example, if the frequency response at 500 MHz is 0.13 dB, and the frequency response at 50 MHz is 0.04 dB, the normalized frequency response would be 0.09 dB (0.16 = 0.13 - 0.04)
13.The frequency response functional test is completed.
Table 3-2. Frequency Response Results 10 MHz to 3 GHz or 6 GHz
CenterFrequency
(MHz)
Analyzer Amplitude
Meas Amp(dBm)
Power Meter Measurement
Power Meter(dBm)
Frequency Response
ErrorMeas Error
(dB)
Normalized Frequency Response
(dB)
Frequency Response
ErrorTest Limits
(dB)
Option 503 and 506
50 0.0 (Ref) 0.0 (Ref)
10 ±.78
250 ±.78
500 ±.78
1000 ±.78
1500 ±1.13
2000 ±1.13
2500 ±1.13
3000 ±1.45
Option 506
3500 ±1.85
4000 ±1.85
4500 ±1.85
5000 ±1.85
5500 ±1.85
6000 ±1.85
32 Chapter 3

IndexIn
dex
Numerics-100 to -199 errors, 8-200 to -299 errors, 8-300 to -399 errors, 8-400 to -499 errors, 8
AAgilent Technologies URL, 2
DDANL test, 26displayed average noise level. See
DANL, 26displayed messages, 8
Eequipment
functional tests, 24warm-up time, 23
error messagesexample, 7format, 7types, 8viewing messages in queue, 7
error queuescapacity, 6clearing, 7overflow handling, 7remote interface (SCPI), 6SCPI remote interface, 6types, 6viewing entries, 7
errors with no number, 8
Ffrequency response (flatness) test,
29front panel display messages, 8functional testing
introduction, 22performance verification, 22
functional testsbefore performing, 23equipment list, 24introduction, 21vs performance verification
tests, 22warm-up time, 23See also individual functional
tests, 21
Mmessages with no number, 8messages, warning, 6
Nno number
errors, 8
Pperformance verification tests vs
functional tests, 22
Rremote interface (SCPI) error
queue, 6
SSCPI interface error queue, 6status messages, 6
Ttests. See functional teststext on screen, 8
error, 8
UURL (Agilent Technologies), 2
Wwarning messages, 6
Index 33

IndexIn
dex
34 Index