Instrument and Test Forecasting: Considerations in Implementation of New Diagnostics Jason Williams...
22
Instrument and Test Forecasting: Considerations in Implementation of New Diagnostics Jason Williams Principal Laboratory Advisor
-
Upload
jack-wells -
Category
Documents
-
view
214 -
download
0
Transcript of Instrument and Test Forecasting: Considerations in Implementation of New Diagnostics Jason Williams...
Instrument and Test Forecasting: Considerations in Implementation of New Diagnostics
Jason Williams
Principal Laboratory Advisor
PEPFARImplementing
Partner
2
• Current conventional vs. POC spend• Quantification process overview • Forecasting challenges (instrument need and
commodities)• General lab network challenges, defining a
need for POC• Specific POC challenges• General considerations
Overview
PEPFARImplementing
Partner
3
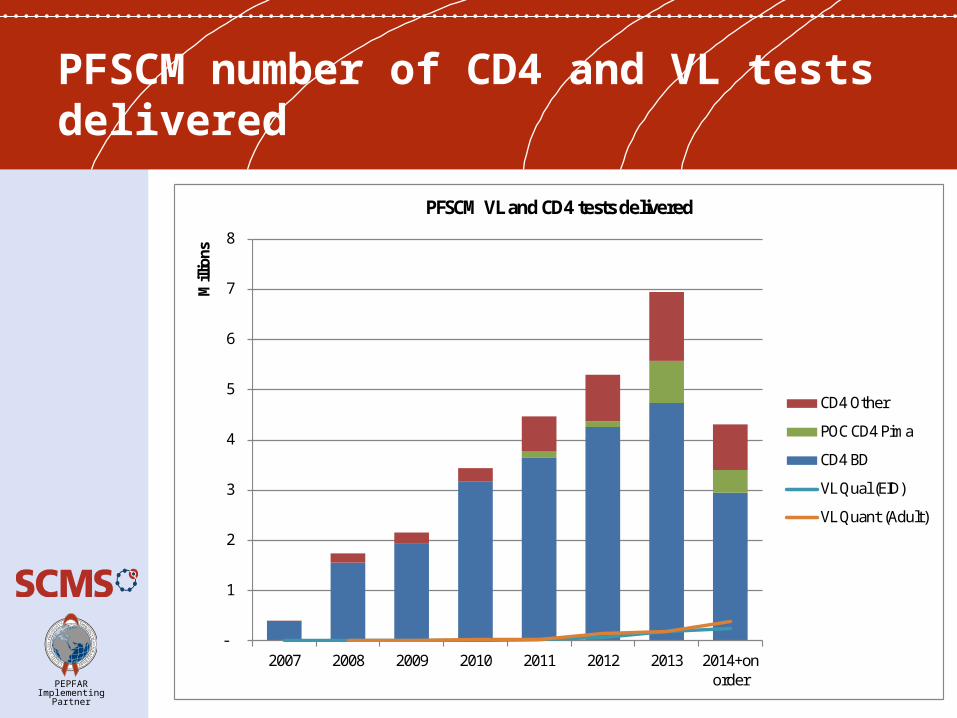
PFSCM number of CD4 and VL tests delivered
-
1
2
3
4
5
6
7
8
2007 2008 2009 2010 2011 2012 2013 2014+onorder
Mill
ions
PFSCM VL and CD4 tests delivered
CD4 Other
POC CD4 Pima
CD4 BD
VL Qual (EID)
VL Quant (Adult)
PEPFARImplementing
Partner
4
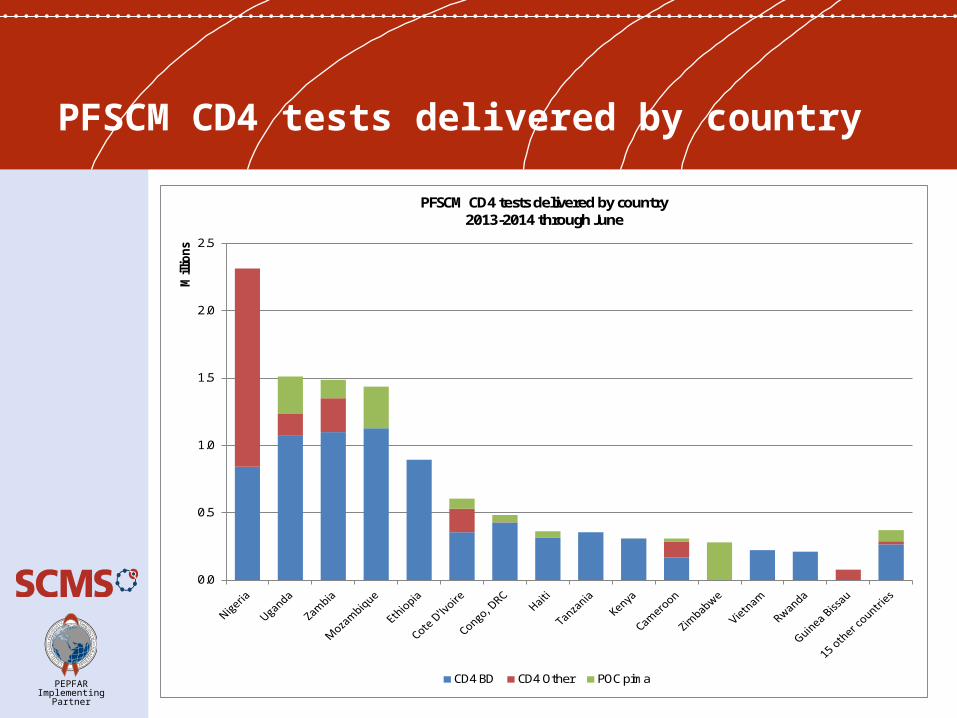
PFSCM CD4 tests delivered by country
0.0
0.5
1.0
1.5
2.0
2.5
Mill
ions
PFSCM CD4 tests delivered by country 2013-2014 through June
CD4 BD CD4 Other POC pima
PEPFARImplementing
Partner
5
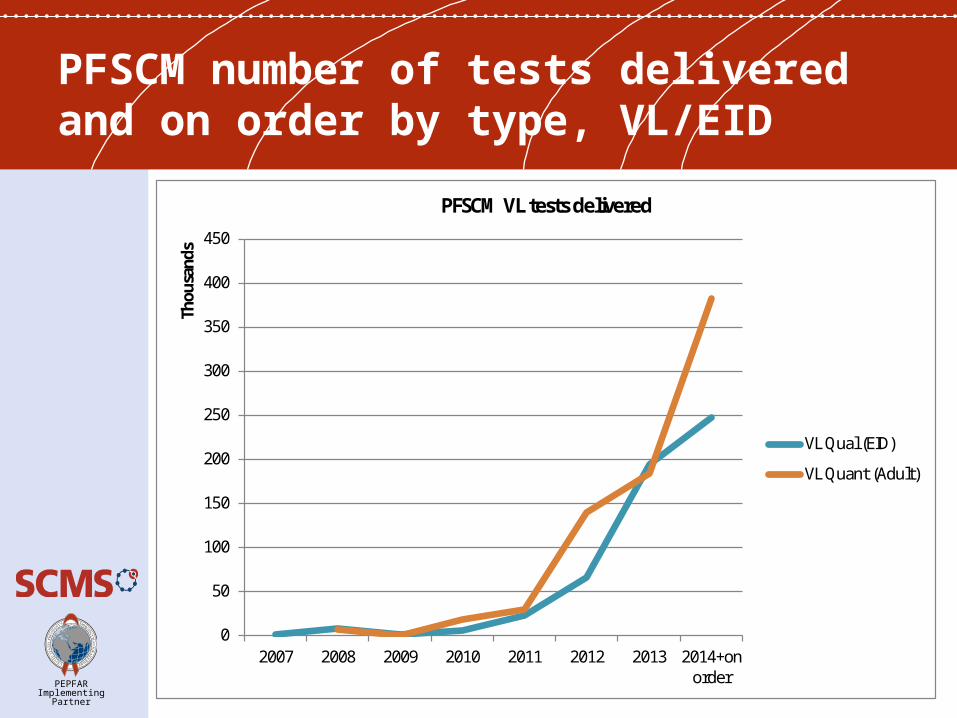
PFSCM number of tests delivered and on order by type, VL/EID
0
50
100
150
200
250
300
350
400
450
2007 2008 2009 2010 2011 2012 2013 2014+onorder
Thou
sand
sPFSCM VL tests delivered
VL Qual (EID)
VL Quant (Adult)

PEPFARImplementing
Partner
6
SCMS Cepheid GeneXpert TB
-
20,000
40,000
60,000
80,000
100,000
120,000
140,000
160,000
$0.0
$0.2
$0.4
$0.6
$0.8
$1.0
$1.2
2012 2013 2014+on order
Mill
ions
POC TB Xpert Spend POC TB Xpert # tests
PEPFARImplementing
Partner
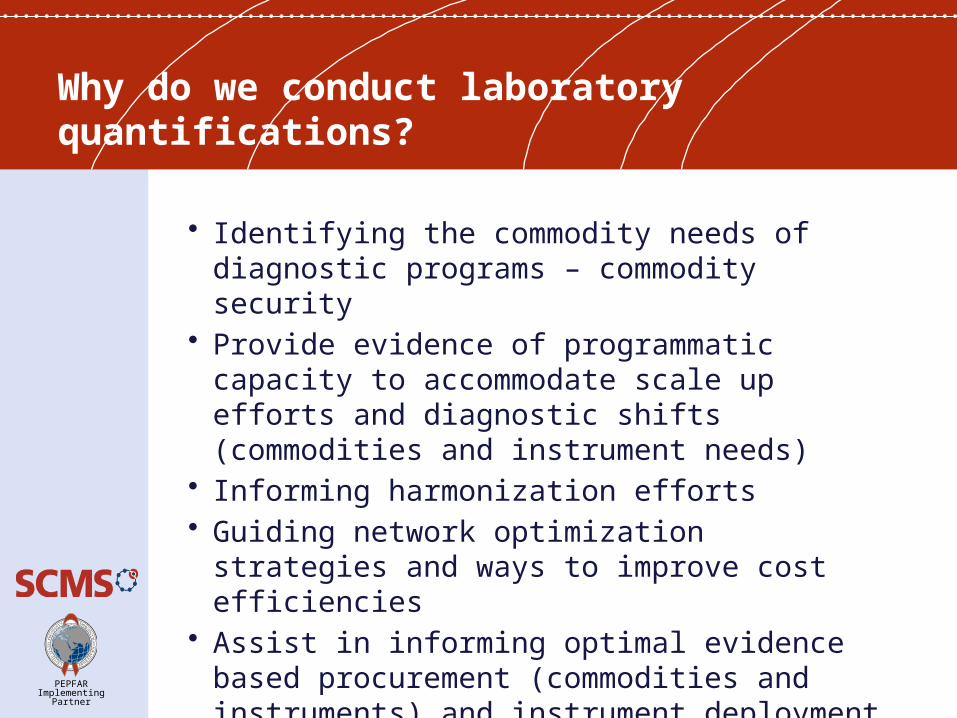
Why do we conduct laboratory quantifications?
• Identifying the commodity needs of diagnostic programs – commodity security
• Provide evidence of programmatic capacity to accommodate scale up efforts and diagnostic shifts (commodities and instrument needs)
• Informing harmonization efforts• Guiding network optimization strategies and ways to
improve cost efficiencies• Assist in informing optimal evidence based
procurement (commodities and instruments) and instrument deployment and replacement strategies
PEPFARImplementing
Partner
8
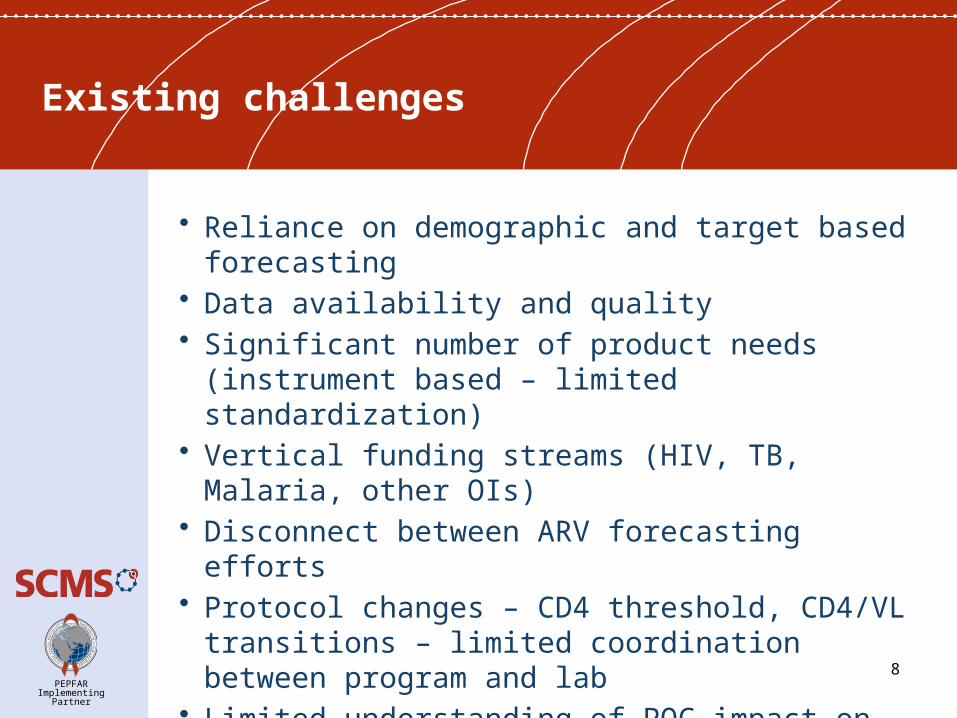
Existing challenges
• Reliance on demographic and target based forecasting• Data availability and quality• Significant number of product needs (instrument based
– limited standardization)• Vertical funding streams (HIV, TB, Malaria, other OIs)• Disconnect between ARV forecasting efforts• Protocol changes – CD4 threshold, CD4/VL transitions
– limited coordination between program and lab• Limited understanding of POC impact on conventional
lab network uptake – data sharing• Buy first, figure out where to place later• Limited procurement adjustments (quarterly)

PEPFARImplementing
Partner
9
Existing challenges - cont.
• Isolated IP, donor, stakeholder instrument procurements – limited long term planning
• Limited data on instrument failures and stockouts to guide procurement adjustments
• Poor adherence to care and treatment guidelines• Balanced and strategic placement of POC
instrumentation – adjustments made to conventional testing uptake
• Inappropriate instrument deployments (low instrument utilization - inefficient commodity consumption)
• Lack of standardized test offerings/products • Limited understanding of how to leverage quantification
data to inform other lab strategies
PEPFARImplementing
Partner
10
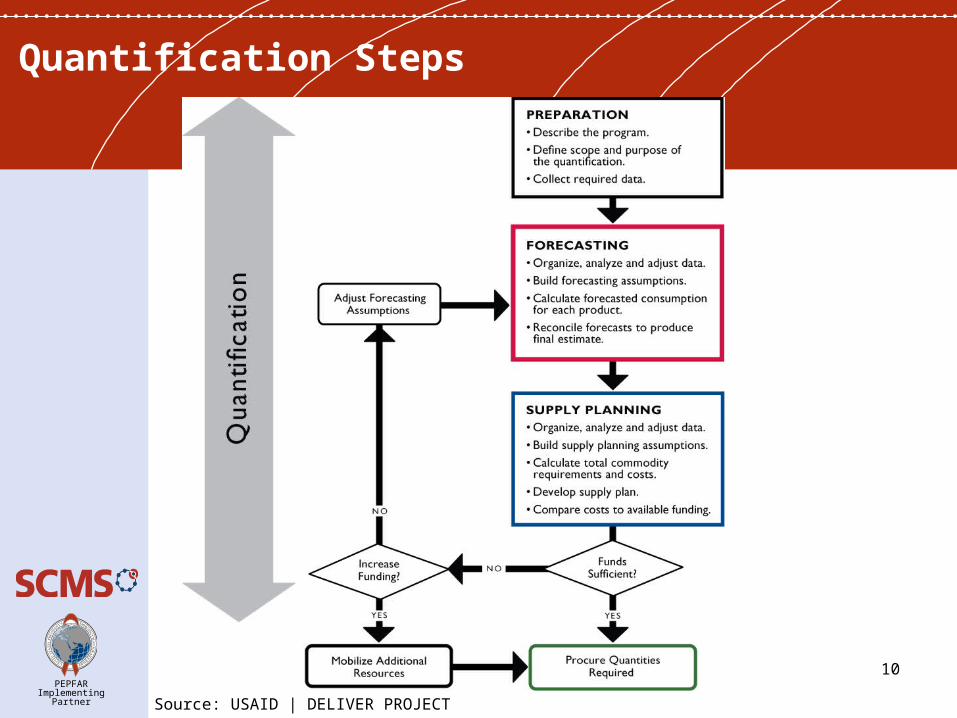
Quantification Steps
Source: USAID | DELIVER PROJECT
PEPFARImplementing
Partner
11
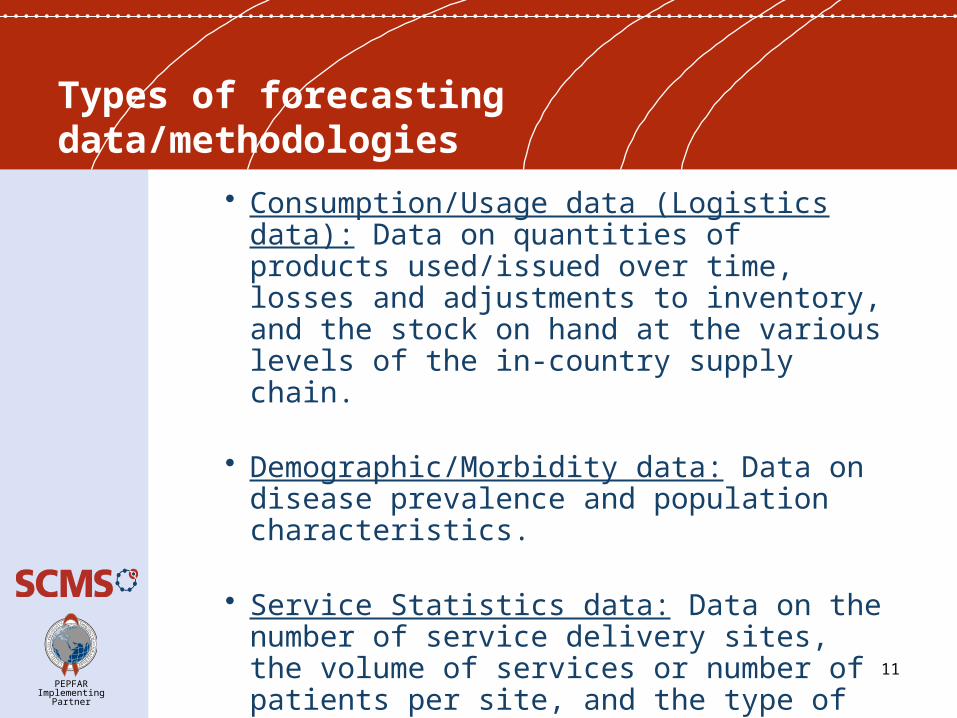
Types of forecasting data/methodologies
• Consumption/Usage data (Logistics data): Data on quantities of products used/issued over time, losses and adjustments to inventory, and the stock on hand at the various levels of the in-country supply chain.
• Demographic/Morbidity data: Data on disease prevalence and population characteristics.
• Service Statistics data: Data on the number of service delivery sites, the volume of services or number of patients per site, and the type of service received
PEPFARImplementing
Partner
12
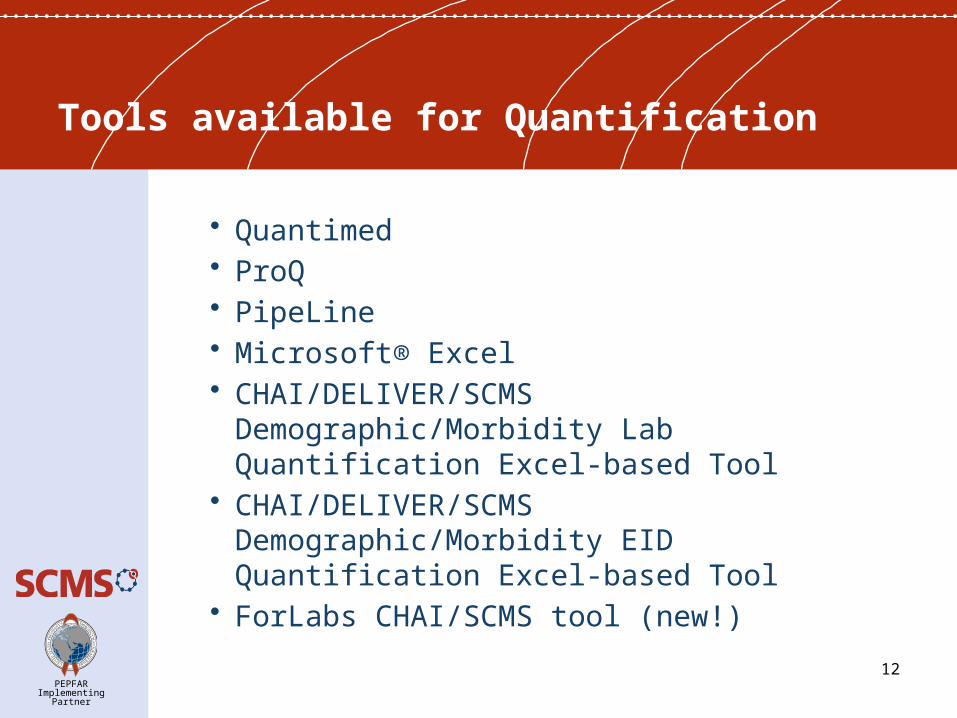
Tools available for Quantification
• Quantimed• ProQ• PipeLine• Microsoft® Excel• CHAI/DELIVER/SCMS Demographic/Morbidity
Lab Quantification Excel-based Tool• CHAI/DELIVER/SCMS Demographic/Morbidity
EID Quantification Excel-based Tool • ForLabs CHAI/SCMS tool (new!)
PEPFARImplementing
Partner
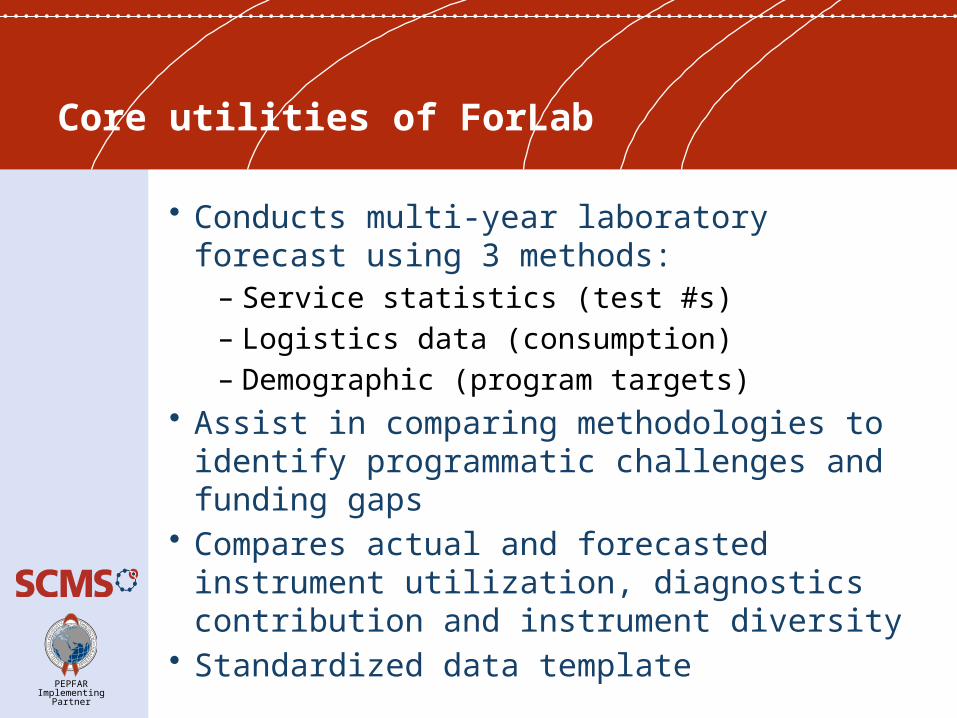
Core utilities of ForLab
• Conducts multi-year laboratory forecast using 3 methods:
– Service statistics (test #s)– Logistics data (consumption)– Demographic (program targets)
• Assist in comparing methodologies to identify programmatic challenges and funding gaps
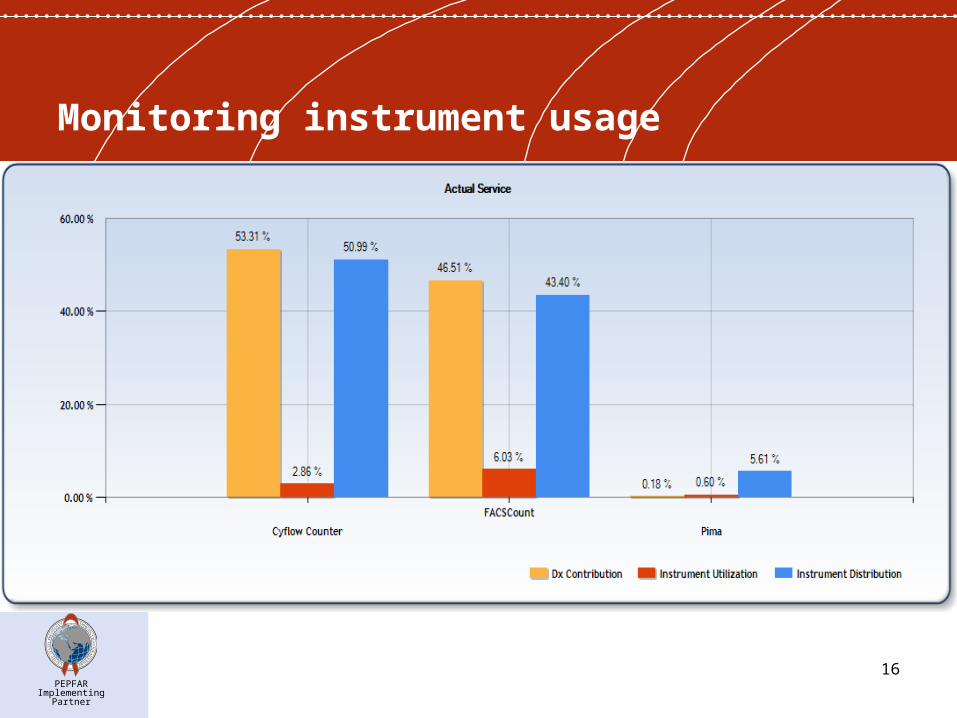
• Compares actual and forecasted instrument utilization, diagnostics contribution and instrument diversity
• Standardized data template
PEPFARImplementing
Partner
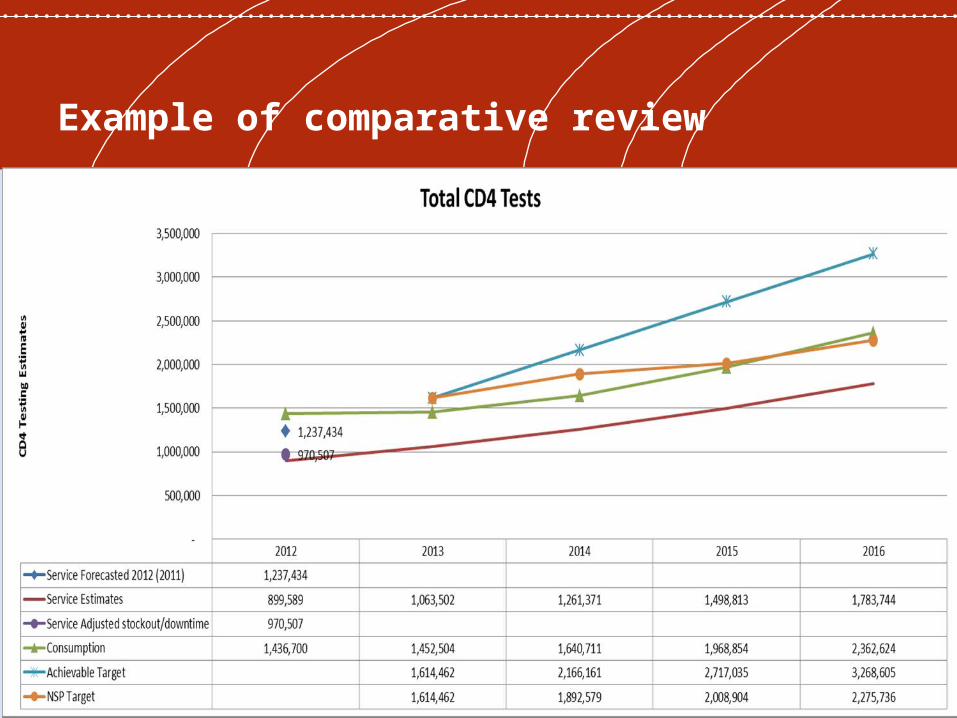
Example of comparative review
PEPFARImplementing
Partner
15
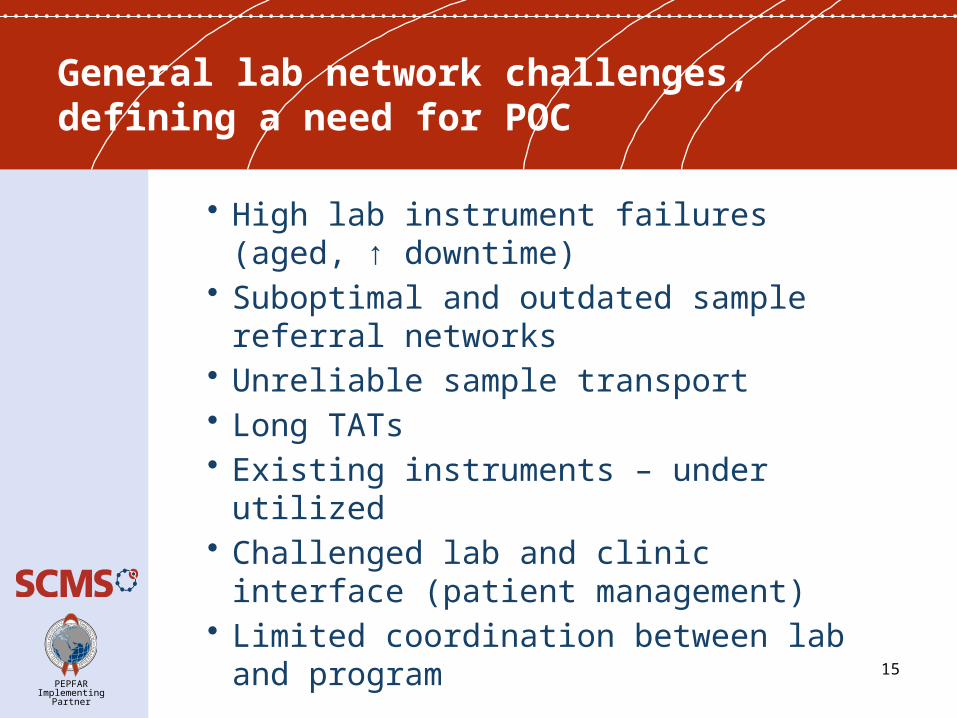
General lab network challenges, defining a need for POC
• High lab instrument failures (aged, ↑ downtime)
• Suboptimal and outdated sample referral networks
• Unreliable sample transport • Long TATs • Existing instruments – under utilized• Challenged lab and clinic interface (patient
management)• Limited coordination between lab and program
PEPFARImplementing
Partner
Monitoring instrument usage
16
PEPFARImplementing
Partner
17
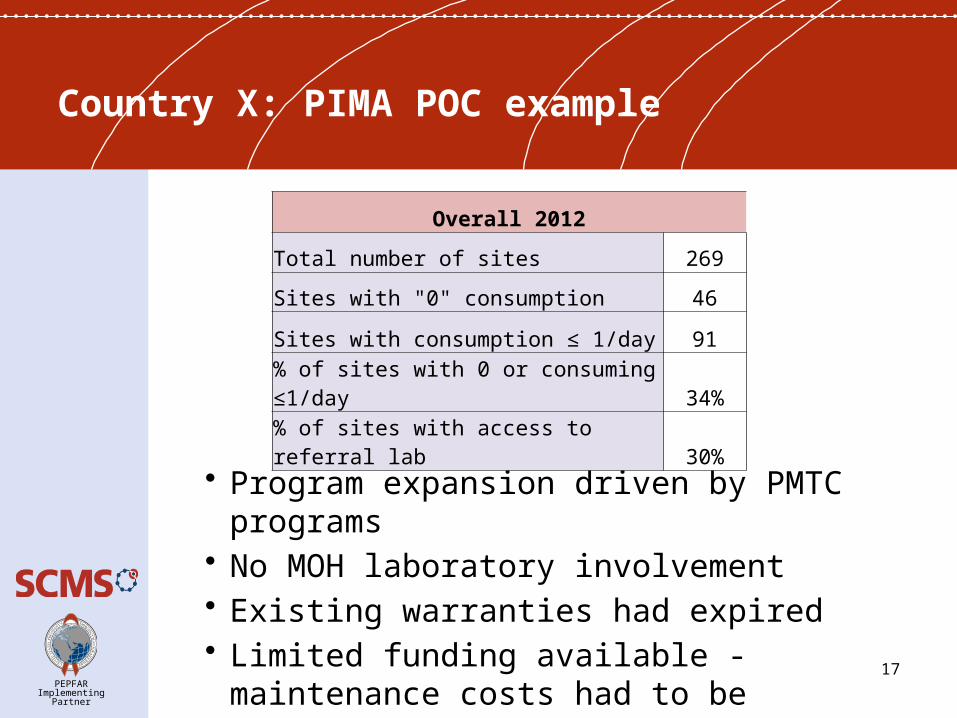
Country X: PIMA POC example
• Program expansion driven by PMTC programs• No MOH laboratory involvement• Existing warranties had expired• Limited funding available - maintenance costs
had to be negotiated
Overall 2012
Total number of sites 269
Sites with "0" consumption 46
Sites with consumption ≤ 1/day 91
% of sites with 0 or consuming ≤1/day 34%
% of sites with access to referral lab 30%
PEPFARImplementing
Partner
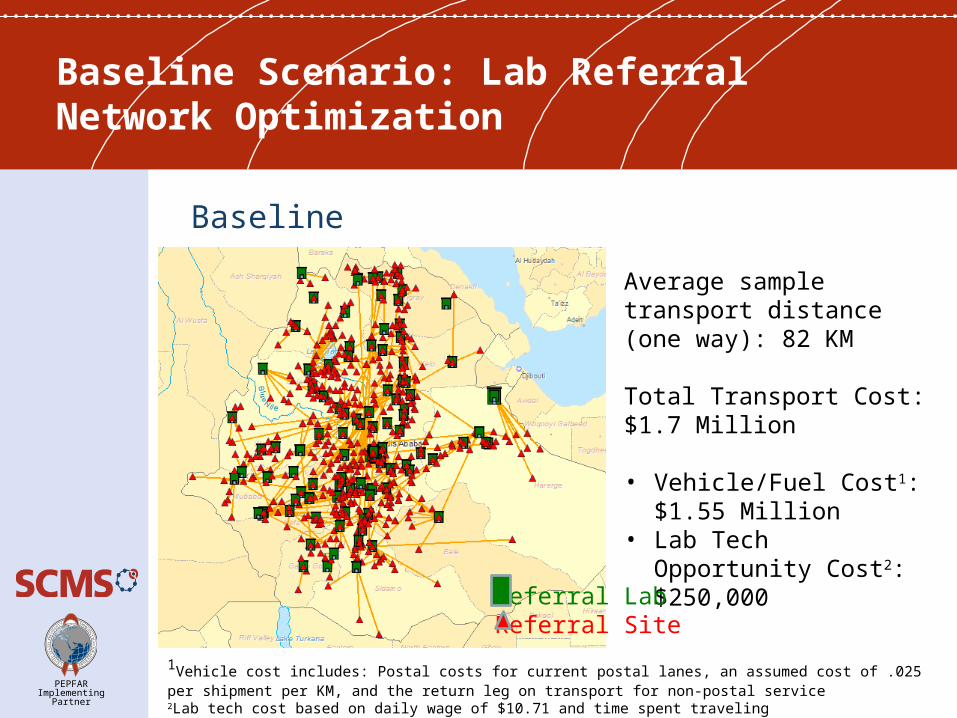
Baseline Scenario: Lab Referral Network Optimization
Baseline
Average sample transport distance (one way): 82 KM
Total Transport Cost:$1.7 Million
• Vehicle/Fuel Cost1: $1.55 Million
• Lab Tech Opportunity Cost2: $250,000
1Vehicle cost includes: Postal costs for current postal lanes, an assumed cost of .025 per shipment per KM, and the return leg on transport for non-postal service2Lab tech cost based on daily wage of $10.71 and time spent traveling
Referral LabReferral Site
PEPFARImplementing
Partner
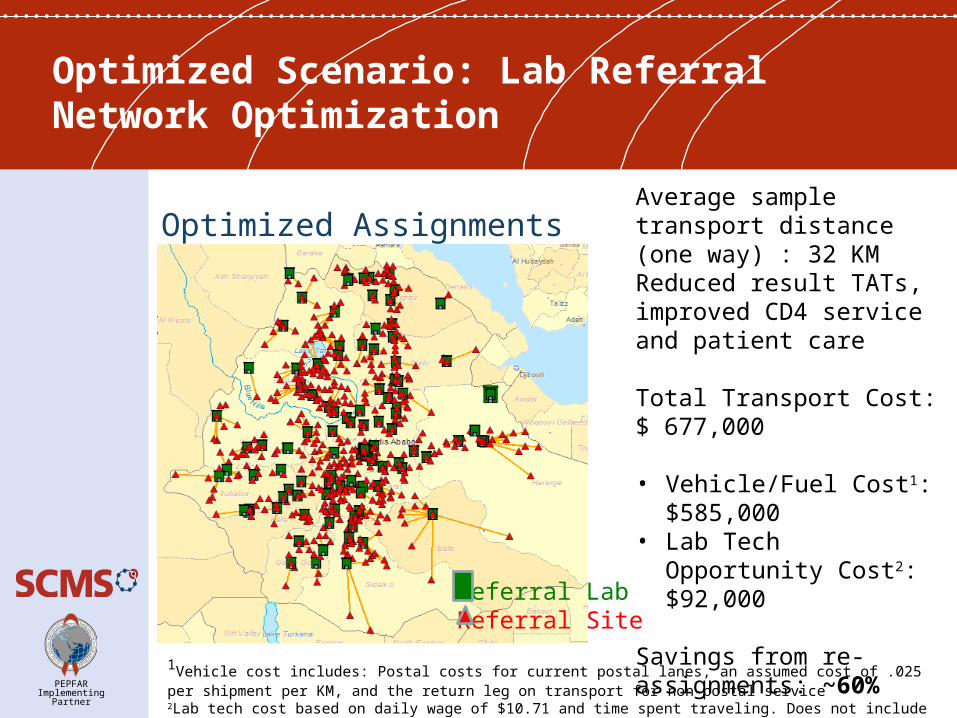
Optimized AssignmentsAverage sample transport distance (one way) : 32 KMReduced result TATs, improved CD4 service and patient care
Total Transport Cost:$ 677,000
• Vehicle/Fuel Cost1: $585,000
• Lab Tech Opportunity Cost2: $92,000
Savings from re-assignments: ~60%
1Vehicle cost includes: Postal costs for current postal lanes, an assumed cost of .025 per shipment per KM, and the return leg on transport for non-postal service2Lab tech cost based on daily wage of $10.71 and time spent traveling. Does not include travel per diems
Optimized Scenario: Lab Referral Network Optimization
Referral LabReferral Site
PEPFARImplementing
Partner
Considerations for POC implementation
• Maximizing conventional instrument utilization, with strategic POC integration.
• Enhanced monitoring of utilization vs. diagnostic contribution, as well as patient outcomes
• Instrument replacement strategies, POC integration may assist in creating further efficiencies within existing networks
20

PEPFARImplementing
Partner
21
• Leverage GIS data to inform strategies• Update existing sample referral networks prior
to developing POC integration approach• Seek increased access in a cost controlled
approach• Develop appropriate instrument placement
strategies before procurement
Considerations for POC implementation (cont.)

PEPFARImplementing
Partner
22
Questions