Instructor : Ryan Williams. Learning Objectives 1. Recognize items that belong on an Income...
23
Income Statement and Balance Sheet Instructor : Ryan Williams
-
date post
21-Dec-2015 -
Category
Documents
-
view
214 -
download
0
Transcript of Instructor : Ryan Williams. Learning Objectives 1. Recognize items that belong on an Income...

Income Statement and Balance Sheet
Instructor : Ryan Williams

Learning Objectives 1. Recognize items that belong on an Income Statement.
2. Prepare an Income Statement.
3. Calculate COGS given information about changes in inventory.
4. Calculate net profit margin.
5. Recognize items that belong on a Balance Sheet.
6. Prepare a Balance Sheet.
7. Calculate accumulated depreciation, net fixed assets and gross fixed assets.
8. Discuss the purpose and potential shortcomings of the Income Statement and Balance Sheet.
9. Calculate dividends paid, number of shares outstanding, earnings per share, and the P/E ratio using the current Income Statement and two most recent Balance Sheets.

Income StatementOther names: Statement of income,
statement of earnings, “P&L” (profit and loss).
This matches revenues & expenses for the same period, it is a SUMMARY of FLOWS, or a recording of cumulative historical activity. Think of it like a history book.

Basic Income Statement – 2.1Income StatementCompany Name
For the time period ending date
Net Sales- Cost of Goods Sold (COGS)= Gross Profit
- Operating Expenses=Operating Profit (EBIT)
-Interest Expense=Profit Before Taxes (=EBT)
-Taxes
=Net Income

Coca-Cola’s Income StatementThree Months Ended
April 3, 2009
NET OPERATING REVENUES $ 7,169
Cost of goods sold 2,590
GROSS PROFIT 4,579
Selling, general and administrative expenses 2,624
Other operating charges 92
OPERATING INCOME 1,863
Interest income 60
Interest expense 85
Equity income — net 17
Other income (loss) — net (40)
INCOME BEFORE INCOME TAXES 1,815
Income taxes 456
CONSOLIDATED NET INCOME 1,359

Basic Income Statement Items• NET SALES: sale revenue is recorded when the ownership
is transferred from the seller to the buyer. Consider, though, that some revenue is never collected (bad creditors, trial periods, money-back guarantee…)
Net sales= Gross sales – (returns & allowances)
• COST OF GOODS SOLD (COGS): direct costs of manufacturing/selling a product
COGS = Beginning Inventory
+ Materials purchases
– Ending inventory

Basic Income Statement ItemsOPERATING EXPENSES: Include
management salaries, advertising expenditures, lease payments, repairs & maintenance, R&D, general & administrative expenses
INTEREST EXPENSE: cost of borrowing money
TAXES: Federal, state and/or local levelsNET INCOME: it is the ‘bottom line’ of
income statement, and it represents the base profit earned during accounting period

We will go through Assignment 2.1 Net Sales- Cost of Goods Sold (COGS)= Gross Profit
- Operating Expenses=Operating Profit (EBIT)
-Interest Expense=Profit Before Taxes (=EBT)
-Taxes
=Net Income

Income StatementEarnings per share (EPS) : it indicates the profit earned
by each share of stock.
P/E ratio
Net Profit Margin: Net income divided by Net Sales
goutstandin shares common of no.
rsshareholde to available incomenet EPS
EPS
stock the of pricemarket current Ratio P/E

Balance SheetCompany’s resources are identified as:
AssetsLiabilitiesOwner’s equity
Balance sheet identity:
“Stock” measure statement: each value is the value of the account at the specific date associated with the balance sheet.
Assets and Liabilities ordered by liquidity (from the most liquid to the less liquid)
Total Assets = Total Liabilities + Shareholders’ Equity

Another way to think about itBalance sheet:Assets: The stuff a company owns.Liabilities & Equity: How a company paid for
their stuff.
Income Statement: How much money the company’s stuff is making for them.

Balance Sheet – Table 2.2ASSETS LIABILITIES
Cash Notes Payable
Net Accounts Receivable Accounts Payable
I nventories Accrued Expenses
Total Current Assets Current Portion of LT Debt
Total Current Liabilities
Gross Fixed Assets
(Accumulated Depreciation) LT Debt
Net Fixed Assets Total Liabilities
Total Assets Preferred Stock
Common Stock
Retained Earnings
Total Liabilities and Equity
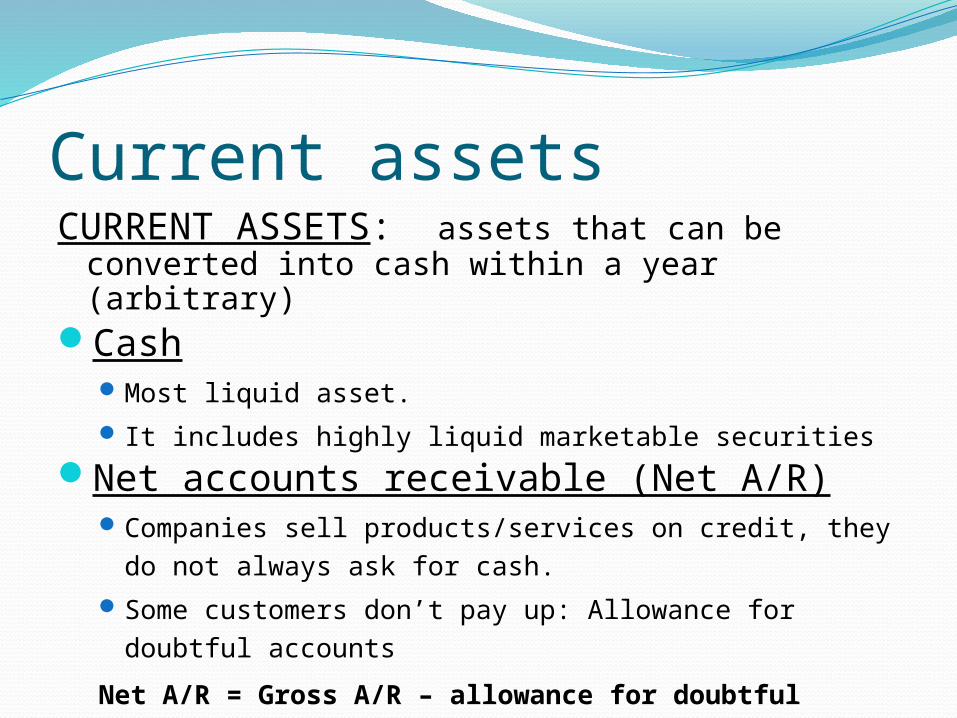
Current assetsCURRENT ASSETS: assets that can be
converted into cash within a year (arbitrary)Cash
Most liquid asset. It includes highly liquid marketable securities
Net accounts receivable (Net A/R)Companies sell products/services on credit, they do not
always ask for cash. Some customers don’t pay up: Allowance for doubtful
accounts
Net A/R = Gross A/R – allowance for doubtful
accounts

Current assets – cont.Inventory
Raw materials, work in process, finished goodsFIFO, LIFO, average cost
End of year inventory = Beginning of year inventory + purchases -
COGS
Total current assets = Cash + Net A/R + Inventory

Long-term assetsFIXED ASSETS
Equipment, buildings, vehicles, computers etcPermanent nature; needed for business operationsReported at book value
= original historical cost – allowable depreciationGross fixed assets: original cost of assetsAccumulated depreciation
Straight-line Accelerated cost recovery
Net fixed assets = gross fixed assets – accumulated depreciation

Total assets (final left hand side)Total assets
= Current assets + long-term assets
Assets (LHS of balance sheet) must be financed by a combination of liabilities and owner’s equity (RHS of balance sheet)
In other words, the balance sheet has to balance. If you have constructed a balance sheet and it
does not balance, you have done something wrong.

LiabilitiesCURRENT LIABILITIES
• Notes payable• Accounts payable (A/P)• Accrued expenses (accruals)• Current portion of long-term debt
→ SUM = TOTAL CURRENT LIABILITIES
LONG-TERM DEBT• Liabilities with maturities in excess of 1 year
Total liabilities= current liabilities + L.T. debt

EquityCOMMON STOCK
Common stock at par
Additional paid-in capital (capital surplus): additional money generated when company sold stocks
RETAINED EARNINGSCumulative total of all net income reinvested into
the company: this income is NOT available o shareholders!
Annual addition to retained earnings = net income – dividends paid
g)outstandin shares common of (#value)par Stock Common of Value Book (
g)outstandin shares common of (#value)par -valuemkt Capital In-Paid (

Total EquityShareholders’ equity
= common stock at par +
additional paid-in capital +
retained earnings
Shareholders’ equity also known as Net worth, owners’ equity or book value of firm’s equity
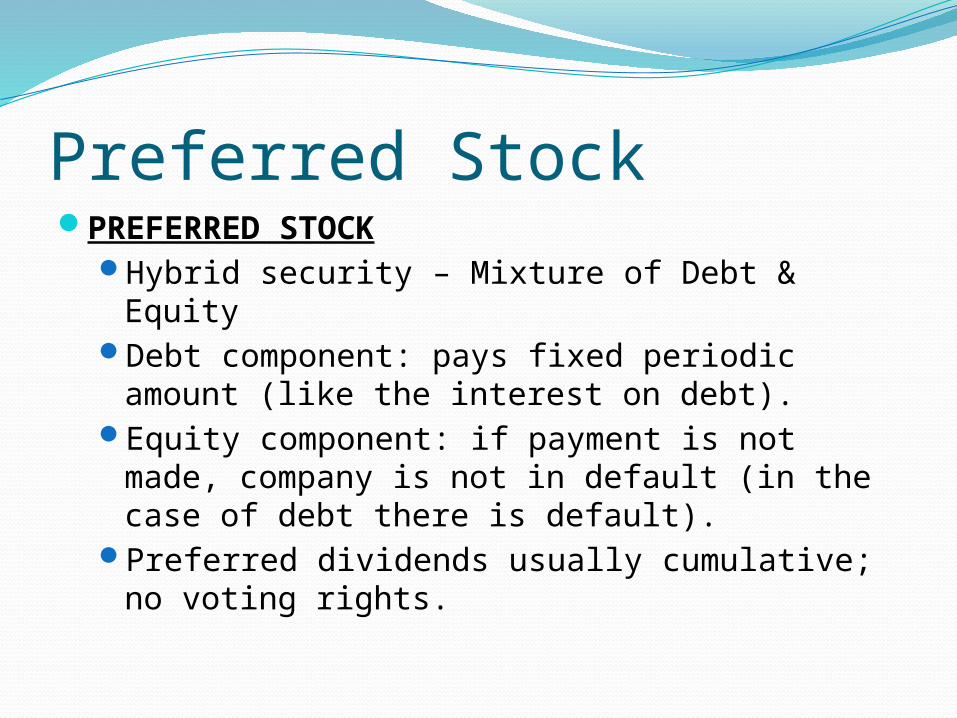
Preferred StockPREFERRED STOCK
Hybrid security – Mixture of Debt & EquityDebt component: pays fixed periodic amount
(like the interest on debt).Equity component: if payment is not made,
company is not in default (in the case of debt there is default).
Preferred dividends usually cumulative; no voting rights.

Total Liabilities and equity (right hand side) Total liabilities and equity
= total liabilities + preferred stock (if any) + shareholders’ equity
In other words, the balance sheet has to balance.
If you have constructed a balance sheet and it does not balance, you have done something wrong.

ASSETS LIABILITIES
Cash Notes Payable
Net Accounts Receivable Accounts Payable
I nventories Accrued Expenses
Total Current Assets Current Portion of LT Debt
Total Current Liabilities
Gross Fixed Assets
(Accumulated Depreciation) LT Debt
Net Fixed Assets Total Liabilities
Total Assets Preferred Stock
Common Stock
Retained Earnings
Total Liabilities and Equity
Net Sales- Cost of Goods Sold (COGS)= Gross Profit
- Operating Expenses=Operating Profit (EBIT)
-Interest Expense=Profit Before Taxes (=EBT)
-Taxes
=Net Income

Next ClassQuiz 1