Instructions for CFDBased Method - SIMMAN 2014 · Instructions for CFDBased Method SIMMAN 2014 Rev....
22
Instructions for CFDBased Method SIMMAN 2014 Rev. 5.0.0, June 2014 Page 1 1. Hull Forms and Simulation Conditions Hull form 1) Test case Approach speed � � (��) 2) Appendages CFD Simulation condition EFD Data 4) ( � ) 5) h/T 6) DOF 3) � � (kn) � � � �� 2) KVLCC2 App. 15.5 kn (0.142) - Propeller - Rudder �� �� 15.5 1.0 0.142 HMRI (46.426) ∞ App. 7.0 kn (0.063) - Propeller - Rudder �� �� 7.0 1.0 0.063 FHR (75.000) 1.2 Bare 7.0 kn (0.063) - Propeller - Rudder �� �� 7.0 1.0 0.063 FHR (75.000) 1.2 KCS 2) KCS 24.0 kn (0.260) - Propeller - Rudder �� �� 18.6 0.775 0.202 FORCE (52.667) ∞ 2) KCS 8. 75 kn (0.095) - Propeller - Rudder �� �� 8.75 1.0 0.095 FHR (52.667) 1.2 5415 3a) Bare hull 20.3 kn (0.280) - Bilge keels � � �� 20.3 1.0 0.280 IIHR (46.588) ∞ 3b) Ap- pended (5415M) 30.0 kn (0.413) - Twin propel- lers - Twin open- shafts with A- brackets - Twin rudders - Bilge keels - Stabilzer fins (passive) �� �� 18.0 15.0 0.6 0.5 0.248 0.207 MARIN (35.480) ∞ 1) Hull geometries, lines, appendages, propeller data, and etc. are downloadable from SIMMAN 2014 Workshop home page (www.simman2014.dk ). 2) Froude number based on � �� . 3) Degree of freedom of ship motion � �� �� : Free to heave and pitch, roll fixed � �� �� : Fixed at the dynamic sinkage and trim 4) PMM test results to be compared with CFD simulation results 5) Scale ratio 6) Water depth to draught ratio to indicate deep or shallow water 2. Coordinate System The coordinate system and sign convention is a right-handed, horizontal, body-fixed coordinate system with x positive forward of mid-ship, y positive starboard of center line and z positive down from waterline.
Transcript of Instructions for CFDBased Method - SIMMAN 2014 · Instructions for CFDBased Method SIMMAN 2014 Rev....

InstructionsforCFDBasedMethodSIMMAN 2014
Rev.5.0.0,June2014 Page1
1. HullFormsandSimulationConditionsHull
form1) Test case Approach
speed �� (��) 2)
Appendages CFD Simulation condition EFD Data4)
( � )5)
h/T6)
DOF3)
��
(kn)
�
�� ��2)
KVLCC2 App. 15.5 kn
(0.142)
Propeller
Rudder
���� 15.5 1.0 0.142 HMRI
(46.426) ∞
App. 7.0 kn
(0.063)
Propeller
Rudder
���� 7.0 1.0 0.063 FHR
(75.000)
1.2
Bare 7.0 kn
(0.063)
Propeller
Rudder
���� 7.0 1.0 0.063 FHR
(75.000)
1.2
KCS 2) KCS 24.0 kn
(0.260)
Propeller
Rudder
���� 18.6 0.775 0.202 FORCE
(52.667) ∞
2) KCS 8.75 kn
(0.095)
Propeller
Rudder
���� 8.75 1.0 0.095 FHR
(52.667)
1.2
5415 3a) Bare
hull
20.3 kn
(0.280)
Bilge keels ���� 20.3 1.0 0.280 IIHR
(46.588) ∞
3b) Ap
pended
(5415M)
30.0 kn
(0.413)
Twin propel
lers
Twin open
shafts with A
brackets
Twin rudders
Bilge keels
Stabilzer fins
(passive)
���� 18.0
15.0
0.6
0.5
0.248
0.207
MARIN
(35.480) ∞
1) Hull geometries, lines, appendages, propeller data, and etc. are downloadable from SIMMAN 2014 Workshop
home page (www.simman2014.dk). 2)
Froude number based on ���. 3)
Degree of freedom of ship motion
� ���� : Free to heave and pitch, roll fixed
� ���� : Fixed at the dynamic sinkage and trim 4)
PMM test results to be compared with CFD simulation results 5)
Scale ratio 6)
Water depth to draught ratio to indicate deep or shallow water
2. CoordinateSystemThe coordinate system and sign convention is a righthanded, horizontal, bodyfixed coordinate
system with x positive forward of midship, y positive starboard of center line and z positive down from
waterline.

InstructionsforCFDBasedMethodSIMMAN 2014
Rev.5.0.0,June2014 Page2
Static tests Dynamic tests Forces and moment
3. PMMMotionParametersPrescribed motions in which the heading �, the surge, �, sway, �, and yaw, �, velocities and the
surge �� , sway, �� , and yaw, �� , accelerations (in the ships local (x, y) coordinate system) are known to any given time. The motion parameters can be described by the sway amplitude, ��, the yaw motion amplitude, ��, the number of PMM rotations per minute, N, and the drift angle, �.
1) PMM yaw motion
o Heading angle � � ��� cos ����
���� � �
o Yaw rate ���� � �� ����
��� sin����
����
o Yaw acceleration ����� � �� ����
����cos �
���
����
2) PMM sway motion
o Transverse translation ���� � ��� sin����
����
o Transverse velocity ���� � ��� ����
��� cos ����
����
o Transverse acceleration ����� � �� ����
����sin �
���
����
3) Motions in the ship fixed coordinate system
o Surge velocity � � �� cos� � ���� sin�
o Surge acceleration �� � ����� sin� � ������ cos� � �� sin��
o Sway velocity � � ���� cos� � �� sin�
o Sway acceleration �� � ����� cos� � ���� cos� � ���� sin��
o Yaw rate � � ����
o Yaw acceleration �� � �����
InstructionsforCFDBasedMethodSIMMAN 2014
Rev.5.0.0,June2014 Page3
4) Nondimensional motion parameters (� � √�� � �� )
o �� � �
�
o �� � ��� ����
o �� � �
�
o �� � � ������
o �� � �����
o �� � � ������
��
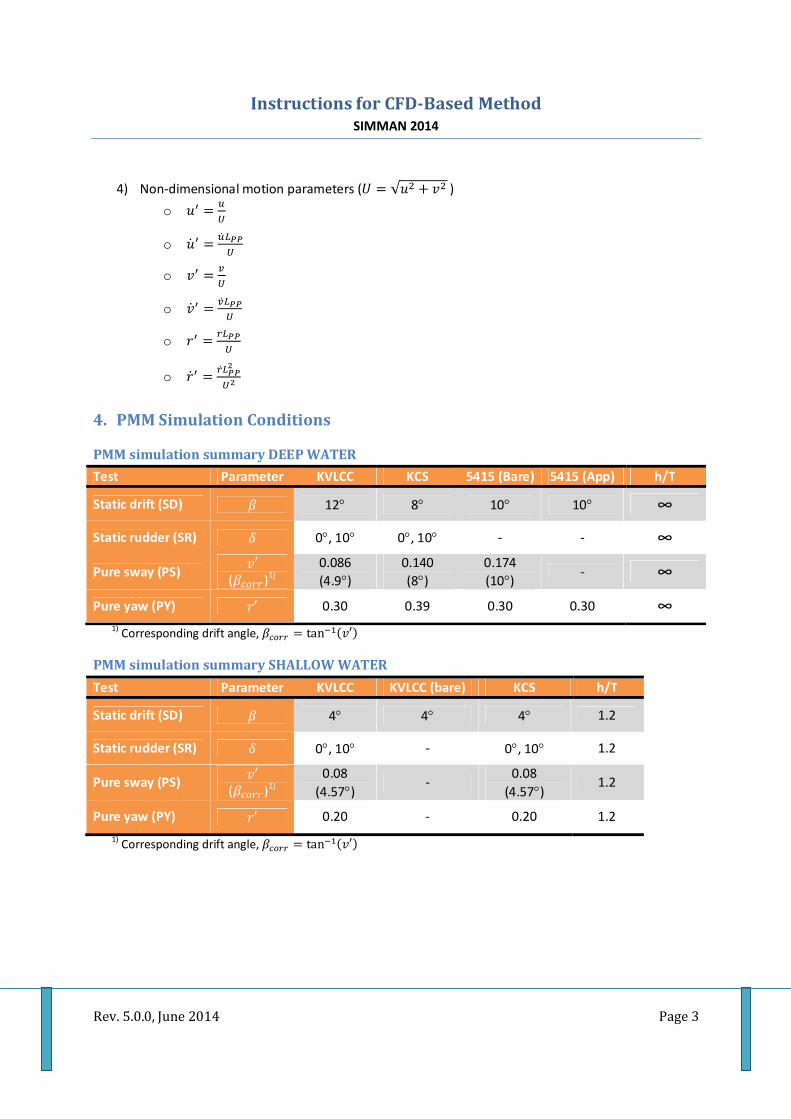
4. PMMSimulationConditions
PMMsimulationsummaryDEEPWATER
Test Parameter KVLCC KCS 5415 (Bare) 5415 (App) h/T
Static drift (SD) � 12� 8� 10� 10� ∞
Static rudder (SR) � 0�, 10� 0�, 10� ∞
Pure sway (PS) �′
(����� )1)
0.086
(4.9�) 0.140
(8�) 0.174
(10�) ∞
Pure yaw (PY) �′ 0.30 0.39 0.30 0.30 ∞
1) Corresponding drift angle, ����� � tan����′�
PMMsimulationsummarySHALLOWWATER
Test Parameter KVLCC KVLCC (bare) KCS h/T
Static drift (SD) � 4� 4� 4� 1.2
Static rudder (SR) � 0�, 10� 0�, 10� 1.2
Pure sway (PS) �′
(����� )1)
0.08
(4.57�)
0.08
(4.57�) 1.2
Pure yaw (PY) �′ 0.20 0.20 1.2
1) Corresponding drift angle, ����� � tan����′�
InstructionsforCFDBasedMethodSIMMAN 2014
Rev.5.0.0,June2014 Page4
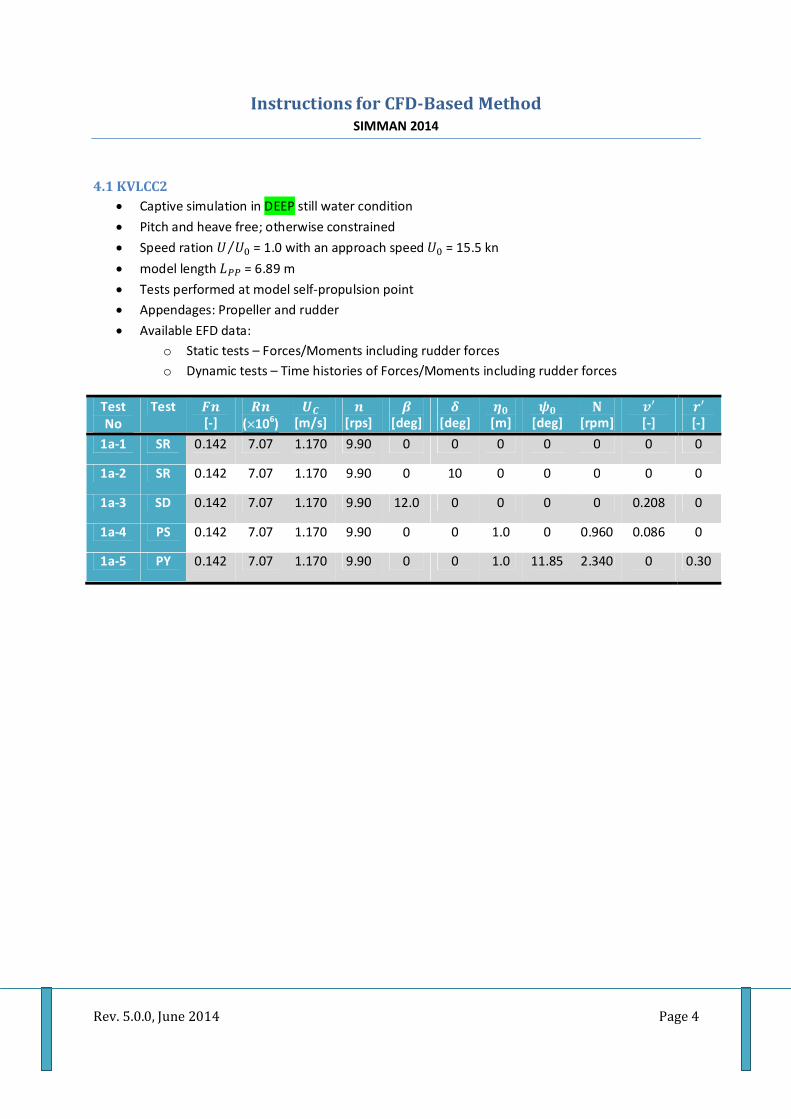
4.1KVLCC2� Captive simulation in DEEP still water condition
� Pitch and heave free; otherwise constrained
� Speed ration � ��⁄ = 1.0 with an approach speed �� = 15.5 kn
� model length ��� = 6.89 m
� Tests performed at model selfpropulsion point
� Appendages: Propeller and rudder
� Available EFD data:
o Static tests – Forces/Moments including rudder forces
o Dynamic tests – Time histories of Forces/Moments including rudder forces
Test
No
Test �� [-]
��
( 106)
�� [m/s]
� [rps]
� [deg]
� [deg]
�� [m]
�� [deg]
� [rpm]
�′ [-]
�′ [-]
1a-1 SR 0.142 7.07 1.170 9.90 0 0 0 0 0 0 0
1a-2 SR 0.142 7.07 1.170 9.90 0 10 0 0 0 0 0
1a-3 SD 0.142 7.07 1.170 9.90 12.0 0 0 0 0 0.208 0
1a-4 PS 0.142 7.07 1.170 9.90 0 0 1.0 0 0.960 0.086 0
1a-5 PY 0.142 7.07 1.170 9.90 0 0 1.0 11.85 2.340 0 0.30

InstructionsforCFDBasedMethodSIMMAN 2014
Rev.5.0.0,June2014 Page5
� Captive simulation in SHALLOW still water condition
� Pitch and heave free; otherwise constrained
� Speed ratio � ��⁄ = 1.0 with an approach speed �� = 7.0 kn
� model length ��� = 4.2667 m
� Water depth: h/T = 1.2
� Width of basin: 7.0 m (USE this as width of computational domain in model scale!)
� Tests performed at model selfpropulsion point
� Appendages: Propeller and rudder
� Available EFD data:
o Static tests – Forces/Moments including rudder forces
o Dynamic tests – Time histories of Forces/Moments including rudder forces
Test
No
Test �� [-]
��
( 106)
�� [m/s]
� [rps]
� [deg]
� [deg]
�� [m]
�� [deg]
� [rpm]
�′ [-]
�′ [-]
1b-1 SR 0.063 2.0 0.416 6.67 0 0 0 0 0 0 0
1b-2 SR 0.063 2.0 0.416 6.67 0 10 0 0 0 0 0
1b-3 SD 0.063 2.0 0.416 6.67 4.0 0 0 0 0 0.070 0
1b-4 PS 0.063 2.0 0.416 6.67 0 0 0.2 0 1.587 0.080 0
1b-5 PY 0.063 2.0 0.416 6.67 0 0 0.647 10.00 1.067 0 0.20
� (BARE HULL) Captive simulation in SHALLOW still water condition
� Pitch and heave free; otherwise constrained
� Speed ratio � ��⁄ = 1.0 with an approach speed �� = 7.0 kn
� model length ��� = 4.2667 m
� Water depth: h/T = 1.2
� Width of basin: 7.0 m (USE this as width of computational domain in model scale!)
� Appendages: BARE
� Available EFD data:
o Static tests – Forces/Moments
Test
No
Test ��
[-]
��
( 106)
��
[m/s]
�
[rps]
�
[deg]
�
[deg]
��
[m]
��
[deg]
��
[sec]
��
[sec]
�′ [-]
�′ [-]
1c-1 SR 0.063 2.0 0.416 4 0.070

InstructionsforCFDBasedMethodSIMMAN 2014
Rev.5.0.0,June2014 Page6
4.2KCS� Captive simulation in DEEP still water condition
� Pitch and heave free; otherwise constrained
� Speed ratio � ��⁄ = 0.775 with an approach speed �� = 24.0 kn
� model length ��� = 4.3671 m
� Propeller selfpropulsion point: refer to EFD data descriptions on SIMMAN web page
� Appendages: Propeller and rudder
� Available EFD data:
o Static tests – Forces/Moments including rudder force/moment
o Dynamic tests – Time histories of Forces/Moments including rudder force
Test
No
Test �� [-]
��
( 106)
�� [m/s]
� [rps]
� [deg]
� [deg]
�� [m]
�� [deg]
� [rpm]
�′ [-]
�′ [-]
2a-1 SR 0.202 4.549 1.318 14.00 0 0 0 0 0 0 0
2a-2 SR 0.202 4.549 1.318 14.00 0 10 0 0 0 0 0
2a-3 SD 0.202 4.549 1.318 14.00 8 0 0 0 0 0.14 0
2a-4 PS 0.202 4.549 1.318 14.00 0 0 0.392 0 4.5 0.14 0
2a-5 PY 0.202 4.549 1.318 14.00 0 0 0.717 14.37 4.5 0 0.39

InstructionsforCFDBasedMethodSIMMAN 2014
Rev.5.0.0,June2014 Page7
� Captive simulation in SHALLOW still water condition
� Pitch and heave free; otherwise constrained
� Speed ratio � ��⁄ = 1.00 with an approach speed �� = 8.75 kn
� model length ��� = 4.3671 m
� Water depth: h/T = 1.2
� Width of basin: 7.0 m (USE this as width of computational domain in model scale!)
� Propeller selfpropulsion point: refer to EFD data descriptions on SIMMAN web page
� Appendages: Propeller and rudder
� Available EFD data:
o Static tests – Forces/Moments including rudder force/moment
o Dynamic tests – Time histories of Forces/Moments including rudder force
Test
No
Test ��
[-]
��
( 106)
��
[m/s]
�
[rps]
�
[deg]
�
[deg]
��
[m]
��
[deg]
�
[rpm]
�′ [-]
�′ [-]
2b-1 SR 0.095 2.139 0.620 5.51 0 0 0 0 0 0 0
2b-2 SR 0.095 2.139 0.620 5.51 0 10 0 0 0 0 0
2b-3 SD 0.095 2.139 0.620 5.51 4.0 0 0 0 0 0.070 0
2b-4 PS 0.095 2.139 0.620 5.51 0 0 0.2 0 2.37 0.080 0
2b-5 PY 0.095 2.139 0.620 5.51 0 0 0.662 10.00 1.55 0 0.20

InstructionsforCFDBasedMethodSIMMAN 2014
Rev.5.0.0,June2014 Page8
4.35415Barehull� Captive simulation in still water condition
� Fixed at the dynamic sinkage and trim (heave/LPP = 1.9209 � 103
& pitch = 0.136�)
� Speed ratio � ��⁄ = 1.0 with an approach speed �� = 20.3 kn
� model length ��� = 3.048 m
� Appendages: Bilge keels
� Available EFD data:
o Static tests – Forces/Moments, Tomographic PIV volume flow data1)
o Dynamic tests – Time histories of Forces/Moments, PIV flow field data1)
Test
No
Test �� []
��
( 106)
�� [m/s]
� [rps]
� [deg]
� [deg]
�� [m]
�� [deg]
� [rpm]
�′ []
�′ []
3a1 SD 0.280 4.4643 1.531 10 0 0 0 0 0.174 0
3a2 PS 0.280 4.4643 1.531 0 0 0.317 0 8.0210 0.174 0
3a3 PY 0.280 4.4643 1.531 0 0 0.327 10.2 8.0210 0 0.30
1) Available PIV data:
� Longitudinal positions (Origin at FP)
o Static drift test: x/LPP = 0.06, 0.1, 0.12, 0.2, 0.4, 0.6, 0.8, 0.935, 1.0
o Pure sway test: � ���⁄ = 0.135, 0.235, 0.735, 0.935
o Pure yaw test: � ���⁄ = 0.135, 0.335, 0.535, 0.735, 0.935, 1.035
o CFD results will be compared only at 0.935 for pure sway test and at 0.335 and 0.935 for
pure yaw test
� PMM Phase angles (Dynamic tests only)
o Pure sway test (deg): 0, 45, 90, 135, 180, 225, 270, 315
o Pure yaw test (deg): 0, 11.25, 22.5, 33.75, 45, 56.25, 67.5, 78.75, 90, 101.25, 112.5,
123.75, 135, 146.25, 157.5, 168.75, 180, 191.25, 202.5, 213.75, 225, 236.25, 247.5,
258.75, 270, 281.25, 292.5, 303.75, 315, 326.25, 227.5, 348.75
o CFD results will be compared only at 0�, 45�, 90�, and 135�
� Measured flow variables
o Velocities: � � �� ��⁄ , � � �� ��⁄ , � � �� ��⁄
o Reynolds stresses: �� � ������ ���⁄ , �� � ����� ��
�⁄ , �� � ������� ���⁄ , �� � ������ ��
�⁄ ,
�� � ������ ���⁄ , �� � ������ ��
�⁄ , �� � ������ ���⁄ , �� � ������ ��
�⁄ (Note: variables �� and ��
are for static drift test only)
o Turbulent kinetic energy: � � �
���� � �� � ���

InstructionsforCFDBasedMethodSIMMAN 2014
Rev.5.0.0,June2014 Page9
o Vorticity: �� � �� ��⁄ � �� ��⁄ , �� � �� ��⁄ � �� ��⁄ , �� � �� ��⁄ � �� ��⁄
where �, � and � are nondimensionalized with ship length, ���. (Note: variables ��
and �� are for static drift test only)o Note: All variables are timeaveraged for static drift test and phaseaveraged for dynam
ic tests

InstructionsforCFDBasedMethodSIMMAN 2014
Rev.5.0.0,June2014 Page10
4.45415MAppended� Captive simulation in still water condition
� Pitch and heave free; otherwise constrained
� Speed ratio � ��⁄ = 0.6 with an approach speed �� = 30.0 kn
� model length ��� = 4.0023 m
� Propeller selfpropulsion point set in model scale
� Note: Pure yaw is run with constant model speed, U. This means that the carriage speed is vary
ing during the test. See motion equations below.
� Appendages:
o Twin openshaft arrangements with Abracket supports
o Twin balanced spade rudders and bilge keels
o Stabilizer fins (Passive)
o Fivebladed right and lefthanded inward rotating twin propellers
� Available EFD data:
o Static tests – Forces/Moments (including force on both rudders)
o Dynamic tests – Time histories of Forces/Moments (including force on both rudders)
Test
No
Test ��
[]
��
( 106)
�
[m/s]
�
[rps]
�
[deg]
�
[deg]
��
[m]
��
[deg]
�
[rpm]
�′ []
�′ []
3b1 SD 0.248 5.19 1.554 10.82 10 0 0 0 0 0.174 0
3b2 ST*
0.248 5.19 1.554 10.82 0 0 0 0 0.3
3b3 PY** 0.248 5.19 1.554 11.02 0 0 22.23 2.86 0 0.3
* ST: Steady turn. ** Pure yaw is run with constant model speed, but variable carriage speed.
1) PMM yaw motion
o Heading angle � � ��� cos ����
���� � �
2) PMM/Carriage surge motion
o Translation velocity ���� � �cos�
3) PMM/Carriage sway motion
o Transverse velocity ���� � � sin�
4) Yaw rate
o Yaw rate � � �� ����
��� sin����
����

InstructionsforCFDBasedMethodSIMMAN 2014
Rev.5.0.0,June2014 Page11
5. DatareductionequationsAll forces are defined in a coordinate system following the ship, meaning that Xcomponents act
in the longitudinal direction of the ship and Ycomponents perpendicular to this direction. The yaw mo
ment is taken with respect to the midship position at ��� 2⁄ .
5.1StatictestsAll forces and moments should be nondimensionalized by the following data reduction equa
tions
�� � ���.����
��� , �� �
���.����
��� , �� � ��
�.����������
��� ���
�.�������
, ��� ���
�.�������
�� � �
�.�������
, �� � �
�.����������
where � is the water density. ��, �� and �� are the total X and Yforces and the yaw moment, respec
tively, �� and �� are the rudder x and yforce, respectively. � and Q are the propeller thrust and torque,
respectively. �� is the model towing speed. �� is the lateral underwater area defined as �� � ��� ⋅ ��.
��� and �� are the length between perpendiculars and the mean draft, respectively. ��� is also used as
the characteristic arm for yaw moment.
5.2DynamictestsAll hydrodynamic forces and moments should be nondimensionalized by the following data re
duction equations
�� ��������0.5�����
��� ����� � �� � �����
0.5��������
�� ��������0.5�����
��� ����� � �� � �����
0.5��������
�� ��������
0.5����������� � ���� � � ⋅ ����� � ���
0.5���������
where � is the water density, � is ship mass, and �� is the longitudinal center of gravity (COG). �� , ��
and �� are the total X and Yforces and the yaw moment, respectively. � � √�� � �� is the ship speed
which varies in the dynamic test. �� is the lateral underwater area defined as �� � ��� ⋅ ��. ��� and

InstructionsforCFDBasedMethodSIMMAN 2014
Rev.5.0.0,June2014 Page12
�� are the length between perpendiculars and the mean draft, respectively. ��� is also used as the
characteristic arm for yaw moment. Note that the transverse COG is assumed to be zero, �� � 0.
6.CFDsimulationresultsubmission
6.1General� Simulation results should be submitted in model scale values.
� SI units should used for all dimensional variables.
� All data file should be submitted in plain text (ASCII) format except for flow field data.
� Flow field data should be submitted in figures conforming instructions 6.4(2). Please put a label
of your affiliation and code name in each of your figure at upper right corner.
6.2FilenameconventionAll data file names should be : Organization_CodeName_ShipName_TestNo_Result.dat (or .zip)
where,
� Organization: Institute name affiliated (ex: IIHR, MOERI, CEHIPAR, etc.)
� CodeName: CFD code name (ex: CFDSHIPIOWA, FLUENT, etc.)
� ShipName: Simulated ship name (ex: KVLCC, KCS, 5415)
� TestNo: Test number simulated (ex: 1b1, 24, 3a3, etc.)
� Result:
o ‘FM’ for force/moment data
o ‘FFn.nnn’ for flow field data
� n.nnn: �/��� such as 0.335 or 0.935.
Examples:
MOERI_WAVIS_KVLCC_1b3_FM.dat Force/moment data of static drift simu
lation for KVLCC2 model using WAVIS
code by MOERI
IIHR_CFDSHIPIOWA_5415_3a3_FF0.935.zip Flow field data of pure yaw simulation
at �/��� = 0.935 for 5415 bare hull
model using CFDHIPIOWA code by IIHR

InstructionsforCFDBasedMethodSIMMAN 2014
Rev.5.0.0,June2014 Page13
6.3StatictestsData should be written as following format:
Affiliation and code name (ex: IIHR, CFDSHIPIOWA)
Ship name and Test number (ex: 5415, 3a3)
Xp = value Yp = value Np = value
Usn of Xp = value Usn of Yp = value Usn of Np = value
Uv of Xp = value Uv of Yp = value Uv of Np = value
E of Xp = value E of Yp = value E of Np = value
Rxp = value Ryp = value
Usn of Rxp = value Usn of Ryp = value
Uv of Rxp = value Uv of Ryp = value
E of Rxp = value E of Ryp = value
Tp = value Qp = value
Usn of Tp = value Usn of Qp = value
Uv of Tp = value Uv of Qp = value
E of Tp = value E of Qp = value
where,
Xp = �′ Yp = �′ Np = �′ Rxp = ��� Ryp = ���
Tp = �′ Qp = �′
Usn, Uv, E : Uncertainty analysis results. Refer to following references.
� QM Section 4.9040101, "Uncertainty Assessment in CFD Methodology"
� QM Section 4.9040102, "Guidelines for RANS Codes"
Unavailable and/or nonapplicable variables should be replaced with “xxx”
Ex: Tp = xxx
InstructionsforCFDBasedMethodSIMMAN 2014
Rev.5.0.0,June2014 Page14
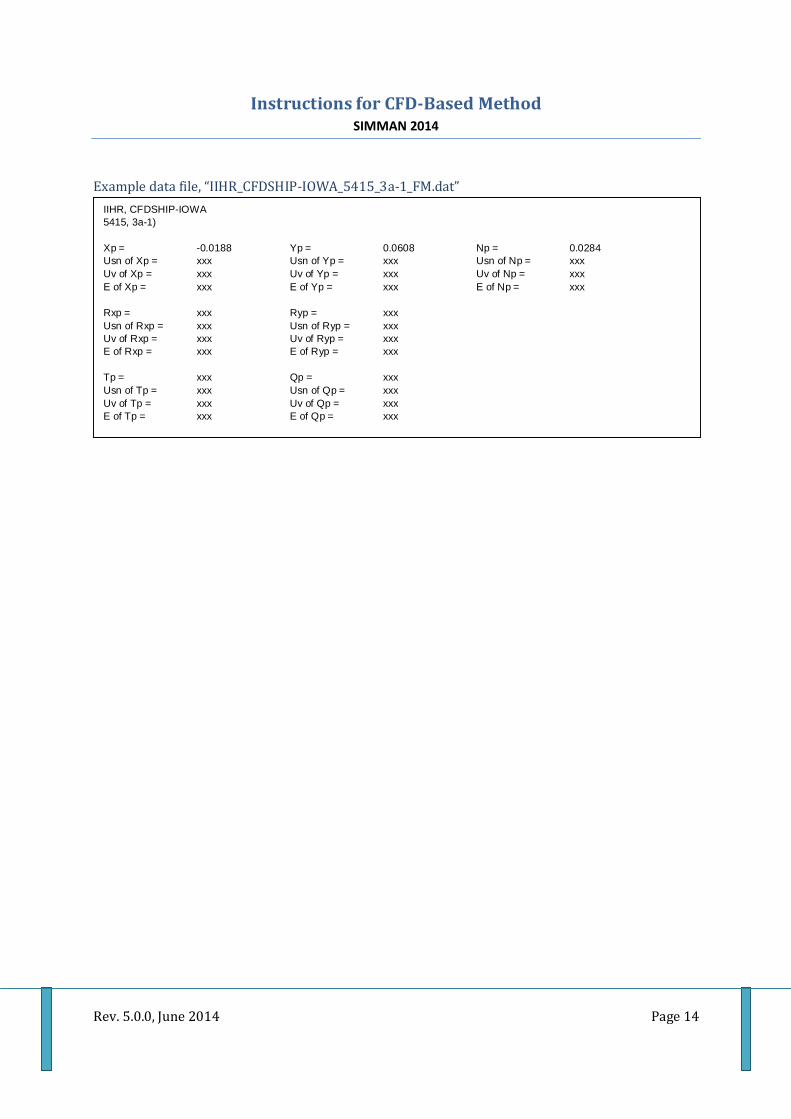
Exampledatafile,“IIHR_CFDSHIPIOWA_5415_3a1_FM.dat”
IIHR, CFDSHIP-IOWA 5415, 3a-1) Xp = -0.0188 Yp = 0.0608 Np = 0.0284 Usn of Xp = xxx Usn of Yp = xxx Usn of Np = xxx Uv of Xp = xxx Uv of Yp = xxx Uv of Np = xxx E of Xp = xxx E of Yp = xxx E of Np = xxx Rxp = xxx Ryp = xxx Usn of Rxp = xxx Usn of Ryp = xxx Uv of Rxp = xxx Uv of Ryp = xxx E of Rxp = xxx E of Ryp = xxx Tp = xxx Qp = xxx Usn of Tp = xxx Usn of Qp = xxx Uv of Tp = xxx Uv of Qp = xxx E of Tp = xxx E of Qp = xxx

InstructionsforCFDBasedMethodSIMMAN 2014
Rev.5.0.0,June2014 Page15
6.4Dynamictests
(1)Force/MomentdataTime series data for one complete PMM cycle should be submitted. Data should be written as
following format:
Line 1: Affiliation and code name (ex: IIHR, CFDSHIPIOWA)
Line 2: Ship name and Test number (ex: 5415, 3a3)
Line 3: List of variables
Line 4 : see following table
Colum Variable Unit Meaning
1 t Nondimensional time, physical time over PMM motion period, �/� 2 eta m Transverse position of the ship, � 3 psi rad Heading of the ship, � 4 u m/s Surge velocity, � 5 v m/s Sway velocity, � 6 r rad/s Yaw rate, � 7 udot m/s2 Surge acceleration, �� 8 vdot m/s2 Sway acceleration, �� 9 rdot rad/s2 Yaw acceleration, ��
10 Xp Nondimensional longitudinal force, �′ 11 Yp Nondimensional transverse force, �′ 12 Np Nondimensional yaw moment, �′ 13 Rxp Nondimensional rudder force, ��� (Not applicable for 5415) 14 Ryp Nondimensional rudder force, ��� (Not applicable for 5415)
15 Tp Nondimensional propeller thrust, �′ (Not applicable for bare hulls) 16 Qp Nondimensional propeller torque, �′ (Not applicable for bare hulls)

InstructionsforCFDBasedMethodSIMMAN 2014
Rev.5.0.0,June2014 Page16
Exampledatafile,“IIHR_CFDSHIPIOWA_5415_3a3_FM.dat”
IIHR, CFDSHIP-IOWA 5415, 3a-3
t, eta, psi, u, v, r, udot, vdot, rdot, Xp, Yp, Np 0.00000 -1.59260 -0.18008 1.55214 0.00069 0.00005 0.00085 -0.00474 0.12547 -0.01711 -0.00102 -0.00329
0.00134 -4.36613 -0.18008 1.55214 0.00064 0.00130 0.00048 -0.00464 0.12552 -0.01710 -0.00112 -0.00340
0.00268 -7.13992 -0.18006 1.55215 0.00060 0.00256 0.00010 -0.00453 0.12557 -0.01710 -0.00121 -0.00351 0.00402 -9.91377 -0.18003 1.55215 0.00055 0.00382 -0.00027 -0.00441 0.12561 -0.01710 -0.00130 -0.00362
0.00536 -12.68747 -0.17998 1.55214 0.00051 0.00507 -0.00065 -0.00428 0.12564 -0.01710 -0.00140 -0.00373
0.00670 -15.46080 -0.17993 1.55213 0.00047 0.00633 -0.00103 -0.00414 0.12567 -0.01710 -0.00149 -0.00383 0.00804 -18.23355 -0.17986 1.55212 0.00043 0.00759 -0.00141 -0.00399 0.12569 -0.01710 -0.00158 -0.00394 0.00938 -21.00551 -0.17978 1.55210 0.00039 0.00884 -0.00179 -0.00383 0.12571 -0.01710 -0.00167 -0.00405
0.01072 -23.77647 -0.17968 1.55208 0.00035 0.01010 -0.00218 -0.00366 0.12572 -0.01710 -0.00176 -0.00415 0.01206 -26.54620 -0.17957 1.55206 0.00032 0.01135 -0.00256 -0.00349 0.12572 -0.01710 -0.00185 -0.00426
0.01340 -29.31450 -0.17945 1.55203 0.00028 0.01261 -0.00295 -0.00330 0.12571 -0.01711 -0.00194 -0.00437
0.01474 -32.08115 -0.17932 1.55200 0.00025 0.01387 -0.00333 -0.00311 0.12570 -0.01710 -0.00203 -0.00448 0.01608 -34.84592 -0.17917 1.55197 0.00022 0.01513 -0.00372 -0.00291 0.12568 -0.01711 -0.00212 -0.00458
0.01742 -37.60860 -0.17902 1.55193 0.00019 0.01638 -0.00411 -0.00271 0.12566 -0.01711 -0.00221 -0.00469

InstructionsforCFDBasedMethodSIMMAN 2014
Rev.5.0.0,June2014 Page17
(2)Flowfielddata(onlyfor5415barehullcase)
Filenameconvention:Organization_CodeName_5415_Test_FigName_LongiPos_Phase.tif
where,
� Organization: Institute name affiliated (ex: IIHR, MOERI, CEHIPAR, etc.)
� CodeName: CFD code name (ex: CFDSHIPIOWA, FLUENT, etc.)
� Test: Test number simulated
o ‘PS’ : Pure sway test
o ‘PY’ : Pure yaw test
� FigName: Figure name
o ‘U’: Axial velocity contours and cross flow vectors
o ‘V’: Transverse velocity contours
o ‘W’: Vertical velocity contours
o ‘k’ : Turbulent kinetic energy contours
o ‘wx’: Axial vorticity contours
� LongiPos: Longitudinal location
o ‘0335’ : �/��� = 0.335 (Pure yaw test only)
o ‘0935’ : �/��� = 0.935 (Pure sway and pure yaw tests)
� Phase: PMM motion phase, �, in degree
o ‘000’ : � = 0� o ‘045’ : � = 45� o ‘090’ : � = 90� o ‘135’ : � = 135� o ‘999’ : Static drift test
Examples:MOERI_WAVIS_5415_PS_U_0935_000.tif Axial velocity contour and transverse
velocity vectors of pure sway simulation
at � ���⁄ = 0.935 and PMM phase 0� us
ing WAVIS code by MOERI
IIHR_CFDSHIPIOWA_5415_PY_k_0335_045.tif Turbulent kinetic energy contours of
pure yaw simulation at �/��� = 0.335
and PMM phase 45� using CFDHIP
IOWA code by IIHR

InstructionsforCFD-BasedMethodSIMMAN 2014
Rev.5.0.0,June2014 Page18
A. Static drift test plots
1) General a. Plot Type = CARTESIAN2D b. Frame Layout Size = Width/Height = 4/3 (e.g., Width = 12 and Height = 8) Border = Off c. Axis Axis\X Range = -0.12 � 0.12 Axis\Y Range = -0.10 � 0.06 Area\Viewpoint Position (%) = Left 5; Right 95; Top 95; Bottom 5 Line\Align Axis with = X(Y) Value; X(Y)-Axis Value = 0 All other parameters = Best values for each CFD code results d. Contour plots Contour Type = Flood
Coloring = Banded Color Map = Small Rainbow d. Font size Best sizes for the exported plots
All the plots will be re-sized for a 3-inch width (76.2 mm) in a WORD document e. Add Geometry Put a dotted box to highlight the EFD data region Use the provided TECPLOT Geometry files (e.g., EFD_Box_x=0935.dat)
2) Axial velocity � contours with streamlines a. Contours Level Range = 0 � � � 1.0 Number of Levels = 21
Legend: Alignment = Horizontal Anchor = Top right corner Position: X = 100%, Y = 95% (or the best position) Level skip = 4
Box = No b. Streamlines Use Tecplot default values (e.g., Black color with line thickness 0.1%)
Example: �/� = 0.935

InstructionsforCFD-BasedMethodSIMMAN 2014
Rev.5.0.0,June2014 Page19
3) Turbulent kinetic energy a. Contours Level Range = 0 � � � 0.02 Number of Levels = 21
Legend: Alignment = Horizontal Anchor = Top right corner Position: X = 100%, Y = 95% (or the best position) Level skip = 4
Box = No Example: �/� = 0.935
4) Vorticity a. Contours Level Range = -30 � (��, ��, ��) � 30 Number of Levels = 21
Legend: Alignment = Horizontal Anchor = Top right corner Position: X = 100%, Y = 95% (or the best position) Level skip = 4
Box = No Example:�/� = 0.935
3. Volume-flow Plots (by using Tecplot)

InstructionsforCFD-BasedMethodSIMMAN 2014
Rev.5.0.0,June2014 Page20
<< TBD >> B. Dynamic test plots
Fig. 1 Axial velocity contours and cross flow vectors
Horizontalaxis variable and range �0.1 � � ���⁄ � 0.1
Verticalaxis variable and range �0.08 � � ���⁄ � 0.053
Contour levels 0.5 � � � 1.0 , Δ� � 0.05
Tecplot setups Frame size = 9 � 6 [paper ruler units]
Axis area/viewport position(%): Left 10, Right 95, Top 95, Bot
tom 10
Export image: Tiff format, width = 800
Style (Tecplot) Contour with Flood & Line option
Contour line color and size: black, 0.1%
Vectors size = 0.025 relative (Grid units/ Magnitude)
Vector line color and size : black, 0.1%
Fig. 2 Transverse velocity contours
Horizontalaxis variable and range �0.1 � � ���⁄ � 0.1
Verticalaxis variable and range �0.08 � � ���⁄ � 0.053
Contour levels �0.2 � � � 0.2 , Δ� � 0.05
Tecplot setups Frame size = 9 � 6 [paper ruler units]
Axis area/viewport position(%): Left 10, Right 95, Top 95, Bot
tom 10
Export image: Tiff format, width = 800
Style (Tecplot) Contour with Flood & Line option
Contour line color and size: black, 0.1%
Fig.3 Vertical velocity contours
Horizontalaxis variable and range �0.1 � � ���⁄ � 0.1
Verticalaxis variable and range �0.08 � � ���⁄ � 0.053
Contour levels �0.2 � � � 0.2 , Δ� � 0.05
Tecplot setups Frame size = 9 � 6 [paper ruler units]
Axis area/viewport position(%): Left 10, Right 95, Top 95, Bot
tom 10
Export image: Tiff format, width = 800
Style (Tecplot) Contour with Flood & Line option
Contour line color and size: black, 0.1%

InstructionsforCFD-BasedMethodSIMMAN 2014
Rev.5.0.0,June2014 Page21
Fig.4 Turbulent kinetic energy contours
Horizontalaxis variable and range �0.1 � � ���⁄ � 0.1
Verticalaxis variable and range �0.08 � � ���⁄ � 0.053
Contour levels k = 0.001, 0.002, 0.003, 0.004, 0.005, 0.006, 0.008, 0.01, 0.02
Tecplot setups Frame size = 9 � 6 [paper ruler units]
Axis area/viewport position(%): Left 10, Right 95, Top 95, Bot
tom 10
Export image: Tiff format, width = 800
Style (Tecplot) Contour with Flood & Line option
Contour line color and size: black, 0.1%
Fig.5 Axial vorticity contours
Horizontalaxis variable and range �0.1 � � ���⁄ � 0.1
Verticalaxis variable and range �0.08 � � ���⁄ � 0.053
Contour levels �� = 120, 50, 20, 15, 10, 5, 5, 10, 15, 20, 50, 120
Tecplot setups Frame size = 9 � 6 [paper ruler units]
Axis area/viewport position(%): Left 10, Right 95, Top 95, Bot
tom 10
Export image: Tiff format, width = 800
Style (Tecplot) Large Rainbow color map
Contour with Flood & Line option
Contour line color and size: black, 0.1%

InstructionsforCFD-BasedMethodSIMMAN 2014
Rev.5.0.0,June2014 Page22
EXAMPLES
Org_Code_5415_PY_U_0135_000.tif Org_Code_5415_PY_V_0135_000.tif
Org_Code_5415_PY_W_0135_000.tif Org_Code_5415_PY_k_0135_000.tif
Org_Code_5415_PY_wx_0135_000.tif