Instruction Manual thermoIMAGER TIM Connect€¦ · Instruction Manual thermoIMAGER TIM Connect....
140
Operating Instructions thermoIMAGER TIM Connect
Transcript of Instruction Manual thermoIMAGER TIM Connect€¦ · Instruction Manual thermoIMAGER TIM Connect....

Operating InstructionsthermoIMAGER TIM Connect
MICRO-EPSILONMESSTECHNIKGmbH & Co. KGKönigbacher Strasse 15
94496 Ortenburg / Germany
Tel. +49 (0) 8542 / 168-0 Fax +49 (0) 8542 / 168-90e-mail [email protected]
Software for thermoIMAGER TIM Infrared camera

thermoIMAGER TIM Connect
Contents
1. Safety ........................................................................................................................................ 71.1 Symbols Used ................................................................................................................................................. 7
2. Technical Data .......................................................................................................................... 82.1 Functional Principle ......................................................................................................................................... 82.2 Functions ......................................................................................................................................................... 8
3. Getting Started ......................................................................................................................... 93.1 Software Installation ........................................................................................................................................ 93.2 Choice of Camera .......................................................................................................................................... 103.3 Choice of Language ...................................................................................................................................... 103.4 Software Window (Example) ......................................................................................................................... 113.5 Menu and Toolbar (Icons) ............................................................................................................................. 15
3.5.1 Menu ............................................................................................................................................. 153.5.2 Toolbar (Icons) .............................................................................................................................. 16
4. Software Configuration .......................................................................................................... 174.1 General Settings ............................................................................................................................................ 17
4.1.1 Color Palettes ............................................................................................................................... 174.1.2 Temperature Unit .......................................................................................................................... 204.1.3 Temperature Range Scaling of Reference Bar............................................................................. 204.1.4 Displayed Frame Rate .................................................................................................................. 224.1.5 Change of the Title Bar ................................................................................................................. 234.1.6 Lock / Unlock Application ............................................................................................................ 234.1.7 Optimization of Software .............................................................................................................. 24
4.2 Software Layout ............................................................................................................................................. 254.2.1 Displayed Windows ...................................................................................................................... 254.2.2 View Bars ...................................................................................................................................... 264.2.3 Information within Image .............................................................................................................. 274.2.4 Temperatures in Digital Displays .................................................................................................. 284.2.5 Layout Managements ................................................................................................................... 294.2.6 Assign / Remove Layouts ............................................................................................................. 304.2.7 Further Information ....................................................................................................................... 324.2.8 Arranging of Thermal Image ........................................................................................................ 324.2.9 Mirroring of Displayed Image ....................................................................................................... 324.2.10 Rotating of Displayed Image ........................................................................................................ 334.2.11 Zooming in Areas of the Displayed Image ................................................................................... 33
thermoIMAGER TIM Connect
4.3 Image Configuration ...................................................................................................................................... 344.3.1 Calibration Files ............................................................................................................................ 344.3.2 Correction of Camera Calibration ................................................................................................ 354.3.3 Detector Heating (Chip Temperature Mode) ................................................................................ 364.3.4 Emissivity, Transmissivity, Ambient Temperature ......................................................................... 374.3.5 Reference Temperature ................................................................................................................ 384.3.6 Changing the Optics (not with TIM 8 TIM 40) .............................................................................. 394.3.7 Changing the Temperature Range ............................................................................................... 404.3.8 Video Formats (Device Framerate) .............................................................................................. 41
4.4 Imager Interfaces for TIM and TIM 40 Camera ............................................................................................. 424.4.1 General ......................................................................................................................................... 424.4.2 Prozessinterface (PIF) for TIM and TIM 40 Camera ..................................................................... 43
4.5 Software Development Kit (SDK) .................................................................................................................. 464.5.1 Interprocess Communication (IPC) .............................................................................................. 464.5.2 COM-Port ...................................................................................................................................... 47
4.6 Start Options .................................................................................................................................................. 484.6.1 Overview of Start Options............................................................................................................. 484.6.2 Start of Multiple Software / Imager Instances .............................................................................. 50
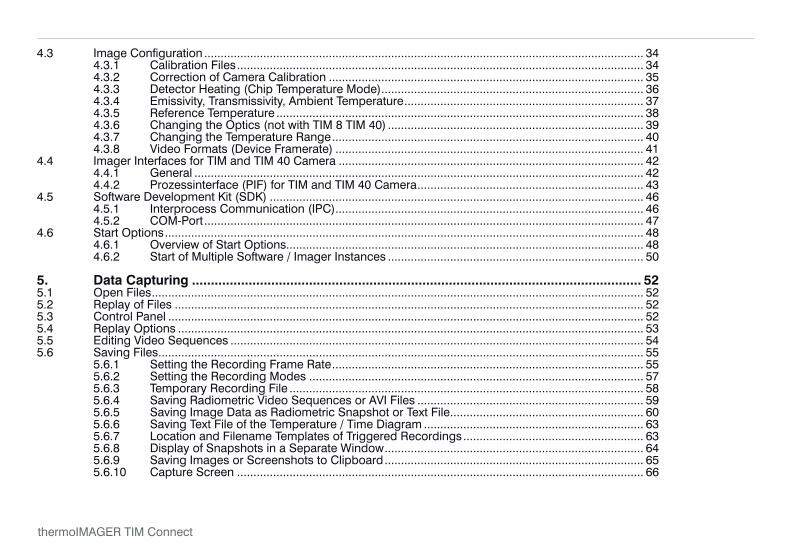
5. Data Capturing ....................................................................................................................... 525.1 Open Files ...................................................................................................................................................... 525.2 Replay of Files ............................................................................................................................................... 525.3 Control Panel ................................................................................................................................................. 525.4 Replay Options .............................................................................................................................................. 535.5 Editing Video Sequences .............................................................................................................................. 545.6 Saving Files .................................................................................................................................................... 55
5.6.1 Setting the Recording Frame Rate ............................................................................................... 555.6.2 Setting the Recording Modes ...................................................................................................... 575.6.3 Temporary Recording File ............................................................................................................ 585.6.4 Saving Radiometric Video Sequences or AVI Files ..................................................................... 595.6.5 Saving Image Data as Radiometric Snapshot or Text File ........................................................... 605.6.6 Saving Text File of the Temperature / Time Diagram ................................................................... 635.6.7 Location and Filename Templates of Triggered Recordings ....................................................... 635.6.8 Display of Snapshots in a Separate Window ............................................................................... 645.6.9 Saving Images or Screenshots to Clipboard ............................................................................... 655.6.10 Capture Screen ............................................................................................................................ 66

thermoIMAGER TIM Connect
6. Data Processing ..................................................................................................................... 686.1 Measure Areas ............................................................................................................................................... 68
6.1.1 General Settings ........................................................................................................................... 686.1.2 Calculated Objects ....................................................................................................................... 726.1.3 Excluding Hot and Cold Spot Areas ............................................................................................ 756.1.4 Individual Emissivity Values of Measure Areas ............................................................................ 76
6.2 Temperature Profile ........................................................................................................................................ 776.3 Temperature Time Diagram ........................................................................................................................... 80
6.3.1 General Settings ........................................................................................................................... 806.3.2 Scaling of Diagram Axes .............................................................................................................. 82
6.4 Histogram ...................................................................................................................................................... 846.5 Extended Measuring Colors .......................................................................................................................... 866.6 Image Subtraction ......................................................................................................................................... 876.7 Relative Extreme Values ................................................................................................................................ 886.8 Alarms ............................................................................................................................................................ 896.9 3D Display of Thermal Image ........................................................................................................................ 916.10 Event Grabber ................................................................................................................................................ 926.11 Zoom Function of Snapshots ........................................................................................................................ 94
7. TIM 8/40 .................................................................................................................................. 957.1 Focus Setting ................................................................................................................................................. 957.2 Imager Interfaces for TIM 8 ............................................................................................................................ 95
7.2.1 General ......................................................................................................................................... 957.2.2 Process Interface (PIF) for TIM 8 .................................................................................................. 97
7.3 IP Settings TIM 8 .......................................................................................................................................... 1017.4 Autonomous Operation TIM 8 ..................................................................................................................... 101
8. Visual Camera (only TIM 200/230) ...................................................................................... 1028.1 Enabling the Visual Camera ........................................................................................................................ 1028.2 Monitoring Modus ........................................................................................................................................ 1038.3 Cross-fading Modus .................................................................................................................................... 104
8.3.1 General ....................................................................................................................................... 1048.3.2 Transparency of Thermal Image ................................................................................................ 1058.3.3 Moving the Thermal within the Visual Image ............................................................................. 1068.3.4 Cross-fading of Defined Temperatures ...................................................................................... 107

thermoIMAGER TIM Connect
9. Line Scanner Mode .............................................................................................................. 1089.1 General Information ..................................................................................................................................... 1089.2 Basic Settings .............................................................................................................................................. 109
9.2.1 Line Scanner Configuration Menu ............................................................................................. 1099.2.2 Choosing the Layout .................................................................................................................. 1099.2.3 Rotating of the Image ................................................................................................................. 1099.2.4 Activating the Line Scanner ........................................................................................................ 1109.2.5 Positioning of the Line (Line Scanner Sighting View) ................................................................ 1109.2.6 Layout Configuration of the Sighting View Mode ...................................................................... 113
9.3 Data Evaluation of the Scanned Line .......................................................................................................... 1149.3.1 Line Scanner View ..................................................................................................................... 1149.3.2 Triggered Display of Lines .......................................................................................................... 1169.3.3 Snapshot Configuration ............................................................................................................. 1209.3.4 Zoom Function of Snapshots ..................................................................................................... 121
10. Merging ................................................................................................................................. 12110.1 General Information ..................................................................................................................................... 12110.2 Direct Connection over USB Port ................................................................................................................ 12210.3 Configuration ............................................................................................................................................... 12210.4 Connection via the Ethernet Network .......................................................................................................... 13010.5 Simultaneous Flag Control and Frame Synchronization via PIF ................................................................ 131
11. Further Information .............................................................................................................. 13311.1 Options ........................................................................................................................................................ 133
11.1.1 Activating Software Messages ................................................................................................... 13311.1.2 Layouts ....................................................................................................................................... 13411.1.3 Device Detected ......................................................................................................................... 13411.1.4 Temperature Unit ........................................................................................................................ 13411.1.5 Log Events .................................................................................................................................. 135
11.2 System Requirements ................................................................................................................................. 13511.2.1 Minimum System Requirements ................................................................................................ 13511.2.2 Recommended System Requirements ...................................................................................... 135
11.3 Information about Software ......................................................................................................................... 13611.4 Extended Configuration ............................................................................................................................... 13711.5 Overview Shortcuts ...................................................................................................................................... 138
12. Liability for Material Defects ............................................................................................... 139

Page 7
thermoIMAGER TIM Connect
1. Safety
The handling of the system assumes knowledge of the instruction manual.
1.1 Symbols Used
The following symbols are used in the instruction manual.
Indicates a situation that may result in property damage if not avoided.
Indicates a user action.
i Indicates a tip for users.
Measure Indicates hardware or a software button/menu

Page 8
Technical Data
thermoIMAGER TIM Connect
2. Technical Data
2.1 Functional Principle
The thermoIMAGER TIM calculates the surface temperature based on the emitted infrared energy of objects. The two-dimensional detector (FPA - focal plain array) or (CMOS - Complementary metal-oxide-semiconduc-tor) allows a measurement depending on the device max. pixels and will be shown as thermographic image using standardized palettes. The radiometric processing of the picture data enables the user to do a comfor-table detailed analysis with the software TIM Connect.
2.2 Functions - Display of the real time thermal image (up to a max. of 1 kHz) with a wide range of measurement functions - Recording function (video, radiometric video, snapshot) - Analysis and post processing of infrared images/ videos - Complete set up of parameters and remote control of the camera
Page 9
Getting Started
thermoIMAGER TIM Connect
3. Getting Started
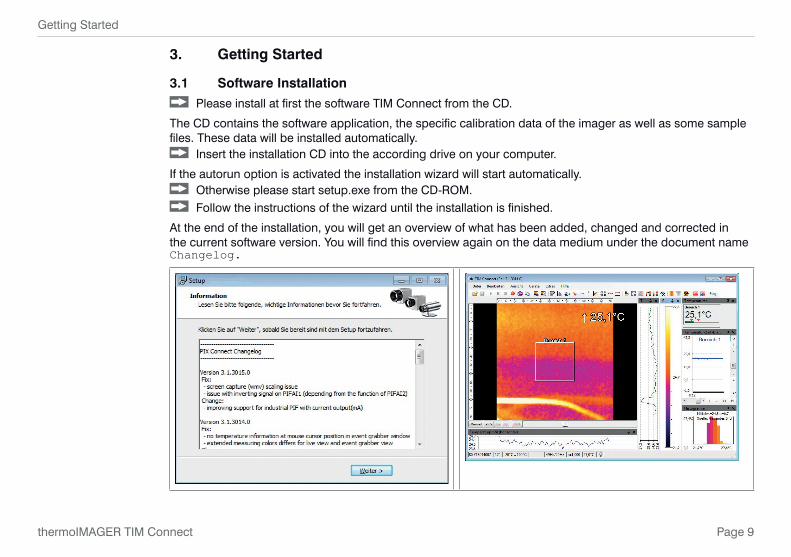
3.1 Software Installation Please install at first the software TIM Connect from the CD.
The CD contains the software application, the specific calibration data of the imager as well as some sample files. These data will be installed automatically.
Insert the installation CD into the according drive on your computer.
If the autorun option is activated the installation wizard will start automatically. Otherwise please start setup.exe from the CD-ROM. Follow the instructions of the wizard until the installation is finished.
At the end of the installation, you will get an overview of what has been added, changed and corrected in the current software version. You will find this overview again on the data medium under the document name Changelog.
Page 10
Getting Started
thermoIMAGER TIM Connect
3.2 Choice of Camera
In case you are using more than one TIM simultaneously (e.g. via USB hub) please select the required TIM from the list in the Devices menu.
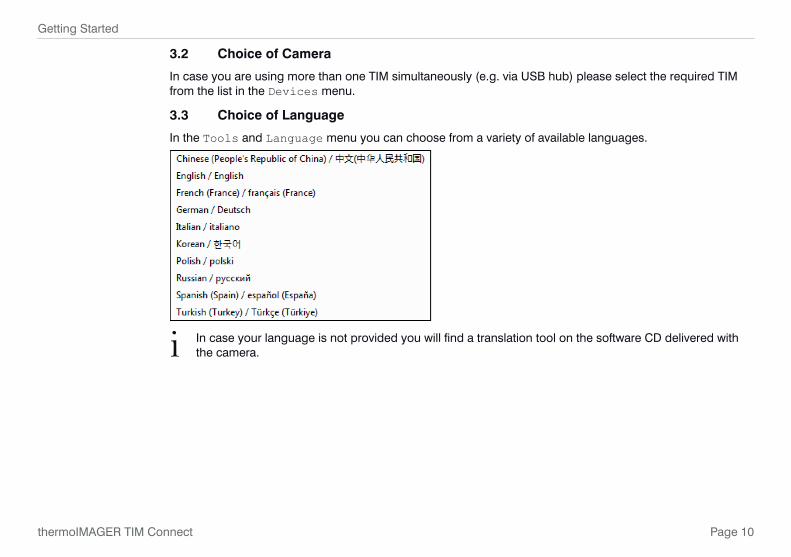
3.3 Choice of Language
In the Tools and Language menu you can choose from a variety of available languages.
i In case your language is not provided you will find a translation tool on the software CD delivered with the camera.
Page 11
Getting Started
thermoIMAGER TIM Connect
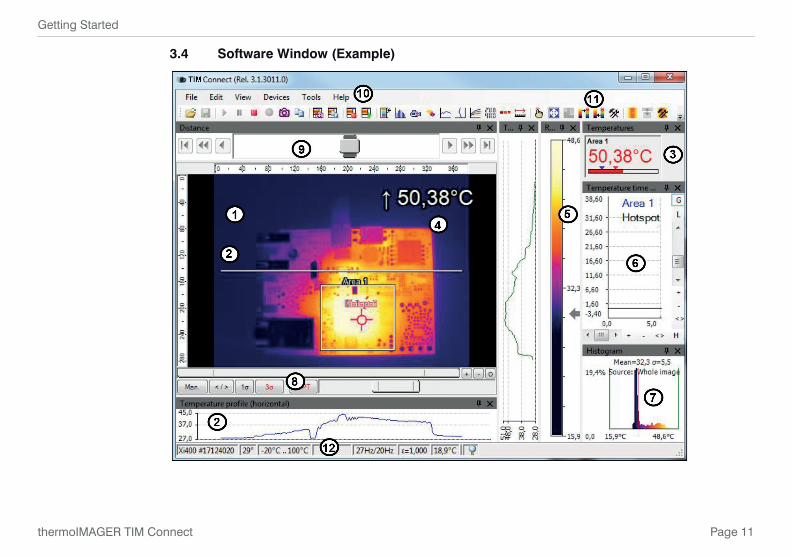
3.4 Software Window (Example)
Page 12
Getting Started
thermoIMAGER TIM Connect
1 IR image from the camera
2 Temperature profile: Shows the temperatures along max. 2 lines at any size and position in the image.
3 Control displays: Displays all temperature values in the defined measure areas like Cold Spots, Hot Spots, temperature at cursor, internal temperature and chip temperature. Alarm settings: Bar showing the defined temperature thresholds for low alarm value (blue arrow) and high alarm value (red arrow). The color of numbers within control displays changes to red (when temp. above the high alarm value) and to blue (when temp. below the low alarm value).
4 Temperature of measure area: Analyses the temperature according to the selected shape, e.g. average temperature of the rectangle. The value is shown inside the IR image and the control displays.
5 Reference bar: Shows the scaling of temperature within the color palette.
6 Temperature time diagram: Shows the temperature curves over time for selectable region of interest (ROI)
7 Histogram: Shows the statistic distribution of single temperature values.
8 Automatic / manual scaling of the palette (displayed temperature range): Man., </> (min, max), 1 s: 1 Sigma, 3 s: 3 Sigma, OPT: Palette optimization
9 Distance function: Adjustment of the motor focus to focus the IR picture (only TIM 8/40)
10 Menu and Toolbar (Icons)
11 Icon enabling switching between color palettes
12 Status bar: Model and serial number, optic, temperature range, cursor position, device framerate/ display framerate, emissivity, ambient temperature, flag status
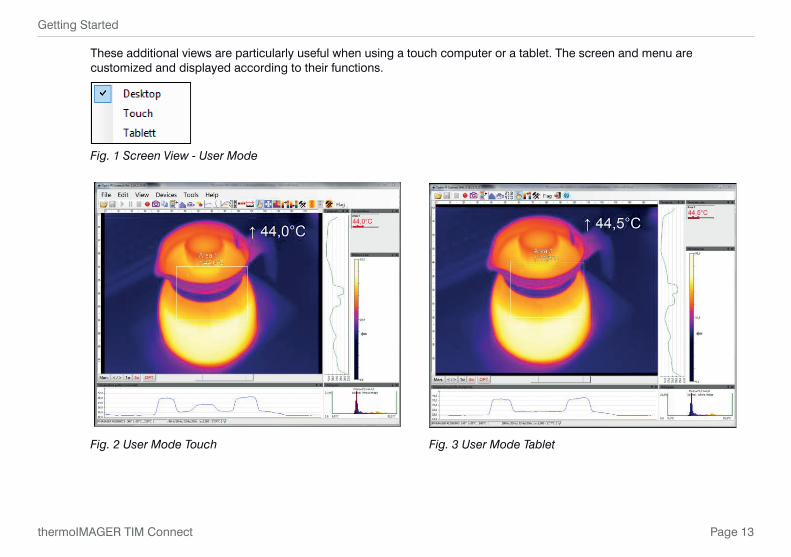
Under View and User Mode you can select between two additional display options. In addition to the Desk-top view, the Touch view or the Tablet view can also be used here, see Fig. 1.
Page 13
Getting Started
thermoIMAGER TIM Connect
These additional views are particularly useful when using a touch computer or a tablet. The screen and menu are customized and displayed according to their functions.
Fig. 1 Screen View - User Mode
Fig. 2 User Mode Touch Fig. 3 User Mode Tablet

Page 14
Getting Started
thermoIMAGER TIM Connect
Fig. 4 Configuration window for User Touch and Tablet
i The User Mode Tablet provides only limited functionality.
Page 15
Getting Started
thermoIMAGER TIM Connect
3.5 Menu and Toolbar (Icons)
3.5.1 Menu
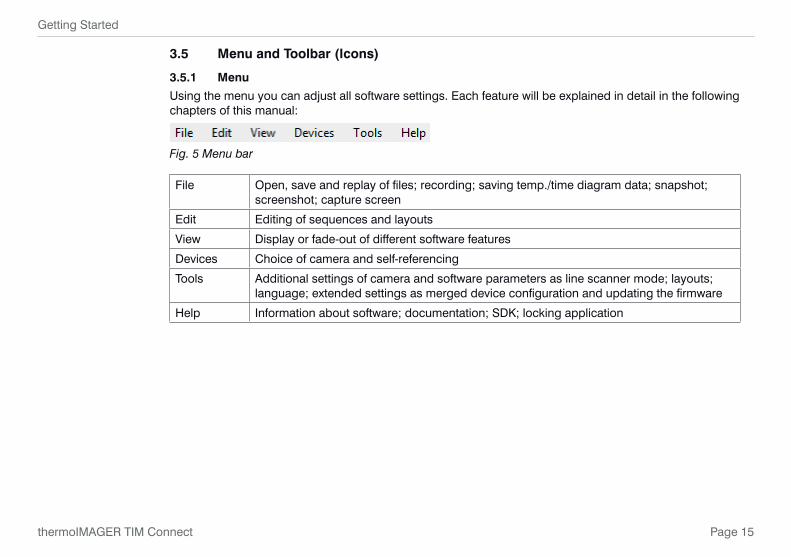
Using the menu you can adjust all software settings. Each feature will be explained in detail in the following chapters of this manual:
Fig. 5 Menu bar
File Open, save and replay of files; recording; saving temp./time diagram data; snapshot; screenshot; capture screen
Edit Editing of sequences and layouts
View Display or fade-out of different software features
Devices Choice of camera and self-referencing
Tools Additional settings of camera and software parameters as line scanner mode; layouts; language; extended settings as merged device configuration and updating the firmware
Help Information about software; documentation; SDK; locking application

Page 16
Getting Started
thermoIMAGER TIM Connect
3.5.2 Toolbar (Icons)
The most important features of the software can be activated directly via the toolbar. You can redesign the toolbar according to your preferences, see Chap. 4.2.2. Available toolbar icons are the following:
Open Visible video Previous palette
Save 3D Chart Configuration
Play Temperature profile (horizontal)
Enable linescanning
Pause Temperature profile (vertical)
Linescanner view Sighting view
Stop Temperature time diagram Linescanner configuration
Record Digital display group Image subtraction
Save snapshot to file Snapshot history Image subtraction from file
Copy snapshot to clipboard Distance Refresh Flag
Save screenshot to file Toggle user mode Acknowledge Alarm
Screenshot to clipboard Full screen Close all tools
Reference bar IR/Visible Fusion Digital display (main measure area)
Histogram Next palette Digital display (mouse cursor)
Toggle Minimum, Mean Value, Maximum
Exit Info
Config merged device Fig. 6 Tool bar

Page 17
Software Configuration
thermoIMAGER TIM Connect
4. Software Configuration
4.1 General Settings
You can activate all here mentioned features in the Tools, Configuration and General menu (except for color palettes).
4.1.1 Color Palettes
In the Tools, Configuration, Measuring colors and Standard palette menu you can choose from a list of color palettes to achieve ideal displaying of the infrared image and the included temperature informa-tion.
Fig. 7 Icons for color palette selection Fig. 8 Dropdown menu Standard palette
In the Tools, Configuration, Measuring colors and Standard palette menu, see Fig. 8, you can choose from a list of color palettes to achieve ideal displaying of the infrared image and the included tem-perature information.
You can also adjust the color palette via the Icon on the toolbar or the menu View and Shift palette.

Page 18
Software Configuration
thermoIMAGER TIM Connect
Available color palettes
Iron Gray (Black = Cold)
Iron Hi Gray (White = Cold)
Rainbow Alarm Red
Rainbow Hi Alarm Green
Rainbow Medical Alarm Blue
Fig. 9 Palette selectionBlue Hi

Page 19
Software Configuration
thermoIMAGER TIM Connect
Palette Iron Palette Rainbow Palette Blue Hi
Palette Rainbow Hi Palette Rainbow Hi Palette Gray (Black = Cold)
Fig. 10 Examples of various color palettes
Page 20
Software Configuration
thermoIMAGER TIM Connect
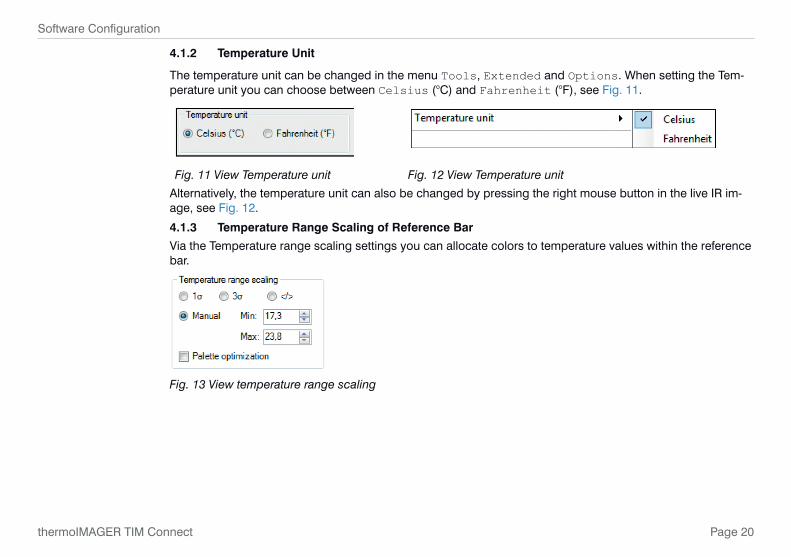
4.1.2 Temperature Unit
The temperature unit can be changed in the menu Tools, Extended and Options. When setting the Tem-perature unit you can choose between Celsius (°C) and Fahrenheit (°F), see Fig. 11.
Fig. 11 View Temperature unit Fig. 12 View Temperature unit
Alternatively, the temperature unit can also be changed by pressing the right mouse button in the live IR im-age, see Fig. 12.
4.1.3 Temperature Range Scaling of Reference Bar
Via the Temperature range scaling settings you can allocate colors to temperature values within the reference bar.
Fig. 13 View temperature range scaling
Page 21
Software Configuration
thermoIMAGER TIM Connect
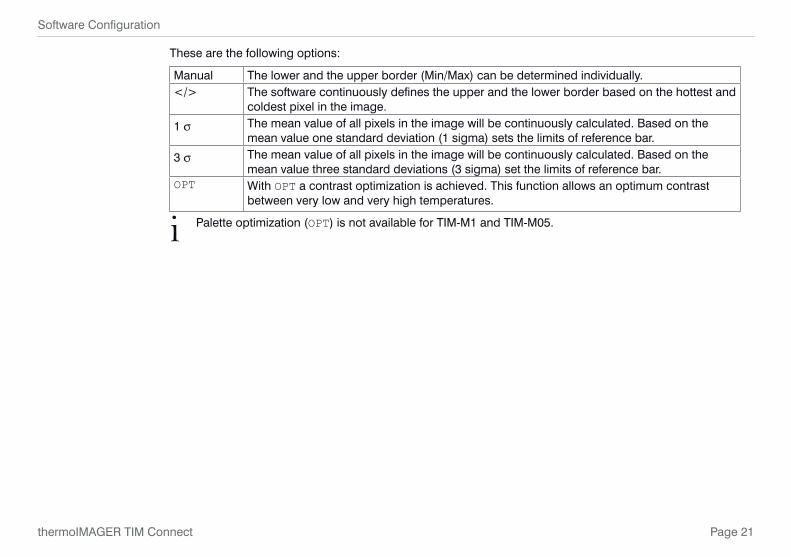
These are the following options:
Manual The lower and the upper border (Min/Max) can be determined individually.</> The software continuously defines the upper and the lower border based on the hottest and
coldest pixel in the image.
1 s The mean value of all pixels in the image will be continuously calculated. Based on the mean value one standard deviation (1 sigma) sets the limits of reference bar.
3 s The mean value of all pixels in the image will be continuously calculated. Based on the mean value three standard deviations (3 sigma) set the limits of reference bar.
OPT With OPT a contrast optimization is achieved. This function allows an optimum contrast between very low and very high temperatures.
i Palette optimization (OPT) is not available for TIM-M1 and TIM-M05.
Page 22
Software Configuration
thermoIMAGER TIM Connect
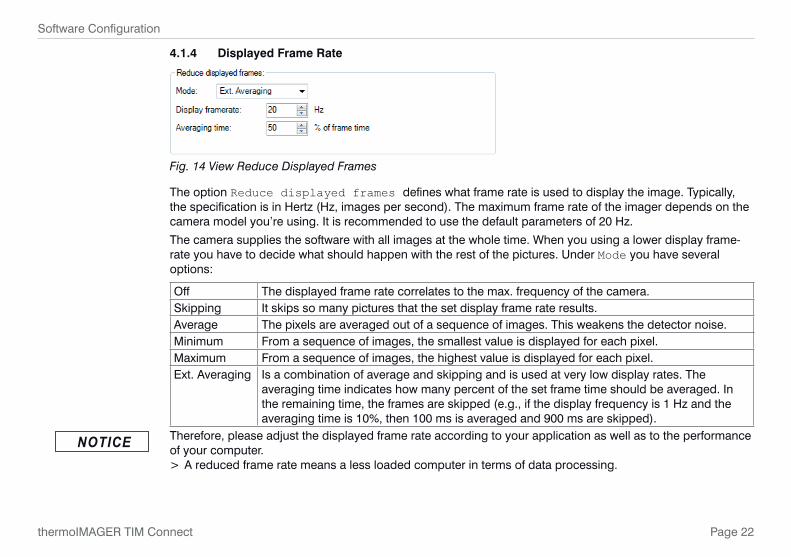
4.1.4 Displayed Frame Rate
Fig. 14 View Reduce Displayed Frames
The option Reduce displayed frames defines what frame rate is used to display the image. Typically, the specification is in Hertz (Hz, images per second). The maximum frame rate of the imager depends on the camera model you’re using. It is recommended to use the default parameters of 20 Hz.
The camera supplies the software with all images at the whole time. When you using a lower display frame-rate you have to decide what should happen with the rest of the pictures. Under Mode you have several options:
Off The displayed frame rate correlates to the max. frequency of the camera.Skipping It skips so many pictures that the set display frame rate results.Average The pixels are averaged out of a sequence of images. This weakens the detector noise.Minimum From a sequence of images, the smallest value is displayed for each pixel.Maximum From a sequence of images, the highest value is displayed for each pixel.Ext. Averaging Is a combination of average and skipping and is used at very low display rates. The
averaging time indicates how many percent of the set frame time should be averaged. In the remaining time, the frames are skipped (e.g., if the display frequency is 1 Hz and the averaging time is 10%, then 100 ms is averaged and 900 ms are skipped).
Therefore, please adjust the displayed frame rate according to your application as well as to the performance of your computer.
> A reduced frame rate means a less loaded computer in terms of data processing.
NOTICE

Page 23
Software Configuration
thermoIMAGER TIM Connect
4.1.5 Change of the Title Bar
The Application title bar option enables the individual setting for an own title name.
The setting Default displays the standard software name TIM Connect. Using the setting User defined you can specify an individual name. The option Instance name is important if starting several cameras and software on one computer. The option Revision name is disabling the display of software version in the title bar.
Fig. 15 View application title bar
4.1.6 Lock / Unlock Application
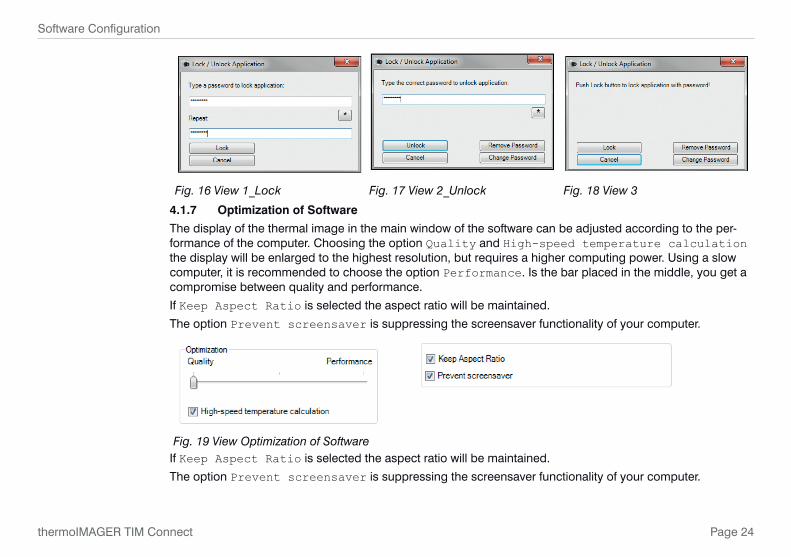
The software offers the possibility to block or unlock the application by entering a password. This is possible under menu Help and Lock / unlock application. Enter a password and repeat it. Then press Lock and the application is locked, see Fig. 16.
The setting options are now all gray in color and they are no longer able to make changes. Only when you go to Help and Lock / unlock application, enter the password and click Unlock, the software will be unlocked again, see Fig. 17.
Remove Password removes the current password and with Change Password a new password can be assigned, see Fig. 18.
If the application should be locked again, the current password remains memorized and a repeated entry of the password is no longer necessary.
Page 24
Software Configuration
thermoIMAGER TIM Connect
Fig. 16 View 1_Lock Fig. 17 View 2_Unlock Fig. 18 View 3
4.1.7 Optimization of Software
The display of the thermal image in the main window of the software can be adjusted according to the per-formance of the computer. Choosing the option Quality and High-speed temperature calculation the display will be enlarged to the highest resolution, but requires a higher computing power. Using a slow computer, it is recommended to choose the option Performance. Is the bar placed in the middle, you get a compromise between quality and performance.
If Keep Aspect Ratio is selected the aspect ratio will be maintained.
The option Prevent screensaver is suppressing the screensaver functionality of your computer.
Fig. 19 View Optimization of SoftwareIf Keep Aspect Ratio is selected the aspect ratio will be maintained.
The option Prevent screensaver is suppressing the screensaver functionality of your computer.

Page 25
Software Configuration
thermoIMAGER TIM Connect
4.2 Software Layout
4.2.1 Displayed Windows
You can individually choose the displayed windows and easily change their positions within the desktop area (drag & drop). To add windows please use the menu item View and Windows.
On the one hand a window can be positioned separately on the screen. On the other hand a window can be set at a fixed position in the software. The location can be determined using the positioning field (mouse over the arrows „above“, „below“, „right“, „left“).
When a window is dragged into another one (mouse has to be placed within title head) both will be merged. You can switch between them using the tab provided.
Fig. 20 Tool bar Fig. 21 Separate window and window with positioning field to place it into the software individually

Page 26
Software Configuration
thermoIMAGER TIM Connect
4.2.2 View Bars
For individual display of software you can show or hide single bars in the software window.
There is the possibility to Show all bars or Hide all bars by one click.
Fig. 22 View bars
i All icons shown on the toolbar can be individually selected via the option Customize tool bar, see Chap. 3.5.2

Page 27
Software Configuration
thermoIMAGER TIM Connect
4.2.3 Information within ImageUsing the menu View and Image Information you can decide, which information you would like to see inside the infrared image window.Via Reference bar you can set the position of the temperature scale within the infrared image window.
Fig. 23 View information within Image
The menu item Use contrast color can be used for highlighting particular information within the IR im-age.
Page 28
Software Configuration
thermoIMAGER TIM Connect
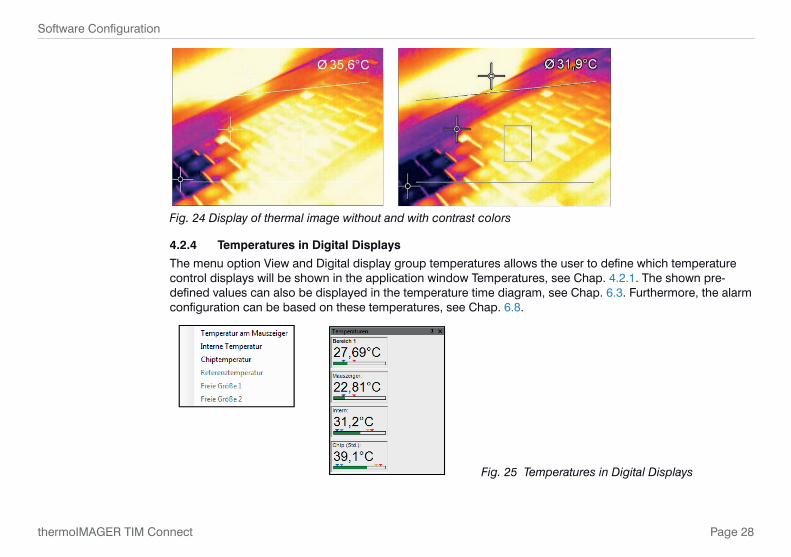
Fig. 24 Display of thermal image without and with contrast colors
4.2.4 Temperatures in Digital Displays
The menu option View and Digital display group temperatures allows the user to define which temperature control displays will be shown in the application window Temperatures, see Chap. 4.2.1. The shown pre-defined values can also be displayed in the temperature time diagram, see Chap. 6.3. Furthermore, the alarm configuration can be based on these temperatures, see Chap. 6.8.
Fig. 25 Temperatures in Digital Displays

Page 29
Software Configuration
thermoIMAGER TIM Connect
4.2.5 Layout ManagementsIn the menu item Tools and Layout you can manage pre-designed or your own image layouts. If you want to use an alternative layout you must activate it under Load layout. You can save your own layouts with user-defined names.
Fig. 26 View layout management
i Before you click Save layout you must add new layout name into the field provided, see Fig. 27.
Fig. 27 View layout examples
Page 30
Software Configuration
thermoIMAGER TIM Connect
4.2.6 Assign / Remove Layouts
In the menu item Edit and Assign layout to current file you can save files with a new layout set-ting. Using Remove layout from current file it is possible to configure a file in a way that it has no associated layout pattern.
i To confirm the changes as explained above you must always save the file.
Please use the menu File and Save or the Icon on the toolbar.

Page 31
Software Configuration
thermoIMAGER TIM Connect
Under Tools, Configuration and Extended Layout, created layouts can be assigned to specific device types. These layouts are then only visible for the selected device types.
Page 32
Software Configuration
thermoIMAGER TIM Connect
4.2.7 Further Information
Independent whether other programs are running on your PC the TIM Connect software can always be kept in the foreground.
To activate this feature please use View and Always on top.
All other applications will now run in the background.
The thermal image of the main window can be displayed in a full screen mode.
Please use the menu View and Full screen or the Icon on the toolbar to change the display size.
4.2.8 Arranging of Thermal Image
The thermal image within the main window of the software can be displayed in various ways using the menu Tools, Configuration and IR Image arranging.
4.2.9 Mirroring of Displayed Image
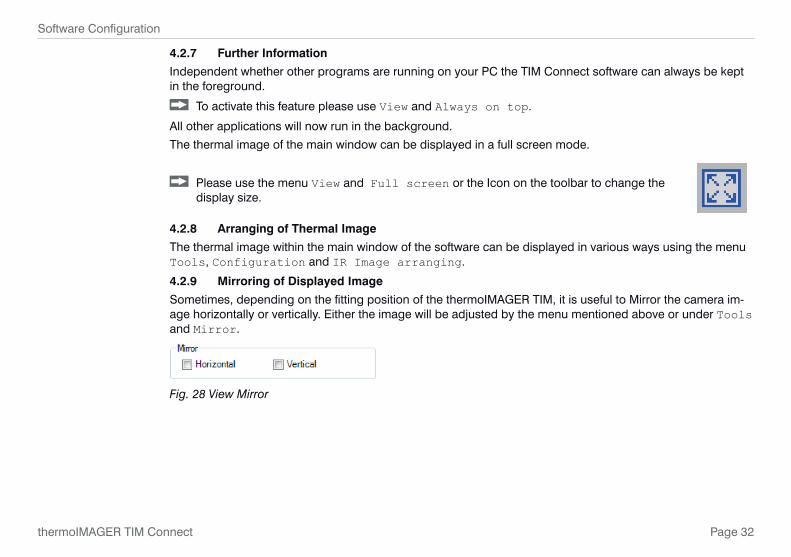
Sometimes, depending on the fitting position of the thermoIMAGER TIM, it is useful to Mirror the camera im-age horizontally or vertically. Either the image will be adjusted by the menu mentioned above or under Tools and Mirror.
Fig. 28 View Mirror
Page 33
Software Configuration
thermoIMAGER TIM Connect
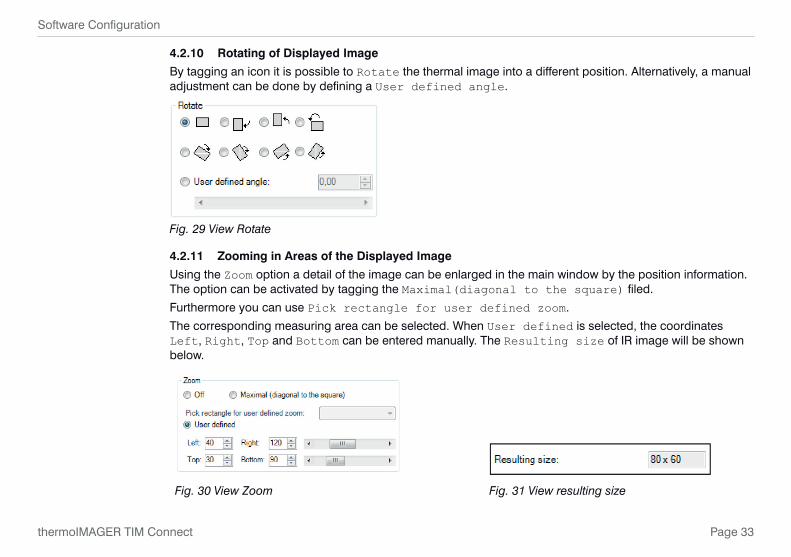
4.2.10 Rotating of Displayed Image
By tagging an icon it is possible to Rotate the thermal image into a different position. Alternatively, a manual adjustment can be done by defining a User defined angle.
Fig. 29 View Rotate
4.2.11 Zooming in Areas of the Displayed Image
Using the Zoom option a detail of the image can be enlarged in the main window by the position information. The option can be activated by tagging the Maximal(diagonal to the square) filed.
Furthermore you can use Pick rectangle for user defined zoom.
The corresponding measuring area can be selected. When User defined is selected, the coordinates Left, Right, Top and Bottom can be entered manually. The Resulting size of IR image will be shown below.
Fig. 30 View Zoom Fig. 31 View resulting size
Page 34
Software Configuration
thermoIMAGER TIM Connect
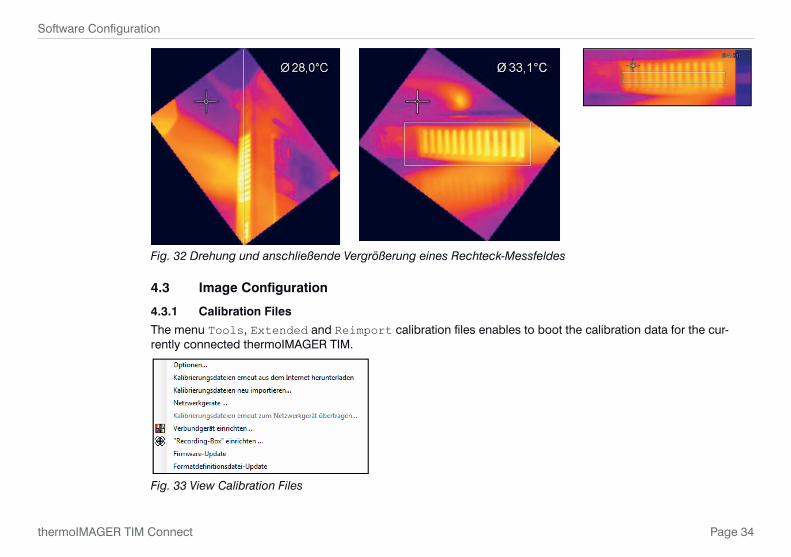
Fig. 32 Drehung und anschließende Vergrößerung eines Rechteck-Messfeldes
4.3 Image Configuration
4.3.1 Calibration Files
The menu Tools, Extended and Reimport calibration files enables to boot the calibration data for the cur-rently connected thermoIMAGER TIM.
Fig. 33 View Calibration Files
Page 35
Software Configuration
thermoIMAGER TIM Connect
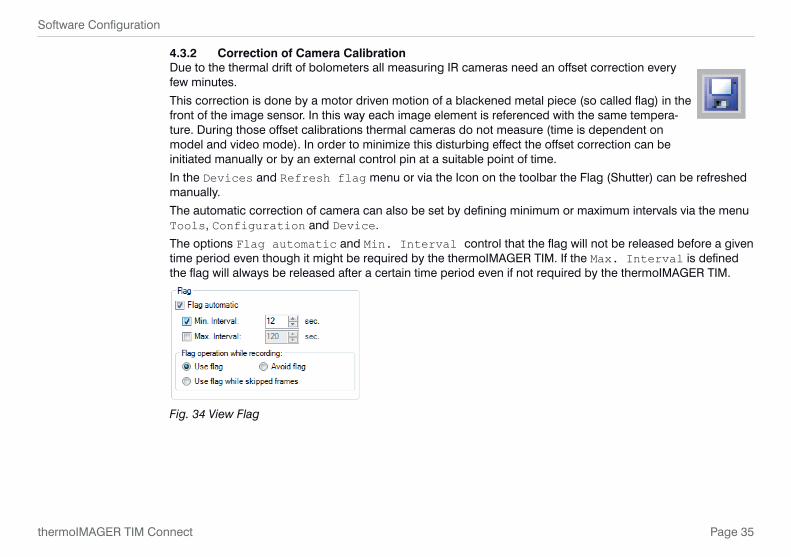
4.3.2 Correction of Camera CalibrationDue to the thermal drift of bolometers all measuring IR cameras need an offset correction every few minutes.
This correction is done by a motor driven motion of a blackened metal piece (so called flag) in the front of the image sensor. In this way each image element is referenced with the same tempera-ture. During those offset calibrations thermal cameras do not measure (time is dependent on model and video mode). In order to minimize this disturbing effect the offset correction can be initiated manually or by an external control pin at a suitable point of time.
In the Devices and Refresh flag menu or via the Icon on the toolbar the Flag (Shutter) can be refreshed manually.
The automatic correction of camera can also be set by defining minimum or maximum intervals via the menu Tools, Configuration and Device.
The options Flag automatic and Min. Interval control that the flag will not be released before a given time period even though it might be required by the thermoIMAGER TIM. If the Max. Interval is defined the flag will always be released after a certain time period even if not required by the thermoIMAGER TIM.
Fig. 34 View Flag
Page 36
Software Configuration
thermoIMAGER TIM Connect
Using the option Flag operation while recording and Use flag the correction is activated even if the camera is recording. If Avoid flag is chosen the camera will not be corrected while recording. The op-tion Use flag while skipped frames is suitable at slow data capturing (3 Hz or less) as the correction will take place automatically between two recorded images (correction time app. 250 ms).
i The manual or automatic flag functionality is not available if the flag is externally controlled, e.g. via the process interface input, see Chap. 4.5.
Use the flag to protect the detector from potentially dangerous radiation (for example laser radiation). > Damage of the detector
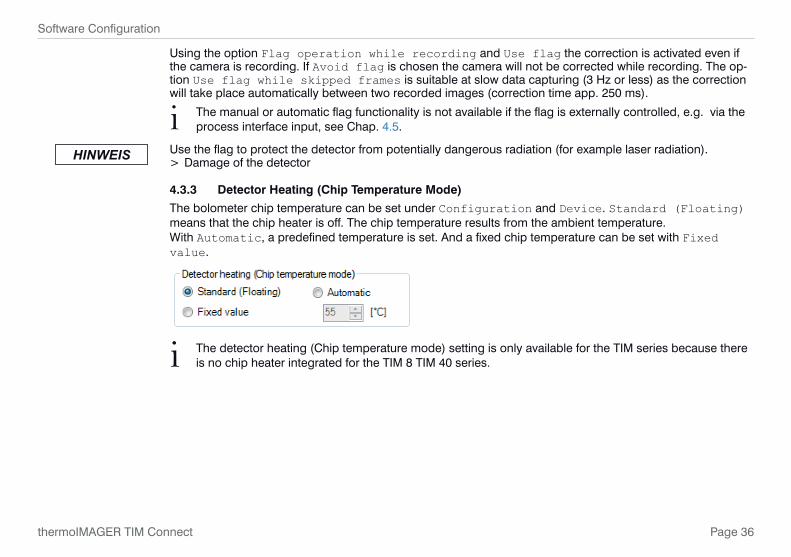
4.3.3 Detector Heating (Chip Temperature Mode)
The bolometer chip temperature can be set under Configuration and Device. Standard (Floating) means that the chip heater is off. The chip temperature results from the ambient temperature. With Automatic, a predefined temperature is set. And a fixed chip temperature can be set with Fixed value.
i The detector heating (Chip temperature mode) setting is only available for the TIM series because there is no chip heater integrated for the TIM 8 TIM 40 series.
HINWEIS
Page 37
Software Configuration
thermoIMAGER TIM Connect
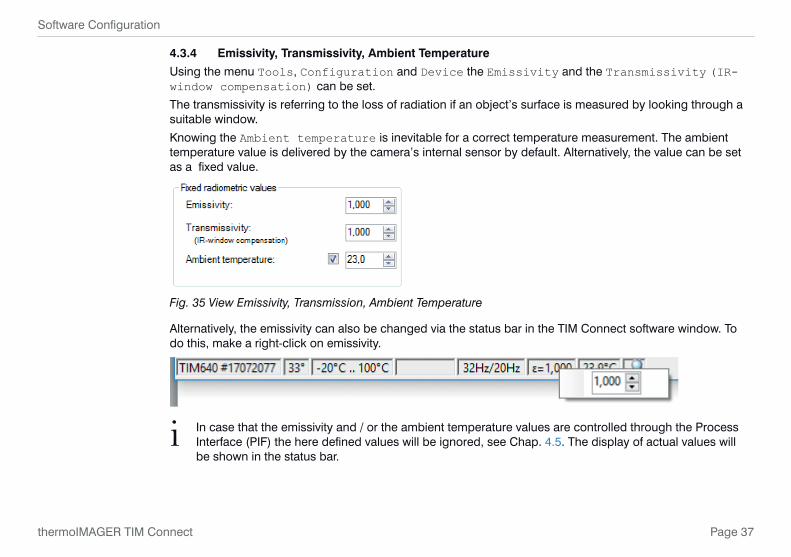
4.3.4 Emissivity, Transmissivity, Ambient Temperature
Using the menu Tools, Configuration and Device the Emissivity and the Transmissivity (IR-window compensation) can be set.
The transmissivity is referring to the loss of radiation if an object’s surface is measured by looking through a suitable window.
Knowing the Ambient temperature is inevitable for a correct temperature measurement. The ambient temperature value is delivered by the camera’s internal sensor by default. Alternatively, the value can be set as a fixed value.
Fig. 35 View Emissivity, Transmission, Ambient Temperature
Alternatively, the emissivity can also be changed via the status bar in the TIM Connect software window. To do this, make a right-click on emissivity.
i In case that the emissivity and / or the ambient temperature values are controlled through the Process Interface (PIF) the here defined values will be ignored, see Chap. 4.5. The display of actual values will be shown in the status bar.
Page 38
Software Configuration
thermoIMAGER TIM Connect
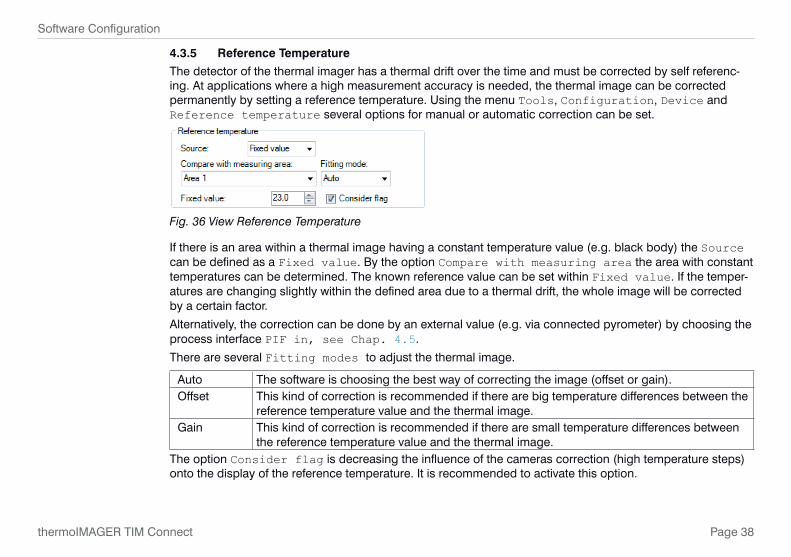
4.3.5 Reference Temperature
The detector of the thermal imager has a thermal drift over the time and must be corrected by self referenc-ing. At applications where a high measurement accuracy is needed, the thermal image can be corrected permanently by setting a reference temperature. Using the menu Tools, Configuration, Device and Reference temperature several options for manual or automatic correction can be set.
Fig. 36 View Reference Temperature
If there is an area within a thermal image having a constant temperature value (e.g. black body) the Source can be defined as a Fixed value. By the option Compare with measuring area the area with constant temperatures can be determined. The known reference value can be set within Fixed value. If the temper-atures are changing slightly within the defined area due to a thermal drift, the whole image will be corrected by a certain factor.
Alternatively, the correction can be done by an external value (e.g. via connected pyrometer) by choosing the process interface PIF in, see Chap. 4.5.
There are several Fitting modes to adjust the thermal image.
Auto The software is choosing the best way of correcting the image (offset or gain).Offset This kind of correction is recommended if there are big temperature differences between the
reference temperature value and the thermal image.Gain This kind of correction is recommended if there are small temperature differences between
the reference temperature value and the thermal image.The option Consider flag is decreasing the influence of the cameras correction (high temperature steps) onto the display of the reference temperature. It is recommended to activate this option.
Page 39
Software Configuration
thermoIMAGER TIM Connect
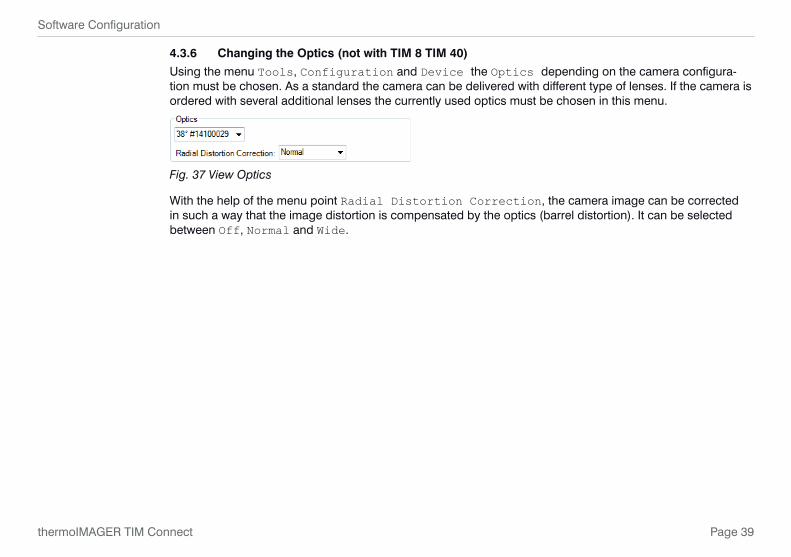
4.3.6 Changing the Optics (not with TIM 8 TIM 40)
Using the menu Tools, Configuration and Device the Optics depending on the camera configura-tion must be chosen. As a standard the camera can be delivered with different type of lenses. If the camera is ordered with several additional lenses the currently used optics must be chosen in this menu.
Fig. 37 View Optics
With the help of the menu point Radial Distortion Correction, the camera image can be corrected in such a way that the image distortion is compensated by the optics (barrel distortion). It can be selected between Off, Normal and Wide.
Page 40
Software Configuration
thermoIMAGER TIM Connect
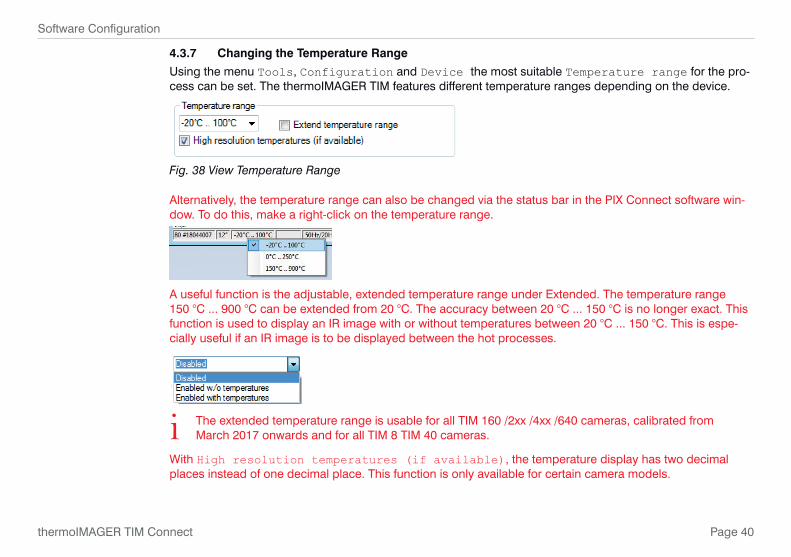
4.3.7 Changing the Temperature Range
Using the menu Tools, Configuration and Device the most suitable Temperature range for the pro-cess can be set. The thermoIMAGER TIM features different temperature ranges depending on the device.
Fig. 38 View Temperature Range
Alternatively, the temperature range can also be changed via the status bar in the PIX Connect software win-dow. To do this, make a right-click on the temperature range.
A useful function is the adjustable, extended temperature range under Extended. The temperature range 150 °C ... 900 °C can be extended from 20 °C. The accuracy between 20 °C ... 150 °C is no longer exact. This function is used to display an IR image with or without temperatures between 20 °C ... 150 °C. This is espe-cially useful if an IR image is to be displayed between the hot processes.
i The extended temperature range is usable for all TIM 160 /2xx /4xx /640 cameras, calibrated from March 2017 onwards and for all TIM 8 TIM 40 cameras.
With High resolution temperatures (if available), the temperature display has two decimal places instead of one decimal place. This function is only available for certain camera models.
Page 41
Software Configuration
thermoIMAGER TIM Connect
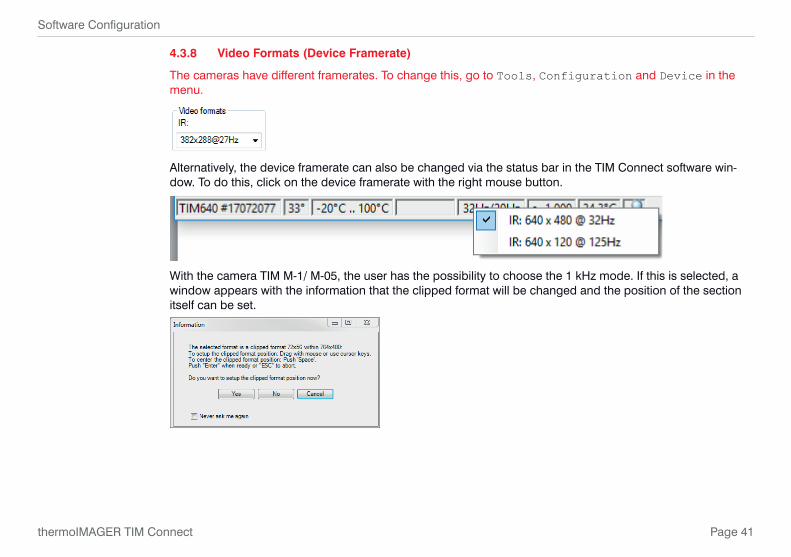
4.3.8 Video Formats (Device Framerate)
The cameras have different framerates. To change this, go to Tools, Configuration and Device in the menu.
Alternatively, the device framerate can also be changed via the status bar in the TIM Connect software win-dow. To do this, click on the device framerate with the right mouse button.
With the camera TIM M-1/ M-05, the user has the possibility to choose the 1 kHz mode. If this is selected, a window appears with the information that the clipped format will be changed and the position of the section itself can be set.

Page 42
Software Configuration
thermoIMAGER TIM Connect
4.4 Imager Interfaces for TIM and TIM 40 Camera
4.4.1 GeneralThe imager is equipped with a process interface (cable with integrated electronics and terminal block), which can be programmed via the software as an Analog Input (AI) and Digital Input (DI) in order to control the camera or as an Ana-log Output (AO) in order to control the process. The signal level is always 0 - 10 V. The process interface can be activated choosing the following options:Analog Input (AI) Emissivity, Ambient temperature, Reference temperature, Uncommitted value, Flag Control,
Triggered Snapshots, Triggered Recording, Triggered Linescanner, Triggered event grabber, Reset Peak-/Valley-Hold
Analog Output (AO) Main measure area, Measure area, Internal temperature, Flag Status, Alarm, Frame sync, Fail-safe, External Communication
Digital Input (DI) Flag Control, Triggered Snapshots, Triggered Recording, Triggered Linescanner, Triggered event grabber, Reset Peak-/Valley-Hold
Fig. 39 Configuration Process Interface (PIF)
Frame synchronization: In this function, a needle pulse is output for synchronization with fast processes at the beginning of each frame.

Page 43
Software Configuration
thermoIMAGER TIM Connect
4.4.2 Prozessinterface (PIF) for TIM and TIM 40 Camera
Using Tools, Configuration and Device PIF menu you can configure a PIF which is connected to the camera. The number of in- and outputs can vary depending on the connected PIF (Standard-PIF or Industrial PIF). An available in- or output will be marked with a green checkmark . A not available in- or output will be marked with a red x. With Set number of ports like connected device, only the available inputs/outputs are displayed.
If you configure an analog value an additional window will show up if you press the Setup button. In this win-dow you can scale the in- or output:
Fig. 40 View configuration Fig. 41 View Config PIF channel

Page 44
Software Configuration
thermoIMAGER TIM Connect
On the analog inputs you can select each function only once (exception: Uncommitted value).
On the analog outputs also each function can only be selected once (exception: Measurement area; Alarm).
i You can use the analog inputs, outputs and the digital input of the PIF simultaneously.
Fig. 42 View configuration
If you activate the function Alarm on an analog output you need to assign also in the Alarms tab the desired measurement area to the desired PIF output.
The industrial PIF has a maximum of three analog outputs. To use additional outputs, the ADAM-4024 module from Advantech is recommended, which has four analog outputs per module and can be cascaded with further modules.
For more information on the settings for alarms, see Chap. 6.8.
Page 45
Software Configuration
thermoIMAGER TIM Connect
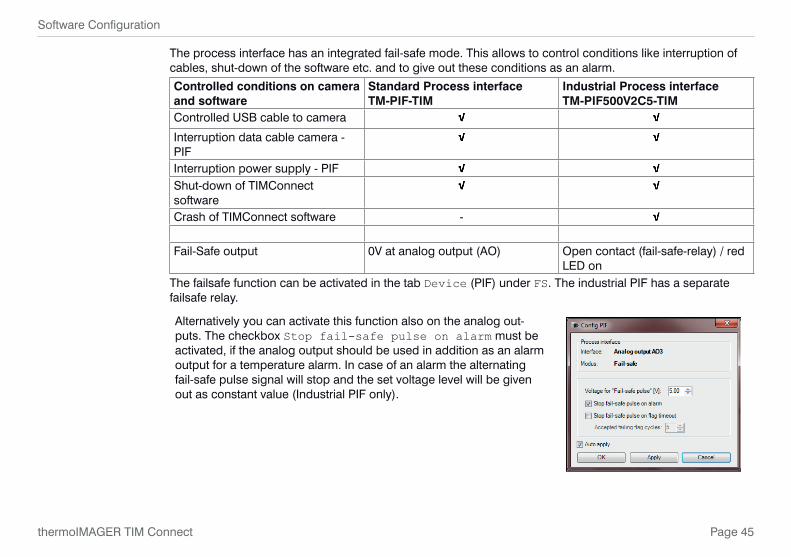
The process interface has an integrated fail-safe mode. This allows to control conditions like interruption of cables, shut-down of the software etc. and to give out these conditions as an alarm.
Controlled conditions on camera and software
Standard Process interface TM-PIF-TIM
Industrial Process interface TM-PIF500V2C5-TIM
Controlled USB cable to camera
Interruption data cable camera - PIFInterruption power supply - PIFShut-down of TIMConnect softwareCrash of TIMConnect software -
Fail-Safe output 0V at analog output (AO) Open contact (fail-safe-relay) / red LED on
The failsafe function can be activated in the tab Device (PIF) under FS. The industrial PIF has a separate failsafe relay.
Alternatively you can activate this function also on the analog out-puts. The checkbox Stop fail-safe pulse on alarm must be activated, if the analog output should be used in addition as an alarm output for a temperature alarm. In case of an alarm the alternating fail-safe pulse signal will stop and the set voltage level will be given out as constant value (Industrial PIF only).
Page 46
Software Configuration
thermoIMAGER TIM Connect
4.5 Software Development Kit (SDK)
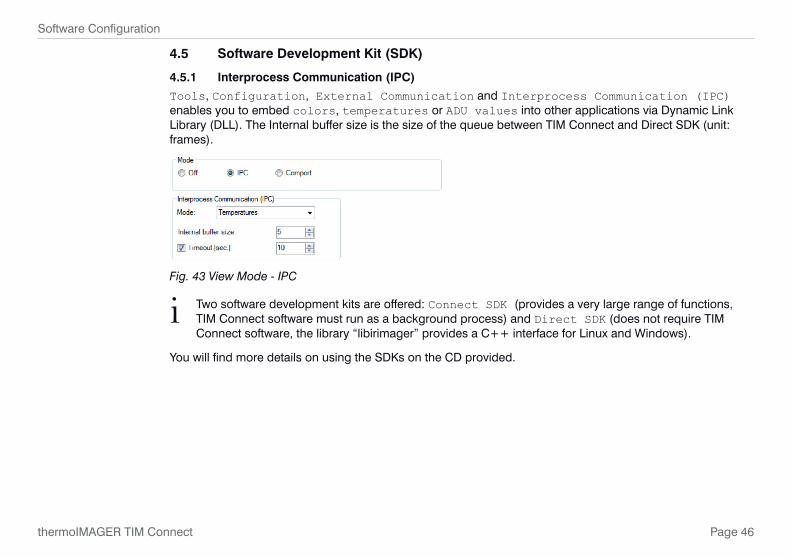
4.5.1 Interprocess Communication (IPC)
Tools, Configuration, External Communication and Interprocess Communication (IPC) enables you to embed colors, temperatures or ADU values into other applications via Dynamic Link Library (DLL). The Internal buffer size is the size of the queue between TIM Connect and Direct SDK (unit: frames).
Fig. 43 View Mode - IPC
i Two software development kits are offered: Connect SDK (provides a very large range of functions, TIM Connect software must run as a background process) and Direct SDK (does not require TIM Connect software, the library “libirimager” provides a C++ interface for Linux and Windows).
You will find more details on using the SDKs on the CD provided.
Page 47
Software Configuration
thermoIMAGER TIM Connect
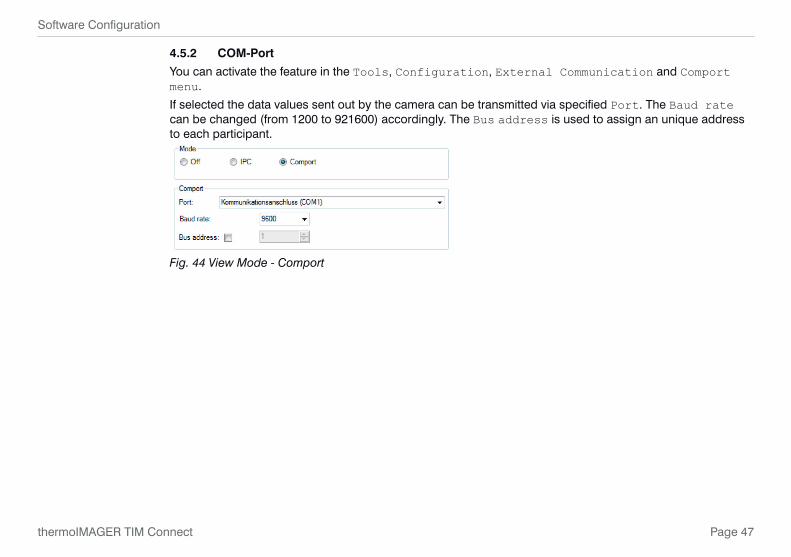
4.5.2 COM-Port
You can activate the feature in the Tools, Configuration, External Communication and Comport menu.
If selected the data values sent out by the camera can be transmitted via specified Port. The Baud rate can be changed (from 1200 to 921600) accordingly. The Bus address is used to assign an unique address to each participant.
Fig. 44 View Mode - Comport

Page 48
Software Configuration
thermoIMAGER TIM Connect
4.6 Start Options
4.6.1 Overview of Start Options
TIM Connect software can be started with additional starting parameters using the command line, see Fig. 45.
Please change the linkage in the software settings via the launch icon on the desktop. Behind the command line please add a space character and the required command parameter, e.g. “C:\Pro-gram\...\TIM Connect\Imager.exe” /?
Fig. 45 Program icon TIM Connect Fig. 46 View TIM Connect Properties

Page 49
Software Configuration
thermoIMAGER TIM Connect
Starting the software via the launch icon you will get an overview of possible commands:
Fig. 47 View help dialog
i Using the parameter Invisible the software can only be closed via the Task Manager and Processes.

Page 50
Software Configuration
thermoIMAGER TIM Connect
4.6.2 Start of Multiple Software / Imager Instances
In case you are using more than one TIM simultaneously each imager can be linked to one software instance. In order to setup further software instance please follow the steps below:
Duplicate the software icon at the desktop. Optional: Change the name of the new software icon at the desktop, e.g. Imager1. Make a right click on the new icon, click on Properties , go to Shortcut and Target and
at the end of the line type the new name in: „C:\Programme\...\TIM Connect\Im-ager.exe“ /Name=Imager1, see Chap. 4.6.1., see Fig. 48.
Fig. 48 View Imager 1 Properties
Page 51
Software Configuration
thermoIMAGER TIM Connect
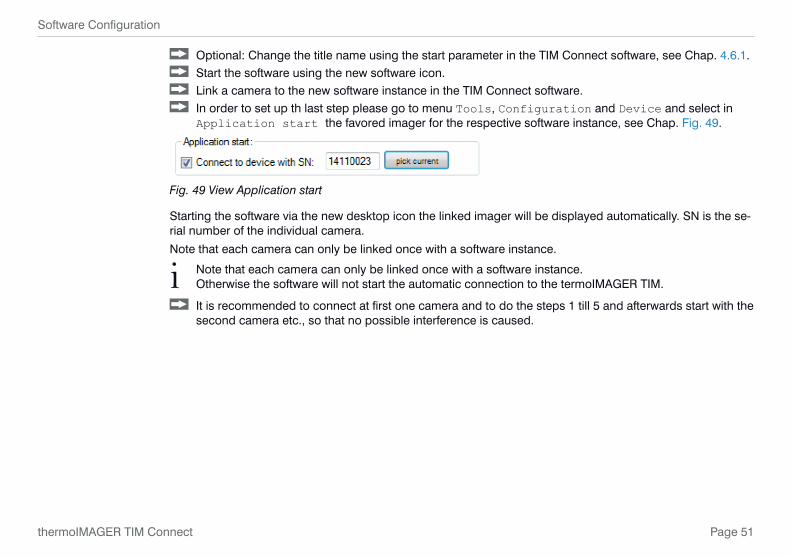
Optional: Change the title name using the start parameter in the TIM Connect software, see Chap. 4.6.1. Start the software using the new software icon. Link a camera to the new software instance in the TIM Connect software. In order to set up th last step please go to menu Tools, Configuration and Device and select in Application start the favored imager for the respective software instance, see Chap. Fig. 49.
Fig. 49 View Application start
Starting the software via the new desktop icon the linked imager will be displayed automatically. SN is the se-rial number of the individual camera.
Note that each camera can only be linked once with a software instance.
i Note that each camera can only be linked once with a software instance. Otherwise the software will not start the automatic connection to the termoIMAGER TIM.
It is recommended to connect at first one camera and to do the steps 1 till 5 and afterwards start with the second camera etc., so that no possible interference is caused.
Page 52
Data Capturing
thermoIMAGER TIM Connect
5. Data Capturing
5.1 Open Files
Via the menu File and Open or the Icon on the toolbar you can open all files which can be processed by the software.
i Via the menu File and Reopen you can easily reopen captured files if the option in is activated, see Chap. 5.1.
5.2 Replay of Files
5.3 Control Panel
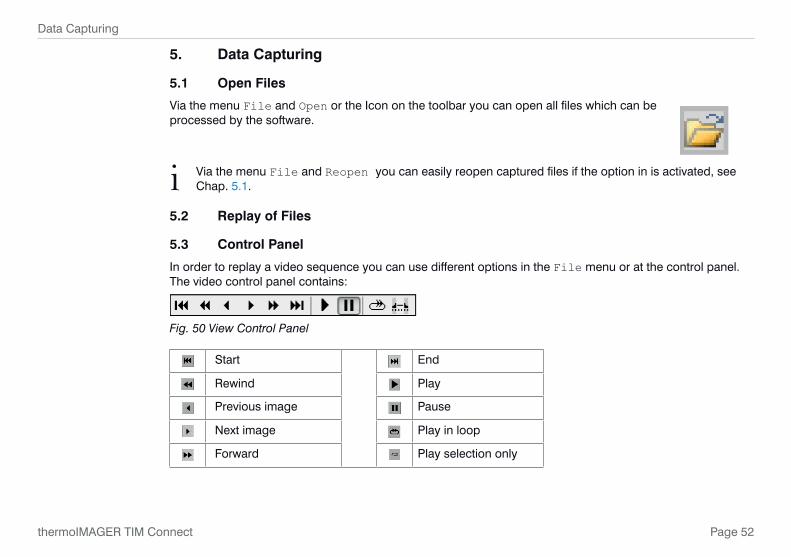
In order to replay a video sequence you can use different options in the File menu or at the control panel. The video control panel contains:
Fig. 50 View Control Panel
Start End
Rewind Play
Previous image Pause
Next image Play in loop
Forward Play selection only
Page 53
Data Capturing
thermoIMAGER TIM Connect
5.4 Replay Options
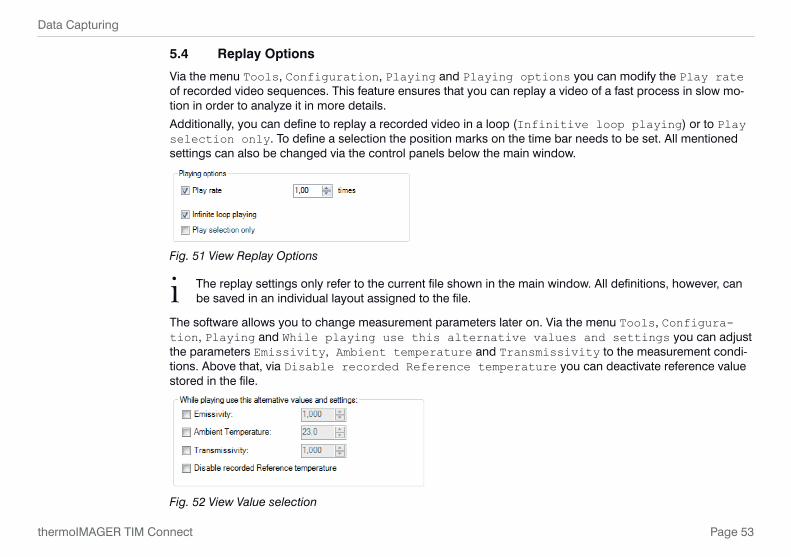
Via the menu Tools, Configuration, Playing and Playing options you can modify the Play rate of recorded video sequences. This feature ensures that you can replay a video of a fast process in slow mo-tion in order to analyze it in more details.
Additionally, you can define to replay a recorded video in a loop (Infinitive loop playing) or to Play selection only. To define a selection the position marks on the time bar needs to be set. All mentioned settings can also be changed via the control panels below the main window.
Fig. 51 View Replay Options
i The replay settings only refer to the current file shown in the main window. All definitions, however, can be saved in an individual layout assigned to the file.
The software allows you to change measurement parameters later on. Via the menu Tools, Configura-tion, Playing and While playing use this alternative values and settings you can adjust the parameters Emissivity, Ambient temperature and Transmissivity to the measurement condi-tions. Above that, via Disable recorded Reference temperature you can deactivate reference value stored in the file.
Fig. 52 View Value selection
Page 54
Data Capturing
thermoIMAGER TIM Connect
5.5 Editing Video Sequences
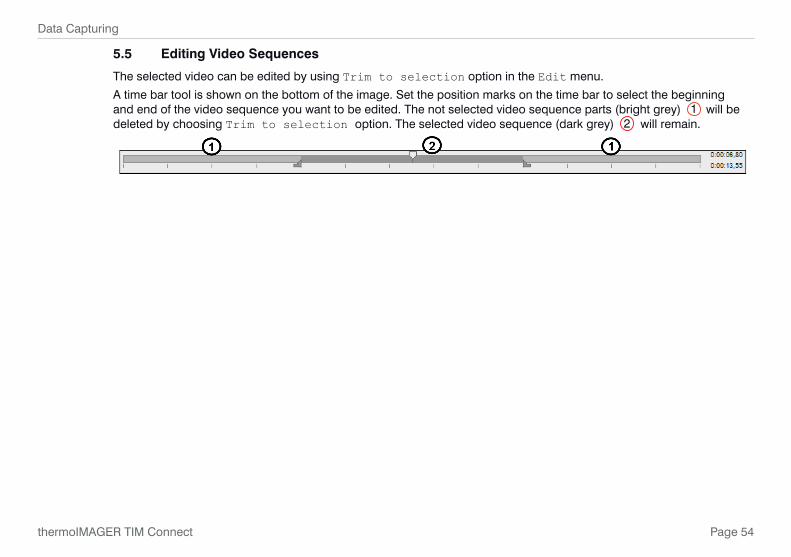
The selected video can be edited by using Trim to selection option in the Edit menu.
A time bar tool is shown on the bottom of the image. Set the position marks on the time bar to select the beginning and end of the video sequence you want to be edited. The not selected video sequence parts (bright grey) 1 will be deleted by choosing Trim to selection option. The selected video sequence (dark grey) 2 will remain.

Page 55
Data Capturing
thermoIMAGER TIM Connect
5.6 Saving Files
5.6.1 Setting the Recording Frame Rate
The camera’s maximum frame rate depends on the camera model you’re using and can be reduced. Using Tools, Configuration, Recording and Recording framerate , see Fig. 53, the speed of the data capturing can be set.
Typically, the specification is in Hertz (Hz, images per second).
Fig. 53 View Recording framerate
The software gets the full frame rate from camera. That is why you need to define what to do with the images which are left if choosing a reduced frame rate. There are several alternatives to set in the Mode option, see Fig. 54:
Off The recording frame rate corresponds to the device frame rate of the camera.Skipping It skips so many pictures that the set display frame rate results.Average The pixels are averaged out of a sequence of images. This weakens the detector noise.Minimum From a sequence of image, the smallest value is displayed for each pixel.Maximum From a sequence of image, the highest value is displayed for each pixel.Ext. Averaging Is a combination of average and skipping and is used at very low frame rates. The avera-
ging time indicates how many percent of the set frame time should be averaged. In the remaining time, the frames are skipped (e.g., if the frame rate is 1 Hz and the averaging time is 100 ms, then 100 ms is averaged and 900 ms is skipped).
Fig. 54 Options under Recording framerate - Mode

Page 56
Data Capturing
thermoIMAGER TIM Connect
Fig. 55 Example diagram Recording frame rate Fig. 56 Recording frame rate referring to 1 pixel
Page 57
Data Capturing
thermoIMAGER TIM Connect
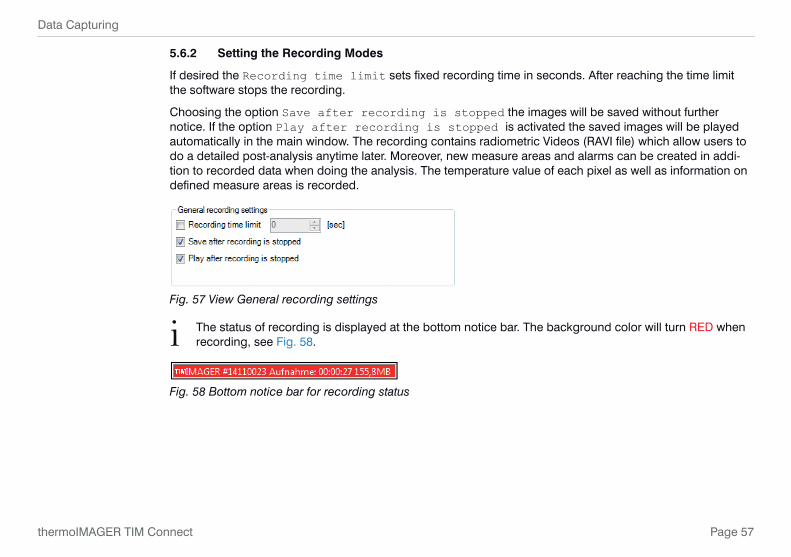
5.6.2 Setting the Recording Modes
If desired the Recording time limit sets fixed recording time in seconds. After reaching the time limit the software stops the recording.
Choosing the option Save after recording is stopped the images will be saved without further notice. If the option Play after recording is stopped is activated the saved images will be played automatically in the main window. The recording contains radiometric Videos (RAVI file) which allow users to do a detailed post-analysis anytime later. Moreover, new measure areas and alarms can be created in addi-tion to recorded data when doing the analysis. The temperature value of each pixel as well as information on defined measure areas is recorded.
Fig. 57 View General recording settings
i The status of recording is displayed at the bottom notice bar. The background color will turn RED when recording, see Fig. 58.
Fig. 58 Bottom notice bar for recording status
Page 58
Data Capturing
thermoIMAGER TIM Connect
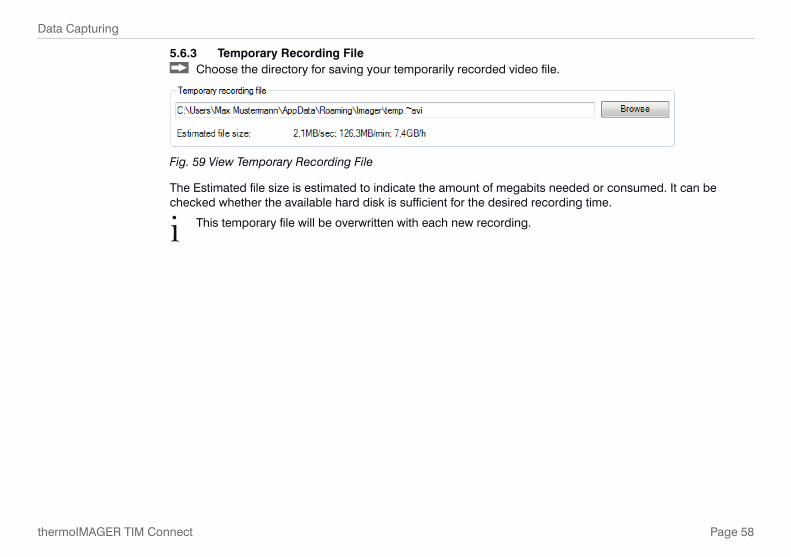
5.6.3 Temporary Recording File Choose the directory for saving your temporarily recorded video file.
Fig. 59 View Temporary Recording File
The Estimated file size is estimated to indicate the amount of megabits needed or consumed. It can be checked whether the available hard disk is sufficient for the desired recording time.
i This temporary file will be overwritten with each new recording.

Page 59
Data Capturing
thermoIMAGER TIM Connect
5.6.4 Saving Radiometric Video Sequences or AVI Files
Video sequences can both be saved as a radiometric file (RAVI) or as a non-radiometric file (AVI). RAVI files contain all temperature as well as measure area information.
i If Radiometric Recording, see Chap. 5.6.2, is not activated the images will be saved as standard AVI file only containing color information. A later conversion of a RAVI file into an AVI file and vice versa is not possible.
For recording a video sequence you can use either the menu File and Record or the available Icon on the toolbar.
For stopping a video sequence you can use either the menu File and Stop or the available Icon on the toolbar.
If the video sequence includes the expected content you can save it via the menu File and Save or the Icon on the toolbar.

Page 60
Data Capturing
thermoIMAGER TIM Connect
5.6.5 Saving Image Data as Radiometric Snapshot or Text File
Snapshots are single, radiometric images based on a video sequence, this means they are contain all temperature as well as measure area information. Thus the images can always be analyzed in detail later on.
Snapshots can be captured via the menu File and Snapshot or via the Icon on the toolbar.
Fig. 60 View Snapshots
Using the settings in the menu Tools, Configuration and Snapshots / Copy to clipboard you can define how a snapshot is copied into the clipboard or stored on the computer. Either the snapshot will be saved in the Genuine(device resolution) corresponding to the camera’s resolution, Magnified (Magnification for TIM 160, TIM 2xx to four times the resolution, for TIM 4xx to double, and for TIM 640 and TIM M-1, the original device resolution remains) or using As video window (as illustrated video window). The option Draw overlay information will display all information, such as measuring area or tempera-ture display and is stored on the image. If the checkmark is not set, only the pure thermal image is stored without values and information.
i The option Genuine (device resolution) needs to be chosen if you want to save and display (snapshot history) the identical snapshot. Otherwise, the camera image taken before the snapshot will be displayed in the history.
If the option Open a file dialog is tagged you will always be asked about the location, the file name and the file type before saving a snapshot.
Page 61
Data Capturing
thermoIMAGER TIM Connect
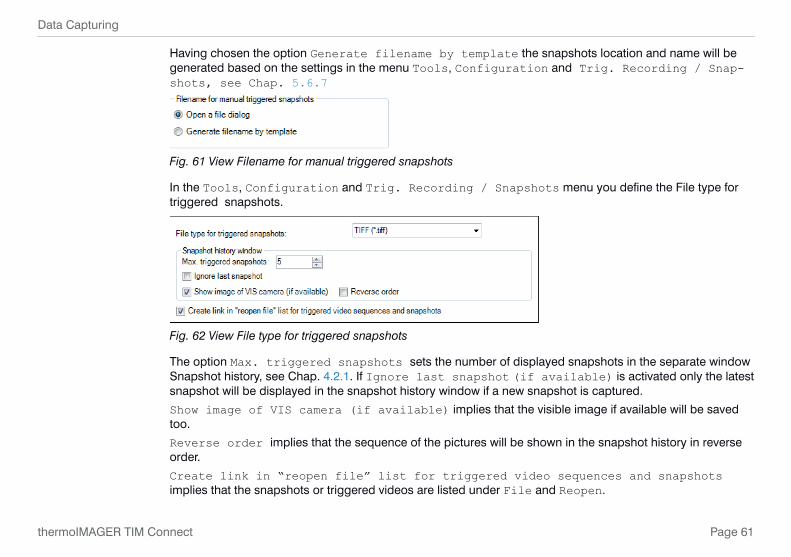
Having chosen the option Generate filename by template the snapshots location and name will be generated based on the settings in the menu Tools, Configuration and Trig. Recording / Snap-shots, see Chap. 5.6.7
Fig. 61 View Filename for manual triggered snapshots
In the Tools, Configuration and Trig. Recording / Snapshots menu you define the File type for triggered snapshots.
Fig. 62 View File type for triggered snapshots
The option Max. triggered snapshots sets the number of displayed snapshots in the separate window Snapshot history, see Chap. 4.2.1. If Ignore last snapshot (if available) is activated only the latest snapshot will be displayed in the snapshot history window if a new snapshot is captured.
Show image of VIS camera (if available) implies that the visible image if available will be saved too.
Reverse order implies that the sequence of the pictures will be shown in the snapshot history in reverse order.
Create link in “reopen file” list for triggered video sequences and snapshots implies that the snapshots or triggered videos are listed under File and Reopen.

Page 62
Data Capturing
thermoIMAGER TIM Connect
There are the following options to save image data:
TIFF (*.tiff) Saving of image (snapshot) as radiometric picture in TIFF format.Text (Image data) (*.csv) Saving of image (snapshot) as Text format to edit information in Excel.Text (Temp. profile data) (*.csv) Saving of temperature profile data only as Text format to edit information
in Excel.
i The TIFF files are saved as radiometric files and can be analyzed in detail with the TIM Connect software. Furthermore, they can also be displayed in any standard program like Photoshop showing the color information within the image.
Fig. 63 Analysis of thermal image in Excel via *.csv file export and display of pixel data in 3D

Page 63
Data Capturing
thermoIMAGER TIM Connect
5.6.6 Saving Text File of the Temperature / Time Diagram
Via the menu File and Save Temp/Time diagram data the data of diagram can be saved in a text file (*.dat) for further analysis.
5.6.7 Location and Filename Templates of Triggered Recordings
In the Tools, Configuration and Trig. Recording / Snapshots menu you can define a Prefix for filename. The software is using this prefix if saving a sequence or snapshot.
Fig. 64 View File name template for triggered recording and snapshots
The Path defines the storage location of all files and can be changed here. Once recorded the file is saved under name including prefix, current date and time stamp.
i Using the option Create link in “reopen file“ list for triggered video sequences and snapshots the files can easily be reopened via the menu File and Reopen. The data capturing includes all information like measure areas and temperature displays of the main window if the option Save layout together with triggered video sequences and snap-shots is tagged.

Page 64
Data Capturing
thermoIMAGER TIM Connect
5.6.8 Display of Snapshots in a Separate Window
In the menu View, Windows and Snapshot history you can activate a window in order to display all triggered snapshots, see Chap. 4.2.1. Before you have to choose the option Gen-erate filename by template in the menu Tools, Configuration and Trig. Recording / Snapshots, see Chap. 5.6.5.
If a shot snapshot is to be opened from the snapshot history, there are several options:
- Open: Opens the snapshot in the same instance, see Chap. 5.1. - Open in new instance (using last layout): Layout that was last opened in the viewer in-
stance. - Open in new instance (using current layout): Layout that is currently open in the current
instance. - Open in new instance (using layout in this file): Layout that is contained in the file that
is to be opened - Delete: Snapshot is deleted.
Page 65
Data Capturing
thermoIMAGER TIM Connect
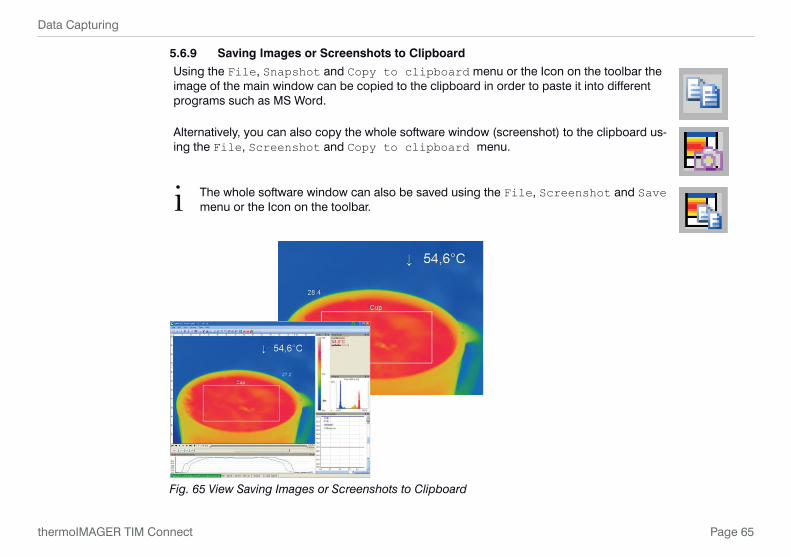
5.6.9 Saving Images or Screenshots to Clipboard
Using the File, Snapshot and Copy to clipboard menu or the Icon on the toolbar the image of the main window can be copied to the clipboard in order to paste it into different programs such as MS Word.
Alternatively, you can also copy the whole software window (screenshot) to the clipboard us-ing the File, Screenshot and Copy to clipboard menu.
i The whole software window can also be saved using the File, Screenshot and Save menu or the Icon on the toolbar.
Fig. 65 View Saving Images or Screenshots to Clipboard
Page 66
Data Capturing
thermoIMAGER TIM Connect
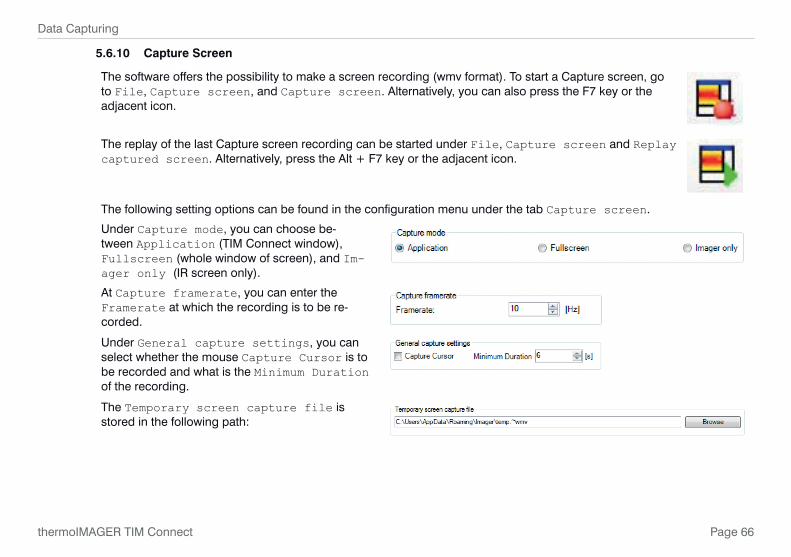
5.6.10 Capture Screen
The software offers the possibility to make a screen recording (wmv format). To start a Capture screen, go to File, Capture screen, and Capture screen. Alternatively, you can also press the F7 key or the adjacent icon.
The replay of the last Capture screen recording can be started under File, Capture screen and Replay captured screen. Alternatively, press the Alt + F7 key or the adjacent icon.
The following setting options can be found in the configuration menu under the tab Capture screen.
Under Capture mode, you can choose be-tween Application (TIM Connect window), Fullscreen (whole window of screen), and Im-ager only (IR screen only).
At Capture framerate, you can enter the Framerate at which the recording is to be re-corded.
Under General capture settings, you can select whether the mouse Capture Cursor is to be recorded and what is the Minimum Duration of the recording.
The Temporary screen capture file is stored in the following path:

Page 67
Data Capturing
thermoIMAGER TIM Connect
Under Filename mode, you can decide how and where to save a recording. You can choose be-tween the following options:
Open a file dialog: After recording, a dialog window will pop up, prompting you to enter a loca-tion and a save name.
Generate file name by template: Here you can enter a Prefix for filename, a Path and a Sample for the recording.
Static filename: Under the name and path entered here, the recording is automatically saved. The file is overwritten with each new recording.
i If during the recording the software window is made smaller or larger, the size remains from the start.

Page 68
Data Processing
thermoIMAGER TIM Connect
6. Data Processing
6.1 Measure Areas
6.1.1 General Settings
Measure areas for temperature analysis can be defined, edited and deleted using the menu Tools, Configura-tion and Measure areas.
Using Add (Measure Area) / Add (Calculated area) buttons you can create a new Measure area / Calculated area. The Remove button deletes an existing Measure area / Calculated area.
Press Up / Down to position individual measure areas within the list.
One measure area from the list can be appointed as the Main measure area. The temperature of the main area can be displayed in the main window or converted into an electrical signal to be transmitted via the Process Interface (PIF)
Under Display the Font size can be changed for all measuring areas. By selecting Show in image measure areas can be displayed in the infrared image.
Fig. 66 View General Settings
Page 69
Data Processing
thermoIMAGER TIM Connect
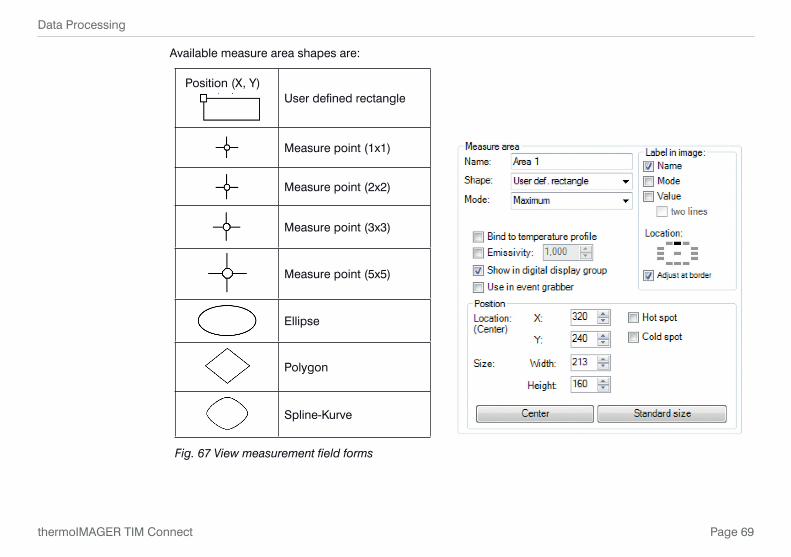
Available measure area shapes are:
Position (X, Y)User defined rectangle
Measure point (1x1)
Measure point (2x2)
Measure point (3x3)
Measure point (5x5)
Ellipse
Polygon
Spline-Kurve
Fig. 67 View measurement field forms

Page 70
Data Processing
thermoIMAGER TIM Connect
Any measure area can be renamed individually in the Name field. Under the field Shape the different measuring shapes can be selected. The table above shows the available shapes. The temperature of the main measuring area can also be displayed in the main window. The value, which is displayed, is defined over the Minimum, Maximum, Mean value or Dis-tribution [%] in the field Mode or via the icon in the toolbar.
Minimum Min. value is shown.
Maximum Max. value is shown.
Mean value Mean value is shown.
Distribution [%] Indicates the percentage distribution between two selected temperatures.
In the Position section the exact Location and Size of the measure area within the main window can be defined. The moving and minimizing or maximizing of the measuring fields can also be realized directly at the measuring field in the main window. By moving the cursor to the edges of the measuring field, the grippers can be used to adjust the size of thermal image or to move the image completely (hold Ctrl synchronously).
If desired the area can represent a Hot spot (spot or area with highest mean temperature in the image) or a Cold spot (spot or area with lowest mean temperature in the image).
Using Center you will be moving the measure area into the middle of the main window, using Standard size the rectangle will be set in a predefined size. Under Label in image, you can select whether the Name, Mode and / or Value is to be displayed in the image. Two-lines means that the selected labels are displayed one after the other.
Using Bind to temperature profile you can assign each measure area to one of the two temperature profile (Profile 1 / Profile 2).
The position of the measure area and the profile can be determined by the option Location [%]. The size ratio can be defined by the option Min. Size.

Page 71
Data Processing
thermoIMAGER TIM Connect
Fig. 68 View Position
Fig. 69 Measure area assigned to a tempera-ture profile (measure point)
Fig. 70 Measure area assigned to a temperature profile (rectangle)
Page 72
Data Processing
thermoIMAGER TIM Connect
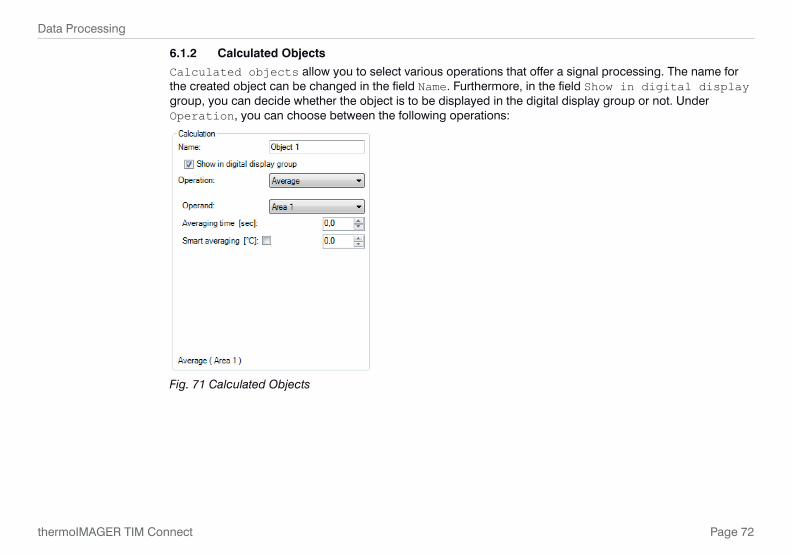
6.1.2 Calculated Objects
Calculated objects allow you to select various operations that offer a signal processing. The name for the created object can be changed in the field Name. Furthermore, in the field Show in digital display group, you can decide whether the object is to be displayed in the digital display group or not. Under Operation, you can choose between the following operations:
Fig. 71 Calculated Objects
Page 73
Data Processing
thermoIMAGER TIM Connect
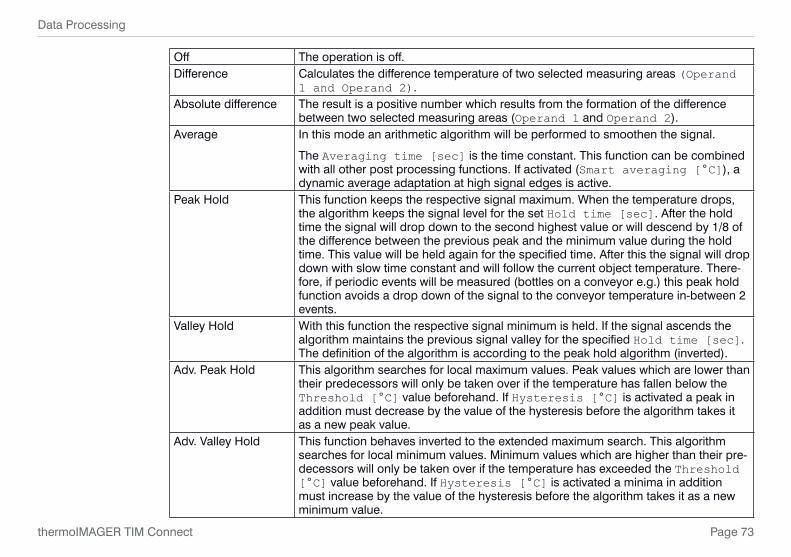
Off The operation is off.Difference Calculates the difference temperature of two selected measuring areas (Operand
1 and Operand 2).Absolute difference The result is a positive number which results from the formation of the difference
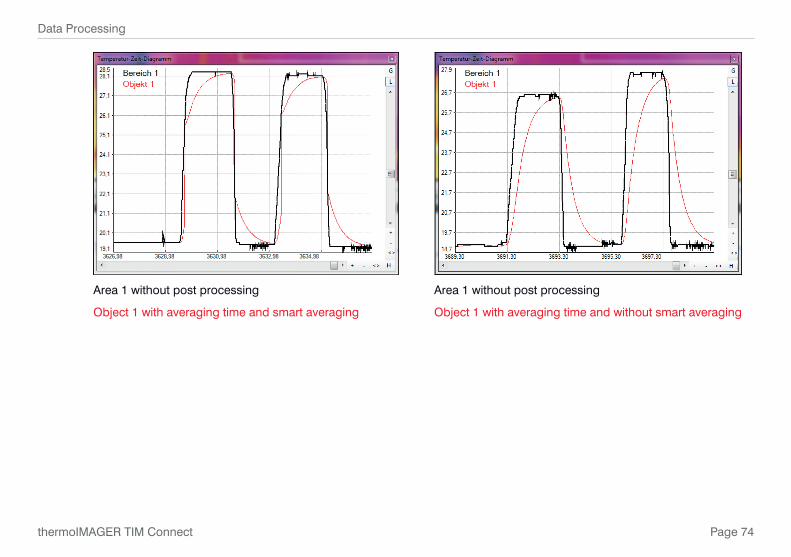
between two selected measuring areas (Operand 1 and Operand 2).Average In this mode an arithmetic algorithm will be performed to smoothen the signal.
The Averaging time [sec] is the time constant. This function can be combined with all other post processing functions. If activated (Smart averaging [°C]), a dynamic average adaptation at high signal edges is active.
Peak Hold This function keeps the respective signal maximum. When the temperature drops, the algorithm keeps the signal level for the set Hold time [sec]. After the hold time the signal will drop down to the second highest value or will descend by 1/8 of the difference between the previous peak and the minimum value during the hold time. This value will be held again for the specified time. After this the signal will drop down with slow time constant and will follow the current object temperature. There-fore, if periodic events will be measured (bottles on a conveyor e.g.) this peak hold function avoids a drop down of the signal to the conveyor temperature in-between 2 events.
Valley Hold With this function the respective signal minimum is held. If the signal ascends the algorithm maintains the previous signal valley for the specified Hold time [sec]. The definition of the algorithm is according to the peak hold algorithm (inverted).
Adv. Peak Hold This algorithm searches for local maximum values. Peak values which are lower than their predecessors will only be taken over if the temperature has fallen below the Threshold [°C] value beforehand. If Hysteresis [°C] is activated a peak in addition must decrease by the value of the hysteresis before the algorithm takes it as a new peak value.
Adv. Valley Hold This function behaves inverted to the extended maximum search. This algorithm searches for local minimum values. Minimum values which are higher than their pre-decessors will only be taken over if the temperature has exceeded the Threshold [°C] value beforehand. If Hysteresis [°C] is activated a minima in addition must increase by the value of the hysteresis before the algorithm takes it as a new minimum value.
Page 74
Data Processing
thermoIMAGER TIM Connect
Area 1 without post processing
Object 1 with averaging time and smart averaging
Area 1 without post processing
Object 1 with averaging time and without smart averaging
Page 75
Data Processing
thermoIMAGER TIM Connect
6.1.3 Excluding Hot and Cold Spot Areas
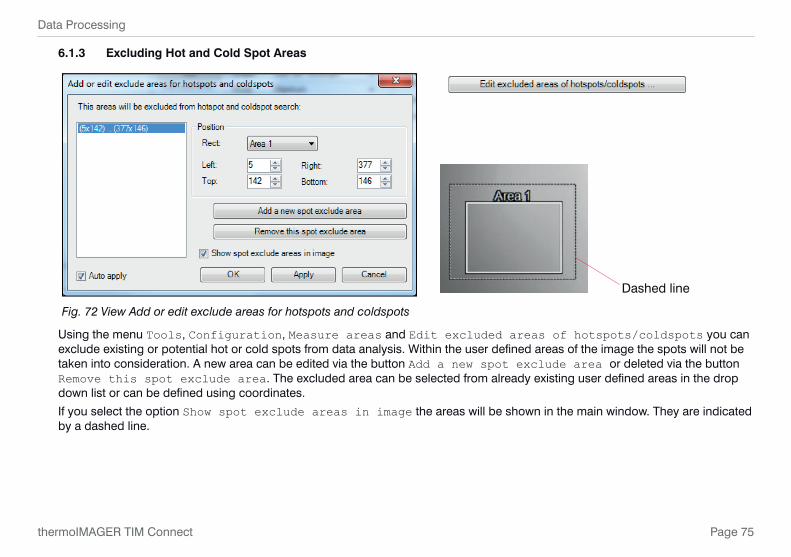
Dashed line
Fig. 72 View Add or edit exclude areas for hotspots and coldspots
Using the menu Tools, Configuration, Measure areas and Edit excluded areas of hotspots/coldspots you can exclude existing or potential hot or cold spots from data analysis. Within the user defined areas of the image the spots will not be taken into consideration. A new area can be edited via the button Add a new spot exclude area or deleted via the button Remove this spot exclude area. The excluded area can be selected from already existing user defined areas in the drop down list or can be defined using coordinates.
If you select the option Show spot exclude areas in image the areas will be shown in the main window. They are indicated by a dashed line.
Page 76
Data Processing
thermoIMAGER TIM Connect
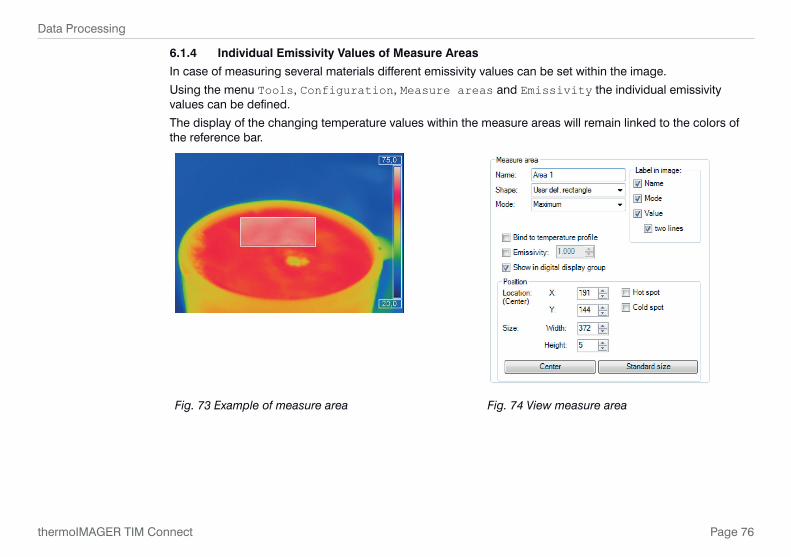
6.1.4 Individual Emissivity Values of Measure Areas
In case of measuring several materials different emissivity values can be set within the image.
Using the menu Tools, Configuration, Measure areas and Emissivity the individual emissivity values can be defined.
The display of the changing temperature values within the measure areas will remain linked to the colors of the reference bar.
Fig. 73 Example of measure area Fig. 74 View measure area
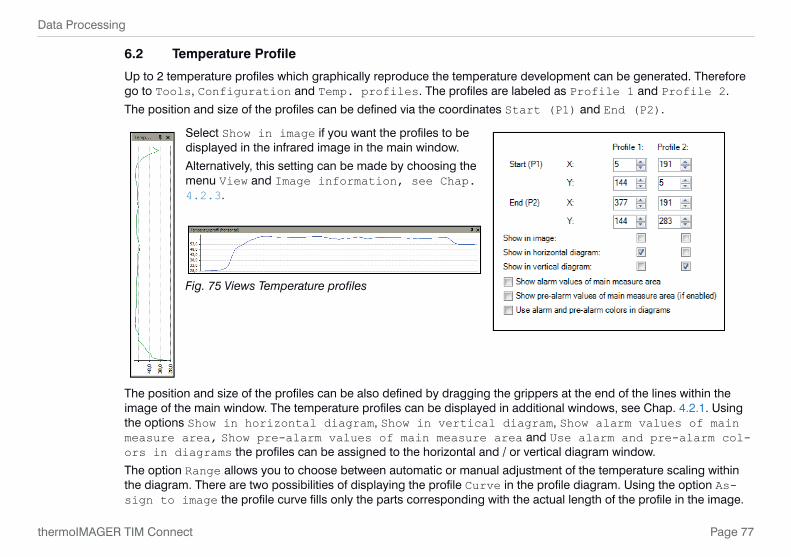
Page 77
Data Processing
thermoIMAGER TIM Connect
6.2 Temperature Profile
Up to 2 temperature profiles which graphically reproduce the temperature development can be generated. Therefore go to Tools, Configuration and Temp. profiles. The profiles are labeled as Profile 1 and Profile 2.
The position and size of the profiles can be defined via the coordinates Start (P1) and End (P2).
Select Show in image if you want the profiles to be displayed in the infrared image in the main window.
Alternatively, this setting can be made by choosing the menu View and Image information, see Chap. 4.2.3.
Fig. 75 Views Temperature profiles
The position and size of the profiles can be also defined by dragging the grippers at the end of the lines within the image of the main window. The temperature profiles can be displayed in additional windows, see Chap. 4.2.1. Using the options Show in horizontal diagram, Show in vertical diagram, Show alarm values of main measure area, Show pre-alarm values of main measure area and Use alarm and pre-alarm col-ors in diagrams the profiles can be assigned to the horizontal and / or vertical diagram window.
The option Range allows you to choose between automatic or manual adjustment of the temperature scaling within the diagram. There are two possibilities of displaying the profile Curve in the profile diagram. Using the option As-sign to image the profile curve fills only the parts corresponding with the actual length of the profile in the image.

Page 78
Data Processing
thermoIMAGER TIM Connect
Using the option Full range the profile curve fills the whole profile diagram independent from the size of the profile.
The profile curve assigned to the image (Display in separate window)
The profile curve assigned to the full range of the diagram (Display in separate window)
Fig. 76 View Bind measure areas to profile
Use Bind measure areas to profile to assign various measure areas to a temperature profile. If the position of the profile is changed all the measure areas will also be moved. The respective profile can be chosen via the option Assign measure areas to.
Prefix for measure area name enables the individual labeling of measure areas. The measure area type can be defined under the Mode options.
Number of measure areas to create as well as the Width [% of profile length] and Minimum height [pi-xels] can also be specified.
Via the Measure mode you can determine the way of displaying the minimum, maximum or mean temperature in the digital dis-play window, see Chap. 4.2.1.

Page 79
Data Processing
thermoIMAGER TIM Connect
Fig. 77 View 3 Measure areas and 3 measure points are assigned to tem-perature profile 1 and 2
Fig. 78 View Bind to temperature profile Wizard
The option Delete existing measure areas of this temperature profile eliminates the de-fined settings of a profile.
Save the settings by pressing the Create button.
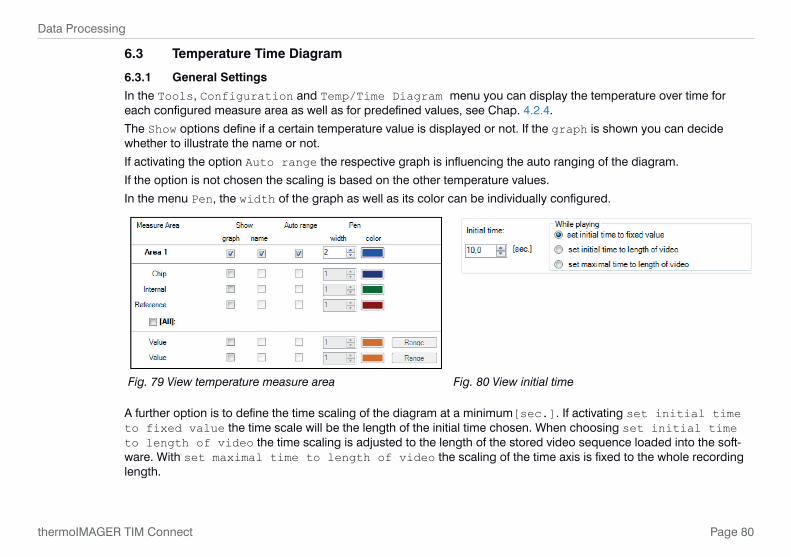
Page 80
Data Processing
thermoIMAGER TIM Connect
6.3 Temperature Time Diagram
6.3.1 General Settings
In the Tools, Configuration and Temp/Time Diagram menu you can display the temperature over time for each configured measure area as well as for predefined values, see Chap. 4.2.4.
The Show options define if a certain temperature value is displayed or not. If the graph is shown you can decide whether to illustrate the name or not.
If activating the option Auto range the respective graph is influencing the auto ranging of the diagram.
If the option is not chosen the scaling is based on the other temperature values.
In the menu Pen, the width of the graph as well as its color can be individually configured.
Fig. 79 View temperature measure area Fig. 80 View initial time
A further option is to define the time scaling of the diagram at a minimum[sec.]. If activating set initial time to fixed value the time scale will be the length of the initial time chosen. When choosing set initial time to length of video the time scaling is adjusted to the length of the stored video sequence loaded into the soft-ware. With set maximal time to length of video the scaling of the time axis is fixed to the whole recording length.
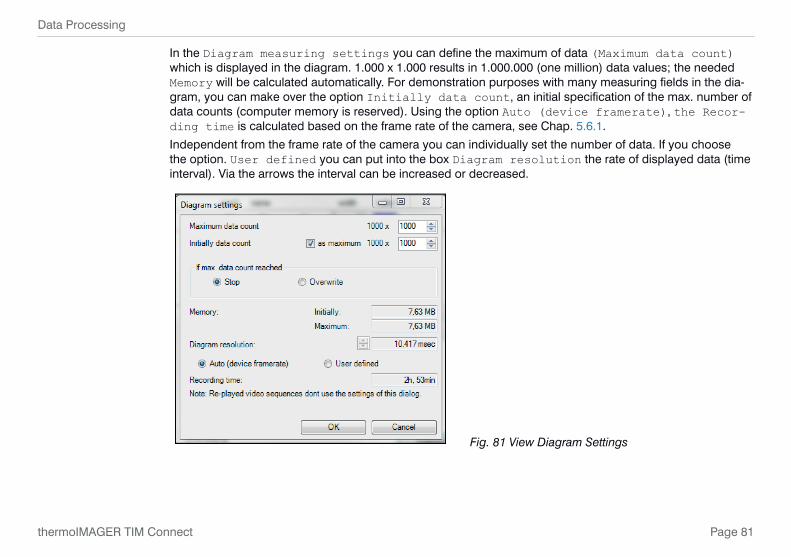
Page 81
Data Processing
thermoIMAGER TIM Connect
In the Diagram measuring settings you can define the maximum of data (Maximum data count) which is displayed in the diagram. 1.000 x 1.000 results in 1.000.000 (one million) data values; the needed Memory will be calculated automatically. For demonstration purposes with many measuring fields in the dia-gram, you can make over the option Initially data count, an initial specification of the max. number of data counts (computer memory is reserved). Using the option Auto (device framerate), the Recor-ding time is calculated based on the frame rate of the camera, see Chap. 5.6.1.
Independent from the frame rate of the camera you can individually set the number of data. If you choose the option. User defined you can put into the box Diagram resolution the rate of displayed data (time interval). Via the arrows the interval can be increased or decreased.
Fig. 81 View Diagram Settings

Page 82
Data Processing
thermoIMAGER TIM Connect
6.3.2 Scaling of Diagram Axes
Control elements of the time axis
1 Scroll bar to choose time segment2 Zoom (increase) into the diagram. The temperature axis will remain.3 Zoom (decrease) into the diagram. The temperature axis will remain.4 Whole range: Display of whole time axis, e.g. of a stored video sequence.5 H: Hold/ C: Continue: Any activation of the H control element will stop the further actualization of the
measurement graph. The measurement itself continues in the background. To return to the current measurement graph please press the C control element.
During the stopped status any parts of the diagram can be selected. With the zoom in-button + these parts can be stretched (enlarged) and with the zoom out-button – clinched (minimized).
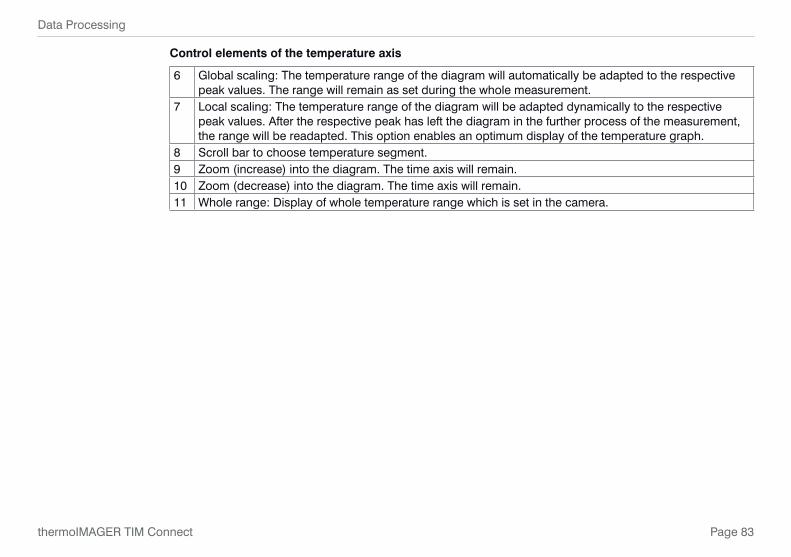
Page 83
Data Processing
thermoIMAGER TIM Connect
Control elements of the temperature axis
6 Global scaling: The temperature range of the diagram will automatically be adapted to the respective peak values. The range will remain as set during the whole measurement.
7 Local scaling: The temperature range of the diagram will be adapted dynamically to the respective peak values. After the respective peak has left the diagram in the further process of the measurement, the range will be readapted. This option enables an optimum display of the temperature graph.
8 Scroll bar to choose temperature segment.9 Zoom (increase) into the diagram. The time axis will remain.10 Zoom (decrease) into the diagram. The time axis will remain.11 Whole range: Display of whole temperature range which is set in the camera.
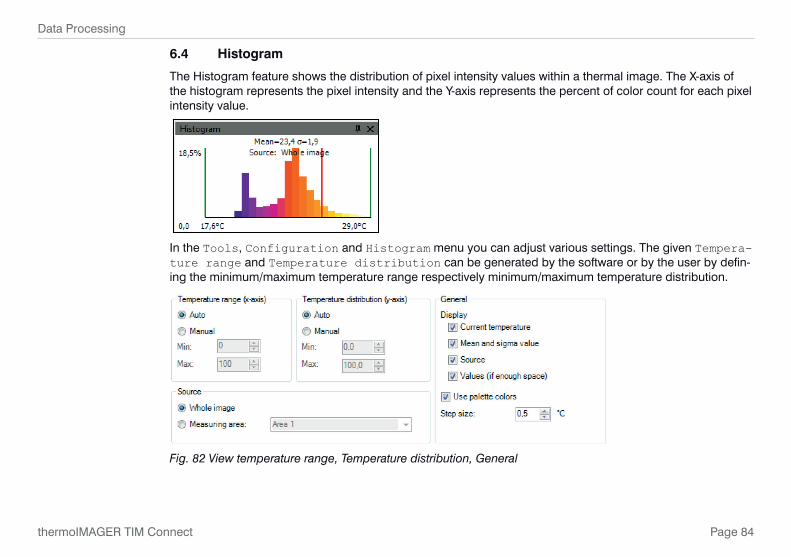
Page 84
Data Processing
thermoIMAGER TIM Connect
6.4 Histogram
The Histogram feature shows the distribution of pixel intensity values within a thermal image. The X-axis of the histogram represents the pixel intensity and the Y-axis represents the percent of color count for each pixel intensity value.
In the Tools, Configuration and Histogram menu you can adjust various settings. The given Tempera-ture range and Temperature distribution can be generated by the software or by the user by defin-ing the minimum/maximum temperature range respectively minimum/maximum temperature distribution.
Fig. 82 View temperature range, Temperature distribution, General
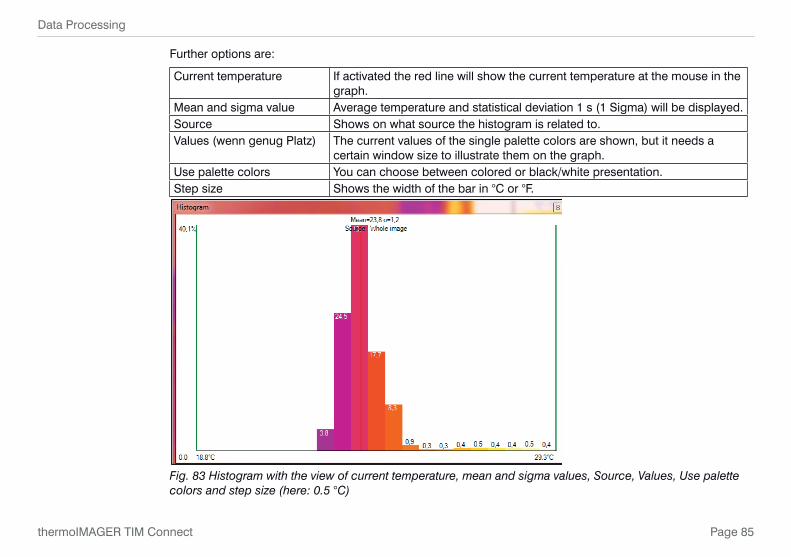
Page 85
Data Processing
thermoIMAGER TIM Connect
Further options are:
Current temperature If activated the red line will show the current temperature at the mouse in the graph.
Mean and sigma value Average temperature and statistical deviation 1 s (1 Sigma) will be displayed.Source Shows on what source the histogram is related to.Values (wenn genug Platz) The current values of the single palette colors are shown, but it needs a
certain window size to illustrate them on the graph.Use palette colors You can choose between colored or black/white presentation.Step size Shows the width of the bar in °C or °F.
Fig. 83 Histogram with the view of current temperature, mean and sigma values, Source, Values, Use palette colors and step size (here: 0.5 °C)

Page 86
Data Processing
thermoIMAGER TIM Connect
6.5 Extended Measuring Colors
The Tools, Configuration, Measuring colors and Extended Measuring colors menus offer you the possibility to change the pixel color within the image if the temperature Range reaches predefined low and/or high temperature values. Doing this you can visualize temperature gradients.Furthermore, the display of isotherms (colored display of temperature group) is possible.Via the Threshold definition you can set two temperature values. The individual display of pixel located over (High), between (Mid) or below (Low) the thresholds can be defined by specific isotherm (Color) or by an alternative color palette (Alt. Palette).Using Alt. palette the colors correspond to the temperature borders in the reference bar option. You will see the range of the palette which was defined by the thresholds. With Ext. Alt. Palette you can indi-vidually define the start and end point of the extended alternative color palette within the overall reference bar.
Fig. 84 View Extended measuring colors
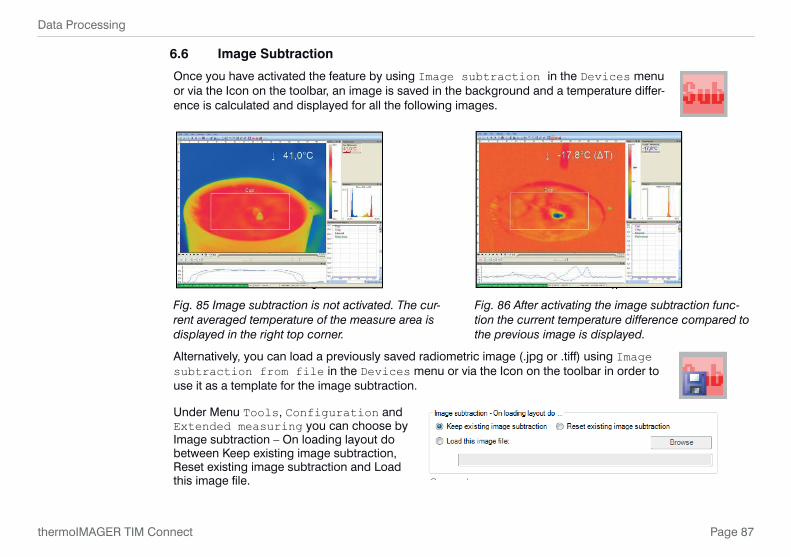
Page 87
Data Processing
thermoIMAGER TIM Connect
6.6 Image Subtraction
Once you have activated the feature by using Image subtraction in the Devices menu or via the Icon on the toolbar, an image is saved in the background and a temperature differ-ence is calculated and displayed for all the following images.
Fig. 85 Image subtraction is not activated. The cur-rent averaged temperature of the measure area is displayed in the right top corner.
Fig. 86 After activating the image subtraction func-tion the current temperature difference compared to the previous image is displayed.
Alternatively, you can load a previously saved radiometric image (.jpg or .tiff) using Image subtraction from file in the Devices menu or via the Icon on the toolbar in order to use it as a template for the image subtraction.
Under Menu Tools, Configuration and Extended measuring you can choose by Image subtraction – On loading layout do between Keep existing image subtraction, Reset existing image subtraction and Load this image file.

Page 88
Data Processing
thermoIMAGER TIM Connect
6.7 Relative Extreme Values
Within the Tools, Configuration and Extended measuring menu it is possible to exclude pixel within the thermal image from data analysis.
Using Ignore pixels with temperatures a temperature can be set as lowest (below) or highest (above) value.
In case of analyzing an image using measure areas (for measure areas) the calculation of e.g. the mean value is not taking values below or above the set limits into account.
For hot/cold spots localization determines that all pixels with the defined values are excluded from search.
For </> temperature ranging means that all pixels with the respective temperature do not influence e.g. the automatic scaling of temperature-time-diagram.
Fig. 87 Relative Extreme values
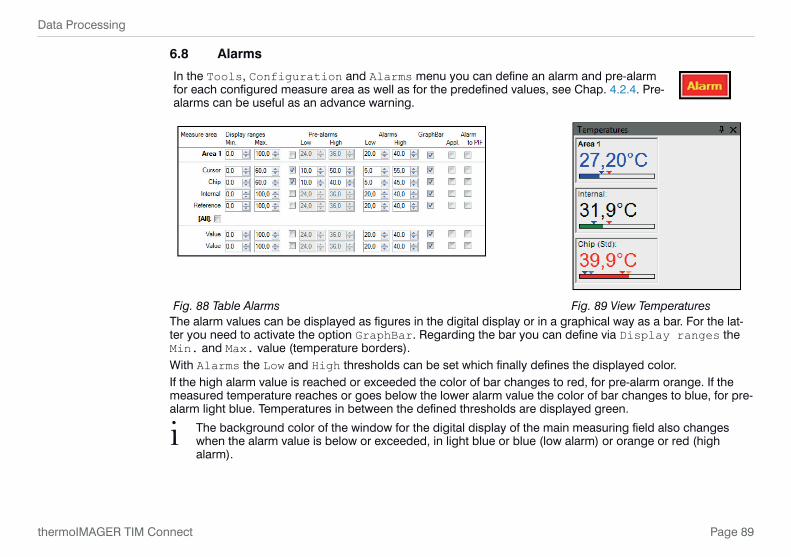
Page 89
Data Processing
thermoIMAGER TIM Connect
6.8 Alarms
In the Tools, Configuration and Alarms menu you can define an alarm and pre-alarm for each configured measure area as well as for the predefined values, see Chap. 4.2.4. Pre-alarms can be useful as an advance warning.
Fig. 88 Table Alarms Fig. 89 View TemperaturesThe alarm values can be displayed as figures in the digital display or in a graphical way as a bar. For the lat-ter you need to activate the option GraphBar. Regarding the bar you can define via Display ranges the Min. and Max. value (temperature borders).With Alarms the Low and High thresholds can be set which finally defines the displayed color.If the high alarm value is reached or exceeded the color of bar changes to red, for pre-alarm orange. If the measured temperature reaches or goes below the lower alarm value the color of bar changes to blue, for pre-alarm light blue. Temperatures in between the defined thresholds are displayed green.
i The background color of the window for the digital display of the main measuring field also changes when the alarm value is below or exceeded, in light blue or blue (low alarm) or orange or red (high alarm).

Page 90
Data Processing
thermoIMAGER TIM Connect
If a temperature value shall be used as an pre-alarm, you need to tag the Pre-alarms option. The alarm can also be put out via the Process Interface (PIF) using the Alarm to PIF option.
i If activating the Alarm Appl., a red alarm button on the toolbar appears. You can deactivate the visual and acoustic alarm by clicking on the alarm button. The alarm will stay deactivate until the alarm value is reached again.
In the Alarm configuration window you can set an Audible alarm, see Fig. 90. In the Inter-val [sec] input box you can specify the time interval the sound appears. Via the Path to sound file you can Browse an individual *.wav file. The acoustic alarm signalization can be repeated in defined intervals setting the Interval [sec].
Using the option Recording on alarm, see Fig. 91, you can specify a Delay [sec]. The recording starts after the delay time is over. In the Duration [sec] box the recording time of the video sequence can be set.
Fig. 90 View Audible Alarm Fig. 91 View Recording on alarm

Page 91
Data Processing
thermoIMAGER TIM Connect
Furthermore, a recording can be stopped via Abort recording if alarm condition drops out. If this option is not chosen the recording will be finished based on the time in the duration box.
With the Snapshot on alarm option you can set a Delay [sec] time before an alarm will trigger the storage of an image.
Fig. 92 View Snapshot on alarm
6.9 3D Display of Thermal Image
Thermal images can be displayed in real time as 3 dimensional images. The 3D Chart is dis-played in a separate window. To add the software window please use the menu item View, Windows and 3D Chart or the Icon on the toolbar.
Fig. 93 View 3D display of thermal image
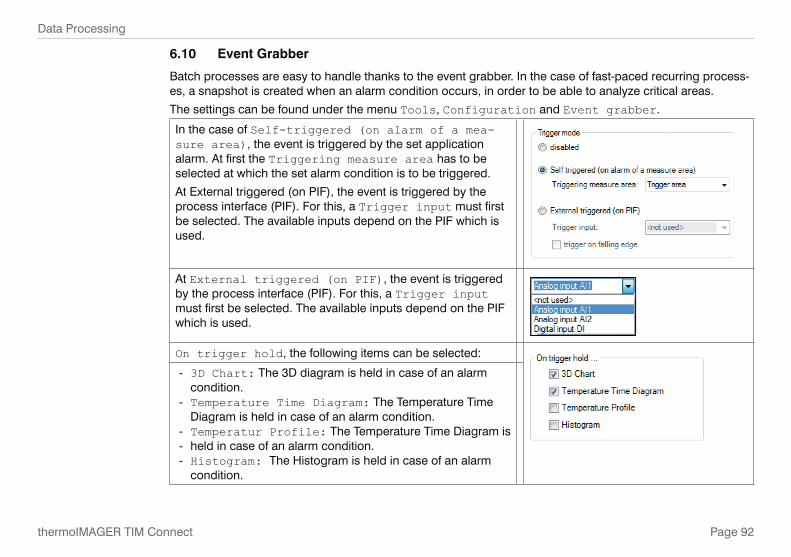
Page 92
Data Processing
thermoIMAGER TIM Connect
6.10 Event Grabber
Batch processes are easy to handle thanks to the event grabber. In the case of fast-paced recurring process-es, a snapshot is created when an alarm condition occurs, in order to be able to analyze critical areas.
The settings can be found under the menu Tools, Configuration and Event grabber.
In the case of Self-triggered (on alarm of a mea-sure area), the event is triggered by the set application alarm. At first the Triggering measure area has to be selected at which the set alarm condition is to be triggered.
At External triggered (on PIF), the event is triggered by the process interface (PIF). For this, a Trigger input must first be selected. The available inputs depend on the PIF which is used.
At External triggered (on PIF), the event is triggered by the process interface (PIF). For this, a Trigger input must first be selected. The available inputs depend on the PIF which is used.
On trigger hold, the following items can be selected:
- 3D Chart: The 3D diagram is held in case of an alarm condition.
- Temperature Time Diagram: The Temperature Time Diagram is held in case of an alarm condition.
- Temperatur Profile: The Temperature Time Diagram is - held in case of an alarm condition. - Histogram: The Histogram is held in case of an alarm
condition.

Page 93
Data Processing
thermoIMAGER TIM Connect
Under Extended settings, a Holdoff time can be en-tered. A new alarm condition is not taken into account during this set time.
If the checkmark is enabled by Allow event grabbing (and alarm) while playing, the event grabber is consid-ered when playing a Ravi.
Create snapshot on event will create a snapshot after every event which will appear in the snapshot history and in the event grabber (frozen image) window.
The triggered snapshot for the event grabber can be found under menu View, Windows and Event grab-ber (frozen Image).
Measurement areas can be created and arranged in the live IR image as well as in the event grabber (frozen image). If you want to add an measurement area in the event grabber (frozen image), this must be set under the Configuration menu and Measure areas. Under Measure area, the check mark Use in event grabber must be selected.
As a template for the event grabber, you can use the sample layout Event grabber.

Page 94
Data Processing
thermoIMAGER TIM Connect
6.11 Zoom Function of Snapshots
Captured snapshots can be enlarged when viewed. To do this, open a saved snapshot (TIFF file), see Chap. 5.1.
Use + to zoom in and - to zoom out or use the bars on the side.
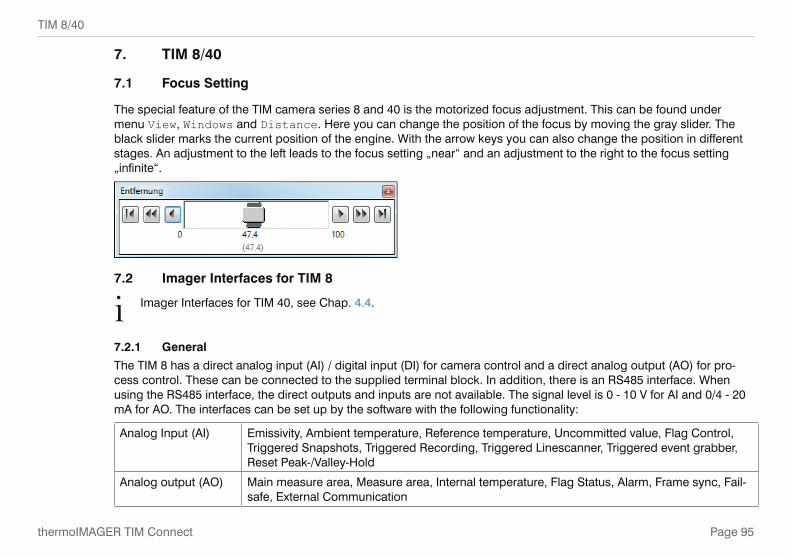
Page 95
TIM 8/40
thermoIMAGER TIM Connect
7. TIM 8/40
7.1 Focus Setting
The special feature of the TIM camera series 8 and 40 is the motorized focus adjustment. This can be found under menu View, Windows and Distance. Here you can change the position of the focus by moving the gray slider. The black slider marks the current position of the engine. With the arrow keys you can also change the position in different stages. An adjustment to the left leads to the focus setting „near“ and an adjustment to the right to the focus setting „infinite“.
7.2 Imager Interfaces for TIM 8
i Imager Interfaces for TIM 40, see Chap. 4.4.
7.2.1 General
The TIM 8 has a direct analog input (AI) / digital input (DI) for camera control and a direct analog output (AO) for pro-cess control. These can be connected to the supplied terminal block. In addition, there is an RS485 interface. When using the RS485 interface, the direct outputs and inputs are not available. The signal level is 0 - 10 V for AI and 0/4 - 20 mA for AO. The interfaces can be set up by the software with the following functionality:
Analog Input (AI) Emissivity, Ambient temperature, Reference temperature, Uncommitted value, Flag Control, Triggered Snapshots, Triggered Recording, Triggered Linescanner, Triggered event grabber, Reset Peak-/Valley-Hold
Analog output (AO) Main measure area, Measure area, Internal temperature, Flag Status, Alarm, Frame sync, Fail-safe, External Communication
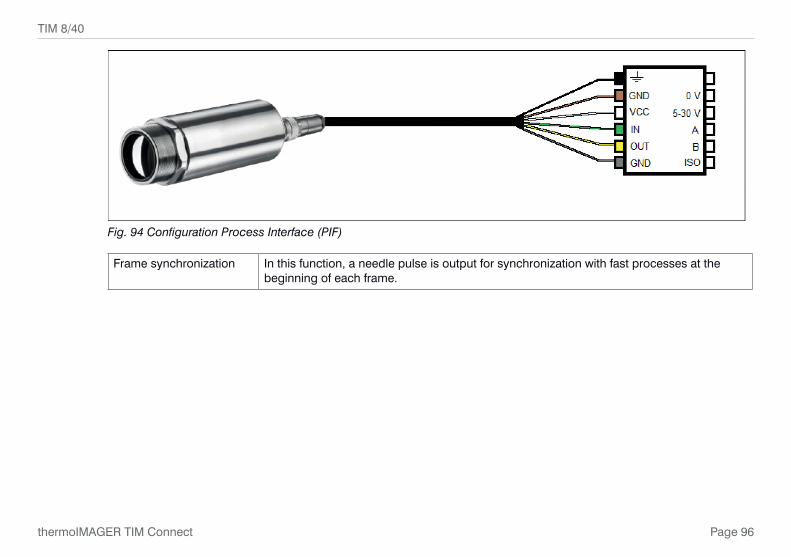
Page 96
TIM 8/40
thermoIMAGER TIM Connect
Fig. 94 Configuration Process Interface (PIF)
Frame synchronization In this function, a needle pulse is output for synchronization with fast processes at the beginning of each frame.
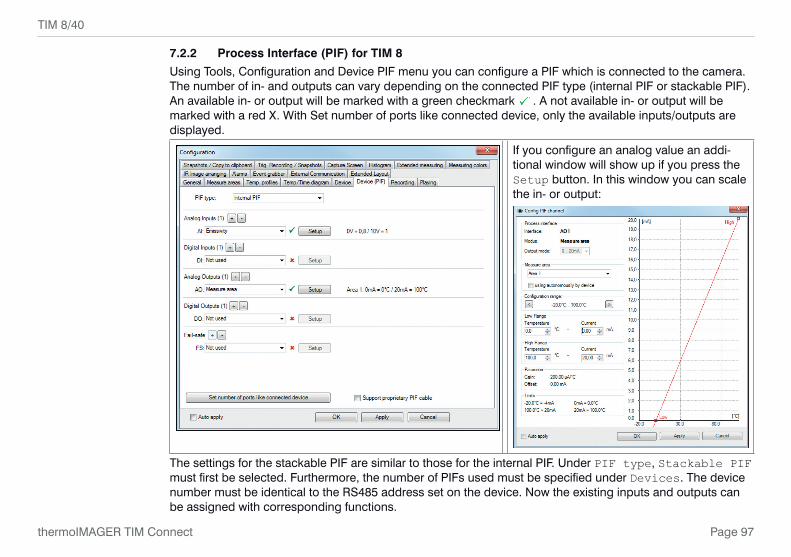
Page 97
TIM 8/40
thermoIMAGER TIM Connect
7.2.2 Process Interface (PIF) for TIM 8
Using Tools, Configuration and Device PIF menu you can configure a PIF which is connected to the camera. The number of in- and outputs can vary depending on the connected PIF type (internal PIF or stackable PIF). An available in- or output will be marked with a green checkmark . A not available in- or output will be marked with a red X. With Set number of ports like connected device, only the available inputs/outputs are displayed.
If you configure an analog value an addi-tional window will show up if you press the Setup button. In this window you can scale the in- or output:
The settings for the stackable PIF are similar to those for the internal PIF. Under PIF type, Stackable PIF must first be selected. Furthermore, the number of PIFs used must be specified under Devices. The device number must be identical to the RS485 address set on the device. Now the existing inputs and outputs can be assigned with corresponding functions.
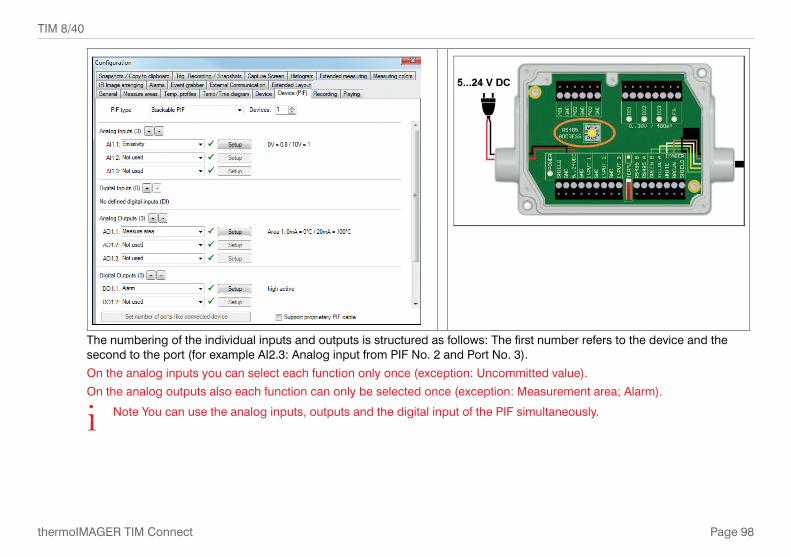
Page 98
TIM 8/40
thermoIMAGER TIM Connect
The numbering of the individual inputs and outputs is structured as follows: The first number refers to the device and the second to the port (for example AI2.3: Analog input from PIF No. 2 and Port No. 3).
On the analog inputs you can select each function only once (exception: Uncommitted value).
On the analog outputs also each function can only be selected once (exception: Measurement area; Alarm).
i Note You can use the analog inputs, outputs and the digital input of the PIF simultaneously.

Page 99
TIM 8/40
thermoIMAGER TIM Connect
If you activate the function Alarm on an analog output you need to assign also in the Alarms tab the desired measurement area to the desired PIF output.
The industrial PIF has a maximum of three analog outputs. To use more outputs, you can cascade up to three PIFs, allowing you to use up to 9 analog or alarm outputs in total.
For more information on the settings for alarms, see Chap. 6.8.
Controlled conditions on camera and software
Standard process interface TM-PIF-TIM8
Industrial process interface TM-PIFCBx-TIM8
Interruption USB cable to cameraInterruption data cable camera - PIFInterruption power supply - PIFShut-down of TIM Connect softwareCrash of TIM Connect software 1 -Fail-safe output 0 V at analog output (AO) Open contact (Fail-safe relay)/
green LED off
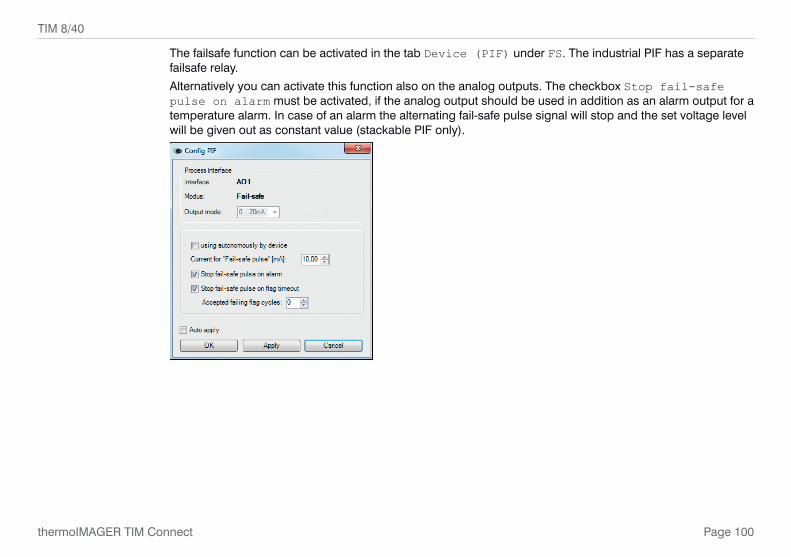
Page 100
TIM 8/40
thermoIMAGER TIM Connect
The failsafe function can be activated in the tab Device (PIF) under FS. The industrial PIF has a separate failsafe relay.
Alternatively you can activate this function also on the analog outputs. The checkbox Stop fail-safe pulse on alarm must be activated, if the analog output should be used in addition as an alarm output for a temperature alarm. In case of an alarm the alternating fail-safe pulse signal will stop and the set voltage level will be given out as constant value (stackable PIF only).

Page 101
TIM 8/40
thermoIMAGER TIM Connect
7.3 IP Settings TIM 8
The TIM 8 has a direct Ethernet interface (see thermoIMAGER TIM operating instructions). To make the appropriate address settings, go to Tools, Extended and TCP/IP Settings.
The address for the device is assigned under Device address. This must have a different address to the other participant (Send to ad-dress).
7.4 Autonomous Operation TIM 8
A special feature of the TIM 8 is the autonomous operation. There is no need for a permanent connection to the TIM Connect software. Only a few settings must be set in advance in the software.
Proceed as described, see Chap. 7.2.2. Select an output and press Setup. Here you have to put the check in using autonomously by de-vice.
A @ sign will appear next to the output used in the configuration menu Device PIF. Whenever this sign is visible, the function can run in autonomous operation.

Page 102
Visual Camera (only TIM 200/230)
thermoIMAGER TIM Connect
8. Visual Camera (only TIM 200/230)
8.1 Enabling the Visual Camera
The TIM 200/230 thermal imager features a visual camera. With the help of BI-SPECTRAL technology, the visual image (VIS) can be combined with a thermal image (IR). Both can be finally captured time synchro-nously. The visual camera can be enabled in the Tools, Configuration and General menu under Vis-ible camera via the option Use (if available).
Fig. 95 View Visible camera
The menu Tools, Configuration and Device displays the Video formats depending on the current imager’s configuration.
The thermal image (160 x 120 pixels) will be shown with 96 images per second (96 Hz), the visual image (640 x 480 pixels) with 32 Hz. In the second mode, the thermal image is displayed at 160 x 120 pixels with a speed of 128 Hz and the visual image with a resolution of 596 x 447 pixels with 32 Hz.
Fig. 96 View Video camera

Page 103
Visual Camera (only TIM 200/230)
thermoIMAGER TIM Connect
8.2 Monitoring Modus
The monitoring modus is used to have an easy orientation at the point of measurement. In this modus the visual image is displayed in a separate window.
To add the separate software window please use the menu item View, Windows and Vis-ible video or the Icon on the toolbar.
Fig. 97 Monitoring Modus
i The rectangle within the visual image shows the area covered by the thermal image. In order to cover a big area the wide-angle lens is used, to cover a smaller area the telephoto lens. In the View, Image Information and IR rectangle menu it is possible to hide the displayed rectangle.
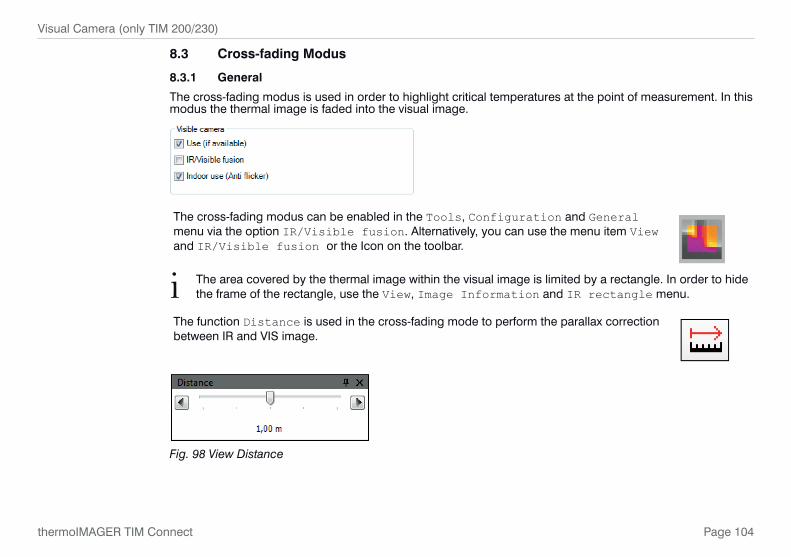
Page 104
Visual Camera (only TIM 200/230)
thermoIMAGER TIM Connect
8.3 Cross-fading Modus
8.3.1 General
The cross-fading modus is used in order to highlight critical temperatures at the point of measurement. In this modus the thermal image is faded into the visual image.
The cross-fading modus can be enabled in the Tools, Configuration and General menu via the option IR/Visible fusion. Alternatively, you can use the menu item View and IR/Visible fusion or the Icon on the toolbar.
i The area covered by the thermal image within the visual image is limited by a rectangle. In order to hide the frame of the rectangle, use the View, Image Information and IR rectangle menu.
The function Distance is used in the cross-fading mode to perform the parallax correction between IR and VIS image.
Fig. 98 View Distance

Page 105
Visual Camera (only TIM 200/230)
thermoIMAGER TIM Connect
8.3.2 Transparency of Thermal Image
The thermal image can smoothly be faded into the visual image (0 … 100 %). To set the transparency value please use the Tools, Configuration, Measuring colors menu and Standard palette / Transparency [%].
Fig. 99 View Standard palette
0 % The thermal image is fully faded into the visual image.
50 % The thermal image is partly (50 %) faded into the visual image.
Using this setting the ideal relation of both images can be defined, see Chap. 8.3.3.
100 % The thermal image is fully transparent and will not be shown in the visual image.
Fig. 100 Cross-fading of thermal image and visual image by 0 % setting
Fig. 101 Cross-fading of thermal image and visual image by 50 % setting
Fig. 102 Cross-fading of thermal image and visual image by 100 % setting

Page 106
Visual Camera (only TIM 200/230)
thermoIMAGER TIM Connect
8.3.3 Moving the Thermal within the Visual Image
Due to the different optical axis of visual and thermal channel the relation of both images needs to be optimized. If moving the cursor to the edges of the rectangle‘s frame the grippers can be used to adjust the size of thermal image or to move the image completely (hold Ctrl synchronously).
Fig. 103 Adjustment of thermal image by dragging to the top right
Fig. 104 Adjustment of thermal image by dragging to the top
Fig. 105 Ideal adjustment of thermal image to the visual image
i The ideal relation of both images can be set easily by fading the thermal image into the visual image by 50 %, see Chap. 8.3.2.
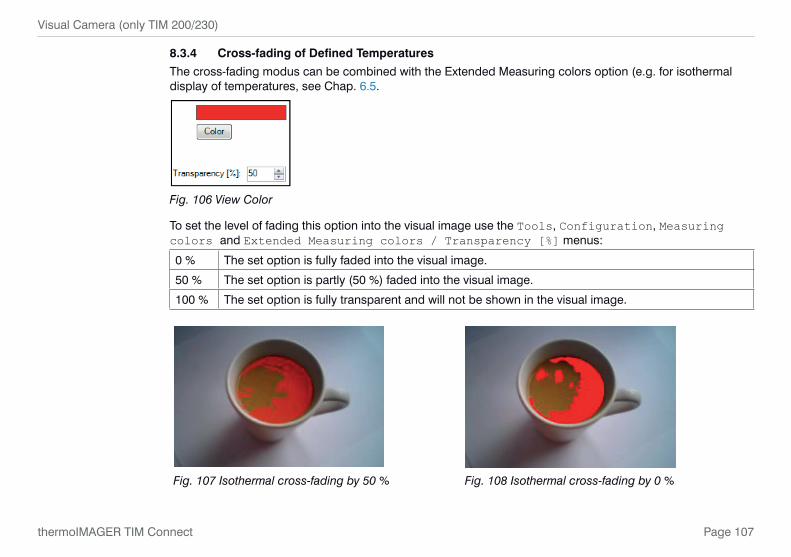
Page 107
Visual Camera (only TIM 200/230)
thermoIMAGER TIM Connect
8.3.4 Cross-fading of Defined Temperatures
The cross-fading modus can be combined with the Extended Measuring colors option (e.g. for isothermal display of temperatures, see Chap. 6.5.
Fig. 106 View Color
To set the level of fading this option into the visual image use the Tools, Configuration, Measuring colors and Extended Measuring colors / Transparency [%] menus:
0 % The set option is fully faded into the visual image.
50 % The set option is partly (50 %) faded into the visual image.
100 % The set option is fully transparent and will not be shown in the visual image.
Fig. 107 Isothermal cross-fading by 50 % Fig. 108 Isothermal cross-fading by 0 %
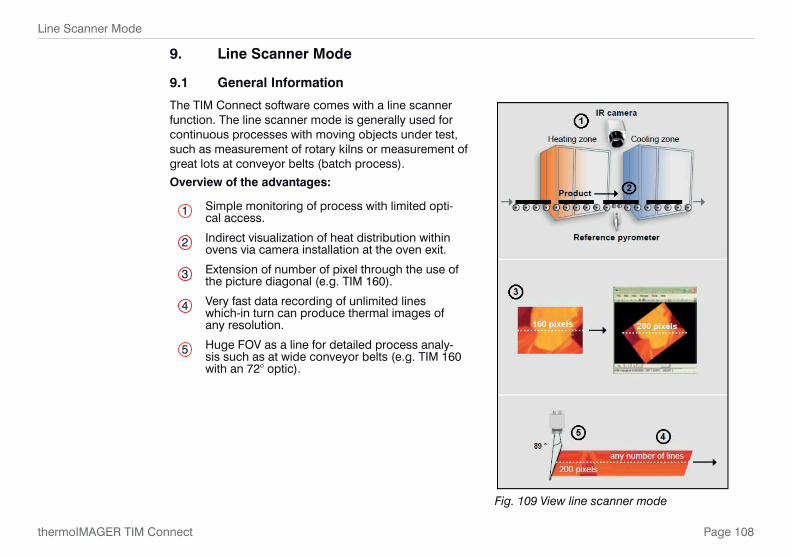
Page 108
Line Scanner Mode
thermoIMAGER TIM Connect
9. Line Scanner Mode
9.1 General Information
The TIM Connect software comes with a line scanner function. The line scanner mode is generally used for continuous processes with moving objects under test, such as measurement of rotary kilns or measurement of great lots at conveyor belts (batch process).
Overview of the advantages:
1 Simple monitoring of process with limited opti-cal access.
2 Indirect visualization of heat distribution within ovens via camera installation at the oven exit.
3 Extension of number of pixel through the use of the picture diagonal (e.g. TIM 160).
4 Very fast data recording of unlimited lines which-in turn can produce thermal images of any resolution.
5 Huge FOV as a line for detailed process analy-sis such as at wide conveyor belts (e.g. TIM 160 with an 72° optic).
Fig. 109 View line scanner mode

Page 109
Line Scanner Mode
thermoIMAGER TIM Connect
9.2 Basic Settings
9.2.1 Line Scanner Configuration Menu
All the settings related to the line scanner mode can be done through the Line scanner configuration menu. You will find the menu under Tools, Line scanner mode and Line scanner settings or as an Icon on the tool bar.
9.2.2 Choosing the LayoutBefore you configure the Line scanner mode a suitable layout (e.g. alignment of application windows) should be chosen or created, see Chap. 4.2.
9.2.3 Rotating of the ImageFor some application is it of advantage to increase the number of pixels per line by changing the view angle.To do so go to Rotate menu, see Chap. 4.2.10.
Mount the camera under defined angle according to the chosen angle, too.
Fig. 110 View Rotate Fig. 111 View Rotate

Page 110
Line Scanner Mode
thermoIMAGER TIM Connect
9.2.4 Activating the Line Scanner
In order to configure the Line scanner it is necessary to activate the Line scanner mode under Tools, Line scanner mode and Enable Linescanner or using the Icon on the tool bar.
i There are two view options available under Line scanner mode. Line scanner sighting view is showing the position of the line and self-trigger area within the infrared image taken by the camera. Line scanner view delivers the resulting infrared image based on temperature readings for selected lines.
9.2.5 Positioning of the Line (Line Scanner Sighting View)
The pre-defined position of the line can be seen in the Line scanner sighting view. To access the view go to Tools, Line scanner mode and Line scanner sighting view or use the Icon provided.
i This icon enables to switch between Line scanner sighting view and Line scanner view.
To define the position of the line within the infrared image, go to Line scanner configuration appli-cation window, see Chap. 9.2.1, in the Source menu. In the Lines taken from source section using First row and Last row field you can specify how many lines are to be considered during the measure-ment. Number 1 stands for the first line from the top in the infrared image.
Fig. 112 View Lines taken from source

Page 111
Line Scanner Mode
thermoIMAGER TIM Connect
If more than one line should be taken from the source the Direction menu enables to choose the direction in which they will be measured and consequently displayed in Line scanner sighting view mode. The option Scan on user defined line makes it possible to graphically position the scan line through the mouse. It can also be entered by the coordinates (X and Y) in the Start point (P1) and End point (P2) fields. The number of pixels on the scan line and the angle are displayed in the field linescanner pixels and linescanner angle. In addition to the start and end point, additional points can be added under Add, allowing complex lines to be created. Lines or Splines can be used.
The other options you can choose from are Scan top-down (rows) where the lines are measured and displayed from the top to the bottom, Scan bottom-up (rows) from bottom to top, Scan left to right (columns) from left to right and Scan right to left (columns) from right to left.
In all direction variants the scan line can be moved by mouse.
In the Scan on user defined line, individual points are moved by drag-n-drop.
The entire scan line is moved by touching a point with the Ctrl key pressed at the same time.
A rotation is reached when first a point is selected with simultaneous pressing the Alt key (this is the pivot point) and then a second point is drawn to rotate the line.
Fig. 113 View Direction Fig. 114 View Points of user defined line

Page 112
Line Scanner Mode
thermoIMAGER TIM Connect
Fig. 115 View - 4 possibilities
The displayed line scanner sighting views visualize the four possibilities how to capture and finally represent multiple lines in the line scanner view.
Scan line with multiple points as spline
Scan line with multiple points as lines
Rotation of the scan line around a pivot point

Page 113
Line Scanner Mode
thermoIMAGER TIM Connect
9.2.6 Layout Configuration of the Sighting View Mode
You can make further modifications to the Sighting view, see Chap. 9.2.1 mode using Tools, Line scanner mode and Line scanner settings. If you go to Sighting view you can define several modifications. The option Show source scanning lines enables you to fade the scanning lines in and out. With Show self triggering area the self triggered area can be faded in and out. Alternative temperature range for sighting view option enables switching to temperature range different from the one used for the measurement. It is sometimes helpful to configure the line scanner when process is stopped using one temperature range where as different temperature range is defined to examine running process. As a further option Alternative temperature range scaling for sighting view you can set up your own temperature range scaling.
Fig. 116 View Sighting view
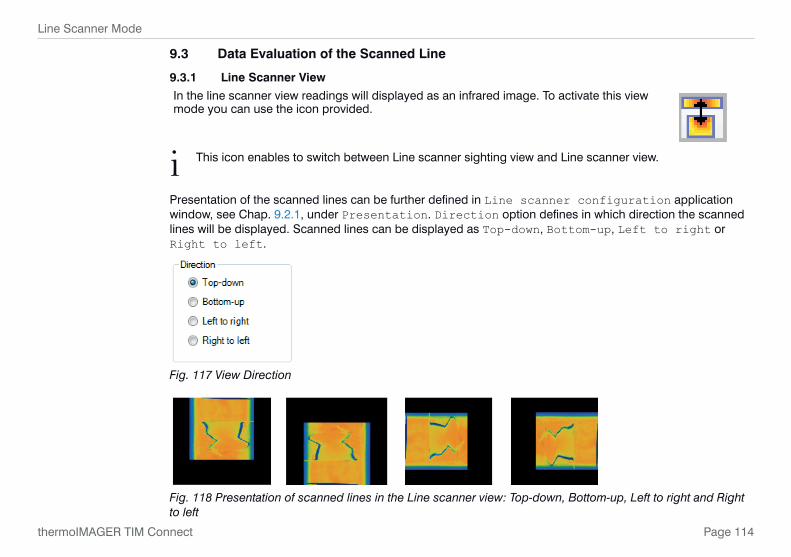
Page 114
Line Scanner Mode
thermoIMAGER TIM Connect
9.3 Data Evaluation of the Scanned Line
9.3.1 Line Scanner View
In the line scanner view readings will displayed as an infrared image. To activate this view mode you can use the icon provided.
i This icon enables to switch between Line scanner sighting view and Line scanner view.
Presentation of the scanned lines can be further defined in Line scanner configuration application window, see Chap. 9.2.1, under Presentation. Direction option defines in which direction the scanned lines will be displayed. Scanned lines can be displayed as Top-down, Bottom-up, Left to right or Right to left.
Fig. 117 View Direction
Fig. 118 Presentation of scanned lines in the Line scanner view: Top-down, Bottom-up, Left to right and Right to left
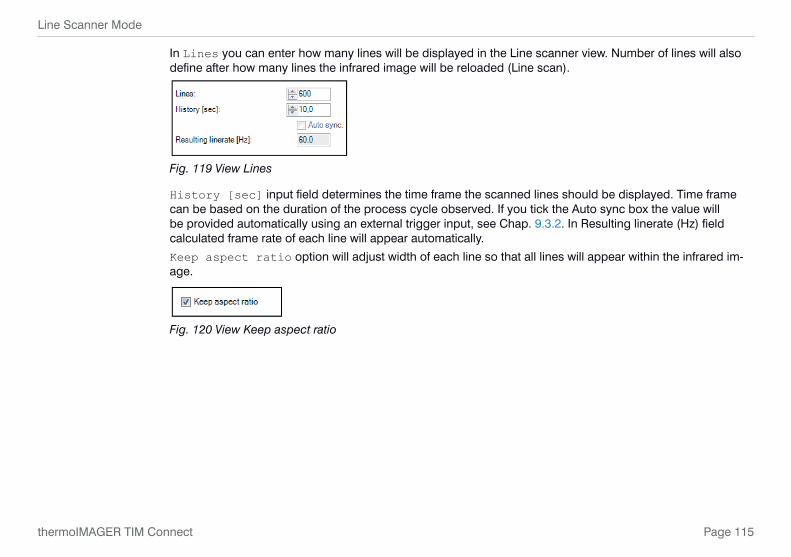
Page 115
Line Scanner Mode
thermoIMAGER TIM Connect
In Lines you can enter how many lines will be displayed in the Line scanner view. Number of lines will also define after how many lines the infrared image will be reloaded (Line scan).
Fig. 119 View Lines
History [sec] input field determines the time frame the scanned lines should be displayed. Time frame can be based on the duration of the process cycle observed. If you tick the Auto sync box the value will be provided automatically using an external trigger input, see Chap. 9.3.2. In Resulting linerate (Hz) field calculated frame rate of each line will appear automatically.
Keep aspect ratio option will adjust width of each line so that all lines will appear within the infrared im-age.
Fig. 120 View Keep aspect ratio

Page 116
Line Scanner Mode
thermoIMAGER TIM Connect
9.3.2 Triggered Display of Lines
Triggering signal can be used to control how the scanned lines will be arranged within the Line scanner view. In the General menu under Line scanner configuration, see Chap. 9.3.1, there are two options provided.
Continuous mode will apply predefined values to display the scanned lines. No triggering signal will be used to control the line scanner presentation.
External triggered option enables using an external triggering signal to control arranging of the scanned lines. Number of lines being reloaded after this signal is defined under Lines and History [sec] , see Chap. 9.3.1.
Further settings can be specified:
In Flag operation if you activate Avoid during scan before auto-snapshots refreshing of flag will not be executed during the line scan, see Chap. 4.3.2.
Fig. 121 View Flag operation

Page 117
Line Scanner Mode
thermoIMAGER TIM Connect
If activated Avoid re-triggering during scan will not allow to run a new line scan cycle while a previ-ous cycle trigger by recent signal is not finished.
Using Avoid temperature analyzing, detecting alarm states and PIF operation during scan, the three opera-tions mentioned are performed only at the end of the scan. This is very helpful for performance reasons when a very high sampling rate (e.g. 1000 Hz, TIM 1M) is set.
i For external triggering it is necessary to do modifications of the standard configuration on the Process Interface (PIF). You will find more details, see Chap. 4.4.
Using the Self triggered option it is possible to use a triggering signal provided by software to control arrang-ing of the scanned lines. Number of lines being reloaded after this signal is defined under Lines and History [sec], see Chap. 9.3.1.

Page 118
Line Scanner Mode
thermoIMAGER TIM Connect
Further modifications can be carried out:
First of all Trigger area within the infrared image needs to be specified. With the mouse you can make a graphic free positioning of the self trigger area in the sighting view. In the Set Default button you can choose between Top, Bottom, Left, Right, Center and Full image.
Within the trigger area Trigger thresholds temperatures can be set to trigger the line scan cycle.
Holdoff time [s] determines time frame within new signal should be neglected (e. g. if a signal from the heat source in the background is triggered).
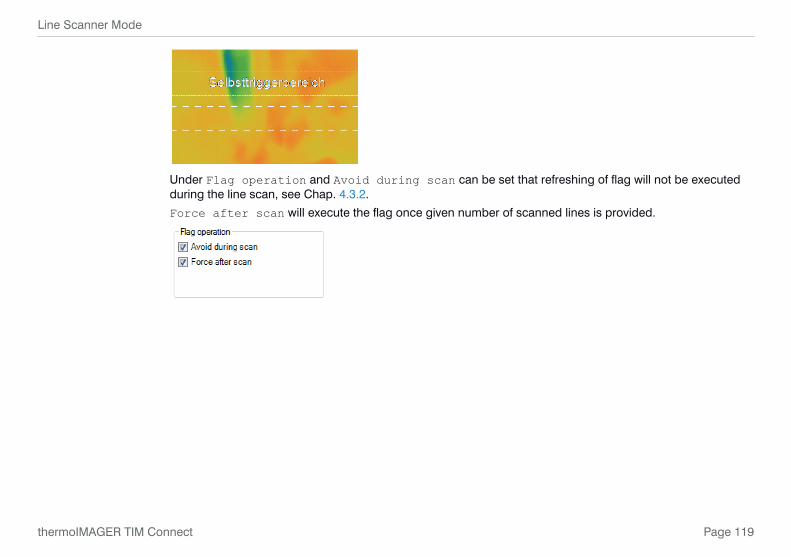
Page 119
Line Scanner Mode
thermoIMAGER TIM Connect
Under Flag operation and Avoid during scan can be set that refreshing of flag will not be executed during the line scan, see Chap. 4.3.2.
Force after scan will execute the flag once given number of scanned lines is provided.
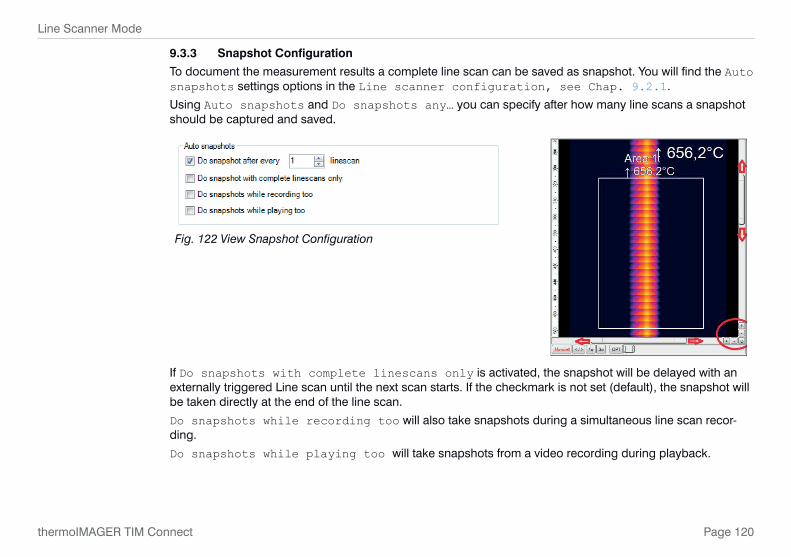
Page 120
Line Scanner Mode
thermoIMAGER TIM Connect
9.3.3 Snapshot Configuration
To document the measurement results a complete line scan can be saved as snapshot. You will find the Auto snapshots settings options in the Line scanner configuration, see Chap. 9.2.1.
Using Auto snapshots and Do snapshots any… you can specify after how many line scans a snapshot should be captured and saved.
Fig. 122 View Snapshot Configuration
If Do snapshots with complete linescans only is activated, the snapshot will be delayed with an externally triggered Line scan until the next scan starts. If the checkmark is not set (default), the snapshot will be taken directly at the end of the line scan.
Do snapshots while recording too will also take snapshots during a simultaneous line scan recor-ding.
Do snapshots while playing too will take snapshots from a video recording during playback.
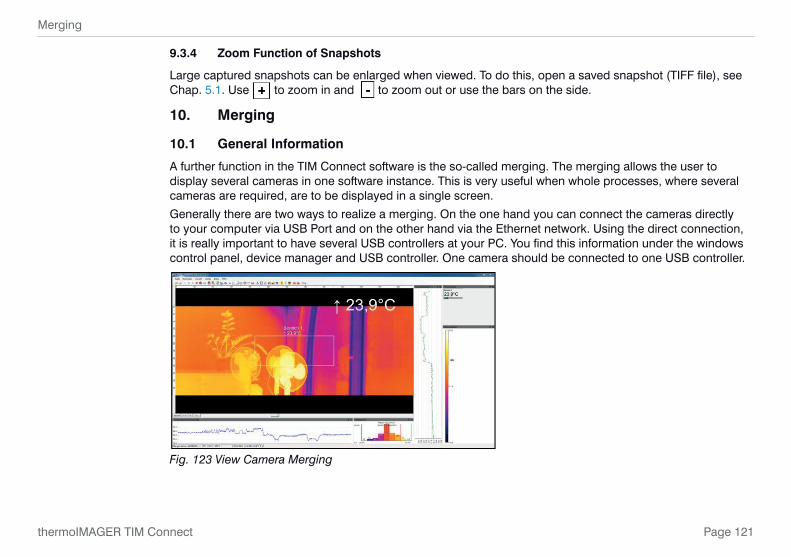
Page 121
Merging
thermoIMAGER TIM Connect
9.3.4 Zoom Function of Snapshots
Large captured snapshots can be enlarged when viewed. To do this, open a saved snapshot (TIFF file), see Chap. 5.1. Use to zoom in and to zoom out or use the bars on the side.
10. Merging
10.1 General Information
A further function in the TIM Connect software is the so-called merging. The merging allows the user to display several cameras in one software instance. This is very useful when whole processes, where several cameras are required, are to be displayed in a single screen.
Generally there are two ways to realize a merging. On the one hand you can connect the cameras directly to your computer via USB Port and on the other hand via the Ethernet network. Using the direct connection, it is really important to have several USB controllers at your PC. You find this information under the windows control panel, device manager and USB controller. One camera should be connected to one USB controller.
Fig. 123 View Camera Merging

Page 122
Merging
thermoIMAGER TIM Connect
Advantage of camera merging - If pixel size is getting too big, the use of multiple TIMs is possible. - If pixel size is getting too big, the use of multiple TIMs is possible. - Measurement areas / hot-, coldspots works over whole area. - Different camera positions allow having various viewing angles for a complete view of a 3D object. - After the merging setup and the restart of the TIM Connect Software, the source instances will open auto-
matically.
10.2 Direct Connection over USB Port
In this variant of connection, the cameras are connected directly via USB to the PC. It is important to connect the individual cameras to different USB controllers because the maximum bandwidth of the USB interfaces is limited. We do not recommend using more than 3 cameras with direct connection.
10.3 Configuration
At first connect all the cameras you want to use to your PC and open the TIM Connect software.
Go to the menu Tools, Extended and Config merged device.
A message appears sating that the device is now closed. Confirm this message with OK. Depending on how many cameras you want to use, click correspondently often the button Add.
In this example, two cameras are used.

Page 123
Merging
thermoIMAGER TIM Connect
Afterwards mark each instance one at another and press the Start button.The instances will open in a new window.
Now you have to assign this Instance to the first camera. To do that, go on the Instance 1 window to Tools, Configuration and Device.
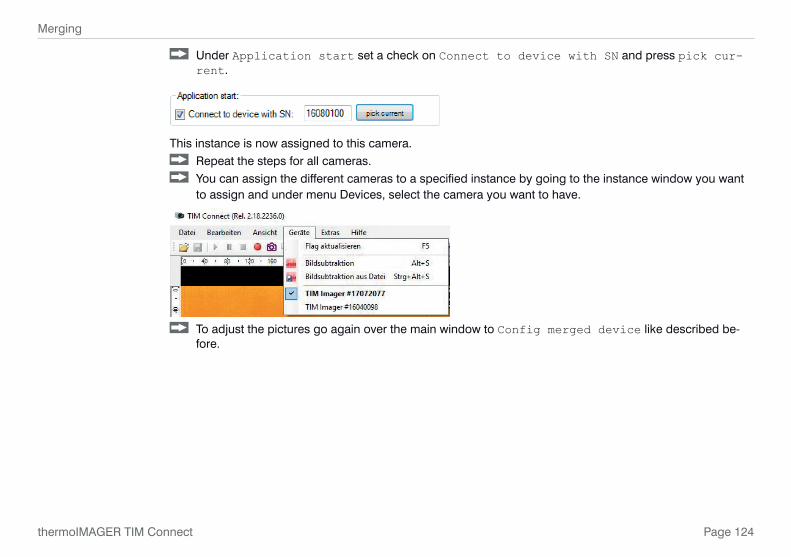
Page 124
Merging
thermoIMAGER TIM Connect
Under Application start set a check on Connect to device with SN and press pick cur-rent.
This instance is now assigned to this camera. Repeat the steps for all cameras. You can assign the different cameras to a specified instance by going to the instance window you want
to assign and under menu Devices, select the camera you want to have.
To adjust the pictures go again over the main window to Config merged device like described be-fore.
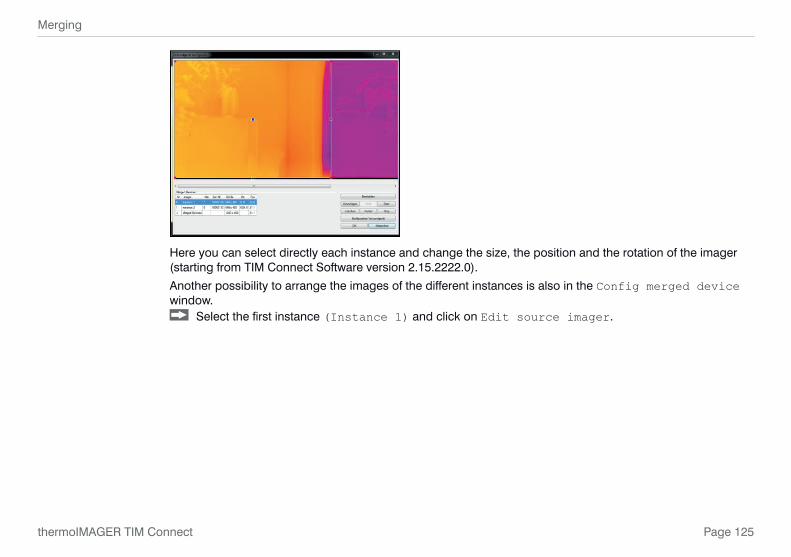
Page 125
Merging
thermoIMAGER TIM Connect
Here you can select directly each instance and change the size, the position and the rotation of the imager (starting from TIM Connect Software version 2.15.2222.0).
Another possibility to arrange the images of the different instances is also in the Config merged device window.
Select the first instance (Instance 1) and click on Edit source imager.
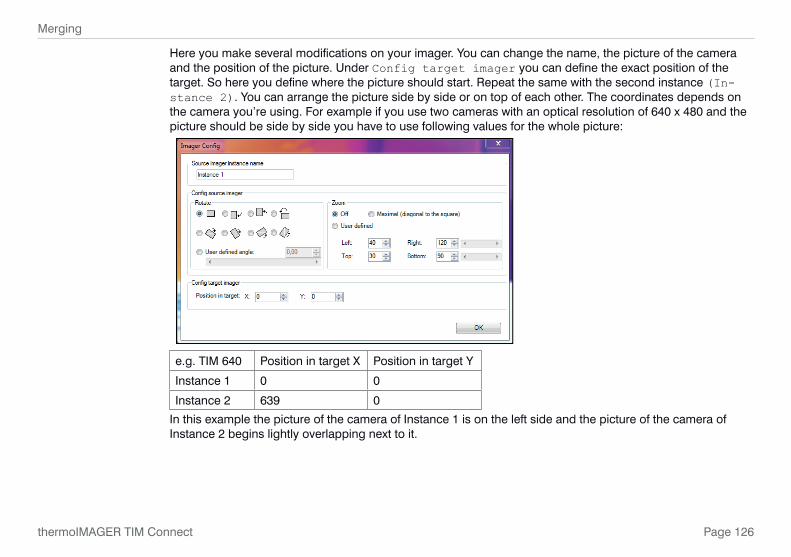
Page 126
Merging
thermoIMAGER TIM Connect
Here you make several modifications on your imager. You can change the name, the picture of the camera and the position of the picture. Under Config target imager you can define the exact position of the target. So here you define where the picture should start. Repeat the same with the second instance (In-stance 2). You can arrange the picture side by side or on top of each other. The coordinates depends on the camera you’re using. For example if you use two cameras with an optical resolution of 640 x 480 and the picture should be side by side you have to use following values for the whole picture:
e.g. TIM 640 Position in target X Position in target Y
Instance 1 0 0
Instance 2 639 0
In this example the picture of the camera of Instance 1 is on the left side and the picture of the camera of Instance 2 begins lightly overlapping next to it.
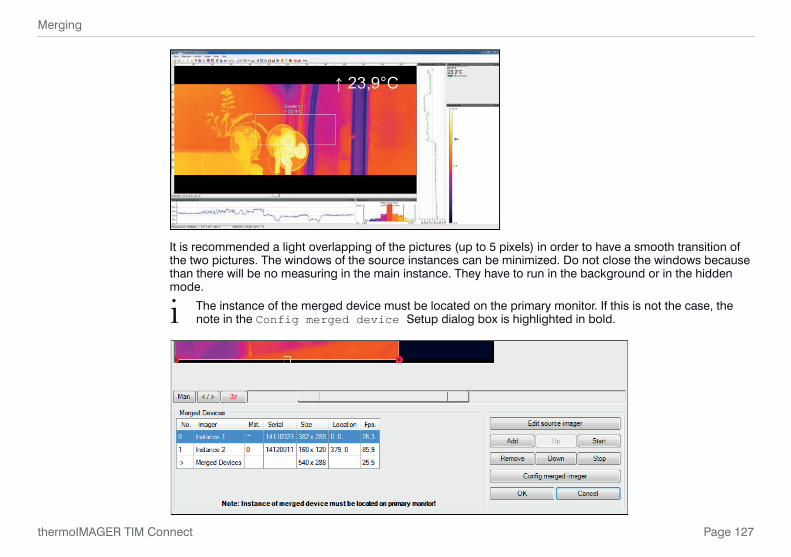
Page 127
Merging
thermoIMAGER TIM Connect
It is recommended a light overlapping of the pictures (up to 5 pixels) in order to have a smooth transition of the two pictures. The windows of the source instances can be minimized. Do not close the windows because than there will be no measuring in the main instance. They have to run in the background or in the hidden mode.
i The instance of the merged device must be located on the primary monitor. If this is not the case, the note in the Config merged device Setup dialog box is highlighted in bold.

Page 128
Merging
thermoIMAGER TIM Connect
Under Config merged imager, further settings can be made for all instances, see Fig. 124.
Fig. 124 View Config merger
With Synchronize frames by digital input (DI) of PIF, the frames of the connected cameras are simultaneous synchronized using the PIF.
Mix overlapped edges makes a smooth transition between the singles images. It will be interpolated. With Adjust secondary imager(s) to master imager, an adaptation of the pixels of the individual slave imagers to the master imager within the set temperature range is performed in the overlapping area.
The set temperature value at maximum adjustment offset indicates the maximum offset adjustment.
If the checkmark is set to Ignore margin pixels, the set margin pixel is not taken into account. A fixed number of margin pixels in the overlapping area does not work during line scanning when the gap is very narrow. Then no valid pixels are found.
Under After flag operation only, the pixels are adjusted only after a drawn flag and not continuously.
Keep adjustment after restart ensures that the calculated offset of the secondary imager is preserved for the merging after program end.

Page 129
Merging
thermoIMAGER TIM Connect
Alarm if adjustment is overdue: Delay for 900 s, an alarm is output if the adjustment is ex-eeded after the set time.
Further, you can make settings for the Start and Stop of the software. You can decide how the pictures of the source instances should be started. You can choose between Normal, Maximized, Minimized and Hidden. Also it is possible to close the source instances automatically when closing the Merger instance.
Under menu View, Windows and Merged device a tool window opens with a view of the available instanc-es of the merged device.

Page 130
Merging
thermoIMAGER TIM Connect
10.4 Connection via the Ethernet Network
The second possibility is a connection via the Ethernet network. Each camera is connected to one individual USB Server Gigabit and those in turn are connected to the Ethernet switch. The switch than is attached to the PC. For the connection via network you can use more than 3 cameras for the merging.
The configuration of the merging is the same as described, see Chap. 10.3.
You find a detailed description and procedure for the installation of USB Server Gigabit on the CD in the folder Documentation and Manuals.
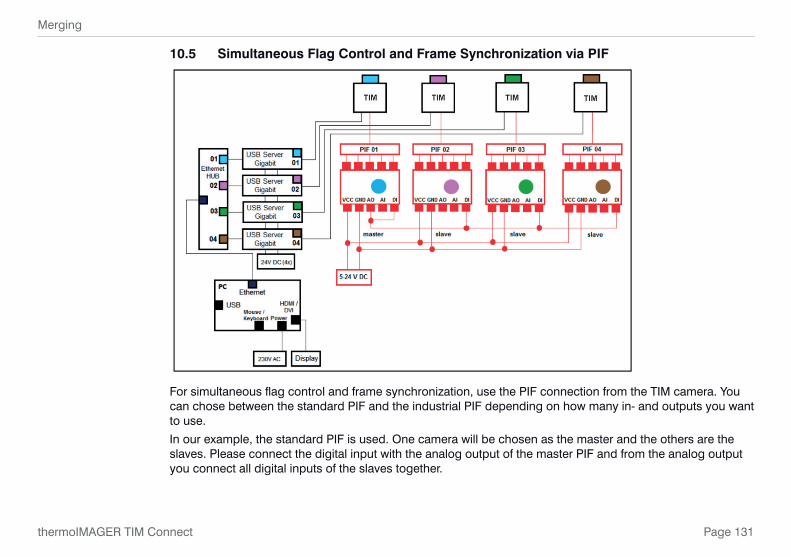
Page 131
Merging
thermoIMAGER TIM Connect
10.5 Simultaneous Flag Control and Frame Synchronization via PIF
For simultaneous flag control and frame synchronization, use the PIF connection from the TIM camera. You can chose between the standard PIF and the industrial PIF depending on how many in- and outputs you want to use.
In our example, the standard PIF is used. One camera will be chosen as the master and the others are the slaves. Please connect the digital input with the analog output of the master PIF and from the analog output you connect all digital inputs of the slaves together.

Page 132
Merging
thermoIMAGER TIM Connect
After you connected all your PIFs together, you need to set up the settings in the TIM Connect software. Therefore go to menu Tools, Configuration and Device(PIF) in each window of the individual
instances. For the master PIF, go under Analog Outputs and AO1 and select Flag Status.
The other PIFs are the slaves and there you have to go to Digital Input, DI and choose Flag Control.
The flag automatic must be switched on for the Merger instance and must be switched off for the master and slave instances, see Chap. 4.3.2.
Flag automatic Analog output Digital inputMerger instance Off - -
Master instance On Flag status -
Slave instance(s) On - Flag control

Page 133
Further Information
thermoIMAGER TIM Connect
11. Further Information
11.1 Options
Under Tools, Extended and Options, you can make further settings, which are explained in the following.
11.1.1 Activating Software Messages
At some point a warning message will appear when performing an action that would cause changes to software settings.
To prevent unintended changes you can activate or deactivate these messages.
i If a message appears you can disable the window by choosing „Never ask me again“. Using the menu Options you can activate the appearance of the window again.
Important options are:
Warning if device was disconnected A window tells the user that a device was disconnected.Warning if unsaved data exists If activated a reminder will appear to warn you on unsaved data
or setups before shutting down the software.Ask for stopping triggered recordings… Opening the configuration dialog you will be asked whether to
close a triggered data capturing or not. The message intends to prevent changing trigger settings by accident.

Page 134
Further Information
thermoIMAGER TIM Connect
11.1.2 Layouts
Under Layouts you can choose how a layout should be saved or loaded together. The layouts are indepen-dent of the connected device.
11.1.3 Device Detected
Under On device detected you can choose what should happen when no device is connected.
11.1.4 Temperature Unit
When setting the Temperature unit you can choose between Celsius (°C) and Fahrenheit (°F). Alternatively, the temperature unit can also be changed by pressing the right mouse button in the live IR im-age.
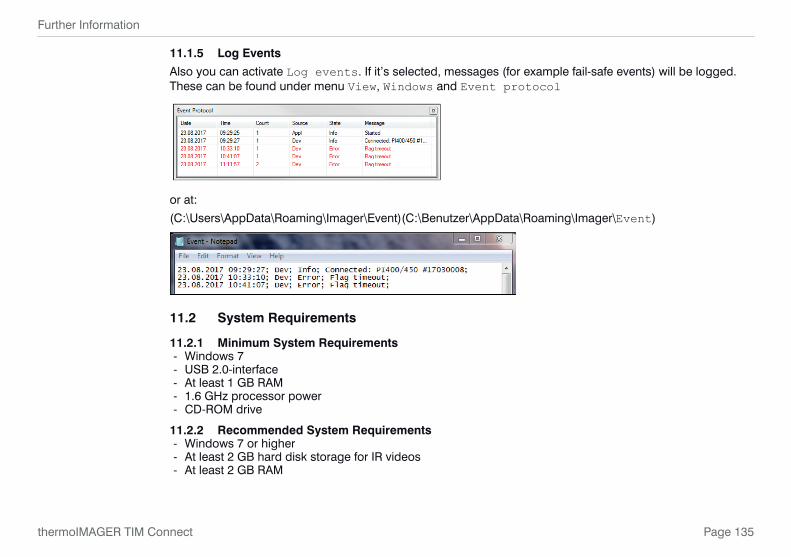
Page 135
Further Information
thermoIMAGER TIM Connect
11.1.5 Log Events
Also you can activate Log events. If it’s selected, messages (for example fail-safe events) will be logged. These can be found under menu View, Windows and Event protocol
or at:
(C:\Users\AppData\Roaming\Imager\Event)(C:\Benutzer\AppData\Roaming\Imager\Event)
11.2 System Requirements
11.2.1 Minimum System Requirements - Windows 7 - USB 2.0-interface - At least 1 GB RAM - 1.6 GHz processor power - CD-ROM drive
11.2.2 Recommended System Requirements - Windows 7 or higher - At least 2 GB hard disk storage for IR videos - At least 2 GB RAM

Page 136
Further Information
thermoIMAGER TIM Connect
11.3 Information about SoftwareIn the Help and About submenu you will find the version name of TIM Connect software you are cur-rently running, the imager hardware and the imager firmware.
Fig. 125 View Info

Page 137
Further Information
thermoIMAGER TIM Connect
11.4 Extended Configuration
Under Tools and Extended you can configure different adjustments.
Under Options you can choose general warnings and messages, see Chap. 11.1.1.
Load calibration data: - From Internet: Will re-download the files via an existing Internet connection. - From device: The calibration files are reloaded from the device (appears only for TIM 8). - From directory: If there is no Internet connection, the files can also be imported via the supplied data
medium (via the directory Califiles SNxxxxxxxx).The choice Config remote device provides a configuration of the TIM NetBox via the network. You can find a detailed description on the CD (Documentation-Manuals).Further you can Config merged device, see Chap. 10.3, Config recording box (see CD-Docu-mentation-Manuals), make an Update firmware or fulfill an Update format definition file.The firmware update should be checked at regular intervals so that you always have the latest version on your device. The format definition file update ensures that the current video formats are sup-ported.Under TCP/IP Settings you can set up the network settings for the Ethernet connection (appears only for TIM 8, see Chap. 7.3.
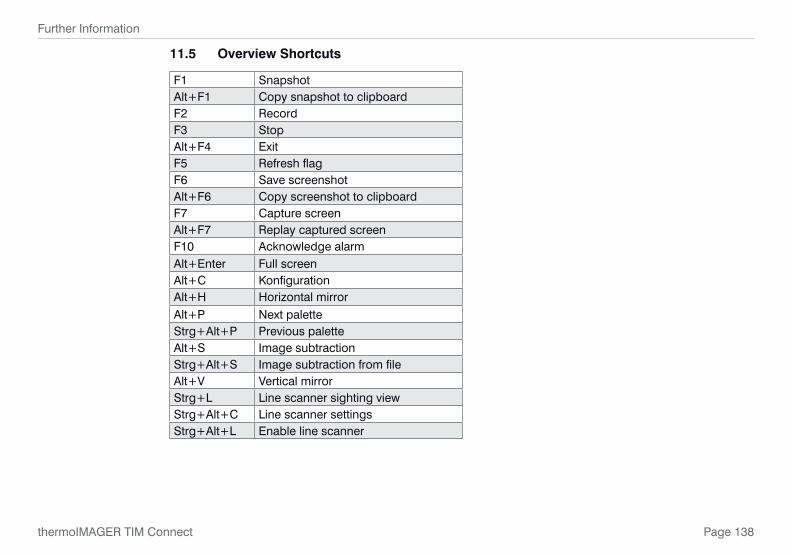
Page 138
Further Information
thermoIMAGER TIM Connect
11.5 Overview Shortcuts
F1 SnapshotAlt+F1 Copy snapshot to clipboard F2 RecordF3 StopAlt+F4 ExitF5 Refresh flagF6 Save screenshotAlt+F6 Copy screenshot to clipboardF7 Capture screenAlt+F7 Replay captured screenF10 Acknowledge alarm Alt+Enter Full screenAlt+C KonfigurationAlt+H Horizontal mirrorAlt+P Next paletteStrg+Alt+P Previous paletteAlt+S Image subtractionStrg+Alt+S Image subtraction from fileAlt+V Vertical mirrorStrg+L Line scanner sighting viewStrg+Alt+C Line scanner settingsStrg+Alt+L Enable line scanner

Page 139
Liability for Material Defects
thermoIMAGER TIM Connect
12. Liability for Material Defects
All components of the device have been checked and tested for functionality at the factory. However, if de-fects occur despite our careful quality control, MICRO-EPSILON or your dealer must be notified immediately.
The liability for material defects is 12 months from delivery.
Within this period, defective parts, except for wearing parts, will be repaired or replaced free of charge, if the device is returned to MICRO-EPSILON with shipping costs prepaid. Any damage that is caused by improper handling, the use of force or by repairs or modifications by third parties is not covered by the liability for mate-rial defects. Repairs are carried out exclusively by MICRO-EPSILON.
Further claims can not be made. Claims arising from the purchase contract remain unaffected. In particular, MICRO-EPSILON shall not be liable for any consequential, special, indirect or incidental damage. In the inter-est of further development, MICRO-EPSILON reserves the right to make design changes without notification.
For translations into other languages, the German version shall prevail.

MICRO-EPSILON MESSTECHNIK GmbH & Co. KG
Königbacher Str. 15 · 94496 Ortenburg / Germany
Tel. +49 (0) 8542 / 168-0 · Fax +49 (0) 8542 / 168-90
[email protected] · www.micro-epsilon.com
X9751243-D011068HDR
*X9751243-D01*
MICRO-EPSILON MESSTECHNIK