Instituto de Iberoamérica Universidad de Salamanca · Instituto de Iberoamérica Universidad de...
47
DT 12/2012 Instituto de Iberoamérica Universidad de Salamanca Documentos de Trabajo JOHN M. CAREY Transparency & Legislative Behavior
Transcript of Instituto de Iberoamérica Universidad de Salamanca · Instituto de Iberoamérica Universidad de...

DT 12/2012
Instituto de Iberoamérica
Universidad de Salamanca
Documentos de Trabajo
JOHN M. CAREY
Transparency & Legislative Behavior
II
docum
ento
s d
e tra
bajo
Instituto de Iberoamérica
Universidad de Salamanca
Documentos de Trabajo
Autor:
John M. Carey, profesor de Ciencia Política en Dartmouth College, Estados Unidos. (Email: [email protected])
Título: Transparency & Legislative Behavior
Fecha de publicación: 16/11/2012
ISSN: 1989-905X

III
docum
ento
s d
e tra
bajo
Contents
I. MOTIVATION .............................................................................................................. 6
II. BACKGROUND .......................................................................................................... 7
III. THE EXPERIMENT ................................................................................................ 10
IV. THE TRANSPARENCY CONDITIONS ................................................................. 12
V. EXPECTATIONS ....................................................................................................... 14
VI. RESULTS ................................................................................................................... 15
VI. 1. HOW ARE BUDGETS DIVIDED? ............................................................................................... 16
VI. 2. WHAT DOES THE PUBLIC REWARD/PUNISH? ...................................................................... 17
VI. 3. WHAT DO LEGISLATORS APPROVE/REJECT? ....................................................................... 18
VI. 4. HOW DOES TRANSPARENCY AFFECT HOW EACH TYPE OF PLAYER FARES? .................. 20
VI. 5. FIRST-ORDER ACCOUNTABILITY: PROPOSERS AND BAD BUDGET OFFERS ................... 21
VI. 6. SECOND-ORDER ACCOUNTABILITY: NON-PROPOSERS AND BAD BUDGETS ...................... 22
VI. 7. PATTERNS AND LEARNING ACROSS PERIODS ...................................................................... 27
VI. 8. MINIMUM COALITIONS VERSUS UNIVERSALISM .................................................................. 30
VI. 9. REELECTION RATES .................................................................................................................. 31
VII. CHARACTERISTICS OF PROPOSERS................................................................. 32
VII. 1. SEX ............................................................................................................................................. 32
VII. 2. CITIZENSHIP ............................................................................................................................. 33
VII. 3. ACADEMIC DIVISIONS ............................................................................................................. 34
VIII. PRELIMINARY CONCLUSIONS ........................................................................ 34
IX. NEXT STEPS............................................................................................................. 35
IX. 1. SOLVING THE GAME ................................................................................................................. 35
IX. 2. ABSENCE OF FAILED BUDGETS .............................................................................................. 36
IX. 3. MIXING SCRIPTED AND LIVE PLAYERS ................................................................................. 36
IX. 4. ALTERING PUNISHMENTS AND PAYOFFS ............................................................................. 36
IX. 5. WEB-BASED ENVIRONMENT: EXPANDING THE PARTICIPANT BASE ............................. 37
IX. 6. WILD SPECULATION: A SOCIAL MEDIA APP ........................................................................ 37
IX. 7. MIXING TRANSPARENCY CONDITIONS ACROSS PERIODS ................................................. 38
IX. 8. MULTIPLE PUBLICS WITH CORRESPONDING LEGISLATORS ............................................. 38
X. BIBLIOGRAPHY ........................................................................................................ 39
APPENDIX: DOCUMENTS FOR EXPERIMENT PARTICIPANTS ........................ 41

IV
docum
ento
s d
e tra
bajo
Tables
Table 1. Logistic regressions of votes of non-Proposer Legislators on proposed budgets, by their own budget offers, and POs, by transparency conditions. (N=114 in each case.) ................................................................................................................................................... 24
Table 2. Distribution of budget benefits across Legislators ..................................................... 30
Figures
Figure 1. Mean number of recorded votes per year, various national legislatures ............. 8
Figure 2. Offers to Public, Proposer, High and Low Legislators - All Modes ................. 16
Figure 3. Distribution of Public's offers (POs) - All Modes............................................... 17
Figure 4. Probability Legislators are rejected for next period, by Public's budget offer - All modes..................................................................................................................................... 17
Figure 5. Probability non-Proposer Legislator votes to approve budget - All modes ..... 19
Figure 6. Distribution of offers to Public, Proposer, and non-Proposer Legislators, by Transparency ............................................................................................................................... 20
Figure 7. Rate of Proposers rejected, by Public Offer and Transparency ......................... 21
Figure 8. Probability of non-Propopser approving a budget proposal, by Public's Offer and Transparency ................................................................................................................................ 23
Figure 9. Electoral punishment of non-Proposers by Public Offer, Vote, and Transparency 25
Figure 10. Distribution of offers to Public, Proposer, High and Low Legislators, across periods, by transparency ............................................................................................................ 27
Figure 11. Linear estimation (with 90% C.I.) of offers to each type of player across periods, by transparency ............................................................................................................ 29
Figure 12. Reelection rates among Proposers and non-Proposer Legislators, by Transparency ............................................................................................................................... 31
Figure 13. Mean budget offers to each type of player, by Proposer's sex ......................... 32
Figure 14. Boxplot of budget offers to each type of player, by Proposer's citizenship ... 33
Figure 15. Mean budget offers to each type of player, by Proposer's academic division 34
V
docum
ento
s d
e tra
bajo
Abstract: Do representatives behave differently when their actions are observed by citizens versus when they are not observed? Intuition suggests the answer is yes, but non-transparent legislative processes in many countries present obstacles to conventional empirical research. This paper presents preliminary results from an experiment designed test what difference transparency makes. The experiment involves Legislators proposing and voting on a budget that can be divided among the Legislators and the Public, followed by the Public deciding whether to reelect each Legislator for the next period. The degree of transparency varies across different treatments. Transparency encourages public-serving budgets, universalistic legislative coalitions, and high rates of reelection.
Keywords: representatives, public, transparency, legislative process, experiment, budget.
Resumen: ¿Se comportan de manera diferente nuestros representantes cuando sus acciones pueden ser observadas por los ciudadanos de cuando éstas no lo son? La intuición surgiere que sí, pero la falta de transparencia que se detecta en los procesos legislativos de muchos países entorpece la investigación empírica convencional. Este trabajo presenta los resultados preliminares de un experimento diseñado para estimar precisamente cuánto importa la transparencia. El experimento reúne a cuatro personas, de los cuales tres actúan como legisladores y una como ciudadano. Los primeros formulan y votan un presupuesto y, luego, el segundo decide si reelegir a cada legislador para un siguiente mandato. El nivel de transparencia varía según los procedimientos desarrollados, pero se advierte que la transparencia fomenta presupuestos al servicio del público, coaliciones legislativas universalistas y altos niveles de reelección.
Palabras clave: representantes, ciudadanos, transparencia, procesos legislativos, experimento, presupuesto.

6
docum
ento
s d
e tra
bajo
I. Motivation1
Do legislators behave differently when their actions are observed by citizens from when
they are not? Are their proposals and decisions more public-serving when the policy
making process is transparent? Many theorists of representation and good-government
reformers share an intuition that transparency facilitates monitoring of politicians by
citizens and mitigates pursuit of representatives' self-interest at the expense of some
broader conception of the public good (Snyder and Ting 2005; O’Connor and Smith
2010; Open.Secrets.org; CongresoVisible.org).
The proposition that transparency can affect democratic performance is attractive
normatively as well as theoretically because transparency is low in many legislatures, but
it is relatively easy to do something about it. Machines that record votes can be installed
at modest costs (Carey 2009). Attendance and voting records can be disseminated to
citizens through simple and cheap media (Humphreys and Weinstein 2008). This paper
reports preliminary results of an experiment that aims to test the impact of transparency
on the extent to which legislative decisions serve the public's interest.
1 Acknowledgements: Special thanks go to Senate Taka and Wenyu Lu, who reprogrammed the z-Tree
software package (licensed gratis by the Institute for Empirical Research in Economics at the University of Zurich) to run the experiments described in this paper. Jaime Combariza and Peter England provided the virtual machine and other elements of the network environment. David Glick and the students in his Introduction to American Politics class served as test pilots of the network and program. Melissa Bearden, Peter Jankovsky, and Gabrielle Ramaiah provided research and logistical assistance.

7
docum
ento
s d
e tra
bajo
II. Background
High levels of legislative voting transparency have long been taken for granted in the
United States, where individual-level voting records on most important motions in both
chambers have been made public since the founding; and for just as long, legislators
have expected electoral punishment for voting against their constituents' interests
(Odegard 1928; Kile 1948; Skeen 1986; Smith 1989; Bianco, Spence and Wilkerson
1996). The conventional logic in the United States regarding transparency versus
anonymity in voting has been that anonymity is necessary for voters, through the secret
ballot, in order to free citizens from intimidation in elections, but that transparency in
legislative voting enhances democratic accountability. In effect, legislators ought to be
subject to pressure on their votes but citizens should not (United States Supreme Court
1958).2
More recently, formal models of legislator-constituent relationships make the case that
transparent legislative voting ought to be appealing both to citizens and legislators - to
the former because transparency exposes potential betrayals of citizens' interests, and to
the latter because transparency makes enforceable commitments to constituent interests,
and the rewards that might follow from such commitment, possible (Snyder and Ting
2005; Humphreys and Weinstein 2008).
Until recently, transparency was little explored in the literature on legislatures outside
the United States. One can find general claims that voting against constituent interests
risks electoral punishment, resting on the assumption that citizens know how their
representatives vote (Rose-Ackerman 1999: 127). Yet there is huge variance in
transparency across legislatures. Figure 1 shows the incidence of recorded votes from 26
legislative chambers across 16 Latin American countries. In most legislatures, the votes
of individual representatives are not recorded on most proposals. In many cases, there is
no transparency in legislative voting at all. Research from other parts of the world
confirms that the widely variant levels of transparency in Latin American legislative
voting are typical in other regions as well (Saalfeld 1995; Hug 2010).
2 But see Rousseau (1763), Burke (1774), and Stasavage (2004) for contrary views.

8
docum
ento
s d
e tra
bajo
Figure 1. Mean number of recorded votes per year, various national legislatures
Source: Carey 2009, Table 3.3
Recent research documents procedural variation across votes within Latin American
legislatures (Carey 2009), strongly suggesting that transparency affects to whom legislators
are accountable, and relatedly, that legislative decisions on whether or not to make votes
transparent are shaped by legislators' desires about which audiences they want to
observe their votes (Carrubba, Gabel, and Hug 2008; Crisp and Driscoll 2010).
The literature on legislative voting transparency, then, is partly historical, partly formal,
and partly contemporary empirical. All the scholarship shares a belief that transparency
matters to how representatives behave. To this point, however, it does not allow a direct
test of that proposition, or estimation of how much transparency matters, partly because
one cannot compare observable behavior (e.g. recorded votes) with unobservable

9
docum
ento
s d
e tra
bajo
behavior (e.g. non-recorded votes), and partly because the votes that are visible are
almost certainly not representative of the population of all votes3.
Meanwhile, there is an extensive literature in experimental economics and anthropology
on bargaining and cooperation games that bear some resemblance to what goes on in
legislatures. This work examines a variety of games in which players are selected either
to propose a division of some fixed budget, or to contribute resources to a common
pool, and other players must decide whether to accept the proposals. In some variants,
responding players may also punish 'selfish' proposers. This scholarship demonstrates
that budget proposers are less selfish when they are susceptible to punishment (Fehr
and Gächter 2000; Fischbacher et. al. 2001), and also that there is variance across
players in different societies about how selfish a proposal must be to warrant
punishment (Henrich et. al. 2005, 2006, 2010; Herrmann et. al. 2008).
So far, so good, but this scholarship has been primarily concerned with identifying
norms of cooperation, fairness, and selfishness in interactions among individuals, rather
than between citizens and representatives, or within representative institutions, and the
staple experiments at the heart of this literature -- ultimatum, dictator, and public goods
games -- lack key characteristics that would better approximate legislative environments.
A smaller experimental literature examines the predictions of the Baron and Ferejohn
(1989) model of budget division by a legislature with three parties (or participants, in the
experimental set-up) that are allocated varying voting weights, although any
combination of two of the three is necessary to form a majority. The game is generally
played with a finite number of periods, and with the proposal power assigned by some
fixed rule (e.g. by probabilities corresponding to voting weights), and reassigned if a
proposal is rejected. The focus of investigation in these experiments is the division of
spoils among the legislators, and the central results is that proposers exploit their
advantage less than predicted by the Baron and Ferejohn model, forming fewer
3 Humphreys and Weinstein (2008) describe research in progress in Uganda in which annual 'parliamentary scorecards' -- audits and reports about the activities of legislators produced by a Kampala-based NGO -- are generated for all legislators during the 2007-2011 term, with active dissemination campaigns to deliver the information in the scorecards are conducted in some legislators' districts, but not in others. This agenda promises a quantum leap in measuring how the transmission of information to citizens affects legislative behavior, but the scorecards will focus on indicators of legislators' efforts (attendance, motions introduced, speeches, etc.) rather than specific information about legislative decision-making precisely because votes are not recorded in Uganda (p.27).

10
docum
ento
s d
e tra
bajo
minimim-winning and more universal coalitions, and dividing the budget more equally
with coalition partners, than the non-cooperative model would anticipate (Diermeier
and Morton 2003; Fréchette, Kagel, and Lehrer 2003; Fréchette, Kagel, and Morelli
2005a, 2005b).
The experiment I report on here varies these bargaining games in a couple of simple
ways that aim to simulate the monitoring of representatives by citizens. The goal is to
shed light on the extent to which transparency affects how public-serving budgets are,
and the ability and inclination of the public to reward and punish individual legislators.
The experiment also aims to determine whether the public has a preference between
minimal versus universalistic coalitions.
III. The Experiment
The experiment is a game played among four actors - three legislators and the public. It
involves a proposal for division of a budget by one legislator, then a vote on the
proposal, then budget payouts (conditional on its approval), and finally an opportunity
for the public to reward or punish each legislator. The treatments manipulate what
information regarding the identify of the proposer, the nature of the proposal, and the
legislators' votes are observable by the citizen.
The full set of instructions and associated documents that were provided to each
participant before the experiment are included in the Appendix. Here, I review the key
pieces of information about the experimental set-up and procedure.
Environment
The experiments were conducted in a computer lab on the campus of
Dartmouth College during late July and early August, 2010.
The lab consisted of 10 networked computers running z-Tree experimental
software (Fischbacher 2007), specially adapted to run the game. The lab
provided for a divider to separate the Public from the Legislators, but the
Legislators were seated in two rows of computer terminals.

11
docum
ento
s d
e tra
bajo
Participants were recruited overwhelmingly from among Dartmouth's
undergraduate student population (92%) with a handful of students from other
institutions (4%) and Dartmouth staff and faculty (4%). Participants were
guaranteed a $10 participation fee, plus whatever profit they made from the
budget game, paid in cash at the end of the experiment.
Each experiment involved 10 participants and consisted of 20 periods of play,
all in the same transparency mode -- i.e. non-transparency, semi-transparency, or
full transparency (explained below).4
A budget of 24 units was divided in each period. Each unit was worth $.50,
such that $12 was on the table in each period, and $240 was at stake across the
full 20 periods.
Players and Preparation
1. All participants are informed under what transparency conditions the game will
be played -- Non-Transparency, Semi-Transparency, or Full Transparency
(explained below).
2. 1 of the 10 participants is drawn at random to act as the Public. 9 are
Legislators (L1, L2, L3, ... L9).
3. The computer selects 3 of the 9 Legislators to be active in Period 1.
Sequence of Play in Each Period
1. Of the 3 active Legislators, the computer selects 1 to be the Proposer in Period
1.
2. The Proposer is prompted to divide a budget of 24 units5 among any
combination of the 4 active players (e.g. L1, L6, L8, and Public).
4 Budget constraints limited me to conducting just 3 experiments in each mode, so the numbers of participants and observations are small and the results preliminary. Pending access to grant support and refinements of the experiment and method, the goal is to conduct experiments on a larger scale and with a more diverse participant pool.
5 The stake of 24 budget units is convenient because it is divisible both by the total number of players, and by the number of active Legislators (or by a minimum coalition of Legislators plus the Public), so is amenable to various potentially focal distributions while also allowing flexibility for unequal divisions across players.
12
docum
ento
s d
e tra
bajo
3. The active Legislators observe the proposal and vote to approve or reject it.
(Non-active Legislators also observe the proposal, but do not vote.)
If a majority approves, the budget is paid out according to the proposal.
If a majority disapproves, no payouts are made.
4. Public is informed whether the budget was approved or rejected, plus under:
Non-Transparency (NT)
her own payout.
Semi-Transparency (ST)
her own payout; and
the identity of the Proposer (e.g. L6).
Full Transparency (FT)
her own payout;
the identity of the Proposer;
how much the proposed budget offered to each Legislator; and
how each Legislator voted (Approve/Reject) on the budget proposal.
5. [Except in the 20th and final period, ...] the Public 'reelects' or rejects each
Legislator for the following period. Any Legislator the Public rejects is replaced
with one drawn at random from the pool of 6 non-active Legislators.6
After all 20 periods are completed, each participant is shown a screen recapping her or
his status (active or non-active) and profit from each period, as well as total profit from
the experiment. These numbers are then confirmed with experiment personnel, and
participants are paid their profit plus a $10 participation fee.
IV. The transparency conditions
It is worth saying a few words about what the experimental manipulation of
transparency seeks to approximate. Full transparency mirrors the availability of
information on most consequential votes in the U.S. Congress, where bill sponsors,
6 Rejected Legislators are eligible to be drawn from the non-active pool in future periods, but cannot be drawn to return in the period immediately following rejection.

13
docum
ento
s d
e tra
bajo
party leaders, and floor managers, in amalgamation, are analogous to the Proposer, and
where roll call voting records expose every legislator to demands from actors outside
the legislative chamber to justify his or her vote.
Semi-transparency is analogous to legislative decision-making without the
comprehensive transmission of information that characterizes the U.S Congress, but in
the presence of effective legislative parties. That is, even where votes are not recorded
and published at the individual level, party leaders generally make their parties' positions
known on important proposals before legislatures. Where parties are the main vehicles
of policy initiatives, and legislators from the same party vote in concert, then knowing
what initiatives party leaders advance or oppose provides citizens with reliable
information about how their representatives behave. In the context of this experiment,
for the Public to know what s/he got and who the proposer was, as under semi-
transparency, is akin to knowing which party championed a policy in political system
with strong parties.
Non-transparency is a closer approximation of the legislative process where the full
transmission of information is absent and parties are ineffective, either because they are
not the main source policy proposals or because legislative co-partisans do not reliably
vote in unison, or both. For example, in most Latin American systems, the most
important legislative proposals issue directly from the executive branch rather than
being formally introduced by specific legislators or parties (Crisp and Driscoll 2010;
Morgenstern 2003; Siavelis 2000). Where the president has clear ties to a legislative
party, executive initiatives might reasonably be attributed to that party, but in many
presidential systems these ties are loose or even non-existent. Presidents' parties are
often factionalized precisely by the different demands of competition in executive
versus legislative elections (Samuels 2002). Many presidents rely on non-partisan or
coalition cabinets, or reject traditional party labels altogether (Linz 1994; Cox and
Morgenstern 2001). Under these circumstances, connections between policy proposals
and any proposer inside the legislature itself can be obscure. Moreover, when party
unity in legislative voting is low, as is often the case in presidential systems, failure to
provide a recorded vote can render responsibility for legislative decisions thoroughly
opaque (Carey 2009). In short, in many Latin American polities (and I suspect others as
well), citizens often find themselves effectively in the experiment's non-transparency
mode; they know what they got, but not much else about where it came from.
14
docum
ento
s d
e tra
bajo
V. Expectations
The experiment aims to shed light whether transparency affects two general types of
outcomes:
the extent to which budgets serve the Public relative to the Legislators; and
budget divisions among the Legislators themselves.
The fundamental theoretical expectation is that transparency should make the threat of
electoral punishment of Legislators by the Public more effective, so should generate
more Public-serving budgets. Specifically:
H1: The higher transparency, the greater the Public's share of budgets.
There are two ways this might come about, which I refer to as first-order and second-
order accountability. The former operates through Proposers' budget offers to the
Public (POs), as a result of Proposers' fear of electoral punishment, and should manifest
itself under both ST and FT -- that is, when the proposer is visible to the Public -- but
not under NT:
H2: POs should be higher under ST and FT than under NT.
What I call second-order accountability operates through non-Proposer Legislators'
desire to be seen as voting for Public-serving budgets and against budgets that ill-serve
the Public when votes are visible, so should manifest itself only under FT:
H3: Budget votes by non-Proposer Legislators should be positively
correlated with POs under FT, but not under NT or ST.
Prior expectations regarding whether and how transparency should affect budget
divisions among Legislators are more ambiguous. Previous research on budget division
games focuses on the magnitude of the Proposers' advantage and, more generally,
whether budget divisions are minimal (paying off the smallest number of legislators
necessary to approve a budget) or universalistic. Incorporating a Public and a reelection
round in this experiment, coupled with the transparency manipulations, means that if
the Public has preferences about the inclusiveness of legislative coalitions, then the

15
docum
ento
s d
e tra
bajo
Public's ability to observe the details of budget proposals could affect their
inclusiveness.
There are two ways to think about Public preferences over inclusiveness. In principle,
minimal coalitions should be less expensive in terms of payments to Legislators, leaving
more resources for the Public, so we might expect the Public to reward minimal
coalitions -- perhaps inferring that her own budget share is larger than it might have
been had the legislative coalition been universalistic. On the other hand, results from
experimental budget division games indicate that players subscribe to norms of
universalism to a greater degree than non-cooperative game theoretical models would
suggest (Diermeier and Morton 2003).
In short, previous experimental research suggests (although this is a weak expectation)
that the Public prefers universalistic coalitions to minimal ones. If this is the case, then
we should observe an effect on legislative behavior only when the Public can see
legislative proposals:
H4: Under FT, legislative coalitions should be more universalistic than
under NT or ST.
VI. Results
Before considering the results regarding how budgets are divided, note that almost no
budget proposals were rejected by majority vote during the experiments conducted thus
far. With 3 sets of experiments conducted in each mode, and 20 periods per experiment,
we have 60 budget proposals per mode, and 180 overall. Of these, only 5 (<3%) failed -
- 2 in NT mode, 0 in ST, and 3 in FT. I return to the implications of the overwhelming
budget approval rate in the Discussion section, below. For now, the important point is
that the characteristics of budget proposals and approved budgets are extremely similar in all
modes. Out of expediency, therefore, my default will be to present data on the complete
set of budget proposals, and not present parallel data on budget outcomes.

16
docum
ento
s d
e tra
bajo
VI. 1. How are budgets divided?
Overall, budget divisions tend to favor the Public and the Proposer, with the former
averaging just over 8 units per period and the latter just under 9, while the high offer to
non-Proposer Legislators averaged just over 5 and the low offer just below 2.7 47% of
budget proposals were minimum-winning, offering some positive amount to the High
Legislator and 0 to the Low Legislator.
Figure 2. Offers to Public, Proposer, High and Low Legislators - All Modes
Because I am particularly interested in how budgets serve the Public, and in the
conditions that trigger the Public to punish Legislators electorally, it is worth looking at
the distribution of POs. Figure 3 shows that the most frequent POs are at 0, 8, 10, and
12 budget units, with a density in the range around 10, lesser density in the 2-7 range,
and offers above 12 are rare.
7 Graphs will generally distinguish between the Public's offer, the Proposer's offer, and the High and Low offers made to non-proposer Legislators.

17
docum
ento
s d
e tra
bajo
Figure 3. Distribution of Public's offers (POs) - All Modes
VI. 2. What does the Public reward/punish?
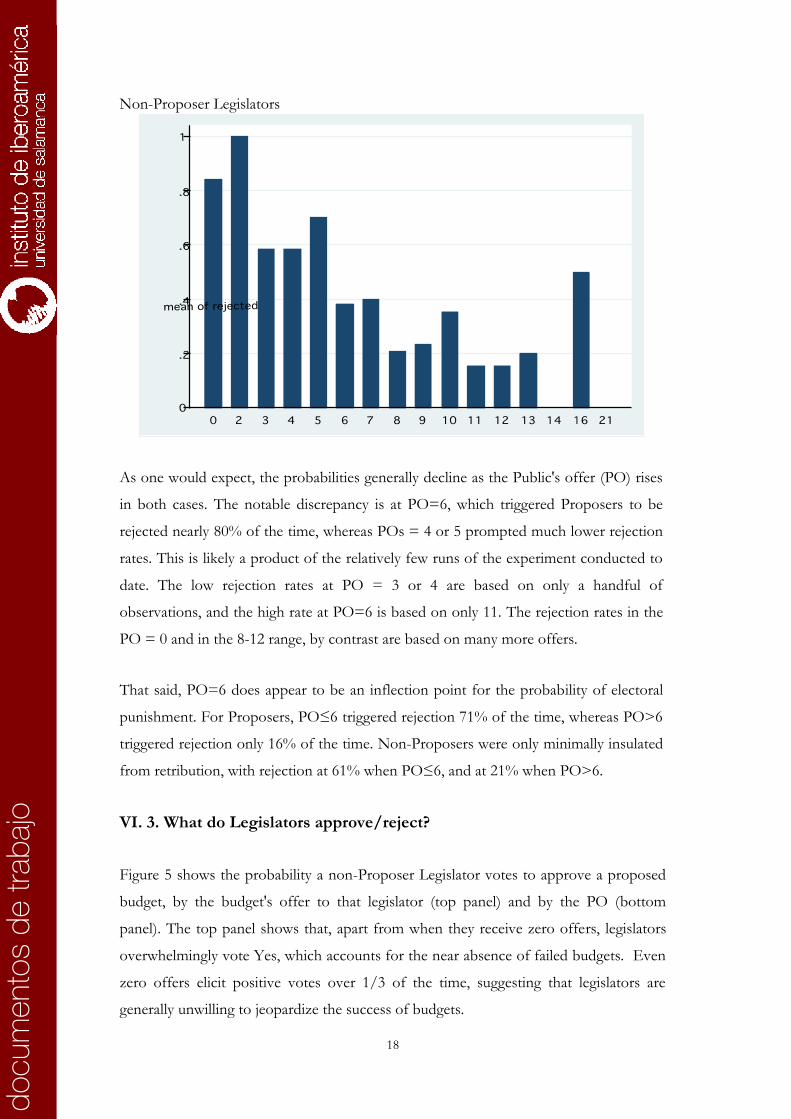
Figure 4 shows the probability that Legislators are rejected (i.e. not reelected) for the
subsequent period, by the budget offer to the Public, with the top panel showing the
probability for Proposers and the bottom for non-Proposer legislators.
Figure 4. Probability Legislators are rejected for next period, by Public's budget offer - All modes
Proposer
18
docum
ento
s d
e tra
bajo
Non-Proposer Legislators
As one would expect, the probabilities generally decline as the Public's offer (PO) rises
in both cases. The notable discrepancy is at PO=6, which triggered Proposers to be
rejected nearly 80% of the time, whereas POs = 4 or 5 prompted much lower rejection
rates. This is likely a product of the relatively few runs of the experiment conducted to
date. The low rejection rates at PO = 3 or 4 are based on only a handful of
observations, and the high rate at PO=6 is based on only 11. The rejection rates in the
PO = 0 and in the 8-12 range, by contrast are based on many more offers.
That said, PO=6 does appear to be an inflection point for the probability of electoral
punishment. For Proposers, PO≤6 triggered rejection 71% of the time, whereas PO>6
triggered rejection only 16% of the time. Non-Proposers were only minimally insulated
from retribution, with rejection at 61% when PO≤6, and at 21% when PO>6.
VI. 3. What do Legislators approve/reject?
Figure 5 shows the probability a non-Proposer Legislator votes to approve a proposed
budget, by the budget's offer to that legislator (top panel) and by the PO (bottom
panel). The top panel shows that, apart from when they receive zero offers, legislators
overwhelmingly vote Yes, which accounts for the near absence of failed budgets. Even
zero offers elicit positive votes over 1/3 of the time, suggesting that legislators are
generally unwilling to jeopardize the success of budgets.

19
docum
ento
s d
e tra
bajo
The bottom panel shows no clear relationship between POs and the budget votes of
non-Proposer Legislators. More than 2/3 of all Nay votes on budgets were cast by
Legislators who received zero offers. The POs associated with those offers were widely
distributed, but it was the offers to the Legislators that overwhelmingly drove their
decisions to cast Nay votes.
Figure 5. Probability non-Proposer Legislator votes to approve budget - All modes
By offer to that Legislator
By offer to Public

20
docum
ento
s d
e tra
bajo
VI. 4. How does transparency affect how each type of player fares?
The central result of these experiments is that transparency matters to the relative
distribution of the budget among players. Figure 6 illustrates the distribution of budget
offers to the Public, the Proposer, and to non-Proposer Legislators, under each of the
transparency conditions. The top panel separates out the POs, which are the main point
of interest, and for which differences across transparency modes are most dramatic. The
second panel includes offers to Proposers and non-Proposer Legislators as well.
Figure 6. Distribution of offers to Public, Proposer, and non-Proposer Legislators, by Transparency
Public
Public, Proposer, and Non-Proposers

21
docum
ento
s d
e tra
bajo
The first lesson is that, consistent with H1 and H2, transparency is the Public's friend.
The mean PO is 5.2, 9.3, and 10.3 under NT, ST, and FT conditions, respectively.
Conversely, transparency (or at least the full version) appears to work against Proposers.
Mean Proposer's offers are 10.0, 9.7, and 7.5 under NT, ST, and FT, respectively. Non-
proposer Legislators, do best under NT (mean high = 6.7, mean low = 2.2), then FT
(high=4.5, low=1.8), and worst under ST (4.3 and 0.7).
VI. 5. First-order accountability: Proposers and bad budget offers
We have seen that Proposers pay an electoral price for offering the Public too little.
Figure 7 shows that this relationship grows starker with transparency. The top panel
shows the rates at which Proposers are thrown out of office, given their PO, under each
transparency mode, whereas the bottom panel shows the frequency of
reelection/rejection under each condition. (The frequency graphs are noisier, but
convey information about the number of observations at each PO interval.)
Figure 7. Rate of Proposers rejected, by Public Offer and Transparency

22
docum
ento
s d
e tra
bajo
Very low POs are a death wish for Proposers under all transparency modes, but under
NT, Proposers do not appear to benefit electorally from generosity to the Public in the
whole PO range from 3-12. This is likely because the Public cannot definitively identify
the Proposer under NT, and Publics evidently showed occasional hesitation to fire all
three Legislators even after receiving fairly low POs in some periods. By contrast,
punishment of Proposers who low-balled the Public was more regular in both ST and
FT modes, where the identity of the Proposer was revealed. That said, in ST and FT
modes, low POs were rarely observed (bottom panel) as Proposers, anticipating
punishment, offered far more Public-serving budgets.
VI. 6. Second-order accountability: Non-proposers and bad budgets
Proposers catered to the Public far more assiduously when they were visible. But what
about non-Proposer Legislators? Part of the logic of the treatment conditions is to
expose the non-Proposers to possible electoral sanction for voting for budgets that
serve the Public poorly (or voting against ones that serve the Public well).

23
docum
ento
s d
e tra
bajo
Under NT or ST, non-Proposers are anonymous, so we might expect their voting
decisions to be driven exclusively by how well the budget offer treats them. Recall that if
a proposed budget fails, all players receive nothing. Under NT, non-Proposers have no
reason to vote against a budget that serves the Public poorly because even causing such
a budget to fail delivers zero to the Public, while all legislators -- Proposer and non-
Proposers alike -- are indistinguishable to the Public. Assuming the Public will punish a
failed budget (and zero pay-off) by rejecting the team of legislators that engineered it,
there is no reason for non-Proposers to vote against budgets under NT. Under ST, the
Public can distinguish the non-Proposers from the Proposer, but does not see individual
votes (or the offers, other than the PO), so has limited ability to reward good legislative
behavior beyond the proposal.
FT, by contrast, is designed to confront non-Proposers facing budgets that serve the
Public poorly (and in doing so, that may serve themselves well) with the dilemma that
approving 'bad' budgets may invite electoral punishment. Is there evidence that such
budgets put non-Proposers in a tough spot, or that the Pubic delivers punishment along
these lines? Figure 8 shows the rate at which non-Proposers voted to approve proposed
budgets, by the PO, with a separate graph for each transparency condition.
Figure 8. Probability of non-Proposer approving a budget proposal, by Public's Offer and Transparency

24
docum
ento
s d
e tra
bajo
If FT exerts strong pressure on non-Proposers to guard the Public's interest, then we
should observe an increasing probability of 'Aye' votes as we move from left to right
across the FT (bottom )panel, but not in the NT or ST (top two) panels of the figure.
This pattern is definitely more pronounced in FT than in ST, although the contrast is
not so clear relative to NT. In any case, the raw rates of 'Aye' votes is a rough measure
of accountability, both because we know the offers to the Legislators themselves also
affect likelihood of voting 'Aye,' and because the number of budget proposals at each
interval of PO varies.
A more precise estimate of the effect of transparency on non-Proposer votes follows
from comparing logit regressions of:
Pr(Vote=1) = a(Constant) + b1(Legislator's Budget Offer) + b2(PO).
Under the various transparency conditions. Table 1 shows the coefficients and standard
errors for the variables of interest in these three separate regressions, along with the
estimated change in the likelihood of a Yes vote from shifting each independent variable
from its 20th percentile value to its 80th percentile value, with other variables in the
equation held constant at their mean values.8
Table 1. Logistic regressions of votes of non-Proposer Legislators on proposed budgets, by their own budget offers, and POs, by transparency conditions. (N=114 in each case.)
Non-Transparency Semi-Transparency Full Transparency
Coefficient
(Std. Error)
20th80th Coefficient
(Std. Error)
20th80th Coefficient
(Std.Error)
20th80th
Legislator's
Budget
Offer
.72
(.13)
+72%
(9%)
1.65
(.40)
+69%
(7%)
.41
(.14)
+19%
(6%)
Public's
Offer
.30
(.09)
+39%
(13%)
-.16
(.14)
-2%
(3%)
.38
(.14)
+12%
(5%)
8 Budget votes from the last period of each 20-period experiment are dropped because no threat of electoral punishment exists in last periods. I discuss last-period effects below.

25
docum
ento
s d
e tra
bajo
It comes as no surprise that raising a legislator's budget offer increases her propensity to
support that budget under all transparency conditions. The effect is weakest by far,
however, under FT. By contrast, raising the PO had no effect on a Legislator's
likelihood of supporting the budget under ST, but raised it under both NT and FT. The
FT result, and the corresponding non-effect of POs under ST, are consistent with H3
and with the idea of second-order accountability under FT. The estimated positive
effect of the PO on Legislators' votes under NT, by contrast, is unexpected and
puzzling. It may be an idiosyncrasy that would disappear with a larger subject pool and
more repetitions of the experiment, but for now it remains unexplained.
Finally, Figure 9 presents data on whether the Public exacts retribution on non-
Proposer Legislators according to their budget votes at various levels of PO. In each
panel, there are three graphs (one for each transparency condition), each divided
according to whether the Legislator voted No or Yes on the budget proposal. The POs
are shown along the X-axes.
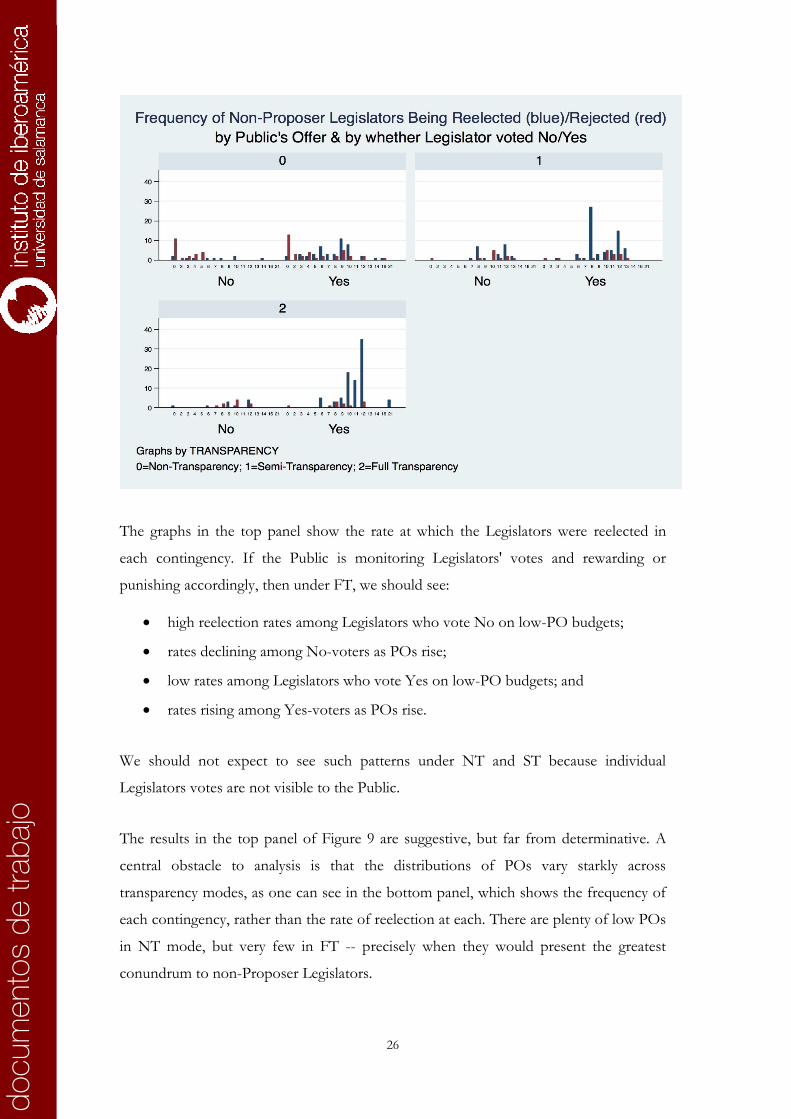
Figure 9. Electoral punishment of non-Proposers by Public Offer, Vote, and Transparency
26
docum
ento
s d
e tra
bajo
The graphs in the top panel show the rate at which the Legislators were reelected in
each contingency. If the Public is monitoring Legislators' votes and rewarding or
punishing accordingly, then under FT, we should see:
high reelection rates among Legislators who vote No on low-PO budgets;
rates declining among No-voters as POs rise;
low rates among Legislators who vote Yes on low-PO budgets; and
rates rising among Yes-voters as POs rise.
We should not expect to see such patterns under NT and ST because individual
Legislators votes are not visible to the Public.
The results in the top panel of Figure 9 are suggestive, but far from determinative. A
central obstacle to analysis is that the distributions of POs vary starkly across
transparency modes, as one can see in the bottom panel, which shows the frequency of
each contingency, rather than the rate of reelection at each. There are plenty of low POs
in NT mode, but very few in FT -- precisely when they would present the greatest
conundrum to non-Proposer Legislators.

27
docum
ento
s d
e tra
bajo
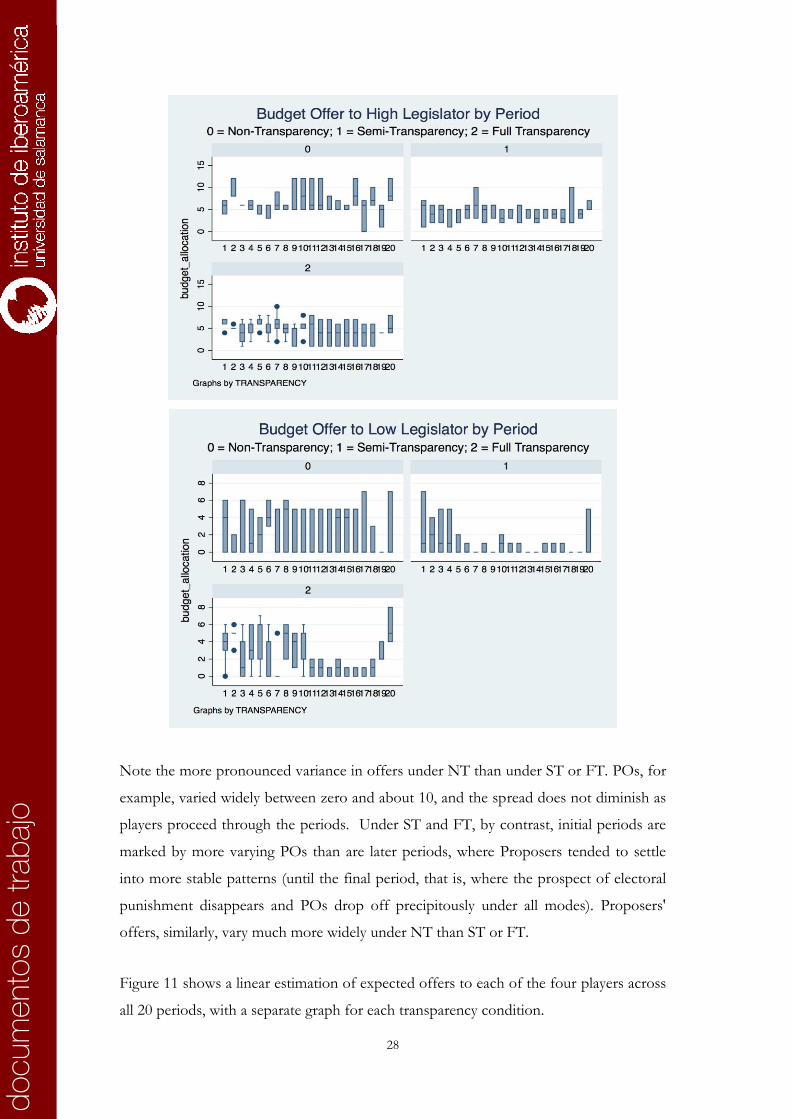
VI. 7. Patterns and learning across periods
Anticipation of electoral punishment by Proposers, encompassed in their offers,
develops over periods of the game at different rates and to different levels, according to
transparency. The boxplots in Figure 10 show the distribution of offers to the Public,
Proposer, High, and Low Legislators, across all 20 periods of play, under NT, ST, and
FT.
Figure 8. Distribution of offers to Public, Proposer, High and Low Legislators, across periods, by transparency
28
docum
ento
s d
e tra
bajo
Note the more pronounced variance in offers under NT than under ST or FT. POs, for
example, varied widely between zero and about 10, and the spread does not diminish as
players proceed through the periods. Under ST and FT, by contrast, initial periods are
marked by more varying POs than are later periods, where Proposers tended to settle
into more stable patterns (until the final period, that is, where the prospect of electoral
punishment disappears and POs drop off precipitously under all modes). Proposers'
offers, similarly, vary much more widely under NT than ST or FT.
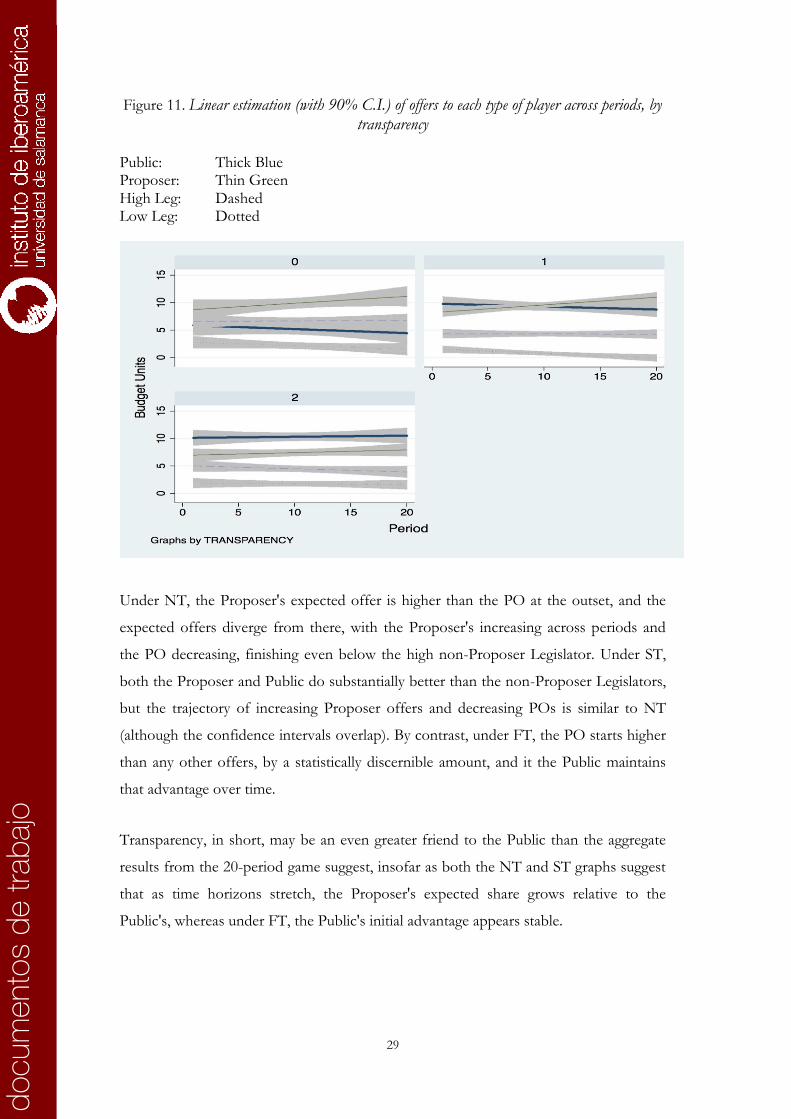
Figure 11 shows a linear estimation of expected offers to each of the four players across
all 20 periods, with a separate graph for each transparency condition.
29
docum
ento
s d
e tra
bajo
Figure 11. Linear estimation (with 90% C.I.) of offers to each type of player across periods, by transparency
Public: Thick Blue Proposer: Thin Green High Leg: Dashed Low Leg: Dotted
Under NT, the Proposer's expected offer is higher than the PO at the outset, and the
expected offers diverge from there, with the Proposer's increasing across periods and
the PO decreasing, finishing even below the high non-Proposer Legislator. Under ST,
both the Proposer and Public do substantially better than the non-Proposer Legislators,
but the trajectory of increasing Proposer offers and decreasing POs is similar to NT
(although the confidence intervals overlap). By contrast, under FT, the PO starts higher
than any other offers, by a statistically discernible amount, and it the Public maintains
that advantage over time.
Transparency, in short, may be an even greater friend to the Public than the aggregate
results from the 20-period game suggest, insofar as both the NT and ST graphs suggest
that as time horizons stretch, the Proposer's expected share grows relative to the
Public's, whereas under FT, the Public's initial advantage appears stable.
30
docum
ento
s d
e tra
bajo
VI. 8. Minimum coalitions versus universalism
Beyond effects on the Public, Figure 11 (above) also suggests that the budgetary fates of
non-Proposer Legislators differ across transparency modes, with the High Legislator
doing best under NT and the Low Legislator doing worst under ST. Among the three
legislators as a group, FT appears to minimize inequality. I measure the distributive
effects among Legislators of transparency in two different ways:
the incidence of minimum coalitions; and
standard deviation of offers to (Proposer, High Legislator, Low Legislator)
from each period.
The differences are summarized in Table 2.
Table 2. Distribution of budget benefits across Legislators
Non-Transparency
Semi-Transparency
Full Transparency
% Minimum Coalitions 53 67 26
Variance Legislators' Offers 4.3 4.7 2.8
The proportion of minimum coalitions -- those that offer zero budget units to one
legislator -- is more than double under NT and ST than under FT. Correspondingly, the
average variance across Legislators' offers is substantially higher under NT and ST than
under FT. Consistent with H4, when the details of budget offers are not visible to the
Public, as under NT or ST, Proposers were far more inclined to form minimum
coalitions, and were less egalitarian in their distributions across coalition partners, than
when the details of budget offers were fully visible, under FT.
Proposers' reluctance to play budget hardball under FT is consistent with the
proposition that the Public prefers universalism and will reward it (and punish minimal
coalitions) when offers are visible. The data from these experiments, however, do not
show the Public administering such electoral sanctions. Logit regression of:
Pr(Reelected) = a(Constant) + b1(PO) + b2(Minimum Coalition)
For all Proposers in FT shows, as expected, that high POs are rewarded, but the
estimated effect of minimum coalitions (or, alternatively, variance among Legislators's

31
docum
ento
s d
e tra
bajo
offers) is indistinguishable from zero. So Proposers appear to have anticipated Public
sanction for self-serving offers under FT and adapted their behavior accordingly, but
the results to date do not indicate whether these anticipations were warranted.
VI. 9. Reelection rates
We have seen (Figs. 4, 7, 9) data on the rates of reelection/rejection of Legislators by
the Public contingent on POs and Legislators' votes. We also know that the
distributions of POs and Legislators votes depend on transparency conditions. The
product, illustrated in Figure 12, is that overall rates of reelection, for Proposers and for
non-Proposer Legislators alike, vary substantially by transparency mode.
Figure 9. Reelection rates among Proposers and non-Proposer Legislators, by Transparency
The most striking difference is the lower reelection rates in both categories under NT
than under ST or FT. Both Proposers and non-Proposers are thrown out of office more
than twice as frequently under NT than under either ST or FT. The experiment
establishes electoral sanction as the Public's only tool for eliciting good behavior among
Legislators, and the Public demonstrably uses this tool much more often under NT than
in the other modes, but to far less effect, judging from the Public's budget shares under
each mode.
32
docum
ento
s d
e tra
bajo
Transparency makes electoral sanction is more effective, which in turn minimizes the
need for it to be exercised, consistent with the general results from formal models of
transparency and legislative responsiveness (Ting and Snyder 2005; Humphreys and
Weinstein 2008), but contrary to conventional wisdom that often equates high rates of
reelection with insulation of legislators from public sentiment (cites).
VII. Characteristics of Proposers
Experiment participants filled in brief surveys that provide at least three pieces of
personal information potentially relevant to their behavior: sex, citizenship, and (given
that the participants in this preliminary set of experiments were overwhelmingly
undergraduate students) academic discipline. Although the analysis up to now has not
explored the effects of these characteristics, I summarize here a few differences -- and
non-differences -- by demographics.
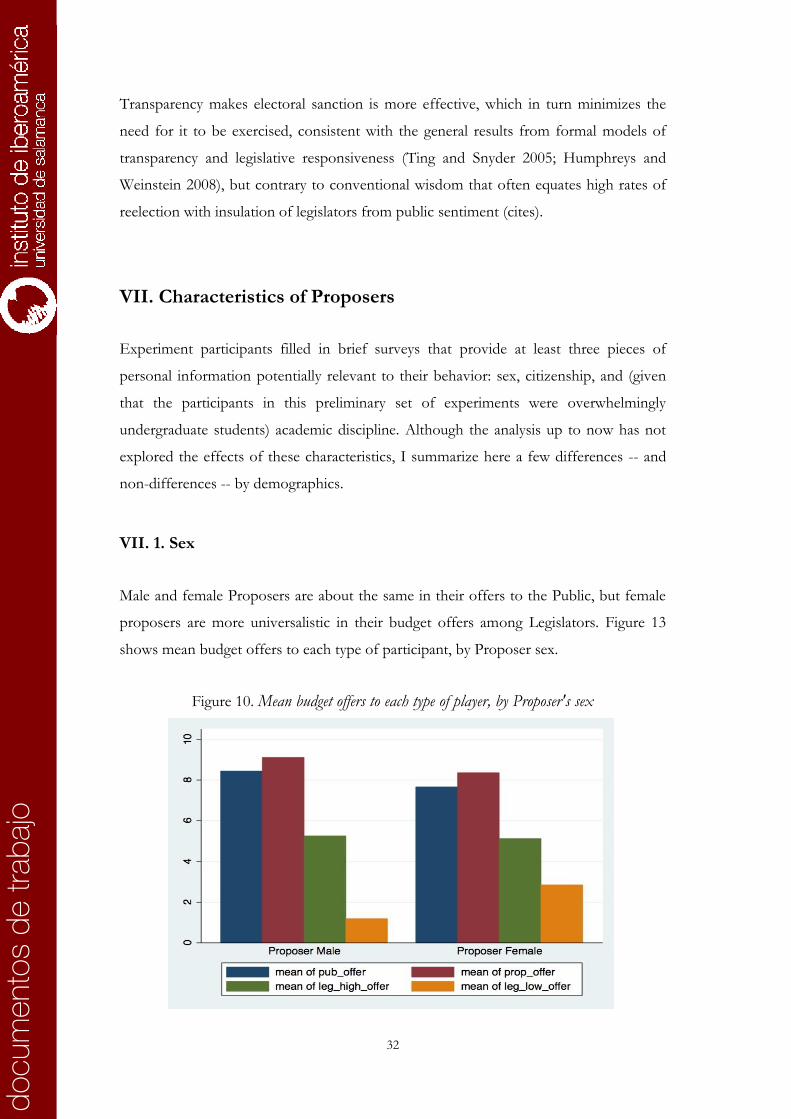
VII. 1. Sex
Male and female Proposers are about the same in their offers to the Public, but female
proposers are more universalistic in their budget offers among Legislators. Figure 13
shows mean budget offers to each type of participant, by Proposer sex.
Figure 10. Mean budget offers to each type of player, by Proposer's sex

33
docum
ento
s d
e tra
bajo
Budget proposals were far more equitable among legislators under female than male
Proposers. Male proposers were almost twice as likely as females (51% to 27%) to
propose minimal coaltions. The sex effect appears to be even stronger than the effect of
transparency. Logit regression of:
Pr(Minimum Coalition) = a(Constant) + b1(Transparency) + b2(Proposer Sex)
Shows both conditions to have strong estimated effects on the probability of minimum
coalition offers. Holding other conditions at median values, shifting from ST to FT (the
key jump in transparency) decreases the probability of a minimum coalition offer by
10%, whereas shifting from a male to female proposer drops the probability by 25%.
VII. 2. Citizenship
Fifteen percent of participants -- and thirteen percent of Proposers -- were non-US
citizens. Given that this research was initially motivated by cross-national variations in
legislative transparency, and the intuition that accountability follows from transparency,
the experiment may ultimately provide insight as to whether participant country of
citizenship conditions expectations about legislative behavior and electoral sanction. For
now, it is worth noting that non-US Proposers appeared to be more Public-serving in
their budget offers than did US citizen Proposers, as illustrated in Figure 14.9
Figure 114. Boxplot of budget offers to each type of player, by Proposer's citizenship
9 Patterns are slightly more difficult to discern using the boxplot than just a summary statistic (like mean offer), but given the imbalance in the numbers of US and non-US citizens, variances in the offer distributions might be expected to differ between the types.
34
docum
ento
s d
e tra
bajo
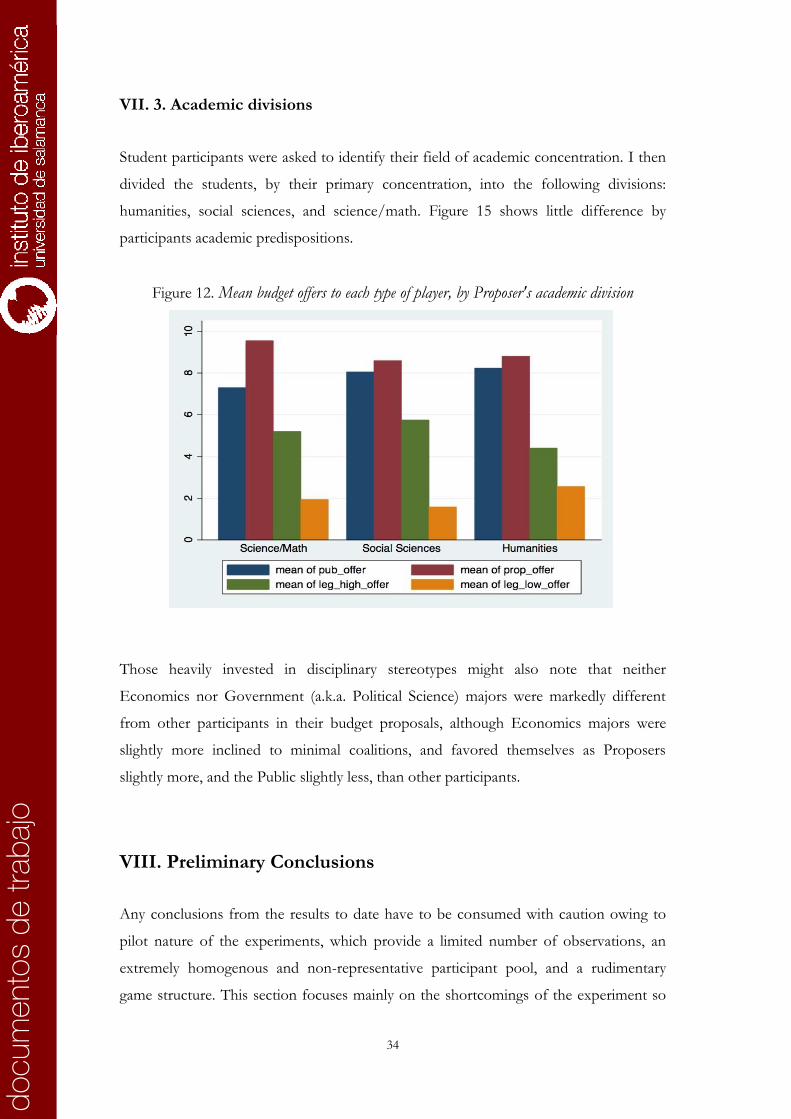
VII. 3. Academic divisions
Student participants were asked to identify their field of academic concentration. I then
divided the students, by their primary concentration, into the following divisions:
humanities, social sciences, and science/math. Figure 15 shows little difference by
participants academic predispositions.
Figure 12. Mean budget offers to each type of player, by Proposer's academic division
Those heavily invested in disciplinary stereotypes might also note that neither
Economics nor Government (a.k.a. Political Science) majors were markedly different
from other participants in their budget proposals, although Economics majors were
slightly more inclined to minimal coalitions, and favored themselves as Proposers
slightly more, and the Public slightly less, than other participants.
VIII. Preliminary Conclusions
Any conclusions from the results to date have to be consumed with caution owing to
pilot nature of the experiments, which provide a limited number of observations, an
extremely homogenous and non-representative participant pool, and a rudimentary
game structure. This section focuses mainly on the shortcomings of the experiment so
35
docum
ento
s d
e tra
bajo
far and speculation about how to improve it, but I begin by rehearsing some (admittedly
preliminary) conclusions.
First, transparency is good for the Public. Consistent with the first two hypotheses, the
greater the transparency, the higher the Public's budget shares (H1) and POs (H2). The
direction of the effect is not particularly surprising, but the scope of the difference is
impressive. Second, transparency appears to foster high rates of reelection by enabling
Legislators to demonstrate unambiguously their fidelity to the Public's interest. Third,
transpareny appears to foster universalism among Legislators (H4), reducing the number
of minimum coalitions (although not as much as having female Proposers does) and
diminishing the spread between the lowest and highest Legislators' offers.
The results from these first experiments make it difficult to evaluate H3, that
transparency non-Proposer Legislators would embrace Public-serving budgets, and
reject Public-denying ones. There is some evidence that this is the case, but the strategic
behavior of experimental participants -- avoiding Public-denying POs under FT mode --
leaves us with thin evidence on this count. Indeed, the success of these preliminary
experiments in eliciting strategic behavior (and the avoidance of certain actions) is also a
liability -- and I focus the rest of this discussion on the liabilities, some speculation
about how to remedy them, and an open invitation for advice and suggestions.
IX. Next Steps
IX. 1. Solving the game
A principal shortcoming of the project to date is the absence of a formal solution to the
game participants play. This is a direct product (or non-product) of the skill set of the
researcher, which doesn't include formal modeling, so will require collaboration to
remedy, but the payoff from solving the game should lead to more refined, and more
fully justified, hypotheses. It might also point toward ways of recalibrating the
experiment so as to increase the empirical leverage it provides.

36
docum
ento
s d
e tra
bajo
IX. 2. Absence of failed budgets
Following directly on the above, in retrospect, I suspect that the near-total absence of
failed budgets would not have taken me by surprise had a formal solution of the game
been available. Intuitively, it seems clear that voting Yes on budget proposals is weakly
dominant under NT, where any failed budget can be expected to yield wholesale
electoral punishment from the Public. Under ST, where individual non-Proposers
cannot be identified and individual votes are not visible, the incentives to vote No are
not much greater. FT mode, by contrast, was designed to elicit what I call second-order
accountability, which I expected to yield the rejection of Public-denying budgets. Yet
Proposers, anticipating this, rarely floated low POs under FT -- an pattern that likely to
be flagged by a formal solution, given my starting assumptions, and the design of the
game.
At any rate, the experiment could be improved if it provided more leverage on whether
and how second-order (or non-Proposer) accountability operates. The answer to that
question is essential to determining whether voting transparency in legislatures matters
to the quality of representation.
IX. 3. Mixing scripted and live players
One possible remedy here would be to run versions of the experiment in which
participants are told they are playing with live participants when in reality they are playing
with a script that follows certain prescribed actions -- for example, a Proposer that low-
balls the PO even under FT. The votes on these POs by live-participant non-Proposers
would constitute a test of second-order accountability, and the political relevance of
visible voting. More generally, the use of experimental scripts would allow me to test for
behaviors off the equilibrium paths onto which live participants tend to flow.
IX. 4. Altering punishments and payoffs
The current structure of the game limits the type and severity of the punishment the
Public can mete out to Legislators. Consider that the game, as is, requires 10 players, 6
of whom are non-active at any given time (and, in cases of sustained reelection among
active Legislators, possibly all the way through). The pool of non-active Legislators is

37
docum
ento
s d
e tra
bajo
necessary as long as reelection is the currency by which the Public rewards/punishes
Legislators.
Alternatively, however, the Public might be allowed to reward/punish with the currency
of the experiment itself. Rather than a reelection round, the Public might be prompted
to allocate some share of her profits from the prior round(s) to reward good legislative
behavior. The Public could also be allowed to pay some premium in order to strip a
Legislator of his profits as punishment for bad behavior.
This alteration would complicate the game modestly by making reward/punishment less
of a blunt instrument, but it would radically simplify it logistically by reducing the
number of participants, and eliminating the thorn in the side of many -- non-activity. It
would also directly reveal the relative extent to which the Public values different
behaviors -- good Proposing versus good voting, for example.
IX. 5. Web-based environment: Expanding the participant base
A variant of the game that eliminates non-active Legislators would also open up the
prospect of moving the experiment out of a lab with networked computers and into a
web-based environment in which participants interact with each other through a website
connected to a common server.10 Indeed, moving out of the lab to a web-based
environment could improve the experiment in much more important ways as well. It
would reinforce anonymity among players. More importantly, a web-based environment
would open participation to a far wider pool of players, including players in different
countries, who may bring different norms and strategic expectations, based on their
experiences with legislative representation and transparency, to the table.
IX. 6. Wild speculation: A social media app
Beyond a web-based experiment, it may also be possible to design a variant of the game
as a social media app for computers or wireless devices, which participants could play
not for cash but to accumulate points. Removing cash payoffs obviously alters incentive
structures, but would also radically reduce the cost of conducting the experiment. If
10 Keeping non-active Legislators engaged is sufficiently challenging in the lab environment, and would present larger problems with participants playing in disparate locations.

38
docum
ento
s d
e tra
bajo
participants could be attracted, and if the game could induce genuine competition over
the fixed budget, this approach might generate abundant data, which in turn would
allow for multiple refinements, variations, and extensions of the game itself.
IX. 7. Mixing transparency conditions across periods
The preliminary experiments set the transparency mode as constant across all 20 periods
of play for a given group. Players learned the game and, in ST and FT modes in
particular, tended to settle into stable patterns of behavior. In most real legislatures, by
contrast, transparency varies across different legislative proposals, and strategic behavior
might reasonably be expected to adapt as well. An obvious extension of the game
(facilitated by cheap iterations, particularly in the social media app world) would be to
allow for transparency to vary across periods and measure how the behavior of a stable
set of participants is affected.
IX. 8. Multiple Publics with corresponding Legislators
One final variant -- facilitated both by increasing the number of iterations, and by
reducing the number of participants (by eliminating non-active legislators) -- would be
to allow for a separate Public corresponding to each Legislator.11 Reward/punishment
would then be focused on one's own unique representative, as in single-member district
electoral systems. This variant would allow variation of transparency across Legislators in
the same chamber (and even on the same vote!). It would allow measurement of how
different (say, male versus female) Publics react to the same behaviors by their
representatives. It would also allow estimation of how much Publics value (or object to)
legislative logrolls.
In closing, the pilot effort of programming and running the experiment was moderately
successful. Further progress will depend on securing grant funding to improve the
experiment and run it, or variants of it, with a broader participant pool. Suggestions as
to how to make these improvements (or how and where to secure grant support) are
most welcome.
11 Thanks to Simon Hix for this suggestion.
39
docum
ento
s d
e tra
bajo
X. Bibliography Baron, David P. and Ferejohn, John A. 1989. “Bargaining in legislatures”. American Political Science Review 83 (4): 1181-1206.
Besley, Timothy. 2005. “Political selection”. Journal of Economic Perspectives. 19 (3): 43-60.
Bianco, William T., Spence, David B. and Wilkerson, John D. 1996. “The Electoral Connection in the Early Congress: The Case of the Compensation Act of 1816.” American Journal of Political Science 40 (1): 145-71.
Burke, Edmond. 1774. The Works of the Right Honourable Edmund Burke. London: Henry G. Bohn.
Carey, John M. 2007. “Competing principals, political institutions, and party unity in legislative voting”. American Journal of Political Science 51 (1): 92-107.
Carey, John M. 2009. Legislative Voting and Accountability. Cambridge: Cambridge University Press.
Carrubba Clifford J., Gabel, Matthew and Hug, Simon. 2008. “Legislative voting behavior, seen and unseen: A theory of roll-call vote selection”. Legislative Studies Quarterly 33 (4): 543-572.
Carrubba Clifford J. and Voden, Craig S. 2000. “Coalition politics and logrolling in legislative institutions”. American Journal of Political Science 44 (2): 261-277.
Cox, Gary W. and Morgenstern, Scott. 2001. “Latin America’s reactive assemblies and proactive presidents”. Comparative Politics 33 (2): 171-190.
Crisp, Brian F. and Driscoll, Amanda. 2010. “The importance of legislative voting procedures”. Unpublished paper.
Diermeier, Daniel and Morton, Rebecca. 2003. “Proportionality versus Perfectness: Experiments in Majoritarian Bargaining”. Unpublished paper.
Fehr, Ernst and Gächter, Simon. 2000. “Cooperation and punishment in public goods experiments”. American Economic Review 90 (4): 980–994.
Fischbacher, Urs, Gächter, Simon and Fehr, Ernst. 2001. “Are people conditionally cooperative? Evidence from a public goods experiment”. Economic Letters 71: 397–404.
Fischbacher, Urs. 2007. “z-Tree: Zurich toolbox for ready-made economic experiments”. Experimental Economics 10 (2): 171-178.
Fréchette, Guillaume R., Kagel, John H. and Lehrer, Steven F. 2003. “Bargaining in Legislatures: An Experimental Investigation of Open versus Closed Amendment Rules”. American Political Science Review 97 (2): 221-232.
Fréchette, Guillaume R., Kagel, John H. and Morelli, Massimo. 2005a. “Nominal bargaining power, selection protocol, and discounting in legislative bargaining”. Journal of Public Economics 89 (8): 1497-1517.
Fréchette, Guillaume R., Kagel, John H. and Morelli, Massimo. 2005b. "Gamson's Law versus non-cooperative bargaining theory”. Games & Economic Behavior 51 (2): 365-390.
Henrich, Joseph et. al. 2005. “Economic man” in cross-cultural perspective: Behavioral experiments in 15 small-scale societies”. Behavioral and Brain Sciences 28 (6): 795-855.
Henrich, Joseph et. al. 2010. “Costly punishment across societies”. Science 312: 1467-1470.
Henrich, Joseph et. al. 2010. “Markets, Religion, Community Size, and the Evolution of Fairness and Punishment”. Science 327: 1480-1484.
Herrmann, Benedikt, Thöni, Christian and Gächter, Simon. 2008. “Anti-social punishment across societies”. Science 319: 1362-1367.
Hug, Simon. 2010. “Selection effects in roll call votes”. British Journal of Political Science 40 (1): 225-235.

40
docum
ento
s d
e tra
bajo
Humphreys, Macartan and Weinstein, Jeremy. 2008. “Policing politicians: Citizen empowerment and political accountability in Uganda”. Unpublished paper.
Kile, Orville M. 1948. The Farm Bureau through three decades. Baltimore: Waverly Press.
Malesky, Edmund, Shuler, Paul and Tran, Ngoc Anh. 2010. “The adverse effects of sunshine: A field experiment testing the impact of transparency on delegate performance in an authoritarian assembly”. American Political Science Association conference paper.
McKelvey, Richard D. 1991. “An experimental test of a stochastic game model of committee bargaining”. In Laboratory Research in Political Economy, Thomas R. Palfrey (ed.). Ann Arbor: University of Michigan Press.
Miller, Gary J. 2010. Personal communication with Miller, Professor of Political Science at Washington University, St. Louis, on March 28-29.
Morgenstern, Scott. 2003. Patterns of legislative politics: Roll call voting in Latin America and the United States. New York: Cambridge University Press.
Morton, Rebecca and Kenneth Williams. 2010. Experimental political science and the study of causality: From nature to the lab. New York: Cambridge University Press.
Niou, Emerson M.S. and Ordeshook, Peter C. 1985. “Universalism in Congress”. American Journal of Political Science 29 (2): 246-258.
O’Connor, John and Smith, Gina. 2010. “Things to know about Nikki Haley”. HeraldOnline. June 20. http://www.heraldonline.com/2010/06/20/2255359/things-to-know-about-nikki-haley.html
Odegard, Peter H. 1928. Pressure politics: The story of the Anti-Saloon League. New York: Columbia University Press.
Rose-Ackerman, Susan. 1999. Corruption and government: Causes, consequences, and reform. New York: Cambridge University Press.
Rousseau, Jean Jacques. 1763. “Book IV, Ch.XX, Voting”. The Social Contract.
Saalfeld, Thomas. 1995. “On Dogs and Whips: Recorded Votes”. In Parliaments and majority rule in Western Europe, Herbert Doring (ed.). New York: St Martin’s Press.
Samuels, David J. 2002. “Presidentialized parties”. Comparative Political Studies 35: 461-483.
Siavelis, Peter. 2000. The president and congress in postauthoritarian Chile: institutional constraints to democratic consolidation. University Park: Pennsylvania State University Press.
Skeen, C. Edward. 1986. “Vox Populi, Vox Dei: The Compensation Act of 1816 and the Rise of Popular Politics”. Journal of the Early Republic 6 (3): 253-274.
Snyder, James M. and Ting, Michael. 2005. “Why Roll Calls? A Model of Position Taking in Legislative Voting and Elections”. Journal of Law, Economics, and Organization 21 (1): 153-78.
Stasavage, David. 2004. “Open-door or closed-door? Transparency in domestic and international bargaining”. International Organization 58(4): 667-703.
United States Supreme Court. 1958. Majority Decision in NAACP v. Alabama Ex Rel. Patterson, Attorney General. No.91 Supreme Court of the United States 357 U.S. 449; 78 S. Ct. 1163.

41
docum
ento
s d
e tra
bajo
APPENDIX: DOCUMENTS FOR EXPERIMENT PARTICIPANTS
Legislative Budgeting Experiment Instructions
Experiment ID#______________ This experiment is part of a study of decision making in legislatures. As a participant, you stand to make a substantial amount of money, which will be paid in cash at the end of the experiment. We expect your full participation in the experiment will take about 1 hour. Materials. You have 4 types of handouts -- all stapled together (for now).
1. A copy of these instructions which you can look at anytime during the experiment. You will see your ID# for the experiment at the top of these instructions.
2. Two copies of a Consent Form on the experiment that you must sign in our presence. You keep one copy; the other stays with us.
3. Your receipt for payment in the experiment. Do not fill in the receipt now. At the end of the experiment we will tell you how to fill in the receipt.
4. A brief questionnaire on your individual characteristics.
No talking or communicating. One important rule of this experiment is that once we begin, no one is allowed to talk or communicate in any way with anyone else. If you talk or communicate to someone else, you lose your right to payment. How will you be paid? Your payment depends partly on your decisions, partly on the decisions of others, and partly on chance. The payoffs are not necessarily fair, and we cannot guarantee that you will earn any specified amount beyond a minimum of $10 that everyone will receive for participating. However, most participants can expect to make substantially more. The experiment consists of a series of group decision-making periods in which you will participate with others in deciding how to divide 24 budget units. In this experiment, each budget unit equals 50 cents ($0.50). At the end of the experiment, you will be paid in cash what you earned in those periods, plus $10. How does the experiment work? This experiment is conducted using the networked computers in the Carson Computer Lab. There are 10 participants, and the experiment will take place in a series of 20 periods. Before the first period begins, here is what will happen:
1 of the 10 participants will be chosen at random to play the part of the Public. The other 9 will be Legislators.
Of the 9 Legislators, 3 will be chosen at random by the computer to be active for the first period. The other 6 will initially be non-active, but remain standing by.
All participants will be informed whether the experiment will be conducted under conditions of Transparency or Non-Transparency, which refers to

42
docum
ento
s d
e tra
bajo
how much information the Public receives about the Legislators' actions. (The details of Transparency and Non-Transparency are explained further below.) Once the condition is assigned, all periods will be played under that condition.
In each period, here is what will happen:
Of the 3 active Legislators, the computer will choose one at random to be the Proposer for that period.
The Proposer will be prompted to divide a budget, however she or he wants, among the 4 active players -- the Public and the 3 active Legislators (one of whom is the Proposer). The available budget in every round is 24 units. Units may not be divided; proposals must be made in full units. The Proposer may give some part of the budget to every player, but is not required to do so.
All Legislators see the full proposal -- that is, how many budget units the Proposer suggests for each active Legislator, and for the Public.
Each active Legislator is prompted to vote either to Approve or Reject the proposed budget. [Note that the Proposer is an active Legislator, so the Proposer will have 1 of the 3 votes. Note also that the Public does not vote on whether the budget passes.]
If a majority (2 or 3) of the Legislators votes to Approve, then the budget passes, and players receive payoffs according to the proposal.
If less than a majority (0 or 1) of the Legislators votes to Approve, then the budget is rejected, and all players get zero payoff for that period.
Each player (the Public and the 3 active Legislators) is informed of her/his
Transparency Condition o The Public is informed of:
o the identity of the Proposer; o how much the proposed budget offered to each of the
Legislators, as well as the Public; o how each Legislator voted (Approve or Reject) on the budget
proposal; o whether the budget was approved or rejected.
Semi-Transparency Condition
o The Public is informed of: o the identity of the Proposer; o whether the budget was approved or rejected;
Non-Transparency Condition
o The Public is informed only of: o whether the budget was approved or rejected.
Note: Under Non-Transparency, the Public receives no information about the Proposer, what each legislator was offered under the proposed budget, or how Legislators voted.

43
docum
ento
s d
e tra
bajo
payoff for that period -- that is, how much, if anything, s/he will receive as a result of the budget outcome -- and what her/his current total profit is from all decision periods up to now.
For each active Legislator, the Public is given the option to Approve or Reject that Legislator for "reelection" to participate in the next decision period.
If an active Legislator is approved, s/he will continue as active in the next period.
If an active Legislator is rejected, s/he will be sent to the pool of non-active Legislators.
Note: The Public does not vote to Approve/Reject Legislators in the last period of the experiment.
In between each period, here is what will happen:
Any Legislator(s) from the previous period who were rejected are replaced by previously non-active Legislator(s), chosen at random by the computer.
Note: A rejected Legislator is not eligible to be selected for the period immediately following her/his rejection. In future periods, the Legislator is eligible to be drawn at random again.
Each of the 9 Legislators is informed whether s/he will play in the next period.
After all 20 periods are over:
Each participant will be informed by the computer of her/his total payoff from the experiment. Participants should stay at their computer screens while a member of the experiment staff comes around to help fill in the receipt form. You may also fill out the participant information questionnaire at this time.
The staff and participant will both confirm that the amount is correct, will fill in the amount on the receipt, and each will sign the receipt to confirm the amount.
The participant may then take her/his receipt and questionnaire to the experiment cashier, who will make payment in cash. The participant will sign once more to confirm receipt, and the cashier will collect the receipt.
44
docum
ento
s d
e tra
bajo
Consent Letter for Carey Legislative Budgeting Experiment You will participate in a series of simulated negotiations over a budget. The experiment examines how information and voting affect bargaining outcomes. The experiment will take place on computer terminals. Before the experiment you will be given an identification number. Throughout the experiment you will only be identified through this number. As such, any decisions you make will be anonymous. Also in any future reporting of the results, your identity will remain confidential. The experiment will last approximately one hour. For your participation you will be paid a guaranteed base fee of $10. You may have the opportunity to make more than this, depending both on chance and on the decisions you make. Each subject may be paid a different amount depending on these factors. You will be paid in cash after the experiment has ended. You will be allowed to terminate your participation in the experiment at any time without any penalty to you. After the series of experiments is completed you may contact Professor John Carey (603 646 1130, [email protected]) for the results of the study. Also, if you have any further questions about this study please contact Professor Carey, or the Committee for the Protection of Human Subjects at 603 646 6482. I voluntarily consent to participate in the experiment described above: Full name (printed) _____________________________________________ Signature__________________________________________ Date ________________________ Phone contact information ___________________________________ E-mail contact information _______________________________________________________________

45
docum
ento
s d
e tra
bajo
Legislative Budgeting Experiment Receipt
Experiment ID#_______________ Guaranteed Participation Fee: $10 Total Profit from budget experiment: _______________ TOTAL PAYMENT DUE: _______________ I confirm that the amount above is the full and correct amount due from participation in this experiment. ______________________________ _______________________________ Experiment Participant Signature Experiment Staff Signature ____________________ Date
************************************* I confirm receipt of my total payment due. ______________________________ _______________________________ Experiment Participant Signature Experiment Staff Signature ____________________ Date

46
docum
ento
s d
e tra
bajo
Legislative Budgeting Experiment Questionnaire
Participant information Experiment ID#_______________ Year of Birth 19_____ Sex (circle one) Male Female Citizenship USA Other ____________________ (please specify) Dartmouth Student Yes No
If you are a Dartmouth Student, please list your major field(s) of study:
1. ________________________
2. ________________________ (if double major)
If you are not a Dartmouth Student, what is your occupation?
________________________

47
docum
ento
s d
e tra
bajo
Documentos de Trabajo
Dirección: Flavia Freidenberg
Coordinación: Salvador Santiuste Cué
Equipo de coordinación: Nicolás Alejandro Liendo
Contacto: [email protected]
Colección
DT Autor/es Título
12/2012 John M. Carey Transparency and Legislative Behavior
11/2012 Herbert Kitschelt y Steven Wilkinson
Vínculos entre ciudadanos y políticos: una introducción
10/2012 Magdalena López La distopía crítica como exorcismo: "Muerte de nadie" de Arturo Arango (2004)
09/2012 Ana Natalucci Los Dilemas Políticos de los Movimientos Sociales: El caso de las organizaciones kirchneristas (2001-2010)
08/2012 David Scott Palmer y Alberto Bolívar
Shining Path of Peru: Recent Dynamics and Future Prospects
07/2011 Laurence Whitehead Las aproximaciones de América Latina "a lo político"
06/2011 Ernesto Calvo y Marcelo Leiras
The Nationalization of Legislative Collaboration: Territory, Partisanship, and Policymaking in Argentina
05/2011 Oswald Lara Borges, Andrea Castagnola y Aníbal Pérez Liñán
Estructura Institucional e Inestabilidad en las Cortes Latinoamericanas
04/2010 Lorena Recabarren y Gerardo Maldonado
Objections to Democracy. Non Democratic Citizens in Latin America
03/2010 José Ignacio Antón, Rafael Muñoz de Bustillo y Miguel Carrera
How Are you doing in your Grandpa’s Country? Labour Market Performance of Latin American Immigrants in Spain
02/2010 Fernando Martín Mayoral Convergencia en América Latina. Un análisis dinámico
01/2010 Ignacio Antón y Miguel Carrera
Excluded or included socio-economic deprivation among ethnic minorities in Chile 1996-2006.