Instituto Ayrton Senna Sustainable Inclusive Growth in ... · CÁTEDRA Instituto Ayrton Senna...
67
CÁTEDRA Instituto Ayrton Senna CÁTEDRA Instituto Ayrton Senna Brasília October, 2017 Ricardo Paes de Barros (IAS/Insper), Diana Coutinho (IAS), Marina de Cuffa (IAS/Insper), Samuel Franco (OPE Sociais), Beatriz Garcia (Insper/IAS), Rosane Mendonça (UFF), Laura Müller Machado (IAS/Insper), Camila Soares (IAS/Insper) Sustainable Inclusive Growth in Brazil: Past Achievements and Challenges Ahead
Transcript of Instituto Ayrton Senna Sustainable Inclusive Growth in ... · CÁTEDRA Instituto Ayrton Senna...

CÁTEDRA
Instituto Ayrton Senna
CÁTEDRA
Instituto Ayrton Senna
BrasíliaOctober, 2017
Ricardo Paes de Barros (IAS/Insper), Diana Coutinho (IAS),Marina de Cuffa (IAS/Insper), Samuel Franco (OPE Sociais),
Beatriz Garcia (Insper/IAS), Rosane Mendonça (UFF),Laura Müller Machado (IAS/Insper), Camila Soares (IAS/Insper)
Sustainable Inclusive Growth in Brazil: Past Achievements
and Challenges Ahead

CÁTEDRA
Instituto Ayrton Senna
Achievements1

CÁTEDRA
Instituto Ayrton Senna
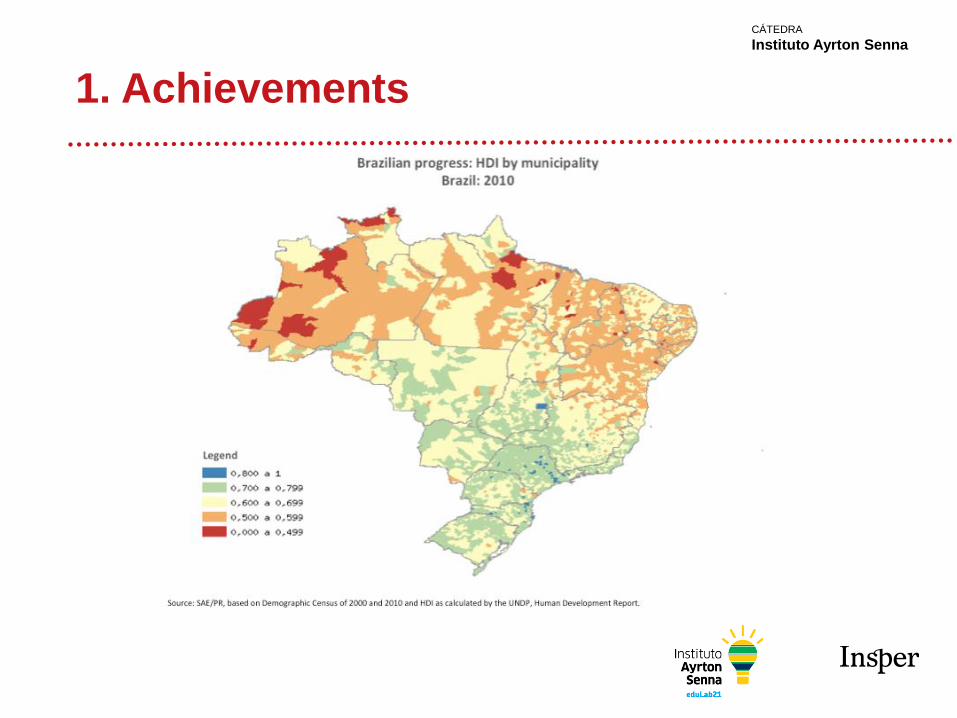
1. Achievements
CÁTEDRA
Instituto Ayrton Senna
1. Achievements

CÁTEDRA
Instituto Ayrton Senna
1. Achievements
0
2
4
6
8
10
12
14
16
18
20
22
24
26
1991 1993 1995 1997 1999 2001 2003 2005 2007 2009 2011 2013 2015
pe
rce
nta
ge o
f th
e p
op
ula
tio
n b
elo
w t
he
ext
rem
e p
ove
rty
line
Evolution of the Extreme Poverty in Brazil
MDG
Reduction in extreme poverty 4 times faster
than required by the MDG
MDG met 10 years in
advance

CÁTEDRA
Instituto Ayrton Senna
1. Achievements
38,7 38,339,4
36,9
34,2
29,7
28,0
25,223,8
20,6
18,017,0
15,3
17,1
10
15
20
25
30
35
40
45
2000 2001 2002 2003 2004 2005 2006 2007 2008 2009 2010 2011 2012 2013 2014 2015 2016
pe
rce
nta
ge o
f th
e p
op
ula
tio
n b
elo
w t
he
po
vert
y lin
e
Evolution of Poverty in Brazil
Reduction in poverty 2,5 faster than required to
reduce to 1/2 in 25 years

CÁTEDRA
Instituto Ayrton Senna
1. Achievements
38,7 38,339,4
36,9
34,2
29,728,0
25,223,8
20,6
18,017,0
15,317,1
38,7 38,7
41,139,5
37,5
34,533,5
31,8 31,1
28,626,7
25,5 24,7
26,9
0
5
10
15
20
25
30
35
40
45
2000 2001 2002 2003 2004 2005 2006 2007 2008 2009 2010 2011 2012 2013 2014 2015 2016
pe
rce
nta
ge o
f th
e p
op
ula
tio
n b
elo
w t
he
po
vert
y lin
e
Evolution of Poverty in Brazil
With reductionin inequality
without reduction in inequality
11,8
21,6
Almost ½ of the reduction in poverty is due to the reduction in inequality

CÁTEDRA
Instituto Ayrton Senna
1. Achievements
0,0%
0,5%
1,0%
1,5%
2,0%
2,5%
3,0%
3,5%
4,0%
4,5%
5,0%
First Second Third Fourth Fifth Sixth Seventh Eigth Ninth Tenth
Average annual growth rate of the labor income per worker by tenths of the income distribution: Brazil, 2001-2015

CÁTEDRA
Instituto Ayrton Senna
1. Achievements
-1,5%
-1,0%
-0,5%
0,0%
0,5%
1,0%
1,5%
2,0%
2,5%
3,0%
3,5%
4,0%
4,5%
5,0%
0 10 20 30 40 50 60 70 80 90 100
ave
rage
an
nu
al g
row
th r
ate
(%
)
percentile of the income distribution
Average annual growth rate of labor income per worker by percentile

CÁTEDRA
Instituto Ayrton Senna
1. Achievements
4,0%
5,0%
6,0%
7,0%
8,0%
9,0%
10,0%
11,0%
12,0%
1000
1100
1200
1300
1400
1500
1600
1700
1800
1994 1995 1996 1997 1998 1999 2000 2001 2002 2003 2004 2005 2006 2007 2008 2009 2010 2011 2012 2013 2014 2015
un
em
plo
yme
nt
rate
Mo
nth
ly a
vera
ge e
arn
ings
(R
$ o
f 2
01
4)
Evolution of the Main Brazilian Labor Market Indicators II
Average Earnings
UnemploymentRate
R$1,731real wage
increase 44%in 10 years
R$1,199
9,0%
unemolyment rate declined almost two
percentage points in 10 years
7,0%

CÁTEDRA
Instituto Ayrton Senna
1. Achievements
36,0
37,5
39,0
40,5
42,0
43,5
45,0
46,5
48,0
49,5
51,0
52,5
54,0
300
350
400
450
500
550
600
650
700
750
800
850
900
1994 1995 1996 1997 1998 1999 2000 2001 2002 2003 2004 2005 2006 2007 2008 2009 2010 2011 2012 2013 2014 2015
pe
rce
nta
ge o
f th
e la
bo
r fo
rce
in t
he
fo
rmal
se
cto
r
Min
imu
m w
age
(R
$ o
f 2
01
5)
Evolution of the Main Brazilian Labor Market Indicators I
Minimum Wage
Degree of Formalization
R$440
R$872real minimum wage doubled
in 20 years
the degreee of formalization increased
10 percentage points 41%
51%

CÁTEDRA
Instituto Ayrton Senna
1. Achievements
Determinantes Brasil 2001 Brasil 2015 Diferencial Contribuição
Renda per capita 52 118 6,0% 100%
Porcentagem de adultos 51% 60% 1,1% 13%
Renda nào derivada do trabalho por adulto 24 85 9,6% 56%
Taxa de ocupação (%) 48% 40% -1,3% -12%
Remuneração do trabalho por ocupado 161 279 4,0% 43%
Fonte: estimado com base na Pesquisa Nacional por Amostra de Domicílios (PNAD).
Determinantes do diferencial da renda per capita do 1º Décimo: Área Total

CÁTEDRA
Instituto Ayrton Senna
1. Achievements
Determinantes Brasil 2001 Brasil 2015 Diferencial Contribuição
Renda per capita 89 187 5,4% 100%
Porcentagem de adultos 54% 63% 1,0% 14%
Renda nào derivada do trabalho por adulto 36 97 7,3% 39%
Taxa de ocupação (%) 52% 44% -1,2% -12%
Remuneração do trabalho por ocupado 246 459 4,5% 60%
Fonte: estimado com base na Pesquisa Nacional por Amostra de Domicílios (PNAD).
Determinantes do diferencial da renda per capita dos 20% mais pobres:
Área Total

CÁTEDRA
Instituto Ayrton Senna
1. Achievements
Determinantes Brasil 2001 Brasil 2015 Diferencial Contribuição
Renda per capita 155 303 4,9% 100%
Porcentagem de adultos 60% 68% 0,9% 15%
Renda nào derivada do trabalho por adulto 56 130 6,2% 34%
Taxa de ocupação (%) 54% 48% -0,9% -11%
Remuneração do trabalho por ocupado 377 662 4,1% 62%
Fonte: estimado com base na Pesquisa Nacional por Amostra de Domicílios (PNAD).
Determinantes do diferencial da renda per capita dos 40% mais pobres:
Área Total

CÁTEDRA
Instituto Ayrton Senna
1. Achievements
Determinantes Brasil 2001 Brasil 2015 Diferencial Contribuição
Renda per capita 754 1057 2,4% 100%
Porcentagem de adultos 71% 79% 0,7% 27%
Renda nào derivada do trabalho por adulto 235 329 2,4% 24%
Taxa de ocupação (%) 60% 58% -0,2% -7%
Remuneração do trabalho por ocupado 1364 1730 1,7% 56%
Fonte: estimado com base na Pesquisa Nacional por Amostra de Domicílios (PNAD).
Determinantes do diferencial da renda per capita: Área Total

CÁTEDRA
Instituto Ayrton Senna
It is possible to sustain this
rate of poverty reduction2

CÁTEDRA
Instituto Ayrton Senna
2. It is possible to sustain this rate of poverty reduction
0,20 0,22 0,24 0,26 0,28 0,30 0,32 0,34 0,36 0,38 0,40 0,42 0,44 0,46 0,48 0,50 0,52 0,54
Denmark
Slovak Republic
Slovenia
Norway
Czech Republic
Iceland
Finland
Belgium
Sweden
Austria
Netherlands
Switzerland
Germany
Hungary
Poland
Luxembourg
Ireland
France
Korea
Australia
Italy
New Zealand
Spain
Estonia
Portugal
Greece
United Kingdom
Israel
United States
Turkey
Mexico
Brazil
Gini Coefficient
Income Inequality in High and Middle Income Countries: 2012
Inequality remains very high

CÁTEDRA
Instituto Ayrton Senna
0
2
4
6
8
10
12
14
16
18
1975 1980 1985 1990 1995 2000 2005 2010 2015
po
rce
nta
gem
da
ren
da
tota
l (%
)
Evolução da porcentagem da renda das famílias apropriada pelos 40% e 50% mais pobres no Brasil
40% mais pobre
50% mais pobre
Evolution of the percentage of the total income going to the poorest 40% and 50% in Brazil
Per
cen
tage
of
tota
l in
com
e (%
)
Bottom 50%
Bottom 40%
2. It is possible to sustain this rate of poverty reduction

CÁTEDRA
Instituto Ayrton Senna
15,0
15,5
16,0
16,5
17,0
17,5
18,0
18,5
19,0
19,5
20,0
2001 2002 2003 2004 2005 2006 2007 2008 2009 2010 2011 2012 2013 2014 2015
pe
rce
nta
ge o
f G
DP
Evolution of the Brazilian Primary Federal Expenditures as a Percentage of GDP: 2002-2014
Federal Primary Expenditures are increasing 0,4 percentage
points per year
Severe Fiscal Imbalance
2. It is possible to sustain this rate of poverty reduction

CÁTEDRA
Instituto Ayrton Senna
0
5
10
15
20
25
30
35
40
45
50
55
60
0 10 20 30 40 50 60 70 80 90 100
Taxa
de
cre
scim
en
to a
nu
al (
%)
porcentagem de países
Distribuição dos países de acordo com o gasto governaental como porcentagem do PIB
Brasil
72%
41%
Distribution of countries according to total government expenditure as a percentage of GDP
Tota
l go
vern
men
t ex
pen
dit
ure
as
per
cen
tage
of
GD
P
Percentage of countries
2. It is possible to sustain this rate of poverty reduction

CÁTEDRA
Instituto Ayrton Senna
0,35
0,36
0,37
0,38
0,39
0,40
0,41
0,42
0,43
0,44
0,45
0,46
0,47
0,48
0,49
0,50
2001 2002 2003 2004 2005 2006 2007 2008 2009 2010 2011 2012 2013 2014
coef
icie
nte
de
Gin
i
Evolução do grau de desigualdade salarial entre os empregados públicos (estatutários) e os empregados com carteira no setor privado: Coeficiente de Gini. 2001-2014
Funcionários públicos estatutários
Empregados com carteira no setor privado
Evolution of the wage inequality among employees in the public and private sectors
Gin
ico
effi
cien
t
Employees in the Public Sector
Employees in the Private Sector
2. It is possible to sustain this rate of poverty reduction

CÁTEDRA
Instituto Ayrton Senna
Required growth and
inequality reduction3

CÁTEDRA
Instituto Ayrton Senna
3. Required growth and inequality reduction
0
2
4
6
8
10
12
14
16
18
20
0 10 20 30 40 50 60 70 80 90 100
po
vert
y le
vel (
%)
Balanced growth (%)
Impact of balanced growth on poverty: Brazil, 2015

CÁTEDRA
Instituto Ayrton Senna
3. Required growth and inequality reduction
Determinantes Brasil 2001 Brasil 2015 Diferencial Contribuição
Renda per capita 754 1057 2,4% 100%
Porcentagem de adultos 71% 79% 0,7% 27%
Renda nào derivada do trabalho por adulto 235 329 2,4% 24%
Taxa de ocupação (%) 60% 58% -0,2% -7%
Remuneração do trabalho por ocupado 1364 1730 1,7% 56%
Fonte: estimado com base na Pesquisa Nacional por Amostra de Domicílios (PNAD).
Determinantes do diferencial da renda per capita: Área Total 17 years

CÁTEDRA
Instituto Ayrton Senna
3. Required growth and inequality reduction
0%
2%
4%
6%
8%
10%
12%
14%
16%
18%
20%
0% 20% 40% 60%
po
vert
y le
vel (
%)
growth in factors determining per capita income
Impact on the level of poverty of increasing the level of factors determining per capita income
proportionof adults
nonlabor income
laborincome

CÁTEDRA
Instituto Ayrton Senna
0
2
4
6
8
10
12
14
16
18
20
0 2 4 6 8 10 12 14 16 18 20
po
vert
y le
vel (
%)
reduction in inequality (%)
Inpact of inequality reduction on poverty: Brazil, 2015
3. Required growth and inequality reduction

CÁTEDRA
Instituto Ayrton Senna
0
1
2
3
4
5
6
7
8
9
10
11
12
13
0 5 10 15 20 25 30 35 40 45 50 55 60 65 70
ine
qu
alit
y re
du
ctio
n (
%)
growth rate (%)
Iso-poverty: combinations of growth and inequality reductions leading to a reduction in poverty to one-half
3. Required growth and inequality reduction

CÁTEDRA
Instituto Ayrton Senna
Better Targeting4

CÁTEDRA
Instituto Ayrton Senna
4. Better Targeting
10%
15%
20%
25%
30%
35%
40%
45%
50%
0% 10% 20% 30% 40% 50% 60% 70% 80% 90% 100% 110% 120% 130% 140% 150%Excl
usi
on
Err
or
(% o
f to
tal p
rogr
am e
xpe
nd
itu
res
targ
ete
d u
sin
g
rep
ort
ed in
com
e)
Inclusion Error (% of total programa expenditures targeted using reported income)
Inclusion and Exclusion Errors Associated with the Current "Bolsa Família" Program Targeting Mechanisms
ReportedIncome
Fixed value for all current beneficiaries
Possibilities using anincome predictor
97%
86%
79%
34%100%
“Bolsa Família” Targeting System based on reported income has
very serious flaws

CÁTEDRA
Instituto Ayrton Senna
0
5
10
15
20
25
30
35
0 5 10 15 20 25 30 35 40 45 50 55 60 65 70 75 80 85
po
rce
nta
gem
da
po
pu
laçã
o a
bai
xo d
a lin
ha
de
po
bre
za (
%)
Evolução da porcentagem da população abaixo da linha de pobreza por faixa etária: Brasil, 2014
Média
2x
6x
Age Profile of the Extreme Poverty Rate
Per
cen
tage
of
the
‘po
pu
lati
on
bel
ow
the
extr
eme
po
vert
y lin
e
Age
Mean
4. Better Targeting

CÁTEDRA
Instituto Ayrton Senna
0
5
10
15
20
25
30
35
40
45
50
55
60
Primeiro Segundo Terceiro Quarto Quinto Sexto Sétimo Oitavo Nono Décimo
Po
rce
nta
gem
de
cri
ança
s d
e a
té 3
an
os
em
cre
che
Evolução da taxa de frequência a creche pública para crianças de 0 a 3 anos, segundo os décimos da distribuição de renda: Brasil, 2015
Fonte: Estimativas produzidas a partir da Pesquisa Nacional por Amostra de Domicílios (PNAD).
Private
Public
Access to Daycare Centers (children up to 3 years old) by tenths of the income distribution: Brazil, 2015
pe
rce
nta
ge o
f ch
ildre
n u
p t
o 3
ye
ars
old
First Second Third Fourth Fifth Sixth Seventh Eighth Ninth Tenth
4. Better Targeting

CÁTEDRA
Instituto Ayrton Senna
0
5
10
15
20
25
30
35
40
45
50
2001 2002 2003 2004 2005 2006 2007 2008 2009 2010 2011 2012 2013
po
rce
nta
gem
de
cri
ança
s d
e a
té 3
an
os
de
idad
e q
ue
fr
eq
ue
nta
m c
rech
es
(%)
Evolução da porcentagem de crianças de até 3 anos de idade frequentando Creches: 2001-2013
10% mais pobres
10% mais ricos
14 p.p.
7 p.p.
Evolution of the access to daycare centers (children up to 3 years old) by tenths of the income distribution: Brazil, 2001-2013
per
cen
tage
of
child
ren
up
to
3 y
ears
old
4. Better Targeting

CÁTEDRA
Instituto Ayrton Senna
Balanced growth of
earnings and
productivity
5

CÁTEDRA
Instituto Ayrton Senna
5. Balanced growth of earnings and productivity
Nota: Renda deflacionada com INPC; PIB com deflator implícito do PIB.Fonte: Renda, Pesquisa Nacional por Amostra de Domicílios (PNAD/IBGE); PIB, Sistema de Contas Nacionais (SCN/IBGE).
80
85
90
95
100
105
110
115
120
125
130
135
140
2001 2002 2003 2004 2005 2006 2007 2008 2009 2010 2011 2012
Crescim
entoacumuladodesde2001
Produ vidadedoTrabalhovs.RendadoTrabalhoBase:2001(sériesreais)
Remuneraçãomédiadotrabalho
PIBportrabalhador
18p.p.
Labor Productivity and Real Labor Income(2001=100)
Acc
um
ula
ted
gro
wth
sin
ce 2
00
1 Real Labor Income
Labor Productivity

CÁTEDRA
Instituto Ayrton Senna
80
85
90
95
100
105
110
115
95 96 97 98 99 100 101 102 103 104 105 106 107 108 109 110 111 112 113 114 115
RemuneraçãodoTrabalho(1996=100)
Produ vidadedoTrabalho(1996=100)
CrescimentodaRemuneraçãodoTrabalhovsCrescimentodaProdu vidadedoTrabalho(1996a2003)
1996
2003
Nota: Produtividade definida como PIB real/trabalhadores; Remuneração deflacionada com INPC; Produtividade com deflator implícito do PIB.Fonte: Remuneração, Pesquisa Nacional por Amostra de Domicílios (PNAD/IBGE); Produtividade, Sistema de Contas Nacionais (SCN/IBGE).
Growth in Labor Productivity and Real Labor Income: 1996 to 2003
Lab
or
Inco
me
(19
96
=10
0)
Labor Productivity (1996=100)
Alignment or misalignment?
5. Balanced growth of earnings and productivity

CÁTEDRA
Instituto Ayrton Senna
80
85
90
95
100
105
110
115
95 96 97 98 99 100 101 102 103 104 105 106 107 108 109 110 111 112 113 114 115
RemuneraçãodoTrabalho(1996=100)
Produ vidadedoTrabalho(1996=100)
CrescimentodaRemuneraçãodoTrabalhovsCrescimentodaProdu vidadedoTrabalho(1996a2003)
1996
2003
2003
Nota: Produtividade definida como PIB real/trabalhadores; Remuneração deflacionada com INPC; Produtividade com deflator implícito do PIB.Fonte: Remuneração, Pesquisa Nacional por Amostra de Domicílios (PNAD/IBGE); Produtividade, Sistema de Contas Nacionais (SCN/IBGE).
Growth in Labor Productivity and Real Labor Income: 1996 to 2011
Lab
or
Inco
me
(19
96
=10
0)
Labor Productivity (1996=100)
Alignment or misalignment? 2011
5. Balanced growth of earnings and productivity

CÁTEDRA
Instituto Ayrton Senna
75
80
85
90
95
100
105
110
115
1996 1997 1998 1999 2000 2001 2002 2003 2004 2005 2006 2007 2008 2009 2010 2011
(19
96
=10
0)
The Evolution of Labor Productivity and Real Average Earnings in Brazil: 1996-2011
Real average labor earnings
Labor average productivity
(GDP per worker)
Imbalance or Alignment Between Labor Productivity and Labor Earnings?
5. Balanced growth of earnings and productivity

CÁTEDRA
Instituto Ayrton Senna
Productive Inclusion6

CÁTEDRA
Instituto Ayrton Senna
6. Productive Inclusion
80
82
84
86
88
90
92
94
96
98
1992 1994 1996 1998 2000 2002 2004 2006 2008 2010 2012 2014
lab
or
forc
e p
arti
cip
atio
n fo
r m
en
ag
ed
25
to
29
ye
ars
old
(%
)
Evolution of the Brazilian labor force participation rate among men aged 25 to 29 years-old, by their educational
level: 1992-2014
Functionally illiterate
5 to 9 years of schooling (complete primary education)
Secondary education
Generating Persistent Poverty? Labor Marker Difficult in Absorbing
Very Low-Skilled Youth

CÁTEDRA
Instituto Ayrton Senna
6. Productive Inclusion
30
35
40
45
50
55
60
65
70
75
2002 2003 2004 2005 2006 2007 2008 2009 2010 2011 2012 2013 2014 2015 2016
turn
ove
r ra
tes
(% o
f th
e la
bo
r fo
rce
pe
r ye
ar)
Evoluton of Turnover Rates among Brazilian Formal Employees: 2003-2015
All workers
Low wage( 2MW) workers
Excess Turnover

CÁTEDRA
Instituto Ayrton Senna
6. Productive Inclusion
0
10
20
30
40
50
60
70
1950 1955 1960 1965 1970 1975 1980 1985 1990 1995 2000 2005 2010 2015
Tho
usa
nd
s U
S$ (
20
05
) p
er
wo
rke
r p
er
year
The Evolution of the Average Labor ProductivitySelected countries: 1950-2011
Japan
Korea
Argentina
Brazil
Chile
China
Source: SAE/PR based on the Penn World Tables. Labor productivity as GDP/worker (Real GDP at constant 2005 national prices).

CÁTEDRA
Instituto Ayrton Senna
6. Productive Inclusion
0
10.000
20.000
30.000
40.000
50.000
60.000
70.000
80.000
0 10.000 20.000 30.000 40.000 50.000 60.000 70.000 80.000
Lab
or
Pro
du
ctiv
ity
in 2
01
1
(US$
(2
00
5)
pe
r ye
ar p
er
wo
rke
r)
Labor Productivity in 1980 (US$ (2005) per year per worker)
Ratio between labor productivity in 1980 and 2011
Brazil
Korea
Source: SAE/PR based on the Penn World Tables. Labor productivity as GDP/worker (Real GDP at constant 2005 national prices).
China

CÁTEDRA
Instituto Ayrton Senna
6. Productive Inclusion
0,0 0,5 1,0 1,5 2,0 2,5 3,0 3,5 4,0 4,5
Uruguai
Brasil
Chile
Bolívia
Paraguai
Colômbia
Venezuela
Suriname
Equador
Peru
Argentina
Taxa anual de crescimento da produtividade média do trabalho na América do Sul (2001-2011)
América do Sul, Brasil excluído
average annual growth rate (%)
Latin America without Brazil
Average annual growth rate in labor productivity: Latin America 2001-2011

CÁTEDRA
Instituto Ayrton Senna
6. Productive Inclusion
-5 -4 -3 -2 -1 0 1 2 3 4 5 6 7 8 9 10
Zimbabwe
Madagascar
Liberia
Comoros
Ivory Coast
Central African Republic
Gabon
Togo
Benin
Guinea
Guinea-Bissau
Burundi
Cameroon
Niger
Swaziland
Senegal
Gambia
Mali
Mauritania
Namibia
Djibouti
Congo - Brazzaville
Kenya
South Africa
Egypt
Botswana
Tunisia
Malawi
Congo - Kinshasa
Cape Verde
Sao Tome and Principe
Burkina Faso
Sudan
Mauritius
Lesotho
Morocco
Zambia
Uganda
Sierra Leone
Tanzania
Ghana
Mozambique
Rwanda
Chad
Ethiopia
Nigeria
Angola
Equatorial Guinea
Taxa anual de crescimento da produtividade média do trabalho na África (2001-2011)
África
Brasil
Average annual growth rate in labor productivity: Africa 2001-2011
average annual growth rate (%)

CÁTEDRA
Instituto Ayrton Senna
Connectivity between
education and
economic activity7

CÁTEDRA
Instituto Ayrton Senna
7. Connectivity between educationand economic activity
8,0
8,5
9,0
9,5
10,0
10,5
11,0
11,5
12,0
2001 2002 2003 2004 2005 2006 2007 2008 2009 2011 2012 2013
gan
ho
pe
rce
ntu
al d
e r
em
un
era
ção
po
r an
o a
dic
ion
al d
e
esc
ola
rid
ade
(%
)
Evolução dos diferencias de remuneração por nível educacional
Evolution of the wage differentials by educational level
Earn
ings
gai
n d
ue
to
on
e ad
dit
ion
al y
ear
of
ed
uca
tio
n (
%)

CÁTEDRA
Instituto Ayrton Senna
7. Connectivity between educationand economic activity
In Chile, over the past 30 years,
productivity growth has been
$ 3,000 per additional year of
workforce schooling.
Ave
rage
La
bo
r P
rod
uctivity –
GD
P p
er
wo
rker
(Th
ou
sa
nd U
S$
(P
PP
) 1
99
0)
Average schooling on adult population (successfully concluded grades)
Evolution of schooling in adult population
and labor production (1980-2010)

CÁTEDRA
Instituto Ayrton Senna
7. Connectivity between educationand economic activity
Ave
rage
La
bo
r P
rod
uctivity –
GD
P p
er
wo
rker
(Th
ou
sa
nd U
S$
(P
PP
) 1
99
0)
Average schooling on adult population (successfully concluded grades)
Type I: Countries where productivity grows $ 3,000 per additional year of workforce schooling
Evolution of schooling in adult population
and labor production (1980-2010)

CÁTEDRA
Instituto Ayrton Senna
7. Connectivity between educationand economic activity
Ave
rage
La
bo
r P
rod
uctivity –
GD
P p
er
wo
rker
(Th
ou
sa
nd U
S$
(P
PP
) 1
99
0)
Average schooling on adult population (successfully concluded grades)
Evolution of schooling in adult population
and labor production (1980-2010)
Type II: Countries where productivity grows $ 4,000 per additional year of workforce schooling

CÁTEDRA
Instituto Ayrton Senna
7. Connectivity between educationand economic activity
Ave
rage
La
bo
r P
rod
uctivity –
GD
P p
er
wo
rker
(Th
ou
sa
nd U
S$
(P
PP
) 1
99
0)
Average schooling on adult population (successfully concluded grades)
Evolution of schooling in adult population
and labor production (1980-2010)
Type III: Countries where productivity grows $ 7,000 per additional year of workforce schooling

CÁTEDRA
Instituto Ayrton Senna
7. Connectivity between educationand economic activity
Ave
rage
La
bo
r P
rod
uctivity –
GD
P p
er
wo
rker
(Th
ou
sa
nd U
S$
(P
PP
) 1
99
0)
Average schooling on adult population (successfully concluded grades)
Evolution of schooling in adult population
and labor production (1980-2010)
Type 0: Countries where productivity doesn’t grow with additional year of workforce schooling

CÁTEDRA
Instituto Ayrton Senna
Over the past 25
years, Brazil has
undergone an
unprecedented
educational
expansion. More
than 90% of the
countries had a
lower progress
in this period
than Brazil.
Fonte: Human Development Data (http://hdr.undp.org/en/data).
7. Connectivity between educationand economic activity
Annual progress of average schooling of the working
age population over the past 25 years by country
Countries distribution
Annualpro
gre
ss
ofavera
ge
shoolin
g(y
ears
ofschoolin
g)

CÁTEDRA
Instituto Ayrton Senna
Fonte: Human Development Data (http://hdr.undp.org/en/data).
7. Connectivity between educationand economic activity
Over the past 25
years, Brazilian
growth has been
slow. Less than
40% of the
countries had
lower economic
growth in that
period than
Brazil.
Annual growth rate of GDP per capita over
the past 25 years by country
Countries distribution
Annualgro
wth
rate
ofG
DP
per
capita (
GD
P/h
abitant)

CÁTEDRA
Instituto Ayrton Senna
In Brazil, growth
in schooling has
not been
accompanied by
significant growth
in labor
productivity.
More than 2/3 of
the countries
have translated
schooling into
productivity
better than
Brazil.
Fonte: Human Development Data (http://hdr.undp.org/en/data).
7. Connectivity between educationand economic activity
Ratio between productivity and schooling
progress over the past 25 years by country
Countries distribution
Ration
betw
een
pro
ductivity
and
schoolin
gpro
gre
ss
(%)

CÁTEDRA
Instituto Ayrton Senna
If Brazil had the
same capacity to
translate
education into
productivity as
either Turkey or
Korea, Brazilian
economic growth
would have been
two to three
times faster than
it was over the
last 25 years.
Fonte: Human Development Data (http://hdr.undp.org/en/data).
7. Connectivity between educationand economic activity
Annual growth rate of GDP per capita over
the past 25 years by country
Countries distribution
Annualgro
wth
rate
ofG
DP
per
capita (
GD
P/h
abitant)

CÁTEDRA
Instituto Ayrton Senna
Ageing8

CÁTEDRA
Instituto Ayrton Senna
8. Ageing
0
2
4
6
8
10
12
14
16
18
20
22
24
26
28
30
32
34
36
38
40
1900 1910 1920 1930 1940 1950 1960 1970 1980 1990 2000 2010 2020 2030 2040 2050 2060
Dis
trib
uiç
ão d
a p
op
ula
ção
(%
)
Evolution of the percentage of old-age population: Brazil, 1990-2060
At least 60 years old
At least 70 years old
Source: SAE/PR based on population records and projections from IBGE
2014

CÁTEDRA
Instituto Ayrton Senna
8. Ageing
0
5
10
15
20
25
30
35
40
45
50
55
60
65
70
1900 1910 1920 1930 1940 1950 1960 1970 1980 1990 2000 2010 2020 2030 2040 2050 2060
pe
rce
nta
ge o
f th
e p
op
ula
tio
n (
%)
Evolution of the Distribution of the Brazilian Population by Age Groups: 1900 to 2060
Under 15 years old
At least 60 years old
Between 15 and 59 years old
2014
Source: SAE/PR based on population records and projections from IBGE
Less than 15 or at least 60 years old

CÁTEDRA
Instituto Ayrton Senna
8. Ageing
Source: Growing old in an older Brazil : implications of population aging on growth, poverty,public finance and service delivery / Michele Gragnolati, et al. Washington D.C.: The World Bank, 2011. p. 12.
Number of years for population 65+ to increase from 7% to 14%
Brazil is aging almost
six times faster than did France
21 years
115 years

CÁTEDRA
Instituto Ayrton Senna
8. Ageing
Ratio between per capita public expenditure with the elderly and the youth: 2010
ratio

CÁTEDRA
Instituto Ayrton Senna
8. Ageing
0
5
10
15
20
25
30
35
0 5 10 15 20 25 30 35 40 45 50 55 60 65 70 75 80 85
po
rce
nta
gem
da
po
pu
laçã
o a
bai
xo d
a lin
ha
de
po
bre
za (
%)
Evolução da porcentagem da população abaixo da linha de pobreza por faixa etária: Brasil, 2014
Média
2x
6x
Age Profile of the Extreme Poverty Rate
Per
cen
tage
of
the
po
pu
lati
on
bel
ow
the
extr
eme
po
vert
y lin
e
Age
Mean
CÁTEDRA
Instituto Ayrton Senna
Discrimination9

CÁTEDRA
Instituto Ayrton Senna
9. Discrimination
0%
5%
10%
15%
20%
25%
30%
35%
40%
45%
50%
55%
60%
1990 1995 2000 2005 2010 2015
Evolution of the percentage of blacks 30 to 34 years old
Total
University
26 p.p
19 p.p
26 p.p

CÁTEDRA
Instituto Ayrton Senna
9. Discrimination
0%
5%
10%
15%
20%
25%
30%
35%
40%
45%
50%
55%
60%
1990 1995 2000 2005 2010 2015
Evolution of the percentage of blacks 30 to 34 years old
Total
UniversityGraduate
26 p.p
19 p.p
26 p.p
4 p.p
14 p.p

CÁTEDRA
Instituto Ayrton Senna
9. Discrimination
0
5
10
15
20
25
30
35
40
45
50
55
2001 2002 2003 2004 2005 2006 2007 2008 2009 2010 2011 2012 2013 2014 2015 2016
po
rcen
tage
m d
a p
op
ula
ção
neg
ra n
o g
rup
o
Evolução da Representatividade da População Negra na População Total e entre os Dentistas
35 p.p.
38 p.p.
População Total
Dentistas
Evolution of the percentage of blacks
Total population
Dentist
Pe
rcen
tage
of
bla
cks

CÁTEDRA
Instituto Ayrton SennaCÁTEDRA
Instituto Ayrton Senna
www.insper.edu.br/catedras/instituto-ayrton-senna/
CÁTEDRA
Instituto Ayrton Senna
Núcleo Ciência para Educação