Institutions and Development: A View from Below
59
Institutions and Development: A View from Below Rohini Pande and Christopher Udry Yale University * November 18, 2005 Abstract In this paper we argue the case for greater exploitation of synergies between research on specific institutions based on micro-data and the big questions posed by the institutions and growth literature. To date, the macroeconomic literature on institutions and growth has largely relied on cross-country regression evidence. This has provided compelling evidence for a causal link between a cluster of ‘good’ institutions and more rapid long run growth. However, an inability to disentangle the effects of specific institutional channels on growth or to understand the impact of institutional change on growth will limit further progress using a cross-country empirical strategy. We suggest two research programs based on micro-data that have significant potential. The first uses policy-induced variation in specific institutions within countries to understand how these institutions influence economic activity. The second exploits the fact that the incentives provided by a given institutional context often vary with individuals’ economic and political status. This can help us better understand how institutional change arises in response to changing economic and demographic pressures. 1 Introduction Recent years have seen a remarkable and exciting revival of interest in the empirical analysis of how a broad set of institutions affects growth. The focus of the recent outpouring of research * We have greatly benefitted from discussions with Daron Acemoglu, Tim Besley and James Robinson. We are grateful to our discussant Orazio Attanasio for comments. Finally, we thank James Fenske and Pinar Keskin for fantastic research assistance. 1
Transcript of Institutions and Development: A View from Below

Institutions and Development: A View from Below
Rohini Pande and Christopher Udry
Yale University∗
November 18, 2005
Abstract
In this paper we argue the case for greater exploitation of synergies between research on
specific institutions based on micro-data and the big questions posed by the institutions and
growth literature. To date, the macroeconomic literature on institutions and growth has
largely relied on cross-country regression evidence. This has provided compelling evidence
for a causal link between a cluster of ‘good’ institutions and more rapid long run growth.
However, an inability to disentangle the effects of specific institutional channels on growth or
to understand the impact of institutional change on growth will limit further progress using
a cross-country empirical strategy. We suggest two research programs based on micro-data
that have significant potential. The first uses policy-induced variation in specific institutions
within countries to understand how these institutions influence economic activity. The second
exploits the fact that the incentives provided by a given institutional context often vary
with individuals’ economic and political status. This can help us better understand how
institutional change arises in response to changing economic and demographic pressures.
1 Introduction
Recent years have seen a remarkable and exciting revival of interest in the empirical analysis of
how a broad set of institutions affects growth. The focus of the recent outpouring of research∗We have greatly benefitted from discussions with Daron Acemoglu, Tim Besley and James Robinson. We are
grateful to our discussant Orazio Attanasio for comments. Finally, we thank James Fenske and Pinar Keskin for
fantastic research assistance.
1

is on exploiting cross-country variation in ‘institutional quality’ to identify whether a causal
effect runs from institutions to growth. These papers conclude that institutional quality is a
significant determinant of a country’s growth performance.
These findings are of fundamental importance for development economists and policy prac-
titioners in that they suggest that institutional quality may cause poor countries and people
to stay poor. However, the economic interpretation and policy implications of these findings
depends on understanding the specific channels through which institutions affect growth, and
the reasons for institutional change or the lack thereof. However, for reasons discussed below, we
argue that the coarseness of cross-country data limits its usefulness for such research. Instead,
we suggest that a more fruitful research agenda is to exploit the synergies between research
based on micro-data and the questions posed by the institutions and growth literature.
North (1981) defines an economic institution as “a set of rules, compliance procedures and
moral and ethical behavioral norms designed to constrain the behavior of individuals in the
interests of maximizing the wealth or utility of principals.” (p.201-202). We adopt his definition
of institutions as sets of rules, procedures or norms that constrain behavior but disagree with
the notion of agency embodied in this definition. Institutions need not be ‘designed’, and even
if they are, their actual operation may be quite different than intended. For this reason, we
emphasize a research agenda on institutions which pays attention to de facto rather than de
jure institutions and one that pays attention to how changes in resource endowments can cause
individuals to change their economic behavior within a given institutional context and potentially
cause the institution itself to change in the longer run. Such a focus is particularly relevant when
thinking about institutions in low income countries – since development, by definition, is about
change.
In section 2 we summarize the main insights from the cross-country literature on institutions
and growth. This literature has successfully focussed attention on the complex interactions be-
tween economic growth and institutional development. It has uncovered important correlations
across countries between growth and the nature and quality of a core set of economic, politi-
cal and social institutions. This literature has also been careful in noting, and accounting for,
the fact that institutions and economic growth jointly cause each other. A positive correlation
between ‘good’ institutions and growth may reflect reverse causation; faster growing countries
2

may have ‘better’ institutions because they can afford them. Faced with the statistical challenge
of isolating causal pathways, authors have been extraordinarily inventive in identifying features
of countries that are plausibly exogenous to the growth process, but that might influence the
character of institutional development and thus might serve as instrumental variables. However,
we argue that this literature has served its purpose and is essentially complete. The number
of variables available as instrumental variables is limited, and their coarseness prevents close
analysis of particular causal mechanisms from institutions to growth. Further, the fact that
instruments tend to be derived from persistent features of a country’s institutional environment
such as its colonial past limits their usefulness for studying institutional change.
This suggests that the research agenda identified by the institutions and growth literature is
best furthered by the analysis of much more micro-data than has typically been the norm in this
literature. In section 3 we describe how policy-induced variation in institutional form within a
country can be exploited to examine how specific institutions influence economic outcomes. An
important advantage of such studies is that information about how such change was implemented
across regions in the country and/or differences in the regional incidence of the policy can very
often be exploited to obtain instruments for specific institutions.
Finally, in section 4 we discuss a different but complimentary research focus – close ex-
aminations of the economic choices of individuals in a specific institutional context. A given
institutional setting can provide a rich variety of incentives to different individuals, depending
upon their economic and political standing. Further, one can potentially also examine institu-
tional change in response to changing factor endowments. We illustrate this research agenda
with an example from Ghana, in which we analyze the effects of a complex land tenure system
on investment incentives, and provide some evidence regarding the historical evolution of that
institution and some indications of how changes in economic environment may cause individuals
to take actions that have the potential to transform the institutional environment.
2 Cross-Country Analysis
In this section we summarize the important recent contributions to the empirical institutions
and growth literature, and then discuss reasons why we believe this literature to be essentially
3

complete. In Table 1 we list five widely cited papers in this literature, which we term ‘Core
Papers’. These are the papers which were the first to use (and often develop) influential insti-
tutional quality measures or instrumental variables to address the endogeneity of institutional
measures. We then describe ‘papers citing core papers’. These are articles which cite at least
one core paper, and are published or forthcoming (that we could identify) in the following jour-
nals: American Economic Review, Econometrica, Journal of Development Economics, Journal
of Economic Growth, Quarterly Journal of Economics, Journal of Political Economy and Review
of Economic Studies. We restrict attention to papers with at least one cross-country regression
which consider a measure of the country’s growth performance (or well-being of the popula-
tion) as the outcome variable of interest and include a measure of institutional quality as an
explanatory variable.1
For each paper, Table 1 describes the outcome variable of interest, the institutional measure,
the instrumental variables used and the paper’s main finding. Typically, we report the estimates
for the most basic specification in the paper.
2.1 Observations
The resurgence of the cross-country literature on institutions and growth is clearly linked to
two factors. The first is the availability of comparable measures of institutional quality for a
large set of countries, and second there is the use of instrumental variable techniques to deal
with the endogeneity of institutions. This is a rich and active literature with much debate
about the suitability of empirical strategies adopted by the different papers, the validity of
their identification assumptions and the relative magnitudes of the effects of different kinds of
institutions on growth outcomes. From Table 1 we pull together some observations about this
literature.
A. Institutions Matter
Almost without exception, the papers listed in Table 1 find a robust positive correlation between
growth outcomes and an array of measures of institutional quality. Looking across countries,1Our focus implies we exclude an important companion literature which examines how institutional quality
affects policy outcomes, such as the size of government.
4

the literature argues that improvements in the quality of contracting institutions, better law
enforcement, increased protection of private property rights, improvements in central govern-
ment bureaucracy, improved operation of formal sector financial markets, increased levels of
democracy, and higher levels of trust are all correlated with higher economic growth.
B. Comparable institution measures are coarse and urban-based
The main focus in this literature has been on using aggregate measures of institutional quality,
and one of the strengths of this literature is the broad range of such measures that it examines.
Many of the papers rely on indicators generated by organizations whose primary purpose is
to provide assessments of the various forms of political risk or of the contractual environment
in countries around the world. These sources (for example, Political Risk Services, Business
Environmental Risk Intelligence, or the Economist Intelligence Unit) have the important advan-
tage of being expressly designed to be comparable across countries. For example, a ‘protection
against expropriation’ score of 7 from Political Risk Services is supposed to mean the same thing
in any country of the world. Most of these measures relate to institutional quality as faced by
businesses and individuals in the more formal urban sector. It is also the case that this litera-
ture, almost by definition, has to treat ‘institutions’ coarsely. The fundamental problem is that
the dimension of the vector of institutions that we believe influences growth is extremely large.
Because some dimensions are unobserved (by nature, or because of data problems) and because
the number of countries is small, regressions never include this whole vector of institutions on
the right hand side.
C. Instruments are rare
There is widespread recognition of the fact that institutional form may be determined by eco-
nomic performance. In Table 1 we see that a very small number of variables have been called
upon to identify the causal effects of the wide range of institutions examined in the literature.
The key instrumental variables have been based on geography (distance from equator and pre-
dicted trade share, oil exporter) and colonial and pre-ccolonial history (settler mortality, legal
origin, ethnic and linguistic composition, precolonial population density, state antiquity). The
paucity of plausible instruments arises from the fact that there are few variables that are im-
5

portant determinants of the current form of a particular economic institution but affect growth
only through that institution.
Another striking feature is that the same variable is often used in different studies as an
instrument for different indices of institutions, and interpreted in varying ways. Consider settler
mortality. It is used to instrument for: (i) protection against expropriation risk; (ii) executive
constraints; (iii) measures of financial depth such as private credit; (iv) a rule of law index; and
(v) the overall index of institutional quality.2
D. Persistent Institutional Effects
The instruments that dominate the literature are based on geography and colonial and pre-
colonial history. These variables exploit long term persistent institutional features of a country.
The IV strategy purges the estimates of the effect of any institutions that change along the path
of development, because these are clearly endogenous to the growth process. This, however,
implies that the IV strategy by design is not able to identify the consequences of institutional
change for growth.
E. IV estimates typically exceed OLS estimates
IV estimates of the institutions growth relationship are always significantly larger than the OLS
estimates. Given that endogeneity concerns would suggest an upward bias in the OLS estimate,
a common interpretation is attenuation bias in the OLS due to measurement error.
2.2 The Limits of Cross-Country Analysis
Based on these observations we now suggest that the general approach of this literature may not
be compatible with further progress on exploring the channels through which institutions affect
economic development, or on understanding how institutional change can affect growth. Some
of our arguments, especially the problems with using measures based on a country’s colonial2Another remarkable fact is that almost all the variables that serve as instruments were introduced in one
of the five core papers as instruments or institutions. Only state antiquity, the oil exporter dummy and the
proportion of postsecondary law students in 1963 have been introduced in the 16 papers that follow. This is a
further indication of the difficulty of finding suitable instruments for endogenous institutions.
6

past to instrument for specific institutions, have already received attention in the institutions
and growth literature; for a very complimentary analysis see Acemoglu (2005).
A. Coarseness of institutional measures and instruments
The cross country literature has largely relied on broad indices of institutional quality. A first
concern is that the construction of these indices requires subjective valuations of what belongs
in the index. Typically, the information that underlies the indices is not fully public, and
reflects the subjective judgements of analysts at the risk assessment organization. For example
Political Risk Services (PRS) constructs the widely-used ICRG measures. The ICRG provides
a number of indicators, most of which rely on a combination of objective information about the
country and subjective assessments of PRS analysts and their research team (moreover, different
papers combine these indicators in different ways). PRS reported to us that to construct the
commonly-used ‘protection against expropriation risk’ index,
“we ‘infer’ the risk involved from the degree of accountability of the government,
the freedom of the judiciary, the level of application of the rule of law, and the level
of apparent corruption” (personal communication 15 July 2005).
We have no reason to doubt the competence or judgement of those who construct the indi-
cators, and indeed, the fact that investors are willing to pay for this information shows that the
indicators are associated with something that investors care about. However, the opacity of
construction of these indicators limits open debate about these judgements. Other measures of
institutional development used in these papers are subject (to greater or lesser degrees) to the
same difficulty.3
A second concern relates to arbitrary choice of weights to combine the underlying sub-
indices (the most common index is an unweighted average of the sub-indices – the notes to
Table 1 describe the construction of the different indices of institutional quality). This makes3These include the BERI index, the Economist Intelligence Unit’s indices of bureaucratic efficiency and insti-
tutional efficiency, the Freedom House democracy index, and (to a much lesser degree) executive constraints and
the index of democracy (from Polity III and Polity IV). Obviously, some measures of institutional development
are not subject to this concern. For example, the index of trust (Knack and Keefer 1997) is based on survey
responses to a specific question; readers can make their own judgement regarding the suitability of the measure.
7

interpreting the estimated impact of institutional quality, and relating this estimated impact to
the true effect of the underlying institutions, problematic. To see this more clearly, consider the
basic model used in this literature
yi = β0 + βxi + υi, (1)
where yi is growth and xi an index of institutional development. Of course there are multiple
control variables but we exclude these for clarity (though their choice and treatment is essential).
In most cases, the literature recognizes that xi is endogenous and relies on a first stage
xi = γ0 + γzi + ξi (2)
for some instrument zi. Again, this might include various control variables, and sometimes it is
placed into a panel data context.
Suppose, however, that the correct model is
yi = β0 + β1x1i + β2x2i + εi (3)
where x1 and x2 are 2 different institutions that matter. Instead of estimating their separate
effect, papers in the cross country literature use an aggregate index of institutional quality, such
as the ICRG index of overall institutional development, defined as
xi = α1x1i + α2x2i (4)
with the weight αk defined by a Political Risk Services analyst. The actual equation estimated
is (1), which is equivalent to imposing the restriction that α1β1 = α2β2. If this restriction is
incorrect, what are we actually estimating?
The instrument z in (2) is related to the underlying xk by
x1i = γ10 + γ1zi + ξ1i
x2i = γ20 + γ2zi + ξ2i
So we have
xi = α1γ10 + α2γ20 + [α1γ1 + α2γ2] zi + α1ξ1i + α2ξ2i. (5)
8

The probability limit of the IV estimator is
plimβIV =β1γ1 + β2γ2
α1γ1 + α2γ2. (6)
Three key problems are readily apparent.
First, our estimate of the effect of institutions on growth depends on the arbitrary weights
αk used to weight the various components of the index of institutional development. Therefore,
βIV cannot estimate a structural feature of the underlying economies.
Second, the coarseness of our measures of institutions implies that we estimate a ‘composite’
effect of multiple institutions on growth. βIV depends on the underlying structural relationship
between specific institutions and growth, but not in a simple fashion. While institutional mea-
sures are correlated, it is clear that the economic interpretation of, say, ‘executive constraints’
and ‘private credit’ differ. We would, therefore, want to distinguish between their effects on
growth. However, our measures of institutions do not permit rich disaggregation.4
Third, even when more disaggregated measures of institutions are available, there is a clear
paucity of plausible instruments that can serve to identify the causal effect of institutions on
growth. There are few variables that are important determinants of the current form of a
particular economic institution and that do not have effects on growth other than through
that institution. Hence, important as these variables might be as determinants of a particular
institution, an IV strategy can rarely isolate the causal pathway. Since these broad underlying
features of an economy (e.g., settler mortality, colonial history, position on the earth’s sphere)
have myriad effects on the institutions and economic organization of a society they are not valid
instruments for any particular institution. Indeed, there is a real danger that the instrument may
have different relationships with the underlying institutions; that is, that γk might have opposite
signs. In this case, the estimated βIV can fall outside the range of the underlying βk. One
4The composite nature of the estimated β is not a consequence of the IV strategy. If υi is uncorrelated with
xi, then the probability limit of the OLS estimator of (1) is
plimβ =α1β1σ
2x1 + α2β2σ
2x2 + (α2β1 + α1β2)σ
2x1x2
α21σ
2x1 + α2
2σ2x2 + 2α1α2σ2
x1x2
.
While this parameter can give a broad-brush picture of the relationship between institutions and growth, it will
be hard to say anything about the relative importance of the components of the composite indicators. If these
components are negatively correlated, then the estimated β may even fall outside the range of [β1, β2]
9
context in which this might happen is where there is a trade-off between the institutions, where
improving one institution might be at the cost of worsening another. This should arise most
commonly when there are negotiation or cost trade-offs in the construction and development of
institutions.
B. Omitted Variables
We noted earlier that, in every case, an IV approach strengthens the positive effect of institu-
tional quality on growth performance. There is no doubt that the measures of institutions are
afflicted by classical measurement error. However, because of the unquestionable ubiquity of
omitted unobserved variables, it is worth considering their effect on the IV estimates as well.
Consider the simplest form of omitted variables bias. Despite the use of very broad indices
of institutions, other institutions are unmeasured and left out of the estimated equation. That
is, (??) is constructed using α1 = 1 and α2 = 0. The probability limit of βIV is now
plimβIV = β1 + β2γ2
γ1. (7)
This leads to an overestimate if the correlations between the instrument and the different insti-
tutions have the same sign. Indeed, since
plimβOLS = β1 + β2ρx1x2
σx2
σx1
, (8)
the IV estimator can have a larger upward bias than the OLS estimator.
Indices of institutions used in the cross-country literature are very strongly biased towards
measuring the institutional environment facing urban, formal sector agents. In some cases
this is explicit: Political Risk Services attempts to gauge the “risk of expropriation of foreign
private investment by government.” Other measures focus strongly on de jure procedures that
may or may not govern actual behavior. The ‘index of legal formalism’ measures the number
of formal legal procedures needed for collecting on a bounced check. Some might argue that
the institutions facing agents in the formal sector are the most salient for the overall growth
prospects of a country. However, the possibility that the de facto environment within which
the majority of the population lives is at least as relevant suggests that omitted variable bias
can be serious.
10

C. Heterogenous Treatment Effects
A different concern relates to within country heterogeneity in the characteristics and operation
of particular institutions.5 For instance, any measure of ‘trust’ will vary across communities and
individuals within communities. Mechanisms of contract enforcement take very different forms
for rural and urban entrepreneurs. The institutional framework within which corruption occurs
is likely to operate very differently for multinational corporations and small-scale traders.
More formally, significant differences across and within countries in individual responses to
institutions can significantly affect the appropriateness of using an IV strategy (Imbens and
Angrist (1994), Heckman and Vytlacil (2000) and Manning (2004)). IV estimates capture the
impact of the institutional variable on the growth outcomes of those countries in which the
institutional outcome is sensitive to the value of the instrumental variables. The interpretation
of the IV estimate as the average of the effect of the institution on growth depends on special
assumptions on the way that countries respond to the institution and way that the institution
responds to the instrument. A simple version of the model is
yi = β0 + β1iIi + εi (9)
and we have available an instrument
Ii = γ0 + γ1izi + υi. (10)
In this case both stages of the IV are characterized by heterogeneous effects. We know that
(after we make the helpful assumptions that β1i and γ1i are independent of εi, υi and zi, that
E(γ1i) 6= 0 and that E(υi|zi) = E(εi|zi) = 0):
βIV1 →p E(β1iγ1i)
E(γ1i). (11)
If β1i and γ1i are independent of each other, then βIV1 →p E(β1i), which may be what we want.
However, consider the following plausible form of heterogeneity. Suppose β1i = β1 +β2xi, where
xi is some unobserved omitted variable that influences the effect of the institution on growth.
We normalize xi to have mean zero. For example, suppose xi is some unobserved dimension of5Brown and Guinnane (2005) discuss the deleterious consequences of analysis that obscures internal hetero-
geneity in the well-known European Fertility Project.
11

precolonial history (such as the security of land tenure) that changes the effect of formal credit
market expansion on growth. To fix ideas, β2 > 0 – better tenure security increases the effect
of credit markets on growth.
At the same time, of course, γ1i = γ1 +γ2xi, because the same omitted feature will influence
the degree to which current institutions (Ii) depend on our observed instrument (say, settler
mortality). If γ2 is also positive, the IV estimator will exceed the true causal effect. Specifically,
βIV1 → p E(β1iγ1i)
E(γ1i)=
E(β1 + β2xi)(γ1 + γ2xi)E(γ1 + γ2xi)
=β1γ1 + β2γ2var(x)
γ1= β1 +
β2γ2var(x)γ1
> β1 = E(βi)
This simple example suggests that IV estimation techniques in the presence of hetereogeneity
in institutional form within a single country can cause the IV to overestimate the true effect.
Below, we use the example of land law in Africa to demonstrate that such within-country
heterogeneity is commonplace in many low income countries.
2.3 The Limitations in Practice
We now examine two particular instances which illustrate the empirical relevance of these limi-
tations of the cross-country methodology that has dominated this literature.
A. Institutions and Poverty
The typical institutions regression has GDP per capita as the dependent variable. As develop-
ment economists, however, we should be at least as interested in the determinants of poverty.
What can we learn by replacing GDP with a poverty measure, the head count ratio, in this
canonical regression?
There is reason for some skepticism. As institutional measures tend to focus on the urban
and formal sector, we would expect them to have less impact when we consider poverty, which
depends particularly strongly on features of the rural and informal economy.
Table 2 reports these regressions. Our measure of institutional quality is ‘Protection against
Expropriation Risk’ and we use log settler mortality as the instrument. Following Acemoglu,
Johnson, and Robinson (2001) we start with the sample of 64 ex-colonies with settler mortality
12

data. We have poverty data for 43 of these countries. Our poverty measure is the head-
count ratio, defined as the percentage of the population living in households with consumption
or income per per person below the global poverty line, defined as one dollar per day (Source:
PovCal Net, World Bank). We use the median head-count ratio value, over 1981-2001 (typically,
this ratio is reported at three year intervals). We also report results where we include the four
OECD countries which were ex-colonies and set their headcount ratio to zero.
Panel A provides OLS results. We observe a strong and significant negative correlation
between protection against expropriation risk and the headcount ratio. A one standard deviation
increase in institutional quality reduces the percentage population that is poor by 10% in our
base specification. This estimate is relatively unchanged by the inclusion of a geography control
and continent dummies. Panel B provides 2SLS estimates, and Panel C the corresponding first
stage regression. Excluding controls, the 2SLS estimate is twice the size of the OLS (column
(1)) while with controls the 2SLS estimate is four times the size of the OLS estimate (column
(3)). If we were to take the column (3) estimate seriously it would suggest that a one standard
deviation increase in institutional quality would move the country from the 75th to the 25th
percentile of the distribution of the headcount ratio. This is a much more dramatic effect than
is observed in the corresponding growth regression, where a one standard deviation increase
in protection against expropriation leads to a 2.7-fold increase in income, which corresponds
approximately to a move from the 25th to the 50th percentile of the distribution of income per
capita. It is very likely that settler mortality is correlated with other, unobserved, features of the
rural environment that are much more important for poverty outcomes than the protection that
foreign investors have against expropriation by the central government. These same omitted
features of the rural environment may also be associated with a stronger treatment effect of the
effect of improved security of formal property rights on rural poverty. In both instances, the
IV estimator will overestimate the effect of these institutions on poverty.
B. Land Law
Aggregate formal sector based indices of institutional quality are unlikely to capture institutional
quality as faced by the average person in developing countries. Further, heterogenous treatment
effects may be a real concern in developing countries where social and ethnic networks remain
13

an important constraint on individual decision-making.
To illustrate these concerns we describe property rights in land in four African countries.
We choose the best and worst performing African countries according to the expropriation risk
index used by Acemoglu, Johnson, and Robinson (2001). These are Gambia and the Democratic
Republic of Congo (formerly Zaire, henceforth DRC). In addition we choose Ghana, a country
we study in more detail below, and its neighbor Cote’d Ivoire. These two countries offer an
interesting contrast of neighboring countries which were ruled by different colonial powers. The
legal origins variable codes Ghana and Gambia as having English law, and DRC and Cote’d
Ivoire as having French Law. Table 3 describes property rights in land for these four countries.
(i) De Jure and De Facto Land Rights: The Importance of ‘Customary’ Law
Measures of ‘institutions’ in the cross-country literature are typically based on either formal rules
and procedures or perceptions of those working in the urban business sector. It is immediate from
Table 3 that what matters for rural land rights is the country’s community-based mechanisms as
exemplified by customary law. The use of almost all land in these four countries is governed by
customary tenure arrangements, not formal sector rules. The influence, if any, of the formal legal
system introduced by colonial powers on land rights as experienced by households is indirect.
This is not to say that an analysis of de jure rights is uninteresting: such an analysis is
essential for understanding the importance of changing formal laws regarding property, and
such changes may an important instrument for policy. However, it is clear that any exercise
examining the effect on economic activity of property rights as they are actually experienced by
agents cannot restrict attention to the de jure legal system.
We observe a stark contrast between de jure and de facto property rights in these countries.
French authorities typically did not recognize land ownership by traditional chiefs. In contrast,
in colonies without significant white settlement, the British policy of indirect rule included (the
colonists’ interpretation of) customary land tenure rules. In terms of de jure laws, our Table
suggests this is reflected in a more limited recognition of customary law in French colonized
countries (DRC and Cote’d Ivoire). However, there is no close correspondence between ‘legal
origins’ and de facto land tenure rights in these four countries. In the French colonized countries
war seems to have played a more important role in defining the security of property rights.
14

Further, a central tenet of customary law that, for most part, individuals cannot sell land on
which they have user rights, remains relevant in the rural sector of all countries, save Cote’d
Ivoire (for Gambia, see Freudenberger (2000), for Ghana, see of Lands and Forestry (2003), and
for DRC, Moyroud and Katunga (2002)).
Equally, there is no clear relationship between ‘average protection against expropriation’
and the likelihood that a cultivator is confident of his or her control over land. While Gambia
is a clear outlier in this group of four, categorized as having much higher protection against
expropriation, use rights in some areas of the Gambia are less well-established than those in
much of Ghana (in particular, use rights are very secure in Ghana’s cocoa-producing areas).
Protection against expropriation in the DRC is rated as extremely poor relative to that in Cote
d’Ivoire, but tenure security seems to be quite similar in areas of both countries less affected by
their respective wars.
(ii) Land Rights are Heterogeneous Within Countries
Customary law has nearly full legal recognition in Gambia (Freudenberger 2000), and none in
the DRC (Leisz 1998). In Ghana and Cote d’Ivoire it has only partial recognition. Further,
the complexity of de facto land rights hinders the interpretation of “secure property rights”.
Customary law tends to view land and resources as inalienable, such that property rights cannot
be wholly ceded by those to whom the land has been allocated (Bruce and Migot-Adholla 1994b).
As a consequence, in none of the countries included in Table 3 is anything approaching freehold
tenure common in agriculture. In Cote d’Ivoire, land sales are generally permitted by customary
law(Kone 2002), which could appear to be an indication of more secure tenure than exists in
most of Ghana. However, usufruct rights are generally secure in most of Ghana while the land
is under cultivation (even including tree crops) (Amanor 1999), while the usufruct rights of the
large population of non-Ivoirian migrants in Cote d’Ivoire are very insecure (Chauveau 2000).
Apparently, property rights over land are more secure in Ghana than in Cote d’Ivoire for some
individuals, while for others the opposite is true. Within any of the countries listed in the table
there is a distribution of tenure security; clearly, the usefulness of summarizing that distribution
with a single index is sensitive to the context and the economic model.
Further, the same piece of land can be subject to multiple claims which relate to the ways
15

in which it is used by separate groups and individuals at different levels. For example, one
individual may have the right to cultivate annual crops on a plot, while another retains rights
to the tree crops that exist on the same land. An elder might have the right to allocate a plot
to a family member for temporary use, but not the right to rent the plot to an outsider on a
commercial basis. Property rights are typically multidimensional and collapsing this down to a
single index might be misleading in important ways.
(iii) Political and Contractual Institutions are Intertwined
A common distinction in the cross country institutions literature has been between political in-
stitutions (as measured by, say, expropriation risk), and institutions which determine contractual
form (as measured by, say, legal origins). However, the real world is much more complicated,
and, in particular, this distinction is treacherous when considering land rights in Africa. In-
digenous tenure principles are implemented and arbitrated by authorities (chiefs, lineage heads,
elders) whose legitimacy is typically drawn from a local political process. Their authority over
land allocation is political power, since it enables them to give or refuse a farmer the right to
cultivate or to settle. ”By allowing or forbidding newcomers to settle and by fitting them,
from the outset, within a network of alliances, the land chief regulates the process where a local
community is constituted” (Raynaut 1997, 289-290).
Specific property rights as experienced by farmers often depend on both how political office
is allocated and the land allocation powers given to the politician (Udry and Goldstein 2004).
Thus, political and contractual institutions seem to be fundamentally intertwined for land tenure
processes in Africa. Importantly, the nature of such intertwining varies significantly across
countries. This again suggests heterogeneity in the effect of institutions across countries.
The extraordinary diversity of institutional practices across and within countries places nat-
ural constraints on the usefulness of cross-country analyses for understanding the specific chan-
nels through which institutions affect economic outcomes, and how these institutions, in turn,
respond to economic, demographic, political and social forces.
16

3 Within-Country Institutional Variation
Recent years have seen an explosion in empirical research in development economics. One
of the most fruitful areas of research has been program evaluations in developing countries
– these typically combine household or regional level data with detailed information on the
implementation of a particular institution or policy in the country to estimate its economic
impact. In this section we discuss how this line of research can both compliment and advance
the research agenda suggested by the institutions and growth literature.
Table 4 lists some recent papers which study potential within-country counterparts of the
main institutions studied in the cross-country literature.6 While our literature review is non-
exhaustive, it is clear from the Table that many synergies exist between the cross-country and
within-country literatures.
Relative to cross-country analyses, an important advantage of within-country studies is the
relative homogeneity of the institutional and constitutional setting across the units of analysis.
This potentially helps disentangle the economic impact of institutions from unobserved hetero-
geneity across the units of analysis. In addition, concerns of heterogenous treatment effects
may be more limited in the context of a single country. Finally, and we would argue most
importantly, the scope for identifying credible instruments for particular institutions is much
greater in the case of within-country studies. The reason is that institutional change is typically
implemented at the country (or sub-country) level. This opens up the possibility of exploiting
specific features of how institutional change was implemented across regions in a country or
across different population groups to obtain instruments for the institutional variable of inter-
est. In contrast, both the choice and implementation of public policies varies significantly across
countries. Hence, using any single country’s experience with institutional change to identify
instruments for a cross-country analysis will typically not yield an instrument with sufficient6We restricted attention to the journals considered in the cross-country literature review and did a Google
scholar search where the keywords were institutions and development. We also manually reviewed the issues of
American Economic Review, Quarterly Journal of Economics and Journal of Political Economy for 2002-2004.
Given this set of papers, we then used our judgement to identify papers which provide a within-country counterpart
to the main institutions covered in the cross-country review. In a couple of cases, we have augmented the list
with recent unpublished papers.
17

power across a large number of countries. Hence, the reliance on relatively crude instruments
such as settler mortality.
As is apparent from Table 4, a common approach is to use panel data which spans years
both before and after the policy change and to exploit cross-sectional variation in the extent of
institutional change. Such variation may arise due to timing differences in policy implementation
across different regions within the country, or because the extent of institutional change was
explicitly related to underlying economic features of the regions. The canonical regression in
this literature is of the form
Yst = αs + βt + γIst + εst
where s denotes regions within a country and t time. Yst is the outcome of interest and Ist
the relevant institution. The inclusion of regional fixed effects (αs) accounts for permanent
differences between regions and time fixed effects (βt) for shocks which affects all regions. This
regression specification can not, in itself, allay the concern that the institutional variable and
the economic outcome of interest are both affected by some omitted time-varying region-specific
variable. That is, E(Ist, εst) 6= 0 (Besley and Case 2003). One may also be concerned about
the external validity of such a study – a study which focuses on institutional change within a
country may not be informative of the true average effect of the institution (that country may,
for instance, be much poorer than the average country in the world).
To assess whether within-country studies can address these concerns we focus in on the lit-
erature on a single institution – private land rights. Table 5 provides a non-exhaustive summary
of papers analyzing the economic impact of land titling and registration, organized by country.7
To identify the economic impact of land titling it is common to exploit the passage of land titling
or registration programs which take land claims out of the realm of informal lineage, commu-
nity land ownership or informal ‘squatter’ rights and making them legal, formal and individual
(Binswanger, Deninger, and Feder 1995)
These studies span numerous countries and a multitude of different economic settings. Thus,
while the external validity of any single study may have limits it is certainly possible to compare7In selecting papers for this Table our aim was to show the richness of country experiences with land titling
programs.
18
across studies in different regions to identify generalizable lessons. Looking across the studies
suggests the following findings:
• Land titling and registration typically increase agricultural productivity and farm invest-
ment. However, the extent of this increase depends upon the details of the titling program
and the pre-existing land tenure system.
• There is a weaker, but usually positive, effect on credit. The impact of titling on credit is
very limited in situations with less developed credit markets.
• There is some evidence that land value rises, but this remains very preliminary.
It is clear that endogenous uptake of land titles presents a serious concern for empirical
evaluations, and that not all papers address this concern adequately. However, the potential
for using the institutional details of the land titling intervention to identify credible instruments
for exposure to land titling far exceeds that available in the context of a cross-country study.
A good example is Field (2003a) who analyzes the value to a squatter household in Peru of
increases in tenure security associated with obtaining a property title as measured by his/her
labor supply response. A national titling program in Peru issued formal property titles over a
five-year period to more than 1.2 million urban households. Field uses two sources of variation
in program influence to isolate the effect of titling: neighborhood program timing and program
impact based on prior household ownership status. In particular, staggered regional program
timing enables a comparison of households in neighborhoods already reached by the program
with households in neighborhoods not yet reached. She combines these facts with data on past
and future title recipients (collected half way through the titling program) to identify a natural
set of comparison groups composed of treated and yet-to-be-treated households. A comparison
of the labor supply behavior of these two sets of households can be interpreted as reflecting
the causal effect of land titling. Similar empirical methods are used by Banerjee, Gertler, and
Ghatak (2002) in the context of India and Do and Iyer in the context of Vietnam. The absence
of a unifying institutional environment implies that such studies could not be undertaken at the
cross-country level.
Finally, the fact that the economic effect of land titles depends on the existence of compli-
mentary institutions, the details of the titling program and the pre-existing land tenure system
19

points to the importance of accounting for heterogenous effects. It would appear that an im-
portant and relatively unexplored area for research is to use within-country studies to better
understand the source of such heterogeneity. 8
4 Within Institution Variation: Insecure Property Rights in
Ghana
A given institution can provide a variety of incentives to different individuals, depending on their
endowments. This makes it possible to use data on the behavior of individuals within a given
institutional setting to explore the consequences of an institution for behavior, and potentially
of changing factor endowments for institutional form. In this section we use household survey
data from Ghana to provide one example of such research.
Over 60 percent of the Ghanaian population is in the agricultural sector, and land distribution
is mostly governed by customary law. Under customary law, land is often regarded as a common
asset and resource. Individual ownership is recognized for standing crops, but not for the soil
itself. Rather, ultimate title over land is vested in corporate groups, in particular in the lineage,
and individuals gain access to land via membership in such groups. There are multiple potential
claimants to any particular plot; competing claims are negotiated and certain members of the
community are recognized as having the power to arbitrate such conflicts. Land rights in the
study area are complex, ambiguous and highly negotiable (Udry and Goldstein 2004). Given
this, we examine how micro-data can be used to understand the implications of this land tenure
system for investment and agricultural productivity. Further, we explore whether changing
factor endowments in Ghana have affected the cost of having insecure property rights, and the
responses of political actors and citizens.
4.1 The Investment and Productivity effects of Land Rights
Our data comes from a two year rural survey in the Akwapim South District of the East-
ern Region of Ghana conducted by Goldstein and Udry (for survey description and data, see8We also note that the equity effects of titling remain very controversial; so far, there has been little research
that effectively identifies the long run relationship between titling and the distributions of wealth and income.
20

www.econ.yale.edu/˜cru2/ghanadata.html).
The main farming system is an intercropped mixture of maize and cassava, which is culti-
vated for both home consumption and sale through a well-developed marketing system. Land
productivity is managed primarily through fallowing; cultivation is periodically stopped in order
for nutrients to be restored and for weeds and other pests to be controlled. An element of the
land tenure system that plays a key role in the evolution of its agricultural economy is that
cultivators have historically had very secure rights over their growing crops (both tree crops and
annual crops). Wilks summarizes the principle as “afuo mu yε deε, asase yε ohene deε” (“the
farm is my property, the land is the stool’s”).
However, the lineage leadership may reallocate fallow land to other members of the lineage.
The details of this allocation process are unique to the local context, but many of its broad
features arise frequently in African (particularly West African) land tenure systems. 9 In our
study area land is held by the abusua, which is defined by matrilineal descent, on the authority
of the paramount chief (or stool). The leadership of the matrilineage is locally-based and is
responsible for allocating use rights within a village to members of the matrilineage.10 The
allocation of land within the matrilineage is rooted in local politics and social relations.11
Land allocation is, thus, a political process that operates at the level of the local matrilineage.
Cultivators on the margins of local political power – those who hold no form of local political
office – are less confident of their rights over land than those who have local political office.
Table 6 presents evidence of this difference in confidence.12
(Udry and Goldstein 2004) use these survey data to establish that insecurity of land tenure
is associated with lower investment in land and hence reduced agricultural production. Table
7 summarizes the main consequences of this difference in tenure security for fallowing behavior
and hence for output. Conditional on observed characteristics of the plot, office holders leave
plots fallow for approximately 2 years longer than non-officeholders, and each additional year9Fred-Mensah (1996); Biebuyck (1963);Bruce and Migot-Adholla (1994a); Binswanger, Deininger, and Feder
(1995); Bassett (1993); Peters (1994) and Bruce and Migot-Adholla (1994a)Bromley (1989)10In our sample leaders tend to be male and older than other members of our sample, but no more likely to be
educated.11(Berry 2001, 145)12There is a wide variety of local political offices held by individuals in our sample. Typical offices include
lineage or village head or elder.
21

of fallowing is associated with an increase in plot profits per-hectare of over 300 thousand cedis
(compare this magnitude with the mean gross output per hectare of about 1.2 million cedis, or to
per-capita GDP of approximately 700 thousand cedis). (Udry and Goldstein 2004) estimate the
magnitude of the loss associated with this inefficient fallowing to be approximately one-third
of output.13 Some plots are obtained through commercial transactions (about half through
fixed-rent contracts, and half through sharecropping), rather than through the allocation of
matrilineage land. If we look (in column (3)) at fallow duration by form of land allocation
we observe that commercially-obtained plots are fallowed for longer (slightly over half a year).
Further, office holders and non-office holders exhibit similar behavior on commercial plots. In
column (4) we continue to observe increased fallowing of commercial plots when we compare
across different plots cultivated by an individual farmer.
4.2 The Evolution of Land Rights
The insecurity of land tenure in this farming system is associated with a very large cost of lost
output. Why, then, did it emerge and does it persist?
A. Background
The abusua-based land tenure system in southern Ghana emerged before the 19th century, as
part of a political system in which political power flowed through the matrilineage.14 During13See (Udry and Goldstein 2004) for full details of the econometric procedures. These estimates are all
conditional on household*year fixed effects (except column 4, which uses finer individual fixed effects) because
imperfect factor markets in these villages imply variation across households in the shadow costs of factors of
production. Each also includes spatial fixed effects (with neighborhoods defined as a distance of 250 meters) to
better account for unobserved variation in land characteristics. Estimates are also conditional on a set of plot
characteristics including deciles of plot area, and indicators of soil type, and toposequence. The magnitude of the
production loss is based on estimates of a concave production function specified as πit = Xipβ+g(dit)+λhip,t+εipt,
where Xit includes the control variables listed above, λ is the household*year fixed effect, and dit is the fallow
duration on plot i. g (d) is specified as g(dit) =
{α ln(dit + γ)− α
7+γdit for dit ≤ 7
α ln(7 + γ)− α7+γ
7 for dit > 7where the 2nd term
ensures that the derivative of the function is 0 at dit = 7, because of evidence in the soil science literature from this
region that fallow periods longer than 7 years are unlikely to have further positive effects on farm productivity.14“The elementary level of political organization in precolonial Asante ... was the matrilineage (abusua, pl.
mmusua). It was through membership of an abusua that free (non-slave) Asantes were integrated into the polity.
22

this period, and even into the early 20th century, “land for cultivation was abundant in the
strict sense that the marginal product of land must have been zero. ...[F]rom what is known of
the soils, crop repertoire and farming techniques, fallows were long enough for full restoration
of soil fertility.” (Austin 2004, p. 64.). Even in the most densely-populated areas of southern
Ghana (near Kumasi, the capital of the Asante state), population densities were under 30
people per square kilometer, permitting average fallow periods of over a decade. The role of
the matrilineage leadership was to secure the rights of cultivators to cultivated plots. This they
did; while cultivators could have no expectation of re-establishing cultivation on a fallowed plot,
the investment of labor in clearing and cultivating a plot ensured that the farmer would retain
control over the plot until it was fallowed.
The early years of the 20th century saw southern Ghana become the world’s largest grower
of cocoa (Hill 1963). Between 1910 and 1940, thousands of people made substantial long-
term investments in cocoa trees, which began to reach maturity after 5 − 7 years, and could
continue to produce for decades. These investments were facilitated by a fortuitous concurrence
between the land tenure system and the agronomic characteristics of cocoa. The security of
an individual’s rights over a cultivated plot was long-established, and was reinforced during
the early 20th century by both the newly-established British colonial government and by the
Councils of Chiefs. Once planted, cocoa often stood on a plot for decades. While it stood, the
cultivator’s rights to use, rent, or mortgage the plot were secure.15
Over the 20th century, the first signs of the elimination of land abundance began to emerge.
Fallow periods for land not under cocoa cultivation began to decline, and disputes between matri-
lineages or between chiefs over the boundaries of their land became more common (Firmin-Sellers
1996)(Berry 2001). While these disputes engaged higher-level political actors, the usufruct rights
of cultivators were protected; “farmers kept their farms even when their chief had been defeated
in litigation over the ownership of the land” (Austin 2004, p. 277).
As long as cocoa remained the foundation of the rural agrarian economy, neither the colonial
state nor the immediate post-independence government proceeded with any formal effort to
privatize or title rural land. There were three crucial reasons for this. First, both chiefs and
The matrilineage head owed allegiance to a sub-chief.” (Austin 2004, p. 35).15(Austin 2004, p. 269).
23

government officials expressed fear that a consequence of titling would be the establishment of a
landless class. Whatever inefficiencies might be associated with the complex and ambiguous land
tenure system existing in Ghana, the principle that all members of a local corporate group are
entitled to cultivate land ensured that no substantial disenfranchised group of landless persons
ever emerged. Second, the effort would involve substantial administrative costs. Third and
most important, there was no apparent need for privatization. “It is evident that the land
tenure system[s], both in the Gold Coast Colony and in Asante, offered cocoa farmers what
they regarded as sufficient security of tenure to make very widespread long-term investments”
(Firmin-Sellers 1996, p. 346).
However, by the 1970s, the cocoa economy was in full-fledged collapse, due primarily to
extraordinarily high rates of explicit and implicit taxation of exports (Aryeetey, Harrigan, and
Nissanke (2000)Bates (1981)). Farmers across Ghana exited cocoa production and increased
production of food crops. At the same time, land scarcity was becoming increasingly evident.
As cultivation switched from a tree crop to annual food crops, the key to maintaining soil
fertility and hence productivity became sufficient fallowing. Therefore, the insecurity of rights
over fallowed land was beginning to have important costs. During this period, however, the
administrative structure of the Ghanaian state itself was near collapse(Aryeetey, Harrigan, and
Nissanke 2000). The national government simply did not have the capacity for a significant
land titling program, and thus focused its few resources on registering urban land16.
The inability of the national government to implement a titling program that would resolve
the ambiguities of the land tenure system is apparent, but the lack of a local solution to the
inefficiencies uncovered above is more puzzling. In our study area, the transition from cocoa to
the intercropped mixture of maize and cassava occurred much earlier than in most of Ghana.
Although Akwapim was the first location in Ghana to adopt cocoa on a large scale at the
start of the 20th century, it is not particularly well-suited for cocoa cultivation. By the 1940s,
a devastating outbreak of swollen shoot disease had led to the breakdown of the local cocoa
farming system, and maize and cassava production for sale to local urban markets became the
mainstay of local agriculture.16There are formal procedures for land registration, defined in the 1986 Land Title Registration Law (PNDCL
152), but these are virtually never used outside urban areas.
24

Insecure Land Tenure as a form of Social Security
It is clear that understanding the persistence of this land tenure regime requires an understanding
of the local political economy under which it exists, and of the role that this land tenure system
serves beyond its effect on investment incentives. Historically, an important source of resistance
to titling has been the fear that landlessness would result. An important rationale for the
allocation of land use rights via membership in the matrilineage is redistribution. Limited
access to credit markets remains pervasive in rural Ghana, and so land redistribution is seen as
essential to preventing long term poverty
An important mandate of local political leaders is to prevent landlessness. The flexible land
tenure system has successfully prevented the emergence of a landless class.17 Given imper-
fections in other factor markets, the efficiency gain from equalizing land ownership per capita
across households can potentially offset some of the loss associated with reduced fallowing due
to insecurity of tenure rights. Lack of panel data that tracks households over very long periods
prevents us from directly examining the degree to which land is reallocated in response to demo-
graphic shocks. However, detailed data on the demographic composition of households suggests
that the magnitude of demographic shocks is not large enough to make this an efficient mech-
anism. Nevertheless, it is clear that there are gains associated with this kind of redistribution
in response to demographic shocks, and perhaps a more diffuse gain associated with the lack of
any landless class.
In the cross-section, we see little correlation between allocations of matrilineage land and
the demographic composition of households. The only strong correlations we find are that
households with older and more politically-powerful heads have more land. There is little evi-
dence of important differences in living standards as household demographics change; per-capita
expenditures decline weakly with household size and strongly with the ratio of children in the
household.
In informal conversation, people in the study area claim that the allocation of land by the
abusua leadership is driven at least in part by one’s ‘need’. Any member of the abusua who
needs land is entitled to some for cultivation. The determination of “need”, not surprisingly, is17Only two households in our sample have no land; in both cases the husband has an office job and the wife is
a trader.
25

often contentious. The claim was made by several of our respondents that the act of leaving a
plot fallow would demonstrate a lack of sufficient need, and therefore cast doubt on one’s right
to the plot. If this claim is true, then it must be the case that ‘need’ is private information, and
that the extent of one’s need can be signalled by choices with respect to fallowing.
It is apparent that there is far from complete information about individuals’ resources in
rural Ghana. Most adults in rural Ghana engage in non-farm activities to complement their
direct income from agriculture. In our sample, 65 percent of adults and almost 80 percent
of women earn income from non-farm activities. Small-scale trading is the dominant activity
of this type. Information regarding the income that is generated from non-farm activities is
closely-held; even spouses are unlikely to know the details of one’s incomes and expenditures from
nonfarm enterprises (Goldstein 2000, chapter 1). Therefore, we assume that the matrilineage
leadership cannot observe directly the extent of an individual’s ‘need’ for additional land.
The abusua leader seeks to keep matrilineage land for his own personal or commercial use,
while meeting his obligation to provide land to matrilineage members who have high need for
that land. These are individuals have particularly low return off-farm opportunities – the poor.
Failure by the leadership to allocate land to a sufficiently high proportion of the poor exposes
the leaders to political penalties in the future. Hence, the leader seeks to allocate land to as
many of the poor as possible, while keeping it out of the hands of the rich. We are motivated in
this assumption by the observation that chieftaincy disputes, and disputes between villagers and
abusua leaders, often center around perceived misallocation of abusua land by the leadership (
(Berry 2001, chapter 2); Benneh (1988)).
We hypothesize that the leadership uses a cultivation requirement to construct an incentive-
compatible mechanism that separates (most of) the poor from (most of) the rich. The leadership
offers land to those who will cultivate it without leaving it fallow. Keeping a plot in cultivation
requires farming effort and thus lost income from nonfarm activities. The rich are generally
unwilling to accept this contract: the sacrifice of their high nonfarm income would outweigh
the benefit of cultivating poorly-fallowed land. The poor, however, typically find the tradeoff
worthwhile and accept the land.18
18See (Berry 2001, chapter 2) for a formal treatment of the model. The model is related to that of Banerjee
(1997). In his model, monetary rents are extracted from the rich, while here it is land that is captured. The
26

The abusua leader can set the cultivation requirement to be more or less stringent. He has
a certain amount of land that he can allocate. He has an obligation to allocate a unit of land
to each poor farmer; this is the core social contract. If he fails to allocate land to the poor,
he faces possible penalties in the form of litigation costs of defending himself in a chieftaincy
dispute, or gifts and favors to the abusua elders to induce them to ignore the complaints. His
problem is that he can not observe the off-farm earnings of most of the members of the abusua.
If he offers land with no conditions, of course the entire population will accept the land. Hence,
he uses the cultivation requirement to attempt to screen out rich members while still getting
land to the poor.
The tradeoff is clear: an increases in the cultivation requirement increase the amount of
land available for the leader to cultivate, but also increases the number of the poor who are not
allocated land and hence the probability that the leader will be penalized. His choice is guided
by balancing these conflicting objectives.
This model of land allocation has features that correspond well to both the informal accounts
of tenure insecurity that we received from cultivators themselves, and to patterns of investment
behavior that are evident in our data. In column 1 of Table 8, we show that individuals
who talk frequently (at least twice a week) with office holders have fallowing behavior that is
essentially indistinguishable from office holders themselves. This is consistent with the idea of a
cultivation requirement that is imposed as a way of distinguishing the poor from the rich among
those about whom the officeholders have incomplete information. Officeholders have better
information regarding the resources of those with whom they interact sufficiently intensively,
and hence need not impose this costly revelation device. This result is also consistent with
officeholders sharing rents with their friends.
As matrilineage land resources become more scarce (relative to the matrilineage population),
the leadership will impose stricter cultivation requirements. The marginal value of additional
land kept under their own control rises as land becomes more scarce, so the leadership is more
willing to risk the penalty associated with failure to allocate land to some of the poor. Therefore,
the gap between the fallow durations of non-office holders and office holders would tend to be
larger in matrilineages in which land is more scarce. In column 2 of table 8, we see unsurprisingly
public observability of fallowing choices in our context is at the root of this difference.
27

that fallow durations are, in general, shorter in more densely-populated matrilineages. In
column 3, we observe that the difference in fallowing by office holders and others rises with
population density in the matrilineage. The interquartile range of the number of households
per hectare in a matrilineage is approximately 1.5. These estimates imply that officeholders in a
‘poor’ matrilineage (at the 75th percentile of households/hectare) have a fallow duration about
5 years longer (relative to other households in the matrilineage) than households in a ‘wealthy’
matrilineage at the 25th percentile of households/hectare.
These results suggest that increasing population density has affected the economic well-being
of non-office holders more than that of office-holders. We next examine whether office-holders
actually do better in more densely populated matrilineages. Table 9 suggests this is not the case.
As we expect, leaders in matrilineages with more land per capita are better educated, farm much
more themselves, have larger families, and maintain consumption per capita in their families.
However, in contrast with the model, the gap between the education, area cultivated, household
size, and per capita expenditure of officeholders and the rest of the population increases with
the availability of land in the matrilineage.
To summarize, it appears that the flexible system of allocating temporary usufruct rights
through a political process at the matrilineage level has served a reallocative purpose, helping
avoid the emergence of a class of destitute landless in the villages. We also find evidence that
this system is inefficient, with the cost of inefficiency mainly borne by those not holding political
office. Finally, we find the efficiency cost of this system of insurance is apparently increasing
with population density. Moreover, it appears that village leaders do worse in more land scarce
matrilineages, suggesting that this may be an environment where the local population and
leaders share a common interest in improving the security of property rights.
The transition away from a system of insecure property rights may take many forms. We
begin by noting that as land gained value over the course of the early 20th century, both the
courts and the chieftaincy councils maintained two principles that checked the opportunism
of the contemporary generation of matrilineage leaders. First was a strict prohibition on the
sale of land to outsiders without approval from higher-level authorities. All land under the
control of a particular matrilineage was granted to it by a higher-level chief (called a ‘stool’)
who retained a superior form of ownership: “... what we may call inferior ownership meant
28

that a lineage owned its land subject to continued performance of its members’ obligations as
subjects, and acknowledgement of the ultimate and reversionary claim of the village headman
or stool which had originally granted it the land.” (Austin 2004, 101.) (also see (Berry 2001,
146-7)). It was the obligation of the stool to ensure that land remained available for the use
of his subjects; therefore, only he had the right to sell land to outsiders. There is no question
that a number of stools have sold land to outsiders, particularly in urban areas, but in general
such sales have been rare and when attempted have often resulted in the destoolment of the
chief (Berry 2001). Second was a resistance to granting permanent rights to land over local
individuals. Current leaders could not guarantee cultivators the right to restart cultivation
after fallowing. The most visible mechanism used to inhibit the transfer of long-term rights was
the prohibition on permitting land to move outside the matrilineage via patrilineal inheritance.
In most lineages the leadership carefully monitored allocated land to ensure that it was not
passed down from father to son. This was often a source for land disputes, because fathers
were generally permitted to ‘lend’ matrilineage land to their sons for brief periods (Austin 2004,
174).
In effect, these two restrictions have acted as formal barriers to abusua leaders using their
powers to create more permanent property rights. Pervasive imperfections in capital markets
have also limited this transformation. The large inefficiencies associated with the uncertainties
of tenure security imply the existence of substantial gains if the matrilineage leadership could
guarantee long-term tenure security. However, the benefits from this transformation would
be spread far into the future, over a period of decades. With imperfect capital markets, the
cultivators receiving long-term tenure security would not be able to pay the present value of this
long-term gain. Nor could they commit to a long-term stream of future payments, for the same
limited commitment reasons that long-term capital markets are so imperfect in these villages.19
The barriers to movement towards long-term security of land tenure are substantial. Nev-
ertheless, we do observe cross-sectional evidence that villagers find ways around these barriers
where they are particularly costly. In column 1 of Table 10, we show that individuals in ma-
trilineages that have particularly intense population pressure on matrilineage land spend more19Binswanger and Rosenzweig (1986) use this same argument in their discussion of the development of freehold
tenure in land abundant agriculture.
29

time on non-farm activities than individuals in less densely-populated matrilineages. Office-
holders are exempt from this pattern – they spend more time on non-farm activities in less
densely-populated matrilineages. This is in line with our model, which suggests office holders
will place more stringent fallowing requirements and extract more land in a more densely popu-
lated abusua. And it is in those matrilineages that the fallowing behavior of office holders and
others differs the most that individuals will concentrate their time on nonfarm activities.
In column 2 of Table 10, we show that farmers in more densely-populated matrilineages are
more likely to use commercial transactions to obtain land. Recall that in Table 7, we showed
that fallowing choices on commercial land are independent of officeholding status, and that
(within individuals) fallow periods on commercially-obtained plots are substantially longer than
on abusua land. Therefore, we see that in those matrilineages in which abusua land is under
more severe population pressure (and that have shorter fallow periods, as seen in Table 10, a
larger proportion of cultivated land is obtained through commercial fixed-rent and sharecropping
contracts. Office-holders, on the other hand, do not respond to population pressure by moving
towards cultivating commercially-obtained land, because (as in ??) they use their control over
the land allocation process to mitigate the consequences of that pressure.
These results must be considered tentative, because they depend on variation at a given
moment in time across a very limited number of matrilineages. However, they are suggestive that
population pressure is inducing actions that may have the long-term consequence of transforming
the land tenure system of the study area.
5 Conclusion
Gross correlations between institutional development and growth observed in cross-country data
have provided a persuasive case that long-run growth is faster in countries that have higher
quality contracting institutions, better law enforcement, increased protection of private property
rights, improved central government bureaucracy, smoother operating formal sector financial
markets, increased levels of democracy, and higher levels of trust.
This literature also suggests that understanding the channels of influence, and why such
extreme variation in institutional quality persists are research questions of central importance.
30

However, the scope of using cross-country data for identifying the channels of influence is lim-
ited. The measurement of ‘institutions’ at the country level is necessarily coarse, and obscures
important dimensions of heterogeneity. Even more important, there are very few plausible
sources of exogenous variation in country-level institutions that can serve to identify the causal
effect of institutions on growth. It is this fact that in the end most severely limits the range of
questions that can be addressed with this methodology. For instance, a paper which relies on
institutional persistence to obtain instruments for institutional quality will be hard pressed to
identify institutional evolution. Further, we argue that due consideration must be given to the
appropriate unit of analysis when considering the relationships between institutions and eco-
nomic activity. A unit smaller than a country may provide a more homogeneous environment
for a given institution, and therefore reveal more about the causal role of that institution.
These observations lead us to point to the empirical research based on micro-data in devel-
opment economics and suggest that the research methodologies pursued in this literature can
help make progress on the above issues. One such opportunity is presented by country-specific
policies that implement institutional change. Exploiting within-country variation implies a focus
on a more homogenous environment. Further, it is often possible to exploit features of the pol-
icy implementation process to obtain instruments which can help isolate the effect of a specific
institution.
A given institutional setting can provide a rich variety of incentives to different individuals,
depending upon their economic, social or political position. In section 4 we provide an example
from Ghana. We describe the complex land tenure system that exists in one region of Ghana.
In this system, individuals have very different levels of tenure security, depending upon their
position in a local political hierarchy. We show how this variation in the degree of security can
be exploited to identify the implications of tenure security for investment in land. We also
discuss the historical evolution of this land tenure system, and provide some evidence regarding
actions that individuals are currently taking to mitigate the dramatic inefficiencies associated
with tenure insecurity. Our evidence suggests that these actions have the potential to transform
the land tenure system of the region, and suggest that a close examination of individual actions
may help us understand how institutional change is initiated in economic environments facing
changing economic and demographic pressures.
31

References
Acemoglu, D., S. Johnson, and J. A. Robinson. 2001. The Colonial Origins of Comparative Development: An Empirical Investigation. American Economic Review 91, no. 5:1369-1401.
Acemoglu, Daron. 2005. Constitutions, Politics and Economics: A Review Essay on Persson and Tabellini's "The Economic Effect of Consitutions". Journal of Economic Literature.
Acemoglu, Daron, Simon Johnson, and James A. Robinson. 2002. Reversal of Fortune: Geography and Institutions in the Making of the Modern World Income Distribution. Quarterly Journal of Economics 117, no. 4:1231-1294.
Acemoglu, Daron, and Simon Johnson. 2005. Unbundling Institutions. Journal of Political Economy 113, no. 5:949-995.
African Development Fund. 2004. Democratic Republic of Congo: Agricultural and Rural Sector Rehabilitation Support Project in Bas-Congo and Bandundu Provinces (PARSAR) Appraisal Report.
Aghion, Philippe, Peter Howitt, and David Mayer-Foulkes. 2005. The Effect of Financial Development on Convergence: Theory and Evidence. Quarterly Journal of Economics 120, no. 1:173-222.
Aide et Action pour la Paix. 2004. Ce Qu'il Faut Connaitre Sur le Sol en Droit Congolais.
Alston, Lee J., Gary D. Libecap, and Bernardo Mueller. 2000. Land Reform Policies, the Sources of Violent Conflict, and Implications for Deforestation in the Brazilian Amazon. Journal of Environmental Economics and Management 39, 162-188.
Alston, Lee J., Gary D. Libecap, and Robert Schneider. 1996. The Determinants and Impact of Property Rights; Land Titles on the Brazilian Fronteir. Journal of Law, Economics and Organization 12, no. 1:25-61.
Amanor, Kojo S. 1999. Global Restructuring and Land Rights in Ghana: Forest Food Chains, Timber and Rural Livelihoods. Vol. 108. Uppsala: Nordiska Afrikainstutet.
Antle, John, et al. Endogeneity of Land Titling and Farm Investments: Evidence from the Peruvian Andes. Bozeman, MT: Department of Agricultural Economics and Economics, Montana.
Aportela, F. 1998. Effect of Financial Access on Savings by Low-Income People.Massachusetts Institute of Technology.
Aryeetey, Ernest, Harrigan, Jane, and Nissanke, Machiko. 2000. Economic Reforms in Ghana : The Miracle and the Mirage. Oxford :James Curry ; Accra, New Town, Ghana: Woeli Publishing Services; Africa World Press.
Asiama, Seth O. 2003. Comparative Study of Land Administration Systems: Case Study - Ghana.UK Department for International Development.

Austin, Gareth. 2004. Labour, Land, and Capital in Ghana : From Slavery to Free Labour in Asante, 1807-1956. Vol. 18. Rochester, NY: University of Rochester Press.
Banerjee, Abhijit V. 1997. A Theory of Misgovernance. Quarterly Journal of Economics 112, no. 4:1289-1332.
Banerjee, Abhijit V., Paul J. Gertler, and Maitreesh Ghatak. 2002. Empowerment and Efficiency: Tenancy Reform in West Bengal. Journal of Political Economy 110, no. 2:239-280.
Barro, Robert J., and Lee, Jong-Wha. Data Set for a Panel of 138 Countries. 1999Available from http://post.economics.harvard.edu/faculty/barro/data.html.
Bassett, J. T. 1993. Cartography, ideology, and power: the World Bank in northern Côte d'Ivoire. Passages: A Chronicle of the Humanities.
Bates, Robert H. 1981. Markets and States in Tropical Africa : The Political Basis of Agricultural Policies. Berkeley: University of California Press.
Beck, Thorsten, Asli Demirguc-Kunt, and Ross Levine. 2003. Law, Endowments, and Finance. Journal of Financial Economics 70, no. 2:137-181.
Bell, C., and P. L. Rousseau. 2001. Post-independence India: a case of finance-led industrialization? Journal of Development Economics 65, no. 1:153-175.
Benneh, George. 1988. The Land Tenure and Agrarian System in the New Cocoa Frontier: Wassa Akropong Case Study. In Agricultural Expansion and Pioneer Settlements in the Humid Tropics, edited by Walther Manshard and William B. Morgan. Tokyo: The United Nations University.
Berry, Sara S. 2001. Chiefs Know Their Boundaries : Essays on Property, Power, and the Past in Asante, 1896-1996. Portsmouth, NH :Heinemann ; Oxford; Cape Town: J. Currey; D. Philip.
Besley, T., R. Pande, and V. Rao. 2005. Participatory Democracy in Action: Survey Evidence from South India. Journal of the European Economic Association 3, no. 2-3:648-657.
Besley, Timothy. 1995. Property Rights and Investment Incentives: Theory and Evidence from Ghana. The Journal of Political Economy 103, no. 5:903-937.
Besley, Timothy, and Anne Case. 2003. Political Institutions and Policy Choices: Evidence from the United States. Journal of Economic Literature 41, no. 1:7-73.
Besley, T., and R. Burgess. 2004. Can labor regulation hinder economic performance? Evidence from India. Quarterly Journal of Economics 119, no. 1:91-134.
Biebuyck, Daniel, ed. 1963. African Agrarian Systems; Studies Presented and Discussed. Foreword by Daryll Forde.Oxford University Press.

Binswanger, H., Deininger, K., and Feder, G. 1995. Handbook of Development Economics. In . Amsterdam: North-Holland.
Binswanger, H., and M. Rosenzweig. 1986. Behavioral and Material Determinants of Production Relations in Agriculture. Journal of Development Studies 22, 503-539.
Binswanger, Hans P., Deninger, Klaus, and Feder, Gershon. 1995. Power, Distortions, Revolt and Reform in Agricultural Land Relations. In Handbook of Development Economics, Volume III, edited by J. Behrman and T. N. Srinivasan. Amsterdam: Elselvier Science, B.V.
Bockstette, V., A. Chanda, and L. Putterman. 2002. States and Markets: The Advantage of an Early Start. Journal of Economic Growth 7, no. 4:347-369.
Broegaard, Rikke J., Heltberg, Rasmus, and Machlow-Moller, Nikolaj. 2002. Property Rights and Land Tenure Security in Nicaragua.Center for Economic and Business Research, Copenhagen.
Bromley, Daniel. 1989. Property Relations and Economic Development: The Other Land Reform. World Development 17, no. 6:867-877.
Brown, John, and Timothy Guinnane. 2005. Regions and Time in the European Fertility Transition: Problems in the Princeton Project's Statistical Methodology. Explorations in Economic History.
Bruce, J., and Migot-Adholla, S., eds. 1994. Searching for Land Tenure Security in Africa. Dubuque, IA: Kendall/Hunt.
Bruce, J., and Migot-Adholla, S. E., eds. 1994. Searching for Land Tenure Security in Africa. Iowa: Kendall/Hunt.
Burgess, R., and R. Pande. 2005. Do rural banks matter?: evidence from the Indian social banking experiment. American Economic Review 95, no. 3:780-795.
Carter, Michael R., and Olinto, Pedro. 2000. Getting Institutions ‘Right’ for Whom: Credit Constraints and the Impact of Property Rights on the Quantity and Composition of Investment.University of Wisconsin-Madison.
Cartier, Michael R., Wiebe, Kieth D., and Blarel, Benoit. 1994. Tenure Security for Whom? Differential Effects of Land Policy in Kenya. In Searching for Land Tenure Security in Africa, edited by John W. Bruce and Shem E. Migot-Adholla. Washington, DC: The World Bank.
Chattopadhyay, R., and E. Duflo. 2004. Women as policy makers: Evidence from a randomized policy experiment in India. Econometrica 72, no. 5:1409-1443.
Chauveau, Jean-Pierre. 2002. La Loi Ivoirienne de 1998 sur le Domaine Foncier Rural et L’agriculture de Plantation Villageoise: Une Mise en Perspective Historique et Sociologique. Land Reform: Land Settlement and Cooperativesno. 1:62-79.

Chauveau, Jean-Pierre. 2000. Question Foncière et Construction Nationale en Côte d’Ivoire. Les Enjeux Silencieux d’un Coup d’Etat. Politique Africaine 17, 94-125.
Chavas, Jean-Paul, Ragan Petrie, and Michael Roth. 2005. Farm Household Production Efficiency: Evidence from the Gambia. American Journal of Agricultural Economics 87, no. 1:160-179.
Chemin, M. 2004. Does the Quality of the Judiciary Shape Economic Activity? Evidence from India. Ph.D. diss., London School of Economics.
Clague, C., P. Keefer, S. Knack, and M. Olson. 1999. Contract-Intensive Money: Contract Enforcement, Property Rights, and Economic Performance. Journal of Economic Growth 4, no. 2:185-211.
Côte d'Ivoire. 2003. Linas-Marcoussis Agreement.
Crook, Richard C. Civil War in Cote d'Ivoire; Behind the Headlines.
Curtin, P. D. 1989. Death by Migration: Europe's Encounter with the Tropical World in the 19th Century. New York: Cambridge University Press.
de Laiglesia, Juan R. 2004. Investment and Credit Effects of Land Titling and Registration: Evidence from Nicaragua.London School of Economics.
Demetriades, P. O., and K. B. Luintel. 2001. Financial restraints in the South Korean miracle. Journal of Development Economics 64, no. 2:459-479.
Deninger, Klaus, and Juan S. Chamorro. 2004. Investment and Equity Effects of Land Regularization: The Case of Nicaragua. American Journal of Agricultural Economics 30, 101-116.
Djankov, S., et al. 2003. The New Comparative Economics. Journal of Comparative Economics 31, no. 4:595-619.
Djankov, S., R. La Porta, F. Lopez-De-Silanes, and A. Shleifer. 2002. The Regulation of Entry. Quarterly Journal of Economics 117, no. 1:1-37.
Dowall, David E., and Michael Leaf. 1991. The Price of Land for Housing in Jakarta. Urban Studies 28, no. 5:707-722.
Duflo, E., and Banerjee, A. V. 2004. Do Firms Want to Borrow More? Testing Credit Constraints Using a Directed Lending Program.Massachusetts Institute of Technology.
Esfahani, H. S., and M. T. Ramirez. 2003. Institutions, Infrastructure, and Economic Growth. Journal of Development Economics 70, no. 2:443-477.
Feder, Gershon, and Tongroj Onchan. 1987. Land Ownership Security and Farm Investment in Thailand. American Journal of Agricultural Economics 69, no. 2:311-320.

Field, Erica. 2003. Entitled to Work: Urban Property Rights and Labor Supply in Peru.Harvard University.
Field, Erica. 2003. Fertility Responses to Urban Land Titling Programs: The Roles of Ownership Security and the Distribution of Household Assets.Harvard University.
Field, Erica, and Torero, Maximo. 2004. Do Property Titles Increase Credit Access Among the Urban Poor? Evidence from a Nationwide Titling Program.Harvard University.
Firmin-Sellers, Kathryn. 1996. The Transformation of Property Rights in the Gold Coast : An Empirical Analysis Applying Rational Choice Theory. New York: Cambridge University Press.
Firmin-Sellers, Kathryn, and Patrick Sellers. 1999. Expected Failures and Unexpected Successes of Land Titling in Africa. World Development 27, no. 7:1115-1128.
Fisman, R. 2001. Estimating the value of political connections. American Economic Review 91, no. 4:1095-1102.
Fisman, R., and S. J. Wei. 2004. Tax rates and tax evasion: Evidence from "missing imports" in China. Journal of Political Economy 112, no. 2:471-496.
Foster, A. D., and Rosenzweig, M. R. 2001. Democratization, Decentralization and the Distribution of Local Public Goods in a Poor Rural Economy.University of Pennsylvania.
Francisco, Alcalá, and Antonio Ciccone. 2004. Trade and Productivity. Quarterly Journal of Economics 119, no. 2:613-646.
Frankel, J., and A. Rose. 2002. An Estimate of the Effect of Common Currencies on Trade and Income. Quarterly Journal of Economics 117, no. 2:437-466.
Frankel, J. A., and D. Romer. 1999. Does Trade Cause Growth? American Economic Review 89, no. 3:379-399.
Fred-Mensah, B. K. 1996. Changes, Ambiguities and Conflicts in Buem, Eastern Ghana.Johns Hopkins University.
Freudenberger, Mark S. 2000. Tenure and Natural Resources in the Gambia: Summary of Research Findings and Policy Options. Vol. 40. University of Wisconsin-Madison: Land Tenure Center.
Friedman, Joseph, Emmanuel Jimenez, and Stephen K. Mayo. 1988. The Demand for Tenure Security in Developing Countries. Journal of Development Economics 29, 185-198.
Furth, Rebecca. 1998. Ivory Coast Country Profile. In Country Profiles of Land Tenure: Africa, 1996, edited by John W. Bruce. University of Wisconsin-Madison: Land Tenure Center.
Galiani, S., P. Gertler, and E. Schargrodsky. 2005. Water for life: The impact of the privatization of water services on child mortality. Journal of Political Economy 113, no. 1:83-120.

Glaeser, E. L., R. La Porta, F. Lopez-de-Silanes, and A. Shleifer. 2004. Do Institutions Cause Growth? Journal of Economic Growth 9, no. 3:271-303.
Golan, Elise H. 1994. Land Tenure Reform in the Peanut Basin of Senegal. In Searching for Land Tenure Security in Africa, edited by John W. Bruce and Shem E. Migot-Adholla. Washington, DC: The World Bank.
Goldberg, P. K., and N. Pavcnik. 2003. The response of the informal sector to trade liberalization. Journal of Development Economics 72, no. 2:463-496.
Guerty, M. K., and Miguel, E. 2000. Community Participation and Social Sanctions in Kenyan Schools.Harvard University.
Hall, R. E., and C. I. Jones. 1999. Why Do Some Countries Produce So Much More Output per Worker than Others? Quarterly Journal of Economics 114, no. 1:83-116.
Hart, Terese B., and Robert Ducarme. 2005. Forestry and Conservation Activities During a War Fought over Land and Resources in the Democratic Republic of Congo. ETFRN News42-44.
Hayes, Joseph, Michael Roth, and Lydia Zepeda. 1997. Tenure Security, Investment and Productivity in Gambian Agriculture: A Generalized Probit Analysis. American Journal of Agricultural Economics 79, 369-382.
Heckman, James J., and Vytlacil, Edward J. 2000. Local Instrumental Variables. In Nonlinear Statistical Modeling: Essays in Honor of Takeshi Amemiya, edited by C. Hsiao, K. Morimune and J. Powell. Cambridge: Cambridge University.
Hill, Polly. 1963. The Migrant Cocoa-Farmers of Southern Ghana; A Study in Rural Capitalism. Cambridge Eng.: University Press.
Huggins, Chris, et al. 2005. Land, Conflict and Livelihoods in the Great Lakes Region: Testing Policies to the Limit. Vol. 14. Nairobi: African Center for Technology Studies.
Human Rights Watch. 2004. Côte d’Ivoire: Accountability for Serious Human Rights Crimes Key to Resolving Crisis.
Imbens, Guido, and Joshua Angrist. 1994. Identification and Estimation of Local Average Treatment Effects. Econometrica 62, no. 3:467-475.
Jansen, Kees, and Esther Roquas. 1998. Modernizing Insecurity; The Land Titling Project in Honduras. Development and Change 29, 81-106.
Jin, H. H., and Y. Y. Qian. 1998. Public versus private ownership of firms: Evidence from rural China. Quarterly Journal of Economics 113, no. 3:773-808.

Johnson, Nancy L. 2001. Tierray Libertad: Will Tenure Reform Improve Productivity in Mexico's Ejido Agriculture? Economic Development and Cultural Change291-309.
Kan, K. 2000. Informal capital sources and household investment: evidence from Taiwan. Journal of Development Economics 62, no. 1:209-232.
Kasanga, Kasim, and Kosey, Nii A. 2001. Land Management in Ghana: Building on Tradition and Modernity. London: International Institute for Environment and Development.
Kaufmann, D., A. Kraay, and M. Mastruzzi. 2004. Governance Matters III: Governance Indicators for 1996, 1998, 2000, and 2002. World Bank Economic Review 18, no. 2:253-287.
Knack, S., and P. Keefer. 1997. Does Social Capital Have an Economic Payoff? A Cross-Country Investigation. Quarterly Journal of Economics 112, no. 4:1251-1288.
Knox, Anna. 1998. Gambia Country Profile. In Country Profiles of Land Tenure: Africa, 1996, edited by John W. Bruce. University of Wisconsin-Madison: Land Tenure Center.
Knox, Anna. 1998. Ghana Country Profile. In Country Profiles of Land Tenure: Africa, 1996, edited by John W. Bruce. University of Wisconsin-Madison: Land Tenure Center.
Kogel, T. 2005. Youth Dependency and Total Factor Productivity. Journal of Development Economics 76, no. 1:147-173.
Kone, Mariatou. 2002. Gaining Rights of Access to Land in West-Central Côte d'Ivoire. London: International Institute for Environment and Development.
La Ferrara, E. 2003. Kin Groups and Reciprocity: A Model of Credit Transactions in Ghana. American Economic Review 93, no. 5:1730-1751.
La Porta, R., F. Lopez-De-Silanes, A. Shleifer, and R. Vishny. 1999. The Quality of Government. Journal of Law Economics & Organization 15, no. 1:222-279.
Lanjouw, Jean O., and Phillip I. Levy. 2002. Untitled: A Study of Formal and Informal Property Rights in Urban Equador. The Economic Journal986-1019.
Leisz, Steve. 1998. Zaire Country Profile. In Country Profiles of Land Tenure: Africa, 1996, edited by John W. Bruce. University of Wisconsin-Madison: Land Tenure Center.
Lopez, R. 1996. Land Titling and Investment in Honduras.Department of Agricultural and Resource Economics, University of Maryland, College Park, MD.
Mahama, Suleimana. 2003. The Ghana Land Administration Project: The Process and Challenges. Marburg, Germany: Philipps-University.

Manning, Alan. 2004. Instrumental Variables for Binary Treatments with Heterogenous Treatment Effects: A Simple Exposition. Contributions to Economic Analysis & Policy 3, no. 1:1273-1273.
Masters, W. A., and M. S. McMillan. 2001. Climate and Scale in Economic Growth. Journal of Economic Growth 6, no. 3:167-186.
Mauro, P. 1995. Corruption and Growth. Quarterly Journal of Economics 110, no. 3:681-712.
McEvedy, C., and Jones, R. 1978. Atlas of World Population History. New York: Facts on File.
Miceli, Thomas J., C. F. Sirmans, and Joseph Kieyah. 2001. The Demand for Land Title Registration: Theory with Evidence from Kenya. American Law and Economics Review 3, no. 2:275-287.
Migot-Adholla, Shem E., Place, Frank, and Oluch-Kosura, W. 1994. Security of Tenure and Land Productivity in Kenya. In Searching for Land Tenure Security in Africa, edited by John W. Bruce and Shem E. Migot-Adholla. Washington, DC: The World Bank.
Ministry of Lands and Forestry. 2003. Ghana: Emerging Land Tenure Issues.Accra, Ghana.
Moyroud, Celine, and Katunga, John. 2002. Coltan Exploration in Eastern Democratic Republic of the Congo (DRC). In Scarcity and Surfeit. Nairobi: African Centre for Technology Studies.
North, Douglass C. 1981. Structure and Change in Economic History. New York: Norton & Co.
Pande, R. 2003. Can mandated political representation increase policy influence for disadvantaged minorities? Theory and evidence from India. American Economic Review 93, no. 4:1132-1151.
Pender, John L., and John M. Kerr. 1999. The Effects of Land Sales Restrictions: Evidence from South India. Agricultural Economics 21, 279-294.
Peters, Pauline E. 1994. Dividing the Commons: Politics, Policy, and Culture in Botswana. Charlottesville: University Press of Virginia.
Pinckney, Thomas C., and Peter K. Kimuyu. 1994. Land Tenure Reform in East Africa: Good, Bad or Unimportant? Journal of African Economies 3, no. 1:1-28.
Place, Frank, and Peter Hazell. 1993. Productivity Effects of Indigenous Tenure Systems in Sub-Saharan Africa. American Journal of Agricultural Economics 75, no. 1:10-19.
Place, Frank, and S. E. Migot-Adholla. 1998. The Economic Effects of Land Registration on Smallholder Farms in Kenya: Evidence from Nyeri and Kakamega Districts. Land Economics 74, no. 3:360-373.
Raynaut, Claude. 1997. Sahel Diversité et Dynamiques des Relations Société Nature. Edited by Claude Raynaut, Emmanuel Grégoire. London; New York: Routledge.
Rodrik, Dani. 1999. Democracies Pay Higher Wages. Quarterly Journal of Economics 114, no. 3:707-738.

Rodrik, Dani, Arvind Subramanian, and Francesco Trebbi. 2004. Institutions Rule: The Primacy of Institutions Over Geography and Integration in Economic Development. Journal of Economic Growth 9, no. 2:131-165.
Roth, Michael, Cochrane, Jeffrey, and Kisamba-Mugerwa, W. 1994. Tenure Security, Credit Use, and Farm Investment in the Rujumbura Pilot Land Registration Scheme, Uganda. In Searching for Land Tenure Security in Africa, edited by John W. Bruce and Shem E. Migot-Adholla. Washington, DC: The World Bank.
Roth, Michael, Unruh, Jon, and Barrows, Richard. 1994. Land Registration, Tenure Security, Credit Use, and Investment in the Shebelle Region of Somalia. In Searching for Land Tenure Security in Africa, edited by John W. Bruce and Shem E. Migot-Adholla. Washington, DC: The World Bank.
Sachs, J. D., and A. Warner. 1995. Economic-Reform and the Process of Global Integration. Brookings Papers on Economic Activityno. 1:1-95.
Sullivan, M. J. 1991. Measuring Global Values. New York: Greenwood.
Taylor, C. L., and Hudson, M. C. 1972. World Handbook of Political and Social Indicators. Ann Arbor, MI: ICSPR.
The World Bank. 2005. 2005 World Development Indicators.Washington D.C.
Topalova, P. 2005. Trade Liberalization, Poverty, and Inequality: Evidence from Indian Districts.NBER.
Toure, Mahamane D. 2003. Rural Land Tenure and Sustainable Development in the Sahel and West Africa; Secure Land Tenure Problems in the Sahel and West Africa: Nine Years After PRAIA; Regional Summary Report. Bamako, Republic of Mali: Permanent Interstates Committee for Drought Control in the Sahel.
Udry, Christopher, and Goldstein, Markus. 2004. Gender, Power and Agricultural Investment in Ghana. New Haven, CT: Yale University.
USDA Foreign Agricultural Service. 2004. Cote d'Ivoire Solid Wood Products Annual, 2004. Vol. IV4013.
Visaria, S. 2005. Legal Reform and Loan Repayment: The Microeconomic Impact of Debt Recovery Tribunals in India. Ph.D. diss., Columbia University.
Vlassenroot, Koen, and Chris Huggins. 2004. Land, Migration and Conflict in Eastern D.R. Congo. Eco-Conflicts 3, no. 4:1-4.
Wily, Liz A., and Hammond, Daniel. 2001. Land Security and The Poor in Ghana: Is There a Way Forward? A Land Sector Scoping Study.UK Department for International Development.

Article Dependent variables Key results1
Measures Instrument
Acemoglu, Johnson &Robinson (2001)
Log GDP per capita (1995) Protection against expropriation risk1
(1985-1995)Settler mortality1
One standard deviation (SD) increase inprotection against expropriation risk (1.5)increases GDP per worker by 118%(OLS) and 309% (IV) .
Hall&Jones (1999) Log output per worker1 (1988)
Index of social infrastructure2 which combines: i. index of government antidiversion policies3
ii. index of country's openness4
I. Distance from equator2
II. English speakers3
III. European-language speakers4
IV. Predicted trade share5
One SD increase in index of socialinfrastructure (0.25) increases output perworker by 128% (OLS) and 261% (IV).
Knack&Keefer (1995)
I. Annual GDP per capita growth (1974-1989) II. Private investment/GDP (1974-1989) (all averages)
I. ICRG index5
II. BERI index6 No IV estimates.One SD increase in ICRG index (13.50)increases annual per capita incomegrowth rate by 1.24 (OLS)
LLSV (1999)
Dependent variables are classified in five groups (data from 1990s): I. Interference with private sector II. Efficiency III. Output of public goods IV. Size of public sector V. Political freedom
I. Ethnolinguistic fractionalization II. Legal origin III. Religion
No IV estimates.A French legal origin country (relative toothers) has 42 % more infant mortaliy(OLS)
Mauro (1995)
I.GDP per capita growth (1960-1985) II. Investment/GDP (1960-1985) III. Investment/GDP (1980-1985) (all averages)
I. Index of institutional efficiency7
II. Index of bureaucratic efficiency8 Ethnolinguistic fractionalization6
(1960)
One SD increase in index of bureaucraticefficiency (2.16) increases average growthof GDP per capita by 0.6% (OLS) and2.3% (IV)
Acemoglu, Johnson &Robinson (2002)
I. Log GDP per capita (1995) II. Urbanization2 (1995)
I. Current institutions: i. protection against expropriation risk ii. executive constraints in 19909
II. Early institutions: i. executive constraints in 1900 ii. initial executive constraints10
Settler mortality One SD increase in expropriation risk(1.5) increases GDP per capita by 118%(IV), controlling for urbanization in 1500
Acemoglu &Johnson (2005)
I. Log GDP per capita (1995) II. Av. investment/GDP (1990s) III. Private credit/GDP (1998) IV. Average stock market capitalization3/GDP (1990-1995)
I. Contracting institutions:i. legal formalism11
II. Property rights institutions:i. executive constraintsii. protection against expropriation risk
I. Settler mortality II. Log of indigenous population density in 1500 7
III. legal origin8
One SD increase in expropriation risk(1.47) and legal formalism (1.24, using"check measure") together increase GDPper capita by 189% (OLS) and 523%(IV).
Aghion, Howitt&Mayer-Foulkes (2005)
Average growth rate of GDP per capita (1960-1995) relative to the United States
I. Private credit12
II. Liquid liabilities13
III. Bank assets14
IV. Commercial-central bank15
I. Legal origin II. Settler mortality
One SD increase in private credit (0.28)increases steady-state GDP by 21% inBelgium2
Alcala&Ciccone (2004) Log GDP per capita (1995)
Index of institutional quality16
I. Settler mortality II. European-language speakers III.Predicted trade share (AC)12
One SD increase in index of institutionalquality increases GDP per capita by 35%(IV) (controls include log real openness3)
Bockstette, Chanda& Putterman (2002)
I. Log output per worker (1988) II. Average GDP per capita growth (1960-1995)
I. Index of social infrastructure II. ICRG index
I. Distance from equator II. English speakers III. European-language speakers IV. Log predicted trade share V. State antiquity9
One SD increase in index of socialinfrastructure (0.25) increases output perworker by 126% (OLS) and 229% (GMMIV)
TABLE-1: Institutions and Growth: Literature Review
Institutions
PAPERS CITING CORE PAPERS
CORE PAPERS
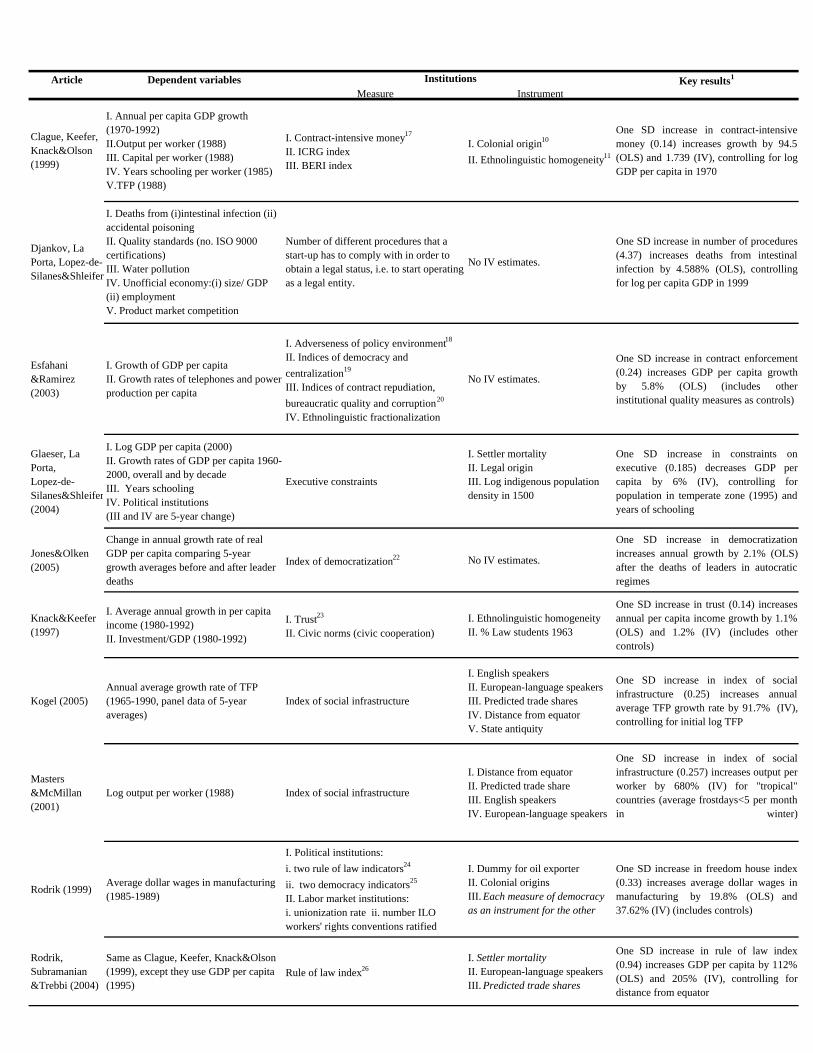
Article Dependent variables Key results1
Measure Instrument
Clague, Keefer, Knack&Olson (1999)
I. Annual per capita GDP growth (1970-1992) II.Output per worker (1988) III. Capital per worker (1988) IV. Years schooling per worker (1985) V.TFP (1988)
I. Contract-intensive money17
II. ICRG index III. BERI index
I. Colonial origin10
II. Ethnolinguistic homogeneity11
One SD increase in contract-intensivemoney (0.14) increases growth by 94.5(OLS) and 1.739 (IV), controlling for logGDP per capita in 1970
Esfahani &Ramirez (2003)
I. Growth of GDP per capita II. Growth rates of telephones and power production per capita
I. Adverseness of policy environment18
II. Indices of democracy and centralization19
III. Indices of contract repudiation, bureaucratic quality and corruption20
IV. Ethnolinguistic fractionalization
No IV estimates.
One SD increase in contract enforcement(0.24) increases GDP per capita growthby 5.8% (OLS) (includes otherinstitutional quality measures as controls)
Glaeser, La Porta, Lopez-de-Silanes&Shleifer(2004)
I. Log GDP per capita (2000) II. Growth rates of GDP per capita 1960-2000, overall and by decade III. Years schooling IV. Political institutions (III and IV are 5-year change)
Executive constraints
I. Settler mortality II. Legal origin III. Log indigenous population density in 1500
One SD increase in constraints onexecutive (0.185) decreases GDP percapita by 6% (IV), controlling forpopulation in temperate zone (1995) andyears of schooling
Jones&Olken (2005)
Change in annual growth rate of real GDP per capita comparing 5-year growth averages before and after leader deaths
Index of democratization22 No IV estimates.
One SD increase in democratizationincreases annual growth by 2.1% (OLS)after the deaths of leaders in autocraticregimes
Knack&Keefer (1997)
I. Average annual growth in per capita income (1980-1992) II. Investment/GDP (1980-1992)
I. Trust23
II. Civic norms (civic cooperation)I. Ethnolinguistic homogeneity II. % Law students 1963
One SD increase in trust (0.14) increasesannual per capita income growth by 1.1%(OLS) and 1.2% (IV) (includes othercontrols)
Kogel (2005)Annual average growth rate of TFP (1965-1990, panel data of 5-year averages)
Index of social infrastructure
I. English speakers II. European-language speakers III. Predicted trade shares IV. Distance from equator V. State antiquity
One SD increase in index of socialinfrastructure (0.25) increases annualaverage TFP growth rate by 91.7% (IV),controlling for initial log TFP
Masters &McMillan (2001)
Log output per worker (1988) Index of social infrastructure
I. Distance from equator II. Predicted trade share III. English speakers IV. European-language speakers
One SD increase in index of socialinfrastructure (0.257) increases output perworker by 680% (IV) for "tropical"countries (average frostdays<5 per monthin winter)
Rodrik (1999)Average dollar wages in manufacturing (1985-1989)
I. Political institutions: i. two rule of law indicators24
ii. two democracy indicators25
II. Labor market institutions: i. unionization rate ii. number ILO workers' rights conventions ratified
I. Dummy for oil exporter II. Colonial origins III. Each measure of democracy as an instrument for the other
One SD increase in freedom house index(0.33) increases average dollar wages inmanufacturing by 19.8% (OLS) and37.62% (IV) (includes controls)
Rodrik, Subramanian &Trebbi (2004)
Same as Clague, Keefer, Knack&Olson (1999), except they use GDP per capita (1995)
Rule of law index26I. Settler mortality II. European-language speakers III. Predicted trade shares
One SD increase in rule of law index(0.94) increases GDP per capita by 112%(OLS) and 205% (IV), controlling fordistance from equator
I. Deaths from (i)intestinal infection (ii) accidental poisoning II. Quality standards (no. ISO 9000 certifications) III. Water pollution IV. Unofficial economy:(i) size/ GDP (ii) employment V. Product market competition
Djankov, La Porta, Lopez-de-Silanes&Shleifer
One SD increase in number of procedures(4.37) increases deaths from intestinalinfection by 4.588% (OLS), controllingfor log per capita GDP in 1999
Number of different procedures that a start-up has to comply with in order to obtain a legal status, i.e. to start operating as a legal entity.
No IV estimates.
Institutions

Notes on Outcome Variables:
6)BERI index: Combines (i)contract enforceability, (ii) infrastructure quality, (iii) nationalization potential, (iv) bureaucratic delays. (Business Environmental Risk Intelligence).
5)ICRG index: Combines (i) protection against expropriation risk, (ii) rule of law, (iii) repudiation of contracts by government, (iv) corruption in gov't, and (v) quality of bureaucracy. Source: InternationalCountry Risk Guide (ICRG) dataset, Political Risk Services.
1) Protection against expropriation risk: A measure of risk of expropriation of foreign private investment by government, from 0 to 10, where a higher score indicates less risk. Originally used by Knack andKeefer (1995). Source: IRIS Center, also known as Political Risk Services
4) Index of country's openness: Sachs-Warner index which measures fraction years between 1950 to 1994 that the economy has been open, measured on a 0-1scale. A country is open if it satisfies the following criteria: (i) nontariff barriers cover less than 40% of trade, (ii) average tariff rates are less than 40%, (iii) any black market premium was less than 20 % during 1970s and 1980s, (iv) country is not classified as socialist by Kornai (1992), and (v) government does not monopolize major exports. Source: Sachs andWarner (1995).
26) Rule of law index: Composite indicator of multiple elements that capture the protection afforded to property rights and the strength of the rule of law. This is a standardized measure with range -2.5 (weakest institutions) and 2.5 (strongest institutions). Approximates for 1990’s institutions. Source: Kaufmann, Kraay, and Zoido-Lobaton (2002)
7) Index of institutional efficiency: Combines nine indices of institutional efficiency: political change, political stability, prob. of opposition group takeover, stability of labor, relationship with neighboringcountries, terrorism, legal system, red tape, and corrupton. Indices are integers between 0-10, higher values indicates that country has "good" institutions. All indices are simple country averages for the period1980-1983. Source: Business International (BI), now part of Economist Intelligence Unit.8) Index of bureaucratic efficiency: Combines three indices used for institutional efficiency measure: judiciary system, red tape and corruption indices.
24) These indicators are: (i) ICRG (Knack&Keefer(1995)) (ii) bureaucratic efficiency (Mauro (1995))
18) Adverseness of policy environment: Measured by black market premium on the foreign exchange rate. (Barro and Lee (1994)).
22) Index of democratization: Measured using the "polity" variable in the Polity IV dataset. Autocrats are defined as having a polity score less than or equal to 0. Democrats are those leaders with a polityscore greater than 0.
15) Commercial-central bank: Ratio of commercial bank assets to the sum of commercial plus central bank assets, which has been used by others.
1) Output per worker: Output calculated as GDP minus value added in the mining industry (which includes oil and gas). 2) Urbanization: % population living in urban areas with a population of at least 5,000in 1995. Source: World Bank, World Development Indicators. 3) Stock market capitalization : Market value of all traded stocks as a % of GDP, average over 1990-95. Source: Beck, Demirgüç-Kunt, andLevine(2003)
10) Colonial Origin: Dummy variable indicating whether country was a British, French, German, Spanish, Italian, Belgian, Dutch or Portuguese colony. Source: La Porta et al (1999)11) Ethnolinguistic homogeneity : Percentage of a country’s population belonging to the largest ethnic group. Each ethnolinguistic group is identified by religion, race, or language depending on which of theappears to be the most important cleavage in the given community. Source: Sullivan (1991).
8) Legal Origin: Legal origin of the company law or commercial code of each country (French Commercial Code versus English Common Law Origin) Source: La Porta et al (1999).
Notes on Institution Measures:
2) Index of social infrastructure: Institutions and government policies that provide incentives for individuals and firms in an economy.3) Index of government antidiversion policies: Created by averaging five indicators following Knack and Keefer (1995) for 1986–1995. Two categories relate to government’s role in protecting against privatediversion: (i) law and order, and (ii) bureaucratic quality. Three categories relate to government’s possible role as a diverter: (i)corruption, (ii) risk of expropriation, and (iii) government repudiation ofcontracts. The index takes values from zero to one (higher is better). Source: Political Risk Services.
20) Index of contract repudiation: risk of a modification in a contract taking the form of repudiation, postponement, or scaling down due to budget cutbacks, indigenization pressure, a change in government, ora change in government economic and social policies. Higher scores indicate lower risks. Index of bureaucratic quality: autonomy from political pressure and strength and expertise to govern without drasticchanges in policy or interruption in government services as well as the existence of an established mechanism for recruiting and training. Higher scores indicate higher quality.Index of corruption: indicator ofthe degree of "improper practices" in the government. The higher the indicator, the lower the degree of corruption.Source: International Country Risk Guide (ICRG) dataset, Political Risk Services.
1) Settler Mortality: Log estimated mortality for European settlers during European colonization (before 1850). It is calculated from the mortality rates of European-born soldiers, sailors and bishops whenstationed in colonies. It measures the effects of local diseases on people without inherited or acquired immunities. Source: Curtin (1989).
Notes on Instruments:
25) These indicators are: (i) Freedom House Index (a composite index of democracy for the 1970s, constructed from the indicators of political rights and civil liberties with a scale from 0 to 1 where 1indicates a fully democratic system) (ii) Polity III (Gurr (1995))
12) Predicted trade share (AC): A geography-based instrument for trade. They used exactly the same approach with Frankel and Romer (1999), except that they employ more bilateral trade data than Frankeand Romer (1999).Notes on Key Results:1) IV results reported in our table uses all the instruments in 'Instruments for Institutions' column except those italicized. 2) Belgium is the (estimated) converging country with the smallest level of private credit. 3) Real openness: Log imports plus exports in exchange rate US$ relative to GDP in purchasing-powerparity US$.
23) Trust: The question used to assess trust in a society is: “Generally speaking, would you say that most people can be trusted, or that you can’t be too careful in dealing with people? Trust indicator used bythe authors is the percentage of respondents in each nation replying “most people can be trusted” (after deleting the “don’t know” responses).
21) Index of institutional quality: Measured by scores for corruption, law and order, and bureaucracy for 1990. Three different measures are scaled from 1 (worst) through 6 (best). They have followed Rodrikin employing a rescaled unweighted average of the three measures. Source: International Country Risk Guide (ICRG) dataset, Political Risk Services.
14) Bank Assets: Ratio of all credits by banks (but not other financial intermediaries) to GDP
9) Executive constraints : 1-7 category scale, higher score means more constraints on the executive. Equals one if country not independent. (Polity III data set, Gurr (1997)) 10) Initial executive constraints: Executive constraints in the first year that country appears in the Gurr's (1997) Polity III data set. Source: Polity III data set, Gurr (1997)
17) Contract-intensive money: Ratio of noncurrency money to total money supply. An objective measure of enforceability of contracts and the security of property rights based on the citizens' decisionsregarding the form in which they choose to hold their financial assets.
12) Private credit: Value of credits by financial intermediaries to the private sector, divided by GDP.
11) Legal formalism: Measures number of formal legal procedures necessary to resolve a simple case of collecting on an unpaid check or evicting a non-paying tenant (from 1 to 7). "Check measure" and"Eviction measure" from Djankov, La Porta, Lopez-de-Silanes, and Shleifer (2003). Source: Djankov, La Porta, Lopez-de-Silanes, and Shleifer (2002, 2003).
7) Indigenous population density: Population density is calculated as total population divided by land area usable for agriculture. Source: McEvedy and Jones (1978).
4) European-language speakers: Fraction of the population speaking one of the five principal languages of Europe (English, French, German, Portuguese, or Spanish) at birth.
9) State antiquity: Index for the depth of experience with state-level institutions . Scales from zero to one.
13) Liquid liabilities: Currency plus demand and interestbearing liabilities of banks and nonbank financial intermediaries, divided by GDP
16) Institutional Quality: Combines bureaucratic quality, law/order, and property rights protection indices. (Political Risk Services; similar to Knack-Keefer (1995), Hall- Jones (1999).
19) Index of democracy: Average of 8 indicators ranking policymaker selection process and the constraints on them. Index of centralization: Geographic devolution of state decision-making authority, values of1 and 3 assigned to federal and unitary systems, respectively, and 2 to intermediate categories. (Polity III data set, Jaggers and Gurr's (1996)).
6) Ethnolinguistic fractionalization : Measures probability that two randomly selected persons from a given country will not belong to the same ethnolinguistic group. Source: Taylor and Hudson, WorlHandbook of Political and Social Indicators, 1972
2) Distance from equator: Center of county or province within a country that contains the most people. Source:Global Demography Project, University of California, Santa Barbara. 3) English speakers: Fraction of the population speaking English at birth.
5) Predicted trade share: Log value, based on a gravity trade model that only uses a country’s population and geographical features. Source: Frankel and Romer (1999).

Base Sample
Base Sample without OECD
countries Base Sample
Base Sample without OECD
countries AJR Base Sample(1) (2) (3) (4) (5)
Protection against expropriation risk (1985-1995) -9.99 -12.61 -8.65 -11.14
(1.78) (2.48) (2.14) (2.32)Distance from equator -7.21 -36.32
(20.16) (23.38)Asia dummy 11.82 -14.76
(7.14) (7.01)Africa dummy 16.52 17.26
(5.53) (5.36)Other continent dummy 13.81
(13.24)
Protection against expropriation risk (1985-1995) -18.30 -19.88 -32.79 -44.82
(3.95) (7.54) (18.92) (31.29)Distance from equator 79.71 -9.02
(77.87) (64.68)Asia dummy 14.79 26.10
(14.62) (20.67)Africa dummy -1.41 -0.64
(17.68) (21.31)Other continent dummy 64.59
(47.10)
Log settler mortality -0.59 -0.30 -0.27 -0.20 -0.34(0.13) (0.13) (0.18) (0.17) (0.18)
Distance from equator 2.77 0.29 2.00(1.42) (1.65) (1.38)
Asia dummy 0.07 0.28 0.46(0.50) (0.47) (0.50)
Africa dummy -0.39 -0.28 -0.25(0.44) (0.41) (0.40)
Other continent dummy 1.67 1.04(0.95) (0.84)
R 2 0.30 0.10 0.42 0.13 0.33
Number of observations 47 43 47 43 641% 25% 50% 75% 99%0.28 5.56 18.94 36.45 87.60
Table-2: Institutions and Poverty: Cross-Country Evidence
Panel A: Ordinary Least Squares (Dependent Variable: Median Headcount Ratio)
Our base sample is limited to 47 countries which were excolonies and for which we have headcount, expropriation risk and settler mortality data. To createthe sample, we set the median headcount value to zero for four OECD countries which were excolonies: Australia, Canada, New Zealand, and USAassuming there is no one living under $1 poverty line in these countries. AJR base sample in column (5) refers the largest sample of ex-colonies used byAcemoglu, Johnson, and Robinson (2001).
Notes: The dependent variable is the median headcount index (1981-2001) given by % population living in households with consumption or income perperson below the poverty line, defined as living on $1 a day ($32.74 per month at 1993 PPP), from Povcal Net, World Bank. Protection againstexpropriation risk (1985-1995) is the risk of expropriation of private investment by government, scaled from 0 to 10, where a lower score means more risk,from Acemoglu, Johnson, and Robinson (2001). Panel A reports OLS estimates. Panel B reports two stage least square estimates, where we instrument forprotection against expropriation risk using log European settler mortality, which is log of estimated mortality for European settlers during the early periodof European colonization (before 1850), from Acemoglu, Johnson, and Robinson (2001). In Panel C, we report the corresponding first stage. In columns(3) and (4) where we include continent dummies as controls, the dummy for America is omitted, following Acemoglu, Johnson, and Robinson (2001).Standard errors are given in parentheses.
Percentiles of median headcount ratio
Panel C: First Stage (Dependent Varibale: Protection Against Expropriation Risk (1985-1995))
Panel B: Two-Stage Least Squares (Dependent Variable: Median Headcount Ratio)

The Gambia Ivory Coast Ghana DRCCoding of InstitutionsExpropriation Risk 8.27 7.00 6.27 3.50
Legal Origin English French English French
Urbanization 26% 46% 44% 30%
Overview of Land Tenure
Urban land legislation only applies to Banjuland Kombo (St. Mary State Lands Act(1990)). Under this, land is state-ownedexcept if held in "fee simple" or subject togrants. Customary land occupiers hold a 99year renewable lease. The Lands (Provinces)Act 1946, which recognizes customary lawholds elsewhere else, and district tribunalsmay apply Islamic law.
Land tenure is in a state of confusion. The 1998law 98-750 on Rural Land Tenure initiated atransition to private ownership, but tenure issueshave become linked with political upheavals since the early 1990s. Critically, more than a third ofthe population consists of foreigners, and mostconflict is over the status of both Ivorian and non-Ivorian migrants.
Land Tenure derives from tradition and EnglishCommon Law. Allodial, customary freehold,common law freehold, leasehold and customarytenancy are recognized. The 1986 Land TitlingRegistration Law applies only in a few urban areas.Most of the country is governed by a mix ofcustomary rules and legislation (e.g. the 1992constitution and the 1962 State Lands Act).
The 1973 General Property Law makes all land stateproperty. At the local level, customary rules applywhere state power is weak; less than 1% of land in theDRC is registered. In much of the country thedominant factor in determining access to land hasbeen war, which has brought armed occupation andpopulation displacement.
Extent 99% (i.e.outside Banjul & Kombo) 98% of land 80-90% of Ghanaian land 97% of land ( de facto)De jure status Authority under the Lands (Provinces) Act is
given to the District Authorities, who are thehead chiefs (seyfos) under 1990 Laws of theGambia. District Tribunals may administercustomary and Islamic law, so long as theseare not "repugnant to justice."
Customary tenure has limited legal stature. The1998 land law allows only the state, publicinstitutions and native Ivorians to own rural land.Though intended to create individual tenure, itmakes customary rights the basis of claims.Communities registered as village cooperatives orassociations have had their rights upheld by thecourts.
Customary law has limited recognition. The 1992Constitution recognizes chiefs' authority over stooland skin lands, and of families over family lands.Several laws, including article the 1992 Constitution(giving Land Commissions a veto over landtransactions) and the 1994 Office of theAdministrator of Stools Land Act circumscribechiefs authority.
Customary arrangements are not recognized by law.
De facto status The state has given customary law legallegitimacy.
A “truly muddled and ad hoc system” hasresulted from combined assertion of governmentcontol and tolerance of customary systems.Though a 1962 law vests all land in the state, thepresident refused to enact a 1963 law thatabolished customary tenure.
Though several attempts have been made by thegovernment to centralize control over land, for themost part they defer to customary authorities.
Elites have used legal uncertainty due to failure of1973 presidential decree to secure customary tenure to appropriate untitled land. Though required toadvertise lease of ‘vacant’ land, the state has allowedBamis (local chiefs) to retain their leasing powers inreturn for political support. Local people, throughchiefs and elders, have “de facto veto over theacquisition process” and “droit de regard” – aninformal management right.
Variation Gambian customary tenure is complex anddiverse; a community may have multipletypes of property regimes, and these willchange over time. Where all parties to adispute are Muslim, District Tribunals mayapply Islamic law. Approximately 90% of thecountry is Muslim, and the Mandinka Fula,Wolof, Jola and Serahuli account for morethan 90% of the total population.
There are over 20 ethnic groups. The Agni andBaoule in central and eastern provinces arematrilineal. The king allocates land to lineages.The Agni redistribute land annually, whereas theBaoule keep the same parcels of land over severalyears. Among matrilineal Senoufu, Lobi andKoulango, the senior male of the founding lineageallocates land; in patrilineal Malinke the seniormale in the oldest lineage does this.
There are broad regional differences between thesouthern coast scrubland, the cocoa-growingrainforest of the southern interior, and northernsavannah. Ethnic differences also exist. Among theAshanti, Dagomba and Gonja, paramount chiefshave ultimate authority over land. "Traditional"tenure systems have survived more in the relativelyland abundant North.
There are over 250 ethnic groups spread across thecentral and northern rainforests, the northern andsouthern savannahs, and the eastern Rift Valleyhighlands. Population is concentrated in areas such asthe Kinshasa region, Banundu, and the Kivus. Otherareas are sparsely inhabited. Strictness of a tenureregime increases with population density (particularlyin Kivu, Bas-Congo, and near cities).
Customary Sector
Table-3: Land Rights in Four African Countries

The Gambia Ivory Coast Ghana DRCLand Ownership
Customary tenure is patrilineal and based onoriginal village settlement (unless trumped byconquest). The male household head allocates land within the family and mediates landdisputes. The seyfo (head chief) holds theland in trust for the community. There issome confusion about the relative powers ofseyfos, alkalos (village chiefs), families andlineages which dates back to at least the earlycolonial era.
Land may be owned by lineages, families orindividuals. Allocation practices vary, but for themost part land is allocated by a king, lineagehead, or senior male.
Individuals, families/ communities represented bystools and skins, Tendamba (original settlers) andclans own customary land. Ideologically, acommunity and its ancestors own the land. Allodialtitle is the highest proprietary interest (analogous tofreehold interest in English common law). It isinvested in chiefs on behalf of their subjects in stooland skin areas. In some areas tendamba and chiefsassert competing claims to this title. Whether familyand stool/skin lands face the same regulationsremains ambiguous.
Groups or clans own land. A family may “own” land,but cannot sell it, since the land “belongs” to thecentral government. Where there is a strongchieftancy (especially in the East), the Mwami (king)owns the land, and distributes it “through asophisticated system of reward and punishment.” Thisconnects land to political power. Individual familiesmay directly control family land, and individualsoften own trees. Customary authorities’ power isparticularly great where rebel authorities are seen asillegitimate.
Right to Transfer Land
Land sales are generally restricted; extendedfamilies “own” cultivated land (includingfallow land), but cannot alienate it. Foundingfamilies have usufruct rights, and can transfer land by inheritance, gifts, trades and loans.Some private property exists in the customarysector. Trees and wells are usually planters'private property. Lineage and householdheads often exercise significant control overland transfers. Alienation outside the lineageis usually disallowed (less effective aroundBanjul). Most primary rights transfers arethrough inheritance.
Sales are common, though the seller may retainsome use rights and have to approve any resale.Local communities have developed their owncontracts, often recorded in writing as “petitspapiers” and endorsed by several “headmen andsub-prefects, and even some judges.” The statesystem is of no use, since ownership can only beestablished by a certificate that does not yet exist.Conflicts have erupted between purchasers andreturn migrants who have claimed that the land isinalienable.
Land sales are restricted and require chiefs' or elders'permission. Non-transferable allodial title reside inthe community and freeholds cannot be grantedfrom stool and skin lands. The Lands Commissionmust approve land grants to outsiders. Customaryfreehold is secure and transferable, but cannot beacquired by non-Ghanaians. An allodial title holdercan sell or gift a common law freehold and grantleaseholds. Land can be purchased or gifted, butcommunity leaders must agree if it is to an outsider.Leaseholders can grant lesser rights (e.g.abusa andabunu sharecropping). The land market is informal,most transactions are unrecorded, and thosedocumented are rarely noted by the state.
Sales of land are generally restricted; customarytenure usually involves inalienable group land rights.A community cannot sell land, but can cede it to othervillages or rent it to strangers. In Masisi, afterpromulgation of the 1973 law it became impossible tobuy or sell land without the permission of the Hundechiefs; this encouraged clientelism as they profitedfrom selling large parcels.
Inheritance
“Primary rights,” gained through originalsettlement or direct allocation, includepermanent occupation, control of land use,and inheritance without interference; this issimilar to western ownership. Women borrowland from their husbands to cultivatevegetables and rice, though some own landthat is passed from mother to daughter.
In 1964 customary inheritance rules, other thanpatrilineal systems, were outlawed, but this is notusually enforced. Children of immigrants do nothave established inheritance rights. A tenant whoselects an heir without his tuteur's permissionmay lose his rights. Women inherit nothing fromhusbands but have recently gained the right tohold land given by their fathers. For land pledgedto a creditor, the creditor's rights are inheritablefor outstanding debt.
Inheretance rules are matrilineal in Akan-speakingareas and patrilineal in the north, and among theVolta and Ga. The matrilineal system is flexible,allowing for a variety of possible heirs and ways toinherit land. Patrilineal areas in the south sufferfrom fragmentation into parcels too small to beeconomically viable.
Rules vary between communities; the Kongo arematrilineal, while the Zande Vungara are patrilineal.

The Gambia Ivory Coast Ghana DRCUser Rights Owners can reclaim borrowed land in land
scarce areas. Use rights (rights to build ahouse/other structures, control water, andplant fruit trees) are more common than torent or lend out land. Those who sell landusually have all other land rights. Primaryright holders can grant “secondary” rights(usually exclude ability to plant trees).Pastures, mangroves, streams and mostforests are commons available for huntingand gathering. Common-property regimes arefrequent, but not open access ones. Alkololu(local chiefs) and seyfolu (head chiefs) candetermine a tongo – a seasonal prohibition onactivities such as harvesting mangoes.
Women can usually only access land throughtheir husbands. A mix of contracts exist that cangive owners and non-owners varying cultivationrights; these include tutorat, busan, bugnon,troukatalan, rental, surveillance or guardianship,and pledging.
Chiefs can grant lesser interests to members of thecommunity. These are typically customary freehold,or usufruct, and give member use rights. The interestis indefinite so long as the land is not abandoned.
Individual rights to the harvest are usually protected.Women may only have access to land through men.The Kivus and Ituri were depopulated during the war.Many squatters arrived from Rwanda and the rest ofthe DRC, setting up on ranches from 1999-2003.With the return of the original land-owners, somehave been evicted, while others have stayed under theprotection of armed groups.
Right to Improve Land
Women and borrowers have fewer land rightsthan owners; they cannot plant trees or mustreceive permission (because these areassociated with permanent rights).Improvement rights are stronger for durableimprovements. A long-term borrowerattempts to strengthen his or her rights byinvesting in wells, trees or fencing can sparkconflict with the landowner.
Individuals can lose land, but retain ownershipover any trees they have planted. In the case ofcoffee and cocoa trees, this has been a source ofconflict.
The Regional Lands Commission must approve any"development or disposition" of stool or skin lands.Families are reluctant to tie up capital in orchardproduction; thus, young family members often remita portion of their crop to their families in return fortaking land out of general use.
State policy under Mobutu demanded obligatoryproduction of certain crops, contributing to foodinsecurity. Often poor land is used for this, causingenvironmental degradation.
Rights of Non-Community Members
Land is often lent, usually on a seasonal basisbut sometimes longer, to settlers from otherethnic groups. Payments may be symbolic oractual tribute, depending on land scarcity.Incomers acquire land from chiefs orfounding families. Secondary rights aretransferred through borrowing, pledging,rental, and sharecropping. District tribunalmembers may grant land to newcomers, incontravention of Lands (Provinces) Act’svesting of power in District Authorities.Individuals tend to believe that authoritiesonly have this power if they gain lineageconsent.
Relations between indigenous cultivators andmigrants are the most important aspect of Ivoriantenure. The 1998 law bars non-Ivorians fromowning rural land. Non-Ivorian farmers can atbest hope for a long-term lease from thecertificate-holder or the state. The Houphouët-Boigny government encouraged migrants, whoobtained land mainly through “tutorat," wherebyone remits a debt of gratitude and continuingregular payments to a local patron or "tuteur".Foreigners, especially the Burkinabe, have beenparticularly vulnerable under the 1998 law.
Strangers (non-subjects) must obtain the chief'spermission to reside in an area. After this is granted,he acquires land from a landowner or the chief, forexample as an "abusa" or "abunu" sharecropper.Abusa has also come to be used by local landless toacquire land. In forest areas, migrants are often inthe majority. Here, chiefs act as landlords. Tenancyis less common in the North, as land is moreabundant, and migrants may obtain land for free.
Strangers have insecure tenure, or none at all. In thesome areas of the Kivus, Rwandan Hutu prisoners areused as forced laborers. Congolese have been forcedinto camps, while Rwandan settlers are brought in totake their land.

The Gambia Ivory Coast Ghana DRCFormal SectorIndividual Acquisition
The State Lands Act, operating only inBanjul and Kombo St. Mary, converts allcustomary tenure into 99 year leases if theoccupant applies for a title by a specifieddeadline; if he does not, he becomes a tenantthat can be evicted by the state.
In 1963 Houphouët-Boigny declared “la terreappartient à celui qui la met en valeur” (the landbelongs to those who develop it). This has sincechanged -- in 2001, one minister declared thatland belongs to the owner, not the farmer. Underthe 1998 law, land holders must obtain a landcertificate within 10 years, and after another 3years individual registration and private propertywill be enforced. Only 12 hectares can beindividually owned; the rest comes in a 25 yearlease from the state, which may be sold,mortgaged, inherited, and renewed. The lengthand expense of the process implies most landremains under community-based tenure.
The 1986 Land Titling Registration Law allows forregistration of land, in order to produce securetenure and reduce fraud in sale. This applies only inAccra, Tema, and Kumasi and is generallyinaccessible to peasants. Squatter rights are notrecognized by law. Though public land is officiallyavailable to all Ghanaians, getting a land lease istime-consuming and expensive, so political andeconomic elites have benefitted most.
Individuals can gain land rights through “perpetual”or “ordinary” concessions from state and mustimprove land during lease. This “mise en valeur”principle implies a concession can be sold orbequeathed, but the state is the proprietor and canrevoke the concession if the parcel is abandoned, notimproved, or transferred without approval. Only aCongolese can have a perpetual concession. Theconcessionaire pays a license fee or rent andeffectively occupies the land for many years. Allchildren (born in and out of wedlock) must divideequally three quarters of the deceased’s estate asinheritance. Land rights cannot be transmittedthrough death without a judge's approval.
State Acquisition and involvement
The 1994 coup of Yayeh Jammeh mantainedthe status quo on tenure issues. All land notin freehold in Banjul and Kombo St. Mary isvested in the state, as are resources such asforests, watercourses and expropriated land(State Lands Act, 1990). The LandAcquisition Act permits governmentappropriation of land for a broad range of“public purposes,” including defense,conservation, and planning.
The 1998 law vests all unregistered land in thestate. Though a 1962 law asserted state ownershipover all land, the government allowed farmers toretain land used in production. Governmentattempts to delineate mining, forest and touristlands have been ineffective. Politicization of theland question has become part of the largerpolitics of Ivorianness.
“Public land” categories in Ghana are (i) landcompulsorily acquired (under the 1962 State LandsAct), and (ii) land invested in the president (1962Administration of Lands Act). The State Lands Actallows the state to acquire any land “in the publicinterest.” Outstanding compensation claims on thegovernment are more than $100 million USD, withsome claims dating back to the 1970s.
The 1973 General Property Law made all lands,including forest resources, state property. Edict 81-013 of 1981 and Constitution Article 10 make theunder-soil, including mineral and petroleum wealth,state property. The Mobutu “kleptocracy”encouraged land tenure “informalization” whichallowed favored groups and individuals to expropriateland. The political deadlock between Mobutu andparliament in the early 1990s prevented legal redressto resolve the agricultural crisis or land-related issues.
The Role of War During the 1990s
N/A The 1998 law 98750 on Rural Land Tenure hasnot been effectively enacted. Article IV of theLinas-Marcoussis Agreement (2003) reaffirmsthis law and charges the Government of NationalReconciliation with implementation. The AccraIII agreement of July 2004 specified changes toland tenure laws in the Linas-MarcoussisAgreement were to be implemented by August2004. This deadline was not met.
N/A Land conflict between Hema and Lendu in Ituri has along history. ‘Zairianisation’ involved transferringseveral foreign concessions to Hema, and conflictsover these concessions are frequent. Violence since1999 has displaced half a million people from Ituri,killed 50,000 and caused the state to lose control ofseveral areas. Forced migration, crop theft by armedforces, and short-run gains to mining coltan, gold anddiamonds led many to abandon food production.Illegal resource exploitation by foreign armed groupshas affected locals' land access.
Sources: Toure, 2003; Knox, 1998; Chavas, Petrieand Roth, 2005; Freudenberger, 2000. (Urbanizationdata from 2005 World Population Data Sheet, Riskof Expropriation from Acemoglu, Johnson andRobinson, 2001, originally from the IRIS-3 dataset,legal origin from The International Institute forCorporate Governance at the Yale School ofManagement, and ethnic and religious data from theCIA World Factbook)
Sources: Chauveau, 2000; Chauveau, 2002; Furth, 1998;Conte, 2004; Crook, no date; Human Rights Watch, 2004;Linas-Marcoussis Agreement, 2003; USDA ForeignAgricultural Service, 2004, Koné, 2002. (Urbanizationdata from 2005 World Population Data Sheet, Risk ofExpropriation from Acemoglu, Johnson and Robinson,2001, originally from the IRIS-3 dataset, and legal originfrom The International Institute for Corporate Governanceat the Yale School of Management)
Sources: Toure, 2003; Wily and Hammond, 2001; Kasangaand Kosey, 2001; Asiama, 2003; Ministry of Lands andForestry, Ghana, 2003; Amanor, 1999; Mahama, 2003,Knox, 1998. (Urbanization data from 2005 World PopulationData Sheet, Risk of Expropriation from Acemoglu, Johnsonand Robinson, 2001, originally from the IRIS-3 dataset, andlegal origin from The International Institute for CorporateGovernance at the Yale School of Management)
Sources: Huggins et al., 2005; Leisz, 1998; Aide et ActionPour la Paix, 2004; African Development Fund, 2004; Hart andDucarme, 2005; Vlassenroot and Huggins, 2004; Moyroud andKatunga, 2002. (Urbanization data from 2005 WorldPopulation Data Sheet, Risk of Expropriation from Acemoglu,Johnson and Robinson, 2001, originally from the IRIS-3dataset, and legal origin from The International Institute forCorporate Governance at the Yale School of Management)

Country Institution Measure (Paper)
Indonesia Political Connections (Fisman)
China (importer) Hongkong (exporter)
Evasion Gap: Difference between reported exports to a country and imports reported by receiving country (Fisman and Wei)
India Tariff changes (Topalova)
Colombia Brazil
Tariff changes (Pavcnik and Goldberg)
Intellectual Property Rights India
Assessment of patent protection (Chaudhuri, Goldberg and Jia)
Without price regulation or compulsory licensing, total annual welfare losses to the Indian economy from withdrawal of 4 domestic product groups in the fluoroquinolone sub-segment would be about 118% of the entire sales of the systemic anti-bacterials segment of pharmaceuticals in 2000.
Legal Formalism; Contract Repudiation
India Debt Relief Tribunal (Visaria) State court efficiency (Chemin)
Visaria exploits variation in spread of debt tribunals, and in which firms were affected by it, to shows that tribunal establishment reduced loan repayment delinquency in loan by 3-10 percent.
Argentina Privatization of water services (Galiani, Gertler, and Schargrodsky)
China Community Public Firm (Jin and Qian)
Mexico Savings institution (Aportela)
India
Rural bank branch expansion (Burgess and Pande) Change in eligibility for formal sector loan (Banerjee and Duflo) Financial development (Bell and Rousseau)
South Korea Financial restraints (Demetriades and Luintel)
Labor Market Institutions India Labor Regulation (Besley and Burgess)
Regulating labor market in a pro-worker direction lower investment, employment, productivity and output in registered manufacturing. Pro-worker amendments to the Industrial Disputes Act increase urban poverty.
Ethnolonguistic Fractionalization Kenya
Ethnolinguistic Fractionalization (Miguel and Gugerty)
Variation in ethnic diversity across schools is used to show that such diversity lowers primary school funding and worsens school facilities.
Ghana Kinship patterns (La Ferrara)
Taiwan ROSCAs (Kan)
Land Rights
TABLE-4: Institutions and Development: Within Country Evidence
Protection against expropriation risk; Index of Government Antidiversion policies; ICRG Index
Index of country openness
Within Country Counterpart
Fisman exploits differences in share price reactions to news about former President Suharto's health of firms with varying degrees of political exposure to show that political connections can account for upto a quarter of a firm’s share price.
Topalova uses variations in exposure of Indian districts to trade liberalization to show that districts whcih witnessed the largest reductions in trade protectionism saw the least fall in poverty.
Institutions in Cross-country literature
Privatization
Financial Intermediation
Trust
Democratization
Findings -- an illustration
Galiani, Gertler, and Schargrodsky exploit time-series variation in the privatization of water servies across Argentinian municipalities to show that water privatization improved access, expanded service, and reduced child mortality.
La Ferrara shows that about 67 percent of the total amount borrowed is borrowed from potential kinsmen, and suggests this is as membership in a dynastically linked community shapes individual incentives in economic transactions .
See Table 4
Burgess and Pande exploit the introduction and subsequent removal of a branch licensing program in India which constrained branch openings in already banked areas and increased branch opening in rural unbanked areas to show that rural branch expansion significantly lowered rural poverty, and increased non-agricultural output.
India
Political representation and decentralization (Foster and Rosenzweig, Bardhan andMookherjee, Pande, Chattopadhyay and Duflo, Besley, Pande and Rao and Faguet)
Pande exploits quasi-random variation in mandated political representation for disadvantaged groups to show that it increased targeted redistribution towards these groups.

Country (Paper) Outcome Data Set Policy Findings
Year: Not given
Region: Wassa and AnlogaUnit: 334 households with 1568 fields
Year: 1987-1988
Region: 10 rainfed agriculture regions
Unit: Farm surveys
Year: 1988
Region: Nyeri and Kakamega
Unit: 406 households with 463 parcels
Year: Not given
Region: Njoro division
Unit: 109 households (plot-level data)
Year: 1991-1992
Region: Murang'a (Kenya) and Moshi (Tanzania)Unit: 230 households Year: 1987Region: The "Peanut Basin"
Unit: 48 compounds holding 351 parcels
Year: 1987-1989
Region: Kigezi District
Unit: 148 registered and unregistered smallholders and registered largeholders with 226 parcels (Stratified sample)
Land registration in Kenya, abolition of private title in Tanzania.
No land-secured loans in Tanzania and only two in Kenya,so titling has not increased credit use. There is moreinvestment in Kenya, but this is due to cash-crop policy,not titling. Differences in inequality are due to differingpractices of land partition at inheritance, not land policies.
KENYA & TANZANIA Pinckney and
Kimuyu (1994)
i. Access to Credit ii. Investment iii.Land Market iv. Inequality
i. 1906 Regime d'immatriculation: allowed some to apply for registration. ii. Law of National Domain 1964: stopped new registrations.
Very few original registered titles, and these were ownedby the elite. No surviving investments on titled land buttitle is used to obtain credit. Areas more affected by theLaw of National Domain have greater tenure insecurity. Nolink between tenure security and farm investments.
GHANA Besley(1995)
i. Land Rights ii. Productivity
NoneHaving a deed has a significant positive effect on landrights that require approval in Wassa. In Anloga, thecorrelation is negative, suggesting lineage sanctions andtitle are substitutes. Land rights increase productivity.
Empirical strategies used in the papers are n the notes below.PANEL A: AFRICA
GHANA, RWANDA AND
KENYA Migot-Adholla et
al. (1991) Place and Hazell
(1993)
i. Credit Use ii. Inputs iii. Investment iv. Yields
None
SOMALIA Roth, Unruh, and Barrows (1994)
i. Perceived Benefits ii. Land Value iii. Tenure Security iv. Credit Access v. Investment
Agricultural Land Law (1975): sets out registration procedures; individuals can apply at the local district level, though officials are sometimes instructed to find unregistered land for "outsiders."
KENYA Migot-Adholla,
Place and Oluoch-Kosura (1994)
(hereafter MPO) Place and Migot-
Adholla 1998) (hereafter PM)
i. Investment ii. Output iii. Determinants of Title iv. Access to Credit
Registered Land Act (1963): individualizes land rights while giving land committees considerable control over land transactions.
Registered and unregistered farmers perceive registrationincreases tenure security, the propensity to sell or leaseland, access to credit, and investment. The marginal effectof registration on land value is 44 300-57 300 SSh. Titlehas an overall negative but insignificant effect onperceived tenure security (significant for small-holderswith high quality land). The link between title and accessto credit is positive but insignificant, except for largelandowners, for whom registration brings access to formalcredit.
i. Squatter Settlement Scheme: opened forest reserve to settlement, redistributed ex-European land. ii. Fourth Development Plan (1979-1983): approved de facto subdivisions of land.
No clear relationship between land registration andproductivity (Migot-Adholla et al (1991)). Place and Hazell (1993) focus on land rights. Effects of land rights on creditare mixed; in one village, they increase moneylenderborrowing; in another they decrease borrowing for foodconsumption. Land rights did not significantly affect inputuse. Strongest positive relationship between land rights andinvestment was for long-term investments in Rwanda;elsewhere mixed results. No significant relationshipbetween land rights and yield.
Land title and land rights have limited effect on farminvestments, and none on yield (MPO). Rights tend to be"more comprehensive" on titled and registered parcels, butmany cannot be sold or mortgaged (because (i) famers withsecure tenure do not obtain titles, and (ii) indigenoustenure systems). Registered parcels are slightly moresubject to litigation. Title does not affect credit use, buttitles owned by close relatives and access to credit areweakly positively correlated. Male household heads and alack of previous subdivision increases title and registration.Predicted title has no effect on yield (PM).
"Untitled" farms produce 20% less than titled ones. Titledfarms are more productive but note this may be due tocorrelation between titling and farmer/farm characteristics.In fixed effect regressions, mixed results for output with noevidence of security-induced demand for inputs.
SENEGAL Golan (1994)
i. Investment ii. Credit Access
KENYA Cartier, Wiebe and
Blarel (1994)
i. Input Use ii. Output
Table-5: Impact of Land-titling and Registration Programs: Micro Evidence

Country (Paper)Outcomes of Interest Data Set Policy Findings
Year: 1987
Region: Kigezi District
Unit: 228 households with 505 parcels
Year: 1979-1993
Region: West Bengal and Bangladesh
Unit: District
Year: 1993
Region: Aurepalle and Dokur, Andhra Pradesh
Unit: Survey of 291 households with 563 plots.
Year: 1983
Region: Manila
Unit: 1688 households
Year: 1987
Region: Lop-Buri, Nakhon Ratchasima, and Khon-Kaen ProvincesUnit: 48 compounds
Year: 1991/92 and 1995/96
Region: National
Unit: Household survey
Year: 1992-1993 and 1997-1998
Region: Not available.
Unit: panel of 4000+ households. Province-level data on LUC issuance in 1994, 1998 and 2000.
Land Code (1954), which created both title deeds and utilization certificates for private land.
VIETNAM Do and Iyer (2003)
i. Investment ii. Productivity iii. Credit Access iv. Land Transfers
Land Law (1993), which allows for transferable leases from the state implemented using Land Use Certificates (LUCs).
UGANDA Roth, Cochrane and Kisamba-
Mugerwa (1994)
i. Investment ii. Perceived Benefits
Operation Barga (1977), which gave tenure security to registered sharecroppers
Rujumbura Pilot Land Registration Scheme (1958)
Households compelled to register their parcels receive lesscash income and remittances, and are significant coffeeproducers. Those with voluntarily registered parcels ownmore productive capital. Dispute incidence is lower forregistered land. Registration significantly increases farminvestments, with the effect more widespread for voluntary(relative to compulsory) registration.
Relative to Bangladesh, the program raised sharecropperproductivity in W.Bengal by 51%. Fixed-effects estimatesuggests the program boosted sharecropper productivity by62 %.
PANEL B: ASIA
i. Productivity
Titled households increase proportion of multi-year cropsby 7.5% relative to untitled farms, at the expense ofannuals. Titled households increase irrigated area by 20%and labor inputs by 4.5 weeks. Impact of title on creditaccess is insignificant, but it does have a positive effect onland transfers.
No specific policy; most land is held in formal title, "assigned" land has been granted to poorer residents who receive non-transferable usufruct rights.
Assigned land has a negative effect on supply and demandfor moneylender and institutional credit. Adult malesincrease investment on assigned plots but decrease it ontitled plots. Effect of household characteristics oninvestment is greater on titled plots. Share of land subjectto sales restrictions has no effect on decision to cultivate inAurepalle, and a negative effect in Dokur.
None
Formal sector units are worth more than squatter units, andthis difference shrinks with age of squatter unit. Concretefoundations, several stories or locating in richer areasignals low eviction risk, even in absence of title. A ten-year old residence sells for 25% more if it were in theformal sector.
Land Titling Project, Phase 2, 1991-1994
Credit use increased faster in provinces where the programwas implemented. This increase was greatest in provincesthat were poorest at the outset. Results for productivitywere too sensitive to model specification to be useful.Anecdotal information suggests titles increase land values.The estimated rate of return from the program is 34%.
Titles increase capital accumulation, except in Lop-Buri,where there is an ample non-institutional credit, morecommercialization, and lower-risk cash cropping.Investment in bunding of land and clearing of stumps arepositively affected by land title, but effects areinsignificant in Lop-Buri.
INDIA Banerjee, Gertler
and Ghatak (2002)
THAILAND Feder and Onchan
(1987)
THE PHILLIPINESFriedman, Jimenez and Mayo (1993)
Land Value
THAILAND Pagiola (1999)
i. Program Benefits ii. Rate of Return iii. Credit Access
INDIA Pender and Kerr
(1999)
i. Credit Use ii. Investment iii. Land Use
i. Investment ii. Credit Access

Country (Paper)Outcomes of Interest Data Set Policy Findings
Year: 1991-1994 (Conflict), 1985 (Census Data)
Region: ParaUnit: 105 Municipos
Year: 1940-1970 (Para) and 1870-1985 (Parana)
Region: Para and Parana
Unit: 206 householdsYear: 1996 Region: Guayaquil
Unit: 400 households (1921 individuals)
Year: Not given
Region: Peten
Year: 1983-1994
Region: Santa Barbara and ComayoguaUnit: 450 farm households
Year: 1996 and 1999
Region: National
Unit: 2476 households (3212 plots)
Year: Not given
Region: National
Unit: 921 households with 975 plots of land
Year: 1996 and 1999
Region: National
Unit: 2476 households (3212 plots)
Year: 1987
Region: Paraguari, San Pedro and Itapua
Unit: 48 compounds holding 351 parcels
Year: 1997-1999
Region: Cajamarca
Unit: 847 parcels
Complete formal documents improve tenure security.Formal title deeds increase probability of publicregistration and permanent crop cultivation, and reduceperceived future tenure conflict. Formal title has a smallpositive effect on land value and none on credit. Land-reform documents increase registration and tenure security,but effects are smaller than the impacts of formal title.Further, they do not affect permanent crop cultivation.
NICARAGUA de Laiglasia (2004)
i. Investment ii. Determinants of Registration iii. Credit Access
Programa Nacional de Catastro, Titulacion y Registro, since 1992, which encourages titling and registration.
Land registration increases the probability of land-attachedinvestment by 35% -- the specific type of title (excludingindigenous forms) is unimportant. No link between creditand land registration.
i. Land Title Registrationii. Perceived Tenure Insecurityiii. Land Useiv. Land Valuesv. Credit Accessvi. Agricultural Production
1997 legislation sanctioning ownership by beneficiaries of Sandinista redistribution
NICARAGUA Broegaard et al.
(2002)
1992 Titling project initiated by Municipality of Guayaquil
Title increases perceived market value of property by23.5%.
PANEL C: LATIN AMERICA
Squatting, forest clearing and large farms weaken propertyrights, contributing to violent conflict. Value issignificantly related to conflict, and "higher land valuesencourage invasions and evictions."
Title has a positive and significant effect on land value,independent from its impact on investment, whichdecreases with distance. The increase in land valuepredicted by the value regressions has a positive but lesssignificant impact on title acquisition. Title increasesinvestment.
Land Administration Project
The estimated rate of return is 12.3%, and the profitabilityof the program is robust to several changes in assumptions.
No specific policy; titling is administered by state governments.
i. Land Value ii. Perceptions of Tenure Security iii. Ability to Transfer Land
EQUADOR Lanjouw and Levy
(2002)
Programa Nacional de Catastro, Titulacion y Registro, since 1992, which encourages titling and registration.
Full registration increases investment; title withoutregistration has only an insignificant impact. Registrationaffects plot-level, not household-level, investment,suggesting access to credit is unaffected. Registrationincreases land values by 30% (same effect as 20 years ofcontinuous possession).
GUATEMALA Pagiola (1999)
i. Program Rate of Return
i. Productivity ii. Investment iii. Access to Credit
Project funded by USAID, initiated in 1983.
Average investment for USAID-funded farmers was twicethat of others. A greater proportion of these farmersreceived credit, and in larger amounts. The difference inyields between the two groups was statistically significantin 1993 but not 1983. Rate of return to the titling projectwas 17%.
BRAZIL Alston, Libecap,
and Mueller (2000)i. Violent Conflict
Formal Settlement Programs organized by the government agency INCRA
BRAZIL Alston, Libecap, and Schneider
(1996)
i. Supply and Demand for Title ii. Land Value iii. Investment
HONDURAS Lopez (1996)
PERU Antle, Yanggen,
Valdivia, and Crissman (2003)
NICARAGUA Deninger and
Chamorro (2003)
Investment
i. Investment ii. Credit Access
PARAGUAY Carter and Olinto
(2000)
i. Investment ii. Land Value
No General Progam: Land can be either "Titled" or "Formal" but untitled.
Legal security improves attached capital and has anegative impact on movable capital. Positive impact of titleon investment weaker for liquidity-constrained farms, andreductions in movable capital are not offset by increases inattached capital for small farms. Below 3 hectares no effecton credit rationing probability.
Proyecto Especial de Titulacion des Tierras (Special Land Titling Project), encourages farmers to obtain titles.
Accounting for endogenous titling, titling increases themean probability of terracing from 25.8% to 32.4%.

Country (Paper)Outcomes of Interest Data Set Policy Findings
Year: March 2000 (middle of the program)
Region:Urban
Unit: 2750 households
Alston, Libecap, and Mueller (2000)
Alston, Libecap, and Schneider (1996)
Antle, Yanggen, Valdivia, and Crissman (2003)
Banerjee, Gertler and Ghatak (2002)
Besley (1995)
Broegaard et al, (2002)
Carter and Olinto (2000)
Cartier, Wiebe and Blarel (1994)
de Laiglesia (2004)
Deninger and Chamorro (2003)
Do and Iyer (2003)
Dowall and Leaf (1991)Feder and Onchan (1987)
Field (2003), Field and Torero (2004)
Friedman, Jimenez andMayo (1993)
Golan (1994)
Lanjouw and Levy (2002)
Lopez (1996)
Notes on empirical strategies used in above papers:
Conflict incidence estimated as a function of settlements, squatting, forest clearing, farm size, value, and number of establishments.Instrument for settlements are federal versus provincial jurisdiction, distance from state capital, and area of projects receivinginstitutional credit.
PERU Field (2003)
Field and Torero (2004)
i. Labor Supply (Field) ii. Credit Access (Field and Torero)
i. Committee for the Formalization of Private Property ii. Decree 424: Law for Formalization of Informal Properties (1996): From 1992 to 1997 over 1.2 million urban households given formal property titles.
Untitled households work 17% less hours than those withtitles and are 47% more likely to work inside the home.Titled households are 28% less likely to engage in childlabor (Field). Untitled households are 10% less likely to beapproved for formal sector loans. Titling does not affectprivate sector approval rates, but lowers the interest rate by9% (Field and Torrero).
Census ans survey data for land value and investment, survey data for determinants of land titling, land value and investment.Expected change in value and landholder characteristics are used as instruments for title.
Impact on terracing on title with farm size and years of ownership as instruments for obtaining land title.
Difference-in-differences comparisons of yield per acre using district panel data with West Bengal as treatment and Bangladesh as acontrol group. Exploit over time variation in sharecropper registration rates in West Bengal for fixed effects model.
Effect of transfer rights on productivity using title deed as instrument for transfer rights.
Titles are instrumented using wealth and education.
Simulated maximum likelihood to separate liquidity constrainted and unconstrained households. Impact of title status on attachedand unattached capital estimated using OLS first-differences.
Compare farms with and without titles. Plot level regression with farm fixed effects for 26 farms with plots under a variety ofarrangements.
Investment from 1996 to 1999 as a function of tenure status. Household fixed effects are used to deal with unobserved heterogenity,and endogeneity is controlled for by repeating the regression only for households participating in legalization and by instrumentingregistration with documents held.
Probit for the effect of title on investment occuring and tobit for the amount of investment. The impact on land values useshousehold fixed effects.
Differences-in-differences approach, with provincial LUC rates are used to measure the probability that a household benefitted.Registration rates do not appear endogenous.
Simple regressions, not controlling for endogeneity, and comparison of average land prices.Regressions of capital stock on titles, with father's landholdings instrumenting for quality-adjusted amount of land. Logit estimatesfor the adoption of land improvements, without instrumentation.
Uses differences across regions induced by the timing of the program, and differences across target populations in the level of pre-program tenure security.
Logit estimations of determinants of squatting. Hedonic regressions of dwelling value.
Compare survey data from two villages differentially affected by the law of National Domain. (no regressions). Linear regression where dependent variable was what the respondent thought would be the change in land value if he or she were togain or lose title.
In addition to comparing descriptive statistics, factors that were statistically similar between USAID and non-USAID farmers in1983 and dissimilar in 1993 were identified. Yield was insignificantly different in 1983, but significantly different in 1993.

Migot-Adholla et al (1991)Migot-Adholla, Place and Oluoch-Kosura (1994)
Pagiola (1999)
Pender and Kerr (1993)
Pinckney and Kimuyu (1994)
Place and Hazell (1993)
Place and Migot-Adholla (1998)
Roth, Cochrane and Kisamba-Mugerwa (1994)
Roth, Unruh, and Barrows (1994)
Notes on empirical strategies used in above papers:
Details are not available (table information is based on a description in Feder and Nishio (1998)).
Estimate effect of title on (i) fourteen types of farm investment (ii) yield
For Thailand, he takes results from other studies about the benefits of land titling in Thailand before producing a cost-benefitanalysis, while for Guatemala he uses observed willingness to pay to measure benefits.Maximum likelihood switching regressions are used to separate the effects of title on credit demand and supply. Because of thesimultaneous occurance of land use and investment, and possible dependence on previous investment a "simultaneous tobit-probit"model was created for this paper.
Comparison of two samples (no regressions).
Household fixed effects are used to deal with unobservables, but no instruments are available to tackle endogeneity.
Comparison of descriptive statistics. Predicted title is used as an explanatory variable in the credit and investment equations; due tolack of variation in predicted title, error-components GLS was used.
Estimate effect of registration on six types of investment.
Regressions with land value and investment demand as outcomes. Do not account for endogenous registeration.

Determine Inheritance Rent Out Lend Out Sell
(1) (2) (3) (4)
Non-office holders 6 22 32 15
Office holders 26 53 60 32
t-test for equality 6.41 6.74 5.83 4.34
Number of observations 575 576 576 575
Percent of Cultivated Plots on which Respondent Claims Right to:
Table-6: Perceptions of Land Rights
Notes:

Fallow Duration Plot Profit Fallow
DurationFallow
Duration(Years) (1000 cedis) (Years) (Years)
OLS IV OLS Individual F.E.
(1) (2) (3) (4)
Fallow duration 314(182)
Female -0.430 143 -0.921(0.54) (426) (0.36)
1 if resp. holds trad. office 1.950 3.085(0.80) (0.64)
Commercially-obtained plot 0.633 0.698(0.34) (0.24)
Office*Commercially-obtained -0.407(0.78)
1 if first of family in town 0.290(0.64)
Years family/resp lived in village 0.010(0.01)
Number of wives of father 0.520(0.23)
Number of father's children -0.020(0.05)
Parity of mother in father's wives -0.420(0.36)
1 if fostered as child 0.350(0.61)
Size of inherited land -0.520(0.57)
1 if mother had any education 0.960(1.05)
1 if father had any education -0.980(0.63)
Table-7: Fallow Duration, Profits, and Political Office
Notes: All regressions include plot controls (deciles of area, indicators of soil type,toposequence, and location), full set of plot characteristics, full set of familybackground variables, household and spatial fixed effects. All regressions also includespatial fixed effects, with radius of 250 meters. Standard errors,corrected for spatialcorrelations as in Conley (1999), are given in parentheses.

(1) (2) (3)Last Fallow Duration Last Fallow Duration Last Fallow Duration Parameter Estimate Parameter Estimate Parameter Estimate
Female 0.12 -0.66 -0.69(0.45) (0.35) (0.60)
Office 2.67 3.88 -2.44(0.45) (0.63) (2.21)
Talk Frequently w/Office Holder 2.05(0.53)
Households in Abusua/ha -0.23 -0.63(0.05) (0.58)
Office*Households in Abusua/ha 3.38(1.37)
Number of observations 323 368 368
Quintiles of Population Density 25% 50% 75%Households in Abusua/ha 1.08 1.91 2.60
Table-8: Fallowing, Networks and Abusua Resources
Notes: All specifications include full set of plot characteristics, full set of family background variables, and householdfixed effects. All regressions also include spatial fixed effects, with radius of 250 meters. Standard errors,corrected forspatial correlations as in Conley (1999), are given in parentheses.
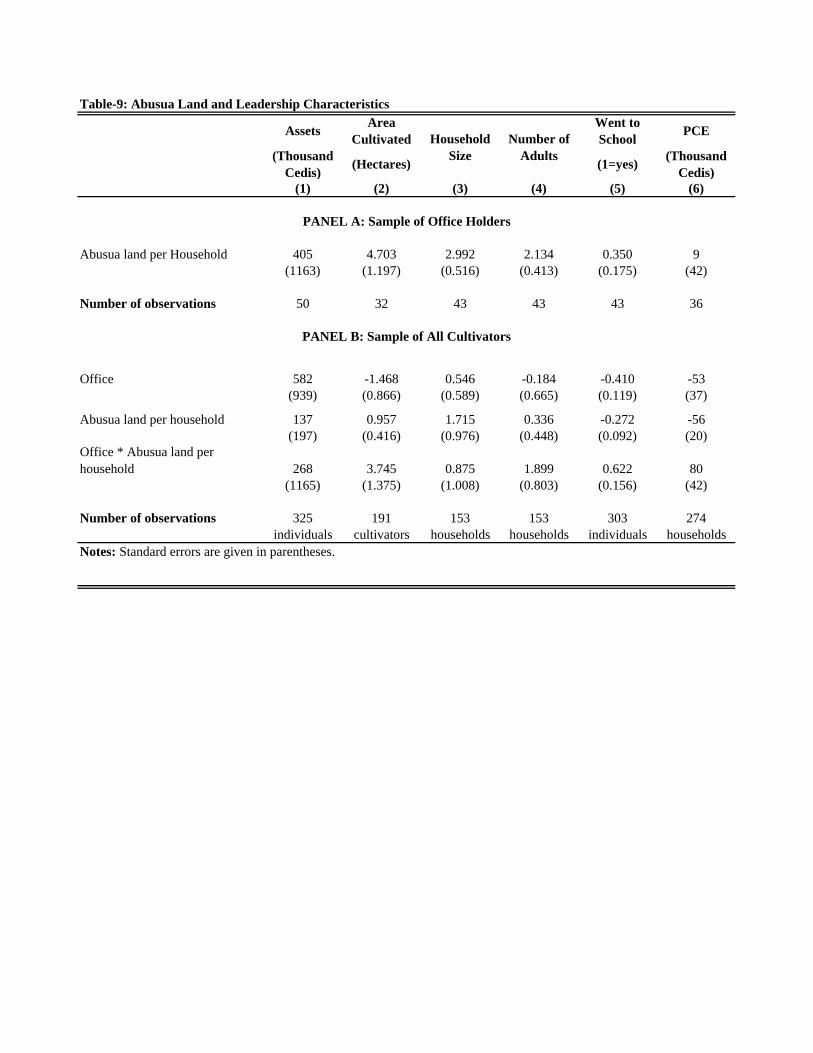
Table-9: Abusua Land and Leadership Characteristics
Assets Area Cultivated
Went to School PCE
(Thousand Cedis) (Hectares) (1=yes) (Thousand
Cedis)(1) (2) (3) (4) (5) (6)
Abusua land per Household 405 4.703 2.992 2.134 0.350 9(1163) (1.197) (0.516) (0.413) (0.175) (42)
Number of observations 50 32 43 43 43 36
Office 582 -1.468 0.546 -0.184 -0.410 -53(939) (0.866) (0.589) (0.665) (0.119) (37)
Abusua land per household 137 0.957 1.715 0.336 -0.272 -56(197) (0.416) (0.976) (0.448) (0.092) (20)
Office * Abusua land per household 268 3.745 0.875 1.899 0.622 80
(1165) (1.375) (1.008) (0.803) (0.156) (42)
Number of observations 325 191 153 153 303 274 individuals cultivators households households individuals households
PANEL A: Sample of Office Holders
PANEL B: Sample of All Cultivators
Notes: Standard errors are given in parentheses.
Household Size
Number of Adults

Table-10: Responses to Land Scarcity
Nonfarm Activity
Cultivation of Commercially-Obtained Plots
(Hours/Day) (% of total cultivated area)
(1) (2)
Office -4.169 -0.219(1.078) (0.143)
Abusua land per household -2.415 -0.392(0.978) (0.122)
Office * Abusua land per household 5.534 0.489(1.418) (0.319)
Number of observations 325 222Notes: All specifications include full set of plot characteristics, full set offamily background variables, and household fixed effects. All regressions alsoinclude spatial fixed effects, with radius of 250 meters. Standarderrors,corrected for spatial correlations as in Conley (1999), are given inparentheses.


![· Web view5. Below is a side view of a cup and saucer. Draw the plan view of the picture. [3]](https://static.fdocuments.in/doc/165x107/614311f47bbb8b3311173924/web-view-5-below-is-a-side-view-of-a-cup-and-saucer-draw-the-plan-view-of-the.jpg)