Institutional Real Estate, Inc. Global Investment...
27
Institutional Real Estate, Inc. Global Investment Managers 2013 Special Report PROPERTY FUNDS RESEARCH 6 St. Giles Court, Southamption Street Reading RG1 2QL United Kingdom Phone: +44 (0)118 958 5848 • Fax: +44 (0)118 958 5849 www.propertyfundsresearch.com INSTITUTIONAL REAL ESTATE, INC. 2274 Camino Ramon, San Ramon, CA 94583 USA Phone: +1 925-244-0500 • Fax: +1 925-244-0520 www.irei.com Prepared by:
Transcript of Institutional Real Estate, Inc. Global Investment...

Institutional Real Estate, Inc.
Global Investment Managers 2013
Special Report
PRoPeRty FundS ReSeaRch6 St. Giles court, Southamption Street
Reading RG1 2QL united KingdomPhone: +44 (0)118 958 5848 • Fax: +44 (0)118 958 5849
www.propertyfundsresearch.com
InStItutIonaL ReaL eState, Inc.2274 camino Ramon, San Ramon, ca 94583 uSaPhone: +1 925-244-0500 • Fax: +1 925-244-0520
www.irei.com
Prepared by:

Prepared by:
Property funds research6 St. Giles Court
Southampton StreetReading RG1 2QLUnited Kingdom
Phone: +44 (0)118-958 5848Fax: +44 (0)118-958 5849
www.propertyfundsresearch.com
Institutional Real Estate, Inc.2274 Camino Ramon
San Ramon, CA 94583 USAPhone: +1 925-244-0500Fax: +1 925-244-0520
www.irei.com
© 2013 Institutional Real Estate, Inc.All Rights Reserved
Special Report
Institutional Real Estate, Inc.
Global Investment Managers 2013

T a b l e o f C o n t e n t s :
Introduction ............................................................................................................................................................................... 1
Largest investment managers by region ............................................................................................................................. 3
Total assets rankings ................................................................................................................................................................ 4
Discretionary separate accounts ........................................................................................................................................ 10
Advisory separate accounts ................................................................................................................................................. 13
Indirect real estate vehicles ............................................................................................................................................... 16
About Institutional Real Estate, Inc. and Property Funds Research ......................................................................... 21
S p e c i a l R e p o r t
Institutional Real Estate, Inc.
b

S p e c i a l R e p o r tInstitutional Real Estate, Inc.
1
In recent years, several investment man-agers have deployed their own versions of the “special sauce” to super-size
their assets under management and jump to the top of the global real estate invest-ment manager rankings. Through aggres-sive growth and M&A strategies Brookfield Asset Management, CBRE Global Investors and The Blackstone Group have distanced themselves from the rest of the pack, based on a global survey of real estate investment managers conducted by Property Funds Research (PFR) and Institutional Real Estate, Inc. (IREI).
The industry’s Big Three maintained a sizeable lead over their peers. Brookfield Asset Management remains at the top of the rankings with more than €87.5 billion of assets under management, followed by CBRE Global Investors (€68.7 billion) and The Blackstone Group (€67.2 billion). (See the “Total assets rankings” table on page 4.)
The significant growth experienced by the industry and its leading firms is also reflected in the aggregate AUM figures for the top 100 investment managers. The total came in at €860 billion in 2008, climbed to €1.39 trillion in 2011, and then increased another 12 percent to €1.44 trillion in 2012. The rankings also show that industry dominance by a few large firms is more prevalent than ever. The top 20 firms in this year’s survey collectively claim more AUM (approximately €810 billion) than the remaining 122 firms pooled together (€639 billion). The top 20 firms control 56 percent of the aggregate AUM reported by the 142 firms in the survey,
while the top 10 investment managers control 35 percent of the asset pool.
“Globalisation and consolidation are driv-ing forces in the industry and are fuelling growth and M&A activity among the larg-est firms,” notes Geoffrey Dohrmann, presi-dent and CEO of Institutional Real Estate, Inc. “The larger institutional investors are trying to reduce their number of invest-ment manager relationships and also estab-lish global portfolios. In response, global investment managers are offering one-stop shopping with an expanded menu of global investment products.”
Seventeen of the top 20 largest invest-ment managers have assets spread across North America, Europe and Asia.
Growth storyTo put the growth of the industry into per-spective, consider that in 2003 a real estate investment manager with €16 billion of assets under management would have ranked among the largest firms in the industry. Today, after a decade of growth and consolidation, a firm
with €16 billion of AUM barely cracks the top 25. Some firms grew their asset base through new busi-
ness and M&A activity. In addition, a healthy dose of asset appreciation contributed to higher year-over-year AUM fig-ures for nearly 75 percent of the investment managers that responded to the survey for each of the past two years. The biggest mover was The Blackstone Group, which reported total AUM of €67.2 billion, a nearly 26 percent jump from year-end 2011.
Super size me
Investment managers grow larger as they expand their reach and ride a wave of asset appreciation
by Larry Gray
Executive Summary
◆ Total assets for the top 100 investment managers increased by 11 percent in 2012.
◆ The top 10 investment management firms control 35 percent of total AUM.
◆ The industry’s Big Three — Brookfield Asset Management, CBRE Global Investors and The Blackstone Group — maintained a sizable lead over their peers.

S p e c i a l R e p o r tInstitutional Real Estate, Inc.
2
In addition to ranking as the largest investment manager overall, Brookfield Asset Management also ranks number one in AUM in North America, with assets totalling €87.5 billion, and in Latin America, where it manages real estate assets of €7.6 billion. AXA Real Estate reigns as the largest investment manager in Europe with assets of approximately €45.0 billion. CBRE Global Investors leads the pack in Asia with €7.6 billion of AUM in the region, and The GPT Group ranks number one in the Australasia region with AUM of €11.7 billion.
The PFR-IREI annual survey also ranks real estate manag-ers based on their total AUM in the categories of discretion-ary separate accounts under management, advisory separate accounts and assets, and indirect real estate investment vehi-cles. AXA Real Estate ranks number one in the category of discretionary separate accounts, with more than €27.1 billion of AUM. Principal Real Estate Investors ranks first in AUM for advisory separate accounts with €22.1 billion. In the category
of indirect real estate investment vehicles, The Blackstone Group ranks number one with AUM of €67.2 billion.
A comprehensive copy of the survey results and investment manager rankings can be downloaded at http://publications.irei.com/TIREL-NA-Report09-13.html
Larry Gray is editorial director at Institutional Real Estate, Inc.
The survey was conducted by UK-based Property Funds Research (PFR). PFR is an independent management-owned research business that provides high-quality research and strategic consulting on the UK, European and global institutional real estate markets focusing on the major sources of capital, investment vehicles and investment managers. For more information, please visit www.propertyfundsresearch.com. For additional information on the global fund manager survey, contact Jane Fear at +44 (0)118-958 5848 or [email protected].
Europe38.5%
LatinAmerica 1.3%
NorthAmerica44.9%
Asia5.9%
Australasia5.9%
Other3.5%
2009 2010 2011 20120.00
0.40
0.80
1.20
1.60
€0.93
€1.09
€1.29
Agg
rega
te A
UM
( t
rillio
n)
€1.39
Assets under management by geographic distribution
Realestate funds
63%
Discretionaryseparateaccounts
22%
Advisoryseparateaccounts
16%
Assets under management by investment structure
Top 100 firms in aggregate (AUM, € trillion)
Sources: Property Funds Research; Institutional Real Estate, Inc

S p e c i a l R e p o r t 3S p e c i a l R e p o r t 3Institutional Real Estate, Inc.
Largest investment managers by region
TOP 10 MANAGERS BASED ON EUROPE ASSETS (€ million)Rank Investment manager Europe Total
1 AXA Real Estate 45,046.00 45,256.00 2 CBRE Global Investors 34,889.08 68,792.16 3 Aviva Investors 25,718.29 27,745.66 4 Aberdeen Asset Management 21,580.41 22,505.73 5 IVG Immobilien AG 20,146.00 21,139.00 6 AEW Global 18,038.00 36,553.00 7 M&G Real Estate 17,508.91 19,912.41 8 UBS Global Asset Management 17,019.80 49,118.51 9 LaSalle Investment Management 16,382.70 36,178.46
10 Deutsche Asset & Wealth Management 15,565.00 36,961.80
TOP 10 MANAGERS BASED ON ASIA ASSETS (€ million) Rank Investment manager Asia Total
1 CBRE Global Investors 7,584.58 68,792.16 2 UBS Global Asset Management 7,339.60 49,118.51 3 Secured Capital Investment Mgmt Co 6,547.01 6,547.01 4 Pramerica Real Estate Investors 6,226.18 39,590.76 5 MGPA 5,718.02 8,065.44 6 LaSalle Investment Management 5,688.44 36,178.46 7 Alpha Investment Partners 5,596.66 5,596.66 8 Morgan Stanley Real Estate Investing 4,757.05 26,286.64 9 Invesco Real Estate 4,681.96 38,405.29
10 The Blackstone Group 3,164.29 88,639.00
TOP 10 MANAGERS BASED ON AUSTRALASIA ASSETS (€ million) Rank Investment manager Australasia Total
1 The GPT Group 11,667.05 11,667.05 2 Dexus Property Group 10,285.13 10,290.65 3 UBS Global Asset Management 9,461.01 49,118.51 4 Brookfield Asset Management 8,320.29 87,548.83 5 Charter Hall Group 7,646.64 7,883.14 6 Lend Lease 7,410.15 10,405.74 7 QIC 6,732.99 7,486.22 8 Investa Property Group 5,607.28 5,865.06 9 Federation Centres 5,202.87 5,202.87
10 Morgan Stanley Real Estate Investing 3,577.65 26,286.64
TOP 10 MANAGERS BASED ON NORTH AMERICA ASSETS (€ million) Rank Investment manager North America Total
1 Brookfield Asset Management 69,171.39 87,548.83 2 The Blackstone Group 48,680.88 67,228.98 3 J.P. Morgan Asset Mgmt – Global Real Assets 35,555.76 42,418.29 4 Principal Real Estate Investors 33,972.10 35,289.54 5 Cornerstone Real Estate Advisers 28,177.25 29,478.01 6 CBRE Global Investors 26,318.50 68,792.16 7 Pramerica Real Estate Investors 23,843.65 39,590.76 8 Hines 21,637.30 30,973.16 9 Clarion Partners 20,518.57 21,164.02
10 Tishman Speyer 19,311.86 26,670.42

4
Total assets rankings
4
Institutional Real Estate, Inc.
S p e c i a l R e p o r t
GLOBAL REAL ESTATE ASSETS UNDER MANAGEMENT (gross, € million, as at 31 December 2012)
Rank Investment manager Total Europe North
America Latin
America Australasia Asia Global/Other
1 Brookfield Asset Management 1 87,548.83 2,389.14 69,171.39 7,668.01 8,320.29 — —
2 CBRE Global Investors 68,792.16 34,889.08 26,318.50 — — 7,584.58 —
3 The Blackstone Group 2 67,228.98 14,688.30 48,680.88 489.21 — 3,164.29 206.30
4 UBS Global Asset Management 3 49,118.51 17,019.80 15,298.10 — 9,461.01 7,339.60 —
5 AXA Real Estate 45,256.00 45,046.00 38.00 — — 172.00 —
6 J.P. Morgan Asset Management – Global Real Assets 42,418.29 5,658.10 35,555.76 — — 1,204.43 —
7 TIAA-CREF Asset Management 4 41,841.11 1,584.42 18,048.27 — — — 22,208.41
8 Pramerica Real Estate Investors 39,590.76 6,734.35 23,843.65 2,786.58 — 6,226.18 —
9 Invesco Real Estate 38,405.29 4,506.00 13,978.38 — — 4,681.96 15,238.94
10 Deutsche Asset & Wealth Management 5 36,961.80 15,565.00 18,385.30 — 1,728.80 1,282.70 —
11 AEW Global 36,553.00 18,038.00 17,084.00 — — 1,431.00 —
12 LaSalle Investment Management 36,178.46 16,382.70 12,514.56 — 1,592.76 5,688.44 —
13 Principal Real Estate Investors 35,289.54 325.38 33,972.10 — 155.48 829.75 6.83
14 Hines 1 30,973.16 6,704.77 21,637.30 2,085.00 126.66 419.43 —
15 Cornerstone Real Estate Advisers 6 29,478.01 1,269.66 28,177.25 — 5.16 25.94 —
16 Aviva Investors 27,745.66 25,718.29 183.75 — — 1,843.63 —
17 Tishman Speyer 26,670.42 3,971.29 19,311.86 1,265.87 — 2,121.41 —
18 Morgan Stanley Real Estate Investing 7 26,286.64 5,517.78 12,248.34 87.98 3,577.65 4,757.05 97.84
19 Cohen & Steers Capital Managment 23,971.10 1,681.80 19,105.00 31.01 1,061.43 2,085.79 6.05
20 Aberdeen Asset Management 22,505.73 21,580.41 181.27 — — 744.05 —
21 Clarion Partners 21,164.02 — 20,518.57 645.45 — — —
22 IVG Immobilien AG 1 21,139.00 20,146.00 993.00 — — — —
23 Heitman 19,914.84 3,811.25 15,404.29 — — 699.30 —
24 M&G Real Estate 8 19,912.41 17,508.91 1,097.54 — — 1,305.95 —

S p e c i a l R e p o r tInstitutional Real Estate, Inc.
5
GLOBAL REAL ESTATE ASSETS UNDER MANAGEMENT (gross, € million, as at 31 December 2012)
Rank Investment manager Total Europe North
America Latin
America Australasia Asia Global/Other
25 Starwood Capital Group 18,031.51 3,773.71 13,853.31 232.85 — 171.64 —
27 Colony Capital 17,951.70 4,827.35 11,314.10 — 301.70 1,508.55 —
28 Bentall Kennedy 15,920.80 — 15,920.80 — — — —
29 Henderson Global Investors 15,441.00 13,061.00 2,003.00 — — 377.00 —
30 Standard Life Investments 9 14,813.14 12,013.79 1,933.65 — 295.97 569.74 —
30 Angelo, Gordon & Co 10 14,534.33 398.19 13,053.07 — — 1,083.08 —
31 Prologis 13,808.79 4,382.52 7,046.38 294.28 — 2,085.61 —
32 BNP Paribas Real Estate Investment Management 13,056.00 13,056.00 — — — — —
33 Schroder Property Investment Management 13,049.67 11,805.38 715.25 — 529.04 — —
34 Legal & General Property 12,825.23 12,825.23 — — — — —
35 The GPT Group 1 11,667.05 — — — 11,667.05 — —
36 Westbrook Partners 10,833.06 — — — — — 10,833.06
37 Lend Lease 10,405.74 1,024.81 — — 7,410.15 1,970.78 —
38 Dexus Property Group 11 10,290.65 5.52 — — 10,285.13 — —
39 Scottish Widows Investment Partnership 10,225.53 10,164.86 60.67 — — — —
40 BlackRock 9,649.11 3,061.90 6,399.11 — 188.10 — —
41 SEB Asset Management 12 9,225.29 5,987.28 928.69 — — 2,309.32 —
42 F&C REIT 8,618.80 8,618.80 — — — — —
43 DTZ Investment and Asset Management 8,575.64 8,575.64 — — — — —
44 Cordea Savills 8,222.00 8,222.00 — — — — —
45 Beacon Capital Partners 8,216.45 1,495.45 6,721.00 — — — —
46 Patron Capital 8,165.00 8,165.00 — — — — —
47 MGPA 8,065.44 2,347.43 — — — 5,718.02 —
48 DRA Advisors 8,026.00 — 8,026.00 — — — —
49 Rockpoint Group 7,942.57 1,318.96 6,228.46 6.83 — 388.33 —
50 Paramount Group 7,887.97 — 7,887.97 — — — —
51 Charter Hall Group 7,883.14 236.49 — — 7,646.64 — —

6 S p e c i a l R e p o r tInstitutional Real Estate, Inc.
GLOBAL REAL ESTATE ASSETS UNDER MANAGEMENT (gross, € million, as at 31 December 2012)
Rank Investment manager Total Europe North
America Latin
America Australasia Asia Global/Other
52 La Française Real Estate Managers 7,800.00 7,800.00 — — — — —
53 QIC 7,486.22 535.50 39.57 — 6,732.99 178.16 —
54 Rockspring Property Investment Managers 7,300.00 7,300.00 — — — — —
55 Threadneedle Property Investments 7,274.62 7,274.62 — — — — —
56 Hermes Real Estate Investment Management 7,243.05 6,572.93 206.93 65.73 165.12 232.33 —
57 PATRIZIA Immobilien AG 7,000.00 7,000.00 — — — — —
58 Amundi Real Estate 6,960.00 6,933.00 — — — — 27.00
59 CenterSquare Investment Management Holdings 13 6,643.71 543.06 4,952.73 11.38 214.26 922.29 —
60 Secured Capital Investment Management Co 6,547.01 — — — — 6,547.01 —
61 Greystone Managed Investments 6,127.97 — 6,127.97 — — — —
62 Walton Street Capital 6,126.07 24.80 5,487.29 462.58 — 151.39 —
63 Ares Management 14 5,991.06 1,500.23 4,189.72 12.14 — 288.90 —
64 Investa Property Group 1 5,865.06 257.78 — — 5,607.28 — —
65 Bouwinvest Real Estate Investment Management BV 5,823.00 5,083.00 592.00 — 81.00 67.00 —
66 Alpha Investment Partners 5,596.66 — — — — 5,596.66 —
67 Bouwfonds Real Estate Investment Management 15 5,527.00 5,097.00 430.00 — — — —
68 KBS Realty Advisors/KBS Capital Advisors 5,511.72 — 5,511.72 — — — —
69 Swisscanto Asset Management AG 5,400.71 5,291.37 70.41 — — 38.93 —
70 Rockwood Capital 5,363.89 — 5,363.89 — — — —
71 Federation Centres 1, 16 5,202.87 — — — 5,202.87 — —
72 Grosvenor Fund Management 5,048.70 3,408.55 397.09 — — 1,243.06 —
73 PCCP 4,870.74 27.08 4,843.67 — — — —
74 Quadrant Real Estate Advisors 17 4,812.57 — 4,126.92 — 685.65 — —
75 GLL Real Estate Partners GmbH 4,672.70 2,892.00 1,562.00 164.50 — 54.20 —
76 iii-investments 4,363.00 4,308.00 — — — 55.00 —
77 Warburg-Henderson Kapitalanlagegesellschaft für immobilien mbH 4,352.00 4,352.00 — — — — —
78 Stockbridge Capital Group 4,323.21 — 4,323.21 — — — —

S p e c i a l R e p o r tInstitutional Real Estate, Inc.
7
GLOBAL REAL ESTATE ASSETS UNDER MANAGEMENT (gross, € million, as at 31 December 2012)
Rank Investment manager Total Europe North
America Latin
America Australasia Asia Global/Other
79 Valad Europe 4,300.00 4,300.00 — — — — —
80 Forum Partners Investment Management 4,140.42 3,047.49 — — 802.45 — 290.49
81 American Realty Advisors 3,964.39 — 3,964.39 — — — —
82 Orchard Street Investment Management 3,946.23 3,946.23 — — — — —
83 Partners Group 18 3,890.13 — — — — — —
84 Carmel Partners 3,564.75 — 3,564.75 — — — —
85 Sentinel Real Estate Corp 3,524.56 6.07 3,503.32 — 15.17 — —
86 Royal London Asset Management 3,448.88 3,448.88 — — — — —
87 Harrison Street Real Estate Capital 3,185.52 — 3,185.52 — — — —
88 Tristan Capital Partners 3,100.00 3,100.00 — — — — —
89 Hunt Investment Management 19 2,906.34 83.58 2,822.75 — — — —
90 ASB Real Estate Investments 2,722.00 2,722.00
91 KTR Capital Partners 2,654.60 — 2,654.60 — — — —
92 M3 Capital Partners 2,578.76 1,336.78 919.63 — 132.73 189.61 —
93 Capri Capital Partners 2,562.83 — 2,562.83 — — — —
94 InfraRed Capital Partners 2,471.82 1,450.17 — — — 1,021.64 —
95 GTIS Partners 2,443.75 — 1,551.81 891.95 — — —
96 Unite Integrated Solutions 2,327.04 2,327.04 — — — — —
97 Pradera 2,300.00 2,300.00 — — — — —
98 NIAM 2,292.00 2,292.00 — — — — —
99 Pearlmark Real Estate Partners 2,271.58 2,271.58 — — — — —
100 Benson Elliot Capital Management 2,000.00 2,000.00 — — — — —
101 Kames Capital 1,984.73 1,984.73 — — — — —
102 Phillips Edison & Co 1,896.15 — 1,896.15 — — — —
103 Almanac Realty Investors 1,885.53 — 1,885.53 — — — —
104 Lowe Enterprises Investment Management 1,827.88 — 1,827.88 — — — —
105 Corpus Sireo Investment Management SARL 1,800.00 1,800.00 — — — — —

8 S p e c i a l R e p o r tInstitutional Real Estate, Inc.
GLOBAL REAL ESTATE ASSETS UNDER MANAGEMENT (gross, € million, as at 31 December 2012)
Rank Investment manager Total Europe North
America Latin
America Australasia Asia Global/Other
106 Amstar Advisers 1,766.30 782.73 914.70 50.51 — 18.35 —
107 Internos Global Investors 1,760.00 1,760.00 — — — — —
108 Paladin Realty Partners12 1,732.32 — 225.95 1,506.36 — — —
109 Altera Vastgoed NV 1,706.00 1,706.00 — — — — —
110 Landmark Partners 1,664.40 75.65 1,588.74 — — — —
111 CarVal Investors 1,649.65 571.12 863.88 57.64 — 157.00 —
112 The Lionstone Group 1,565.46 — 1,565.46 — — — —
113 CS Capital Management 1,559.52 — 1,559.52 — — — —
114 Exeter Property Group 20 1,558.63 — 1,558.63 — — — —
115 Beni Stabili Gestioni SpA SGR 1,458.00 1,458.00 — — — — —
116 Long Wharf Real Estate Partners 1,412.25 — 1,412.25 — — — —
117 Lothbury Investment Management 1,266.82 1,266.82 — — — — —
118 Mesa West Capital 1,251.30 — 1,251.30 — — — —
119 Cushman & Wakefield Investors 1,200.00 1,200.00 — — — — —
120 Covenant Capital Group 1,083.08 — 1,083.08 — — — —
121 Alex. Brown Realty 1,042.12 — 1,042.12 — — — —
122 Rynda Property Investors 850.00 850.00 — — — — —
123 Tricon Capital 845.98 — 845.98 — — — —
124 Avanti Investment Advisors 809.05 — 809.05 — — — —
125 Nordic Real Estate Partners 707.00 707.00 — — — — —
126 Frogmore 694.29 694.29 — — — — —
127 Colliers Capital 663.46 663.46 — — — — —
128 Knight Frank Investors 641.26 641.26 — — — — —
129 Hart Realty Advisers 572.64 — 572.64 — — — —
130 Mountgrange Investment Management 566.28 566.28 — — — — —
131 VBI Real Estate 530.92 — — 530.92 — — —
132 GPM Investment Management 503.70 — 503.70 — — — —

S p e c i a l R e p o r tInstitutional Real Estate, Inc.
9
GLOBAL REAL ESTATE ASSETS UNDER MANAGEMENT (gross, € million, as at 31 December 2012)
Rank Investment manager Total Europe North
America Latin
America Australasia Asia Global/Other
133 SF Institutional Invest 455.00 455.00 — — — — —
134 Cording Group 21 439.30 439.30 — — — — —
135 First Property Asset Management 431.62 431.62 — — — — —
136 Imorendimento 400.00 400.00 — — — — —
137 Presima 396.14 31.93 199.78 — 27.46 124.31 12.67
138 Fundbox – Sociedade Gestora de Fundos de Investimento Imobiliaro, SA 351.10 351.10 — — — — —
139 Composition Capital Partners 296.00 134.00 — — — 162.00 —
140 Equity Estate BV 280.00 280.00 — — — — —
141 inProp Capital 184.98 184.98 — — — — —
142 Pamfleet 158.52 — — — — 158.52 —
143 St Bride’s Managers 83.86 28.36 55.49 — — — —
1 AUM includes non-fund assets2 AUM and GAVs represent a summary of each fund’s share of unrealised value, debt and line of credit3 AUM includes assets managed by joint venture with Mitsubishi Corp4 Includes equity and debt real estate assets. Certain accounts are accounted for using fair value and some are accounted for using
book value5 Several businesses were sold/transferred in 2012. In addition, infrastructure securities (€3.6 billion) has been excluded from Real
estate AUM for the first year6 AUM includes €1,252 million of debt assets that are “serviced assets” or other assets that are not part of a separate account/fund
structure7 Represents gross fair market value of the real estate assets managed by Morgan Stanley on behalf of the firm and its clients,
presented at direct ownership interest. Real estate AUM for certain minority interests represents Morgan Stanley’s equity investments in the entity. Excludes real estate–related public equity securities and mutual funds
8 Formerly Prudential Property Investment Managers9 Cash is not included10 Excludes uncalled commitments, residual values of real estate deals conidered fully realised and real estate assets in multi-asset
funds and separate accounts11 Figures include transactions that were contracted prior to 31st December 2012, that settled afterwards 12 AUM is based at a pure property level and does not include cash held in funds or REIT funds
13 Formerly Urdang Capital Management 14 Formerly AREA Property Partners 15 Application of a new reporting methodology has resulted in a lower reported AUM. In addition,
in 2012 Bouwfonds sold the management of seven private funds and a limited number of exit sales of private funds was realised. The discretionary mandate was awarded in fourth quarter 2012 but no acquisitions were made, hence the discrepancy with the AUM
16 Formerly Centro Retail Australia17 AUM in North America includes €37.8 million of uncalled commitments18 Net figure supplied19 As at 31 December 2012, Hunt Investment Management acquired the advisory business of The
Tuckerman Group, €910 million20 2011 data was net, 2012 data is gross21 Difference from 2011 AUM is due to the exclusion of assets managed for external landlords that
were included last year

1010
Institutional Real Estate, Inc.
S p e c i a l R e p o r t
Discretionary separate accounts
Gross, € millions (as at 31 December 2012)
Rank Fund manager Total Europe North
America Latin
America Australia Asia Middle
East Number
of Mandates
1 AXA Real Estate 27,119.53 26,966.53 — — — 153.00 — 10
2 CBRE Global Investors 20,326.68 15,396.70 2,882.14 — 2,047.84 — — 190
3 LaSalle Investment Management 1 20,023.00 9,177.34 2,654.60 — — 303.38 75.85 47
4 Aviva Investors 16,220.22 14,857.54 41.93 — — 1,320.75 — 49
5 Cohen & Steers Capital Management 15,550.77 1,109.85 4,838.86 — 269.33 9,332.73 — 69
6 M&G Real Estate 2 14,218.74 13,899.35 38.23 — — 281.17 — 11
7 AEW Global 14,087.00 7,057.00 6,195.00 — 442.00 393.00 — 54
8 Invesco Real Estate 3 13,807.38 69.63 10,854.75 — — — — 27
9 Deutsche Asset & Wealth Management 11,106.20 264.40 8,446.10 — 1,325.20 1,070.50 — 58
10 Brookfield Asset Management 10,580.49 1,198.36 7,690.77 1,645.85 45.51 — — 76
11 Hermes Real Estate Investment Management 6,048.33 6,048.33 — — — — — 1
12 IVG Immobilien AG 5,514.80 5,514.80 — — — — — 28
13 CenterSquare Investment Management Holdings 4 4,651.62 96.32 3,191.59 — 452.04 911.67 — 48
14 Pramerica Real Estate Investors 4,424.10 1,612.48 1,500.98 — — 1,310.62 0.02 14
15 DTZ Investment and Asset Management 3,917.86 3,917.86 — — — — — 12
16 Standard Life Investments 3,794.17 3,672.21 102.73 — — 19.24 — 6
17 Principal Real Estate Investors 3,791.74 3.44 3,430.76 — 302.98 54.56 — 56
18 Orchard Street Investment 3,551.60 3,551.60 — — — — — 3
19 Threadneedle Property Investments 3,487.48 3,487.48 — — — — — 7
20 Henderson Global Investors 3,384.00 3,030.00 354.00 — — — — 23
21 Heitman 3,293.23 298.83 1,160.44 — 113.77 1,701.98 18.20 30
22 Royal London Asset Management 3,152.66 3,152.66 — — — — — 5
23 BlackRock 3,149.12 — 3,149.12 — — — — 11
24 Schroder Property Investment Management 3,031.56 3,031.56 — — — — — 33
25 Aberdeen Asset Management 3,016.39 3,016.39 — — — — — 19
26 UBS Global Asset Management 2,796.44 894.22 1,902.21 — — — — 12

S p e c i a l R e p o r tInstitutional Real Estate, Inc.
11
by Author Name
Gross, € millions (as at 31 December 2012)
Rank Fund manager Total Europe North
America Latin
America Australia Asia Middle
East Number
of Mandates
27 Secured Capital Investment Management Co 2,249.59 — — — — 2,249.59 — 12
28 Prologis 2,151.06 467.97 742.45 147.14 — — 793.50 9
29 Greystone Managed Investments 2,088.22 — 2,088.22 — — — — 5
30 Clarion Partners 1,975.78 — 1,975.78 — — — — 8
31 J.P. Morgan Asset Management – Global Real Assets 1,751.28 — 1,751.28 — — — — 2
32 Bouwinvest Real Estate Investment Management BV 5 1,693.00 953.00 592.00 — 81.00 67.00 — 4
33 Dexus Property Group 6 1,439.46 — — — 1,439.46 — — 2
34 Rockspring Property Investment Managers 1,417.50 667.50 — — — 750.00 — 4
35 Stockbridge Capital Group 1,411.49 — 1,411.49 — — — — 4
36 Legal & General Property 1,342.95 1,342.95 — — — — — 2
37 F&C REIT 1,297.32 1,297.32 — — — — — 4
38 Hines 1,279.52 — 1,243.11 — — — 36.41 8
39 Cornerstone Real Estate Advisers 1,253.20 74.86 1,135.41 — 42.93 — — 16
40 Capri Capital Partners 1,199.12 — 1,199.12 — — — — 5
41 Amstar Advisers 965.21 — 965.21 — — — — 3
42 The Lionstone Group 935.18 — 935.18 — — — — 3
43 Angelo, Gordon & Co 919.25 — 825.20 — — 94.05 — 8
44 Scottish Widows Investment Partnership 5 885.40 885.40 — — — — — 2
45 American Realty Advisors 824.85 — 824.85 — — — — 20
46 Pradera 770.00 770.00 — — — — — 3
47 Lend Lease 720.52 — — — 720.52 — — 3
48 KBS Realty Advisors/KBS Capital Advisors 665.93 — 0.76 — — — 665.17 6
49 Cordea Savills 643.00 643.00 — — — — — 2
50 Quadrant Real Estate Advisors 618.83 — 19.72 — 599.11 — — 4
51 Bentall Kennedy 606.01 — 606.01 — — — — 4
52 ASB Real Estate Investments 536.26 536.26 2
53 GLL Real Estate Partners GmbH 450.00 — 450.00 — — — — 2
54 First Property Asset Management 379.82 379.82 — — — — — 2
55 Cording Group 366.39 366.39 — — — — — 2
S p e c i a l R e p o r tInstitutional Real Estate, Inc.
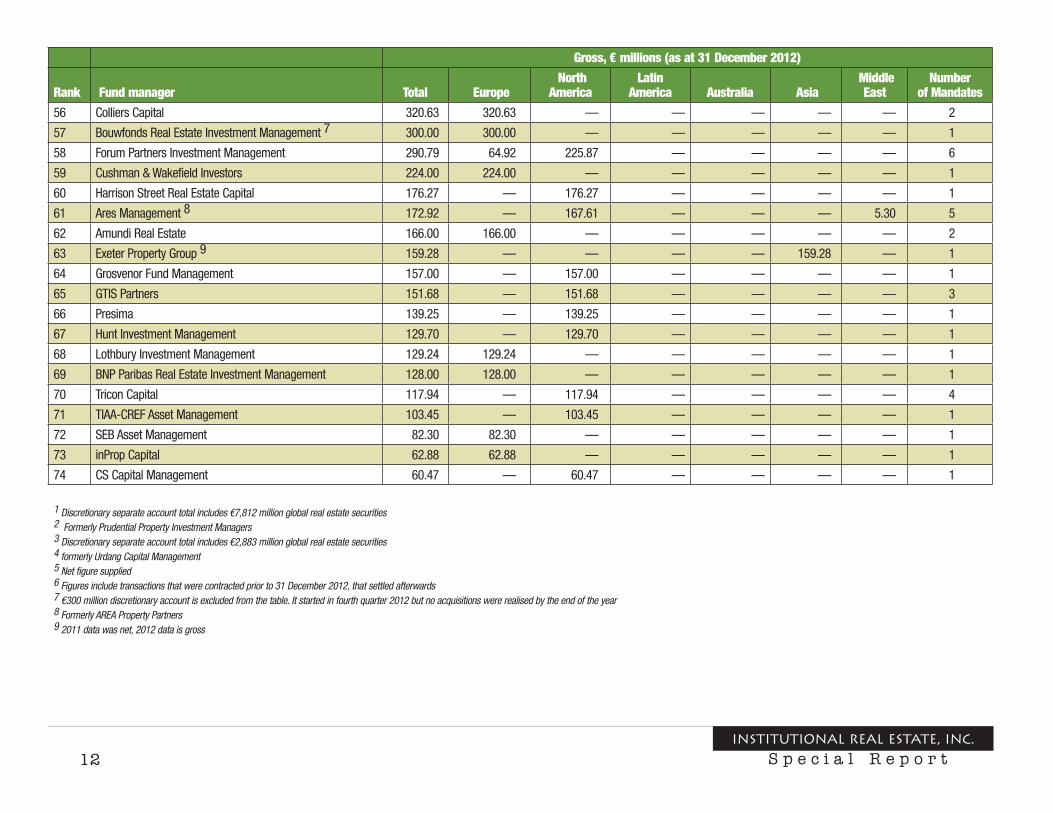
12
Gross, € millions (as at 31 December 2012)
Rank Fund manager Total Europe North
America Latin
America Australia Asia Middle
East Number
of Mandates
56 Colliers Capital 320.63 320.63 — — — — — 2
57 Bouwfonds Real Estate Investment Management 7 300.00 300.00 — — — — — 1
58 Forum Partners Investment Management 290.79 64.92 225.87 — — — — 6
59 Cushman & Wakefield Investors 224.00 224.00 — — — — — 1
60 Harrison Street Real Estate Capital 176.27 — 176.27 — — — — 1
61 Ares Management 8 172.92 — 167.61 — — — 5.30 5
62 Amundi Real Estate 166.00 166.00 — — — — — 2
63 Exeter Property Group 9 159.28 — — — — 159.28 — 1
64 Grosvenor Fund Management 157.00 — 157.00 — — — — 1
65 GTIS Partners 151.68 — 151.68 — — — — 3
66 Presima 139.25 — 139.25 — — — — 1
67 Hunt Investment Management 129.70 — 129.70 — — — — 1
68 Lothbury Investment Management 129.24 129.24 — — — — — 1
69 BNP Paribas Real Estate Investment Management 128.00 128.00 — — — — — 1
70 Tricon Capital 117.94 — 117.94 — — — — 4
71 TIAA-CREF Asset Management 103.45 — 103.45 — — — — 1
72 SEB Asset Management 82.30 82.30 — — — — — 1
73 inProp Capital 62.88 62.88 — — — — — 1
74 CS Capital Management 60.47 — 60.47 — — — — 1
1 Discretionary separate account total includes €7,812 million global real estate securities2 Formerly Prudential Property Investment Managers3 Discretionary separate account total includes €2,883 million global real estate securities4 formerly Urdang Capital Management5 Net figure supplied6 Figures include transactions that were contracted prior to 31 December 2012, that settled afterwards7 €300 million discretionary account is excluded from the table. It started in fourth quarter 2012 but no acquisitions were realised by the end of the year8 Formerly AREA Property Partners 9 2011 data was net, 2012 data is gross

S p e c i a l R e p o r tInstitutional Real Estate, Inc.
13
Advisory separate accounts
Gross, € millions (as at 31 December 2012)
Rank Fund manager Total Europe North
America Latin
America Australia Asia Middle
East Number
of mandates
1 Principal Real Estate Investors 22,159.11 — 21,425.51 — — 733.60 — 24
2 Cornerstone Real Estate Advisers 21,839.20 172.40 21,666.80 — — — — 11
3 Heitman 12,023.08 — 11,592.28 — — 430.80 — 16
4 Clarion Partners 8,981.66 — 8,981.66 — — — — 8
5 AEW Global 8,901.00 4,746.00 4,155.00 — — — — 45
6 CBRE Global Investors 8,115.50 1,365.22 6,067.67 — — 682.61 — 22
7 J.P. Morgan Asset Management – Global Real Assets 7,864.45 3,553.38 4,311.08 — — — — 10
8 Aberdeen Asset Management 7,690.01 7,690.01 — — — — — 37
9 Bentall Kennedy 7,567.14 — 7,567.14 — — — — 15
10 Invesco Real Estate 1 7,103.57 1,586.47 2,864.62 — — 2,652.48 — 16
11 AXA Real Estate 6,589.93 4,414.93 — — — — 2,175.00 7
12 F&C REIT 4,845.22 4,845.22 — — — — — 37
13 DTZ Investment and Asset Management 4,603.52 4,603.52 — — — — — 17
14 Cordea Savills 4,301.00 4,301.00 — — — — — 12
15 LaSalle Investment Management 2 4,171.52 1,289.38 1,820.30 — — — 1,061.84 13
16 Quadrant Real Estate Advisors 4,106.90 — 4,020.36 — 86.54 — — 4
17 Deutsche Asset & Wealth Management 3,375.80 2,052.60 88.50 — — 1,234.70 — 11
18 PCCP 3,285.26 — 3,285.26 — — — — 9
19 SEB Asset Management 2,617.20 2,617.20 — — — — — 2
20 M3 Capital Partners 2,578.76 — 2,578.76 — — — — 2
21 Charter Hall Group 2,522.60 — — — 2,522.60 — — 7
22 GLL Real Estate Partners GmbH 1,907.00 1,907.00 — — — — — 5
23 Warburg-Henderson Kapitalanlagegesellschaft fur immobilien mbH 1,631.00 1,631.00 — — — — — 6
24 Rockwood Capital 1,578.50 — 1,578.50 — — — — 3
25 TIAA-CREF Asset Management 1,491.05 586.36 669.57 — 235.12 — — 4
26 Lowe Enterprises Investment Management 1,441.07 — 1,441.07 — — — — 6

14 S p e c i a l R e p o r tInstitutional Real Estate, Inc.
Gross, € millions (as at 31 December 2012)
Rank Fund manager Total Europe North
America Latin
America Australia Asia Middle
East Number
of mandates
27 Amundi Real Estate 1,416.00 1,416.00 — — — — — 7
28 Hines 1,179.40 — 842.65 — — 327.65 9.10 4
29 Sentinel Real Estate Corp 1,174.09 — 1,174.09 — — — — 8
30 CS Capital Management 1,043.97 — 1,043.97 — — — — 1
31 La Francaise Real Estate Managers 977.00 930.00 — — — — 47.00 6
32 Rockspring Property Investment Managers 895.80 — — — — 895.80 — 1
33 Cushman & Wakefield Investors 875.00 875.00 — — — — — 8
34 Grosvenor Fund Management 857.07 409.42 — — 447.65 — — 4
35 Colony Capital 678.83 — 377.13 — — — 301.70 3
36 Rynda Property Investors 672.00 672.00 — — — — — 7
37 Knight Frank Investors 641.26 641.26 — — — — — 3
38 Ares Management 3 433.08 — 1.54 — — 144.86 286.70 4
39 Hart Realty Advisers 415.64 — 415.64 — — — — 2
40 Pramerica Real Estate Investors 415.63 — 415.63 — — — — 1
41 Standard Life Investments 370.45 370.45 — — — — — 1
42 Hunt Investment Management 331.37 20.71 310.66 — — — — 6
43 Brookfield Asset Management 326.14 — 326.14 — — — — 3
44 CenterSquare Investment Management Holdings 4 300.35 — 224.50 — 75.85 — — 3
45 Colliers Capital 291.03 291.03 — — — — — 1
46 KBS Realty Advisors/KBS Capital Advisors 248.77 — 248.77 — — — — 3
47 The Lionstone Group 202.51 — 202.51 — — — — 3
48 American Realty Advisors 201.60 — 201.60 — — — — 3
49 BNP Paribas Real Estate Investment Management 199.00 199.00 — — — — — 2
50 Covenant Capital Group 182.39 — 182.39 — — — — 1
51 Alpha Investment Partners 170.65 170.65 — — — — — 1
52 MGPA 157.08 139.25 17.82 — — — — 2
53 UBS Global Asset Management 153.97 — 153.97 — — — — 1
54 Landmark Partners 151.30 — 151.30 — — — — 5
55 Stockbridge Capital Group 117.56 — 117.56 — — — — 2
56 Pradera 64.00 64.00 — — — — — 2

S p e c i a l R e p o r tInstitutional Real Estate, Inc.
15
Gross, € millions (as at 31 December 2012)
Rank Fund manager Total Europe North
America Latin
America Australia Asia Middle
East Number
of mandates
57 St Bride’s Managers 58.80 — 58.80 — — — — 1
58 Royal London Asset Management 30.21 30.21 — — — — — 2
59 Alex. Brown Realty 18.96 — 18.96 — — — — 1
60 Lothbury Investment Management 11.75 11.75 — — — — — 1
61 First Property Asset Management 6.17 6.17 — — — — — 1
1 Discretionary separate account total includes €2,883 million global real estate securities2 Discretionary separate account total includes €7,812 million global real estate securities3 Formerly AREA Property Partners 4 Formerly Urdang Capital Management

1616
Institutional Real Estate, Inc.
S p e c i a l R e p o r t
Number and value of vehicles under management
Rank Fund manager Total GAV (€ millions) Total vehicles
1 The Blackstone Group 67,228.98 11
2 Brookfield Asset Management 49,967.23 20
3 UBS Global Asset Management 46,136.25 71
4 CBRE Global Investors 40,349.98 118
5 Pramerica Real Estate Investors 34,732.00 50
6 J.P. Morgan Asset Management – Global Real Assets 32,802.56 18
7 Tishman Speyer 26,670.42 31
8 Morgan Stanley Real Estate Investing 1 26,286.64 22
9 Deutsche Asset & Wealth Management 23,672.80 32
10 TIAA-CREF Asset Management 18,669.75 3
11 Starwood Capital Group 18,031.59 19
12 Colony Capital 17,951.70 31
13 Invesco Real Estate 17,494.98 37
14 AEW Global 13,564.30 49
15 Angelo, Gordon & Co 12,895.31 20
16 BNP Paribas Real Estate Investment Management 12,730.00 81
17 Henderson Global Investors 12,056.00 34
18 LaSalle Investment Management 11,983.64 33
19 Aberdeen Asset Management 11,709.84 37
20 AXA Real Estate 11,546.00 32
21 Aviva Investors 11,525.44 49
22 Legal & General Property 11,476.12 15
23 Prologis 11,073.72 8
24 Hines 10,892.22 12
25 Westbrook Partners 10,833.06 9
26 Standard Life Investments 10,645.68 18
Indirect real estate vehicles

S p e c i a l R e p o r tInstitutional Real Estate, Inc.
17
Number and value of vehicles under management
Rank Fund manager Total GAV (€ millions) Total vehicles
27 Clarion Partners 10,206.57 8
28 Schroder Property Investment Management 10,018.11 23
29 VG Immobilien AG 9,702.40 43
30 Lend Lease 9,697.92 14
31 Cohen & Steers Capital Management 9,509.00 15
32 Principal Real Estate Investors 9,338.96 17
33 Scottish Widows Investment Partnership 2 9,205.80 16
34 Dexus Property Group 3 8,851.19 2
35 SEB Asset Management 8,349.00 10
36 Beacon Capital Partners 8,216.45 3
37 Patron Capital 8,165.00 4
38 Rockpoint Group 7,943.03 6
39 MGPA 7,894.03 5
40 Paramount Group 7,887.97 8
41 Bentall Kennedy 7,747.65 6
42 DRA Advisors 7,627.06 8
43 QIC 7,486.22 3
44 PATRIZIA Immobilien AG 7,000.00 24
45 La Francaise Real Estate Managers 6,823.00 53
46 BlackRock 6,498.47 8
47 Walton Street Capital 6,126.07 7
48 M&G Real Estate 4 5,692.43 7
49 Alpha Investment Partners 5,436.63 5
50 Swisscanto Asset Management AG 5,401.54 5
51 Amundi Real Estate 5,378.00 65
52 Charter Hall Group 5,281.70 16
53 The GPT Group 5,184.74 2
54 Cornerstone Real Estate Advisers 5,133.25 18
55 Ares Management 5 5,044.50 21
56 Bouwfonds Real Estate Investment Management 4,977.00 26

18 S p e c i a l R e p o r tInstitutional Real Estate, Inc.
Number and value of vehicles under management
Rank Fund manager Total GAV (€ millions) Total vehicles
57 Rockspring Property Investment Managers 4,771.00 11
58 Heitman 4,598.53 7
59 KBS Realty Advisors/ KBS Capital Advisors 4,597.02 5
60 iii-investments 4,363.00 11
61 Valad Europe 4,307.00 15
62 Secured Capital Investment Management Co 4,296.67 8
63 Grosvenor Fund Management 4,041.18 19
64 Greystone Managed Investments 4,035.96 —
65 Bouwinvest Real Estate Investment Management BV 6 4,009.00 5
66 Threadneedle Property Investments 3,786.53 13
67 Rockwood Capital 3,785.39 5
68 Investa Property Group 3,594.79 2
69 Carmel Partners 3,564.75 4
70 Cordea Savills 3,278.00 19
71 Harrison Street Real Estate Capital 7 3,239.22 4
72 Tristan Capital Partners 3,100.00 4
73 American Realty Advisors 2,940.22 4
74 Stockbridge Capital Group 2,797.19 5
75 Warburg-Henderson Kapitalanlagegesellschaft fur immobilien mbH 2,721.00 10
76 KTR Capital Partners 2,654.60 3
77 GLL Real Estate Partners GmbH 2,647.00 10
78 F&C REIT 2,476.26 7
79 Hunt Investment Management 2,445.27 12
80 InfraRed Capital Partners 2,408.86 7
81 Unite Integrated Solutions 2,327.04 4
82 NIAM 2,292.00 4
83 Pearlmark Real Estate Partners 2,271.58 6
84 ASB Real Estate Investments 2,185.73 1
85 Benson Elliot Capital Management 2,000.00 3
86 Kames Capital 1,984.73 4

S p e c i a l R e p o r tInstitutional Real Estate, Inc.
19
Number and value of vehicles under management
Rank Fund manager Total GAV (€ millions) Total vehicles
87 GTIS Partners 1,932.10 11
88 Almanac Realty Investors 1,885.53 12
89 Phillips Edison & Co 1,858.22 6
90 Corpus Sireo Investment Management SARL 1,800.00 4
91 Internos Global Investors 1,760.00 17
92 Altera Vastgoed NV 1,706.00 4
93 CenterSquare Investment Management Holdings 8 1,691.36 9
94 PCCP 1,600.57 7
95 Forum Partners Investment Management 1,574.56 54
96 CarVal Investors 1,520.71 11
97 Landmark Partners 1,513.09 5
98 Beni Stabili Gestioni SpA SGR 1,458.00 13
99 Pradera 1,444.00 4
100 Long Wharf Real Estate Partners 1,412.25 3
101 Exeter Property Group 9 1,399.36 2
102 Sentinel Real Estate Corp 1,377.36 6
103 Capri Capital Partners 1,274.97 3
104 Mesa West Capital 1,250.70 4
105 Federation Centres 10 1,182.47 19
106 Lothbury Investment Management 1,125.83 3
107 Alex. Brown Realty 1,023.16 6
108 Hermes Real Estate Investment Management 969.04 1
109 Covenant Capital Group 900.29 4
110 Avanti Investment Advisors 809.05 8
111 Amstar Advisers 801.08 2
112 Tricon Capital 728.04 7
113 Paladin Realty Partners 716.55 9
114 Nordic Real Estate Partners 707.00 5
115 Frogmore 694.29 2
116 Mountgrange Investment Management 566.28 1

20 S p e c i a l R e p o r tInstitutional Real Estate, Inc.
Number and value of vehicles under management
Rank Fund manager Total GAV (€ millions) Total vehicles
117 VBI Real Estate 530.92 2
118 GPM Investment Management 503.70 4
119 CS Capital Management 455.07 1
120 SF Institutional Invest 455.00 3
121 The Lionstone Group 428.53 4
122 Imorendimento 400.00 9
123 Orchard Street Investment Management 394.62 2
124 Lowe Enterprises Investment Management 386.81 5
125 Fundbox – Sociedade Gestora de Fundos de Investimento Imobiliaro, SA 351.10 13
126 Composition Capital Partners 296.00 4
126 Equity Estate BV 280.00 3
127 Royal London Asset Management 266.00 1
128 Presima 256.81 5
129 inProp Capital 184.98 1
130 Rynda Property Investors 178.00 1
131 Pamfleet 158.52 1
132 Cushman & Wakefield Investors 110.00 1
133 Quadrant Real Estate Advisors 11 86.84 3
134 Cording Group 72.91 1
135 DTZ Investment and Asset Management 54.26 1
136 Colliers Capital 51.79 1
137 First Property Asset Management 45.63 3
138 St Bride’s Managers 24.97 1
1 Represents gross fair market value of the real estate assets managed by Morgan Stanley on behalf of the firm and its clients, presented at direct ownership interest. RE AUM for certain minority interests represents Morgan Stanley’s equity investments in the entity. Excludes real estate–related public equity securities and mutual funds.
2 Net figure supplied3 Figures include transactions that were contracted prior to 31 December 2012, that settled afterwards4 Formerly Prudential Property Investment Managers5 Formerly AREA Property Partners. Figures represent committed capital under management, includes all amounts available under debt facilities. Amounts are unaudited as of 31 March 2013. 6 Gross figure supplied 7 GAV is expressed as gross transaction costs 8 Formerly Urdang Capital Management9 2012 data was net, 2012 data is gross10 Formerly Centro Retail Australia11 AUM in North America includes €37.8 million of uncalled commitments

S p e c i a l R e p o r tInstitutional Real Estate, Inc.
21
by Author NameFounded in 1987, Institutional Real Estate, Inc. (IREI) is an infor-mation company focused on providing institutional real estate investors with decision-making tools through its publications,
conferences and consulting. IREI provides real estate investment fiduciaries with information and insights on the people, issues, ideas and events driving the global real estate investment marketplace. The firm publishes a number of special reports and directories, as well as 10 regular news publications. The firm’s flagship publica-tion, The Institutional Real Estate Letter – Americas, has covered the industry for nearly 25 years. Other IREI titles include The Institutional Real Estate Letter – Europe, The Institutional Real Estate Letter – Asia Pacific, The Institutional Real Estate Letter – Australia, Institutional Real Estate Newsline, European Real Estate Quarterly, The Asian REIT Report, Institutional Investing in Infrastructure and Institutional Real Estate FundTracker.
In 2006, the firm launched a conference and seminar division. IREI’s events have quickly gained a stellar reputation and solid fol-lowing within the industry. The firm’s menu of events includes Institutional Investing in Infrastructure, and Visions, Insights & Perspectives (VIP) conferences in North America, Asia and Europe, as well as the Market Navigator series of workshops led by president and CEO Geoffrey Dohrmann.
On the consulting side, IREI has two decades of experience providing research and advice to the investment-management, bro-kerage, development and technology communities. Services include strategic information and advice on presentations, organisational structures, product development, proposal responses, and design and implementation of market research projects.
For more information about IREI’s products and services, please visit www.irei.com.
Property Funds Research (PFR) is an independent management-owned real estate research and consulting business. Founded in 2001, under its previous name, Oxford Property Consultants
(OPC), the firm established the first European and global dataset of unlisted property vehicles, the major sources of capital and invest-ment managers. OPC was sold to CBRE in 2006 and the research and information business (renamed Property Funds Research) was re-acquired by its management. PFR is now chaired by Andrew Baum, professor of real Eestate investment at the University of Cambridge, and managed by Jane Fear.
PFR’s global database includes nearly 3,000 unlisted funds, 1,500 fund managers and 3,000 investors. With this resource, PFR provides high-quality confidential research and strategic consult-ing for institutional real estate investment managers, investors and industry bodies around the world.
For more information about PFR, please contact Jane Fear at [email protected].
About Institutional Real Estate, Inc.
About Property Funds Research

22 S p e c i a l R e p o r tInstitutional Real Estate, Inc.
Personnel
Institutional Real Estate, Inc.Denise DeChaine, Special Projects Editor
Project management, editing
Larry Gray, Editorial Director Editing and proofreading
Susan Sharpe, Art Director Design, layout and production
Loretta Clodfelter, Copyeditor Proofreading
Property Funds ResearchJane Fear, Managing Director
Project management, data collection
Joanna Gliddon, Senior Analyst Data collation
Copyright © 2013 by Institutional Real Estate, Inc. Material may not be reproduced in whole or in part without the express written permission of the publisher.
The publisher of this special report, Institutional Real Estate, Inc., is not engaged in rendering tax, accounting or other professional advice through this publication. No statement in this issue is to be construed as a recommendation to buy or sell any security or other investment.

Introducing IREI’s Online Real Estate and Infrastructure Database
Tracking real estate fund data just got a lot easier.
5 things our new real estate database will do for you. If you are in this industry, you are paying attention to real estate and infrastructure fund data. Whether you are doing this yourself or with the aid of an in-house research team, our online real estate and infrastructure database will be an indispensable, time-saving tool. Previously only available to our sponsoring clients, it is now available to you anytime online. The database contains more than 4,500 searchable global real estate funds, including more than 800 funds actively seeking to raise a combined $248.9 billion in capital. In addition, you will find data on 400 of the leading infrastructure funds in the industry.
1) You’ll Save Time: Perform fund, fund manager or investor searches in minutes anytime of day. Seeing stories connected to organizations in the database means one-stop shopping.
2) You’ll Stay Ahead of the Competition: See which funds are currently marketing and which have recently closed. Bring up any new funds
to make sure you have every competitor on your radar. See property acquisitions tied to funds. See if you lost any investors to the competition by looking up commitments.
3) You Can Easily Track Trends: Lookup all historical funds to perform research and predict trends. Export any data from the system with our premium-level subscription so you can conduct further analysis in Excel.
4) Properly Position Your Products See fund fee structures currently used by advisers and commitments being made by investors.
5) You’ll Have Real-Time Data: As we get new information, you get new information. In addition to other reports, our popular lists of top investment managers and top investors are included in the standard and premium-level subscriptions to this database.
Go to www.irei.com/dbdemo to request your demo today.
Investor focused.Connecting People, Data, Insights
2274 Camino Ramon, San Ramon, CA 94583 USA • Ph: +1 925-244-0500 • Fax: +1 925-244-0520 • www.irei.com