INSTITUTIONAL PRESENTATION - Sonae Capital
76
Maia | July 2019 INSTITUTIONAL PRESENTATION SONAE CAPITAL 1H 2019 RESULTS
Transcript of INSTITUTIONAL PRESENTATION - Sonae Capital

Maia | July 2019
INSTITUTIONAL PRESENTATION
SONAE CAPITAL1H 2019 RESULTS
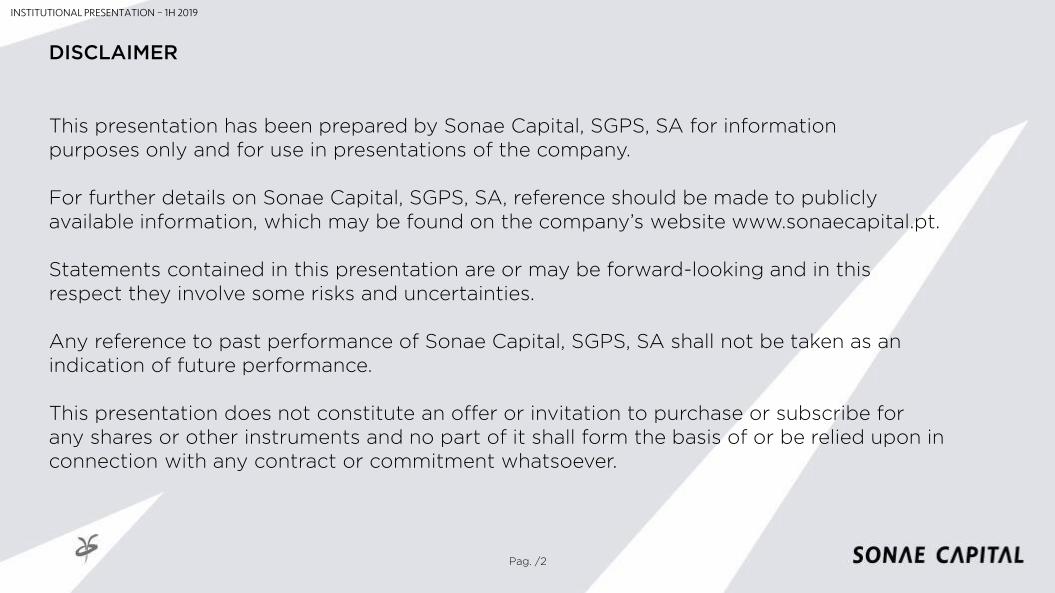
DISCLAIMER
Pag. /2
INSTITUTIONAL PRESENTATION – 1H 2019
This presentation has been prepared by Sonae Capital, SGPS, SA for informationpurposes only and for use in presentations of the company.
For further details on Sonae Capital, SGPS, SA, reference should be made to publiclyavailable information, which may be found on the company’s website www.sonaecapital.pt.
Statements contained in this presentation are or may be forward-looking and in thisrespect they involve some risks and uncertainties.
Any reference to past performance of Sonae Capital, SGPS, SA shall not be taken as anindication of future performance.
This presentation does not constitute an offer or invitation to purchase or subscribe forany shares or other instruments and no part of it shall form the basis of or be relied upon in connection with any contract or commitment whatsoever.

Pag. /3
01 SONAE CAPITALOVERVIEW
AGENDA
02
03
04
BUSINESSESPORTFOLIO
REALESTATE ASSETS
05
RECENTPERFORMANCE
KEYMESSAGES
APPENDIX
INSTITUTIONAL PRESENTATION – 1H 2019

AGENDA
01 SONAE CAPITALOVERVIEW
INSTITUTIONAL PRESENTATION – 1H 2019
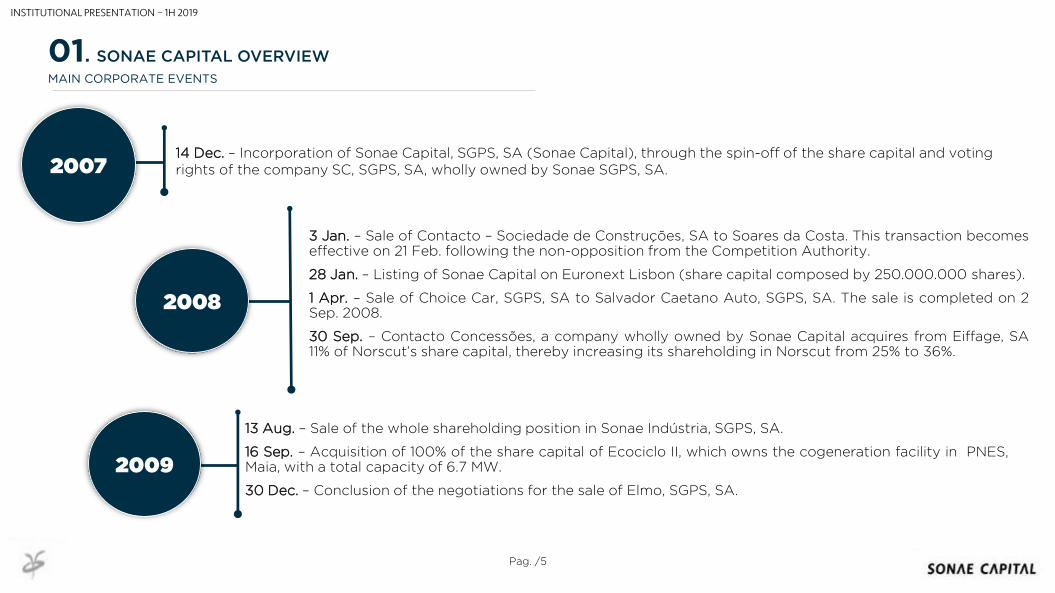
3 Jan. – Sale of Contacto – Sociedade de Construções, SA to Soares da Costa. This transaction becomeseffective on 21 Feb. following the non-opposition from the Competition Authority.
28 Jan. – Listing of Sonae Capital on Euronext Lisbon (share capital composed by 250.000.000 shares).
1 Apr. – Sale of Choice Car, SGPS, SA to Salvador Caetano Auto, SGPS, SA. The sale is completed on 2Sep. 2008.
30 Sep. – Contacto Concessões, a company wholly owned by Sonae Capital acquires from Eiffage, SA11% of Norscut’s share capital, thereby increasing its shareholding in Norscut from 25% to 36%.
14 Dec. – Incorporation of Sonae Capital, SGPS, SA (Sonae Capital), through the spin-off of the share capital and voting rights of the company SC, SGPS, SA, wholly owned by Sonae SGPS, SA.
13 Aug. – Sale of the whole shareholding position in Sonae Indústria, SGPS, SA.
16 Sep. – Acquisition of 100% of the share capital of Ecociclo II, which owns the cogeneration facility in PNES,Maia, with a total capacity of 6.7 MW.
30 Dec. – Conclusion of the negotiations for the sale of Elmo, SGPS, SA.
01. SONAE CAPITAL OVERVIEW
MAIN CORPORATE EVENTS
2008
2009
2007
Pag. /5
INSTITUTIONAL PRESENTATION – 1H 2019
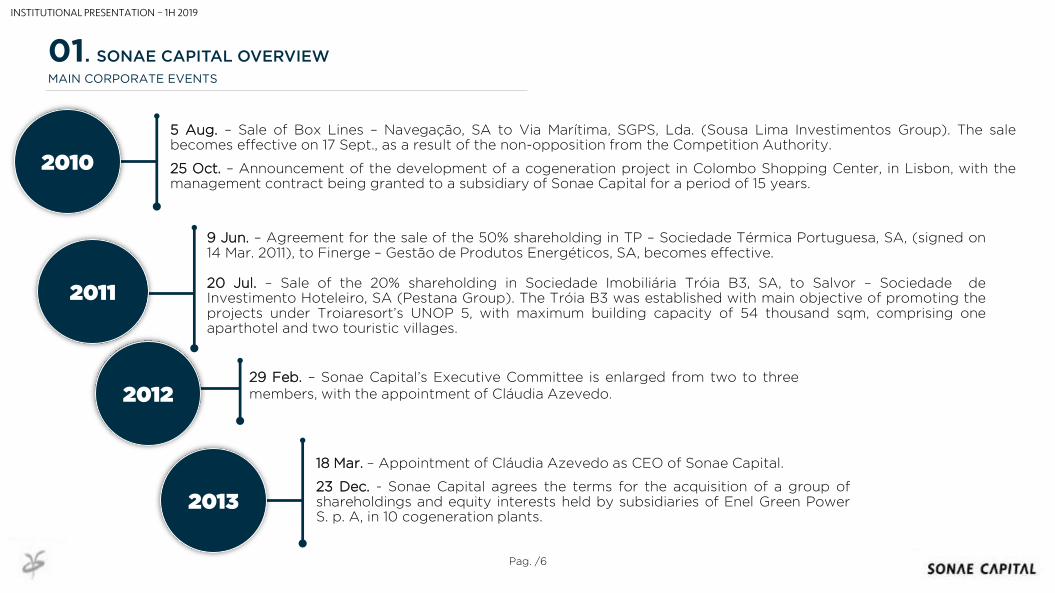
5 Aug. – Sale of Box Lines – Navegação, SA to Via Marítima, SGPS, Lda. (Sousa Lima Investimentos Group). The salebecomes effective on 17 Sept., as a result of the non-opposition from the Competition Authority.
25 Oct. – Announcement of the development of a cogeneration project in Colombo Shopping Center, in Lisbon, with themanagement contract being granted to a subsidiary of Sonae Capital for a period of 15 years.
9 Jun. – Agreement for the sale of the 50% shareholding in TP – Sociedade Térmica Portuguesa, SA, (signed on14 Mar. 2011), to Finerge – Gestão de Produtos Energéticos, SA, becomes effective.
20 Jul. – Sale of the 20% shareholding in Sociedade Imobiliária Tróia B3, SA, to Salvor – Sociedade deInvestimento Hoteleiro, SA (Pestana Group). The Tróia B3 was established with main objective of promoting theprojects under Troiaresort’s UNOP 5, with maximum building capacity of 54 thousand sqm, comprising oneaparthotel and two touristic villages.
29 Feb. – Sonae Capital’s Executive Committee is enlarged from two to threemembers, with the appointment of Cláudia Azevedo.
2010
2011
2012
2013
18 Mar. – Appointment of Cláudia Azevedo as CEO of Sonae Capital.
23 Dec. - Sonae Capital agrees the terms for the acquisition of a group ofshareholdings and equity interests held by subsidiaries of Enel Green PowerS. p. A, in 10 cogeneration plants.
01. SONAE CAPITAL OVERVIEW
MAIN CORPORATE EVENTS
Pag. /6
INSTITUTIONAL PRESENTATION – 1H 2019
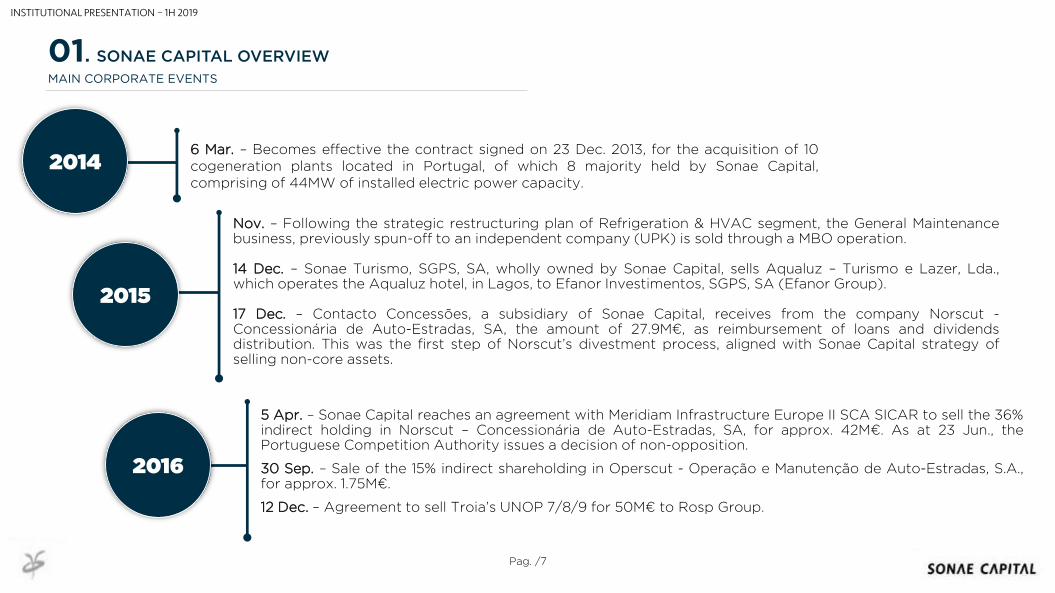
Nov. – Following the strategic restructuring plan of Refrigeration & HVAC segment, the General Maintenancebusiness, previously spun-off to an independent company (UPK) is sold through a MBO operation.
14 Dec. – Sonae Turismo, SGPS, SA, wholly owned by Sonae Capital, sells Aqualuz – Turismo e Lazer, Lda.,which operates the Aqualuz hotel, in Lagos, to Efanor Investimentos, SGPS, SA (Efanor Group).
17 Dec. – Contacto Concessões, a subsidiary of Sonae Capital, receives from the company Norscut -Concessionária de Auto-Estradas, SA, the amount of 27.9M€, as reimbursement of loans and dividendsdistribution. This was the first step of Norscut’s divestment process, aligned with Sonae Capital strategy ofselling non-core assets.
6 Mar. – Becomes effective the contract signed on 23 Dec. 2013, for the acquisition of 10cogeneration plants located in Portugal, of which 8 majority held by Sonae Capital,comprising of 44MW of installed electric power capacity.
2014
2015
2016
5 Apr. – Sonae Capital reaches an agreement with Meridiam Infrastructure Europe II SCA SICAR to sell the 36%indirect holding in Norscut – Concessionária de Auto-Estradas, SA, for approx. 42M€. As at 23 Jun., thePortuguese Competition Authority issues a decision of non-opposition.
30 Sep. – Sale of the 15% indirect shareholding in Operscut - Operação e Manutenção de Auto-Estradas, S.A.,for approx. 1.75M€.
12 Dec. – Agreement to sell Troia’s UNOP 7/8/9 for 50M€ to Rosp Group.
Pag. /7
01. SONAE CAPITAL OVERVIEW
MAIN CORPORATE EVENTS
INSTITUTIONAL PRESENTATION – 1H 2019
Pag. /8
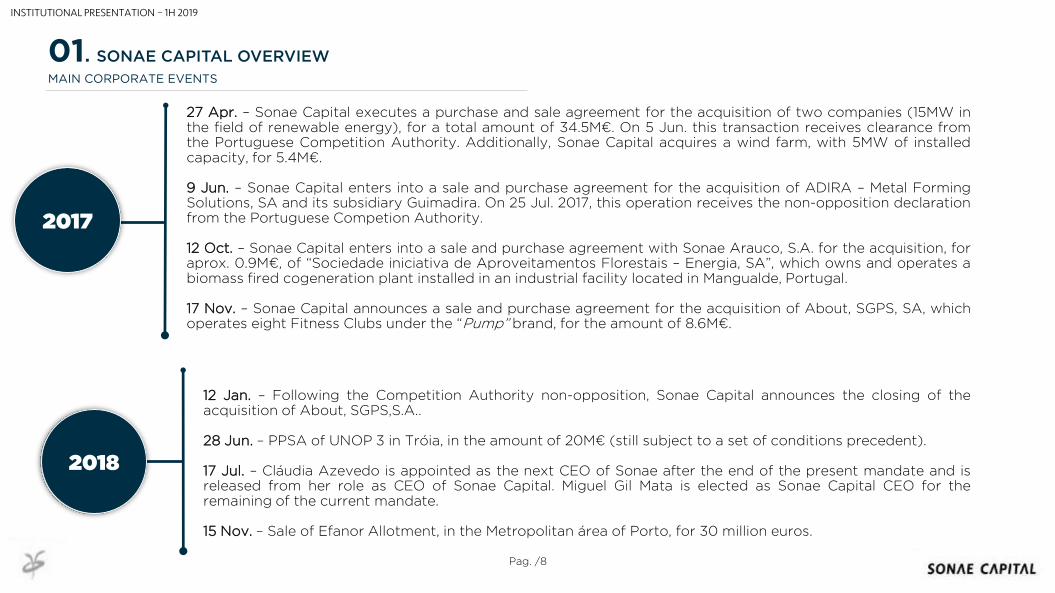
27 Apr. – Sonae Capital executes a purchase and sale agreement for the acquisition of two companies (15MW inthe field of renewable energy), for a total amount of 34.5M€. On 5 Jun. this transaction receives clearance fromthe Portuguese Competition Authority. Additionally, Sonae Capital acquires a wind farm, with 5MW of installedcapacity, for 5.4M€.
9 Jun. – Sonae Capital enters into a sale and purchase agreement for the acquisition of ADIRA – Metal FormingSolutions, SA and its subsidiary Guimadira. On 25 Jul. 2017, this operation receives the non-opposition declarationfrom the Portuguese Competion Authority.
12 Oct. – Sonae Capital enters into a sale and purchase agreement with Sonae Arauco, S.A. for the acquisition, foraprox. 0.9M€, of “Sociedade iniciativa de Aproveitamentos Florestais – Energia, SA”, which owns and operates abiomass fired cogeneration plant installed in an industrial facility located in Mangualde, Portugal.
17 Nov. – Sonae Capital announces a sale and purchase agreement for the acquisition of About, SGPS, SA, whichoperates eight Fitness Clubs under the “Pump” brand, for the amount of 8.6M€.
2017
2018
12 Jan. – Following the Competition Authority non-opposition, Sonae Capital announces the closing of theacquisition of About, SGPS,S.A..
28 Jun. – PPSA of UNOP 3 in Tróia, in the amount of 20M€ (still subject to a set of conditions precedent).
17 Jul. – Cláudia Azevedo is appointed as the next CEO of Sonae after the end of the present mandate and isreleased from her role as CEO of Sonae Capital. Miguel Gil Mata is elected as Sonae Capital CEO for theremaining of the current mandate.
15 Nov. – Sale of Efanor Allotment, in the Metropolitan área of Porto, for 30 million euros.
01. SONAE CAPITAL OVERVIEW
MAIN CORPORATE EVENTS
INSTITUTIONAL PRESENTATION – 1H 2019
Pag. /9
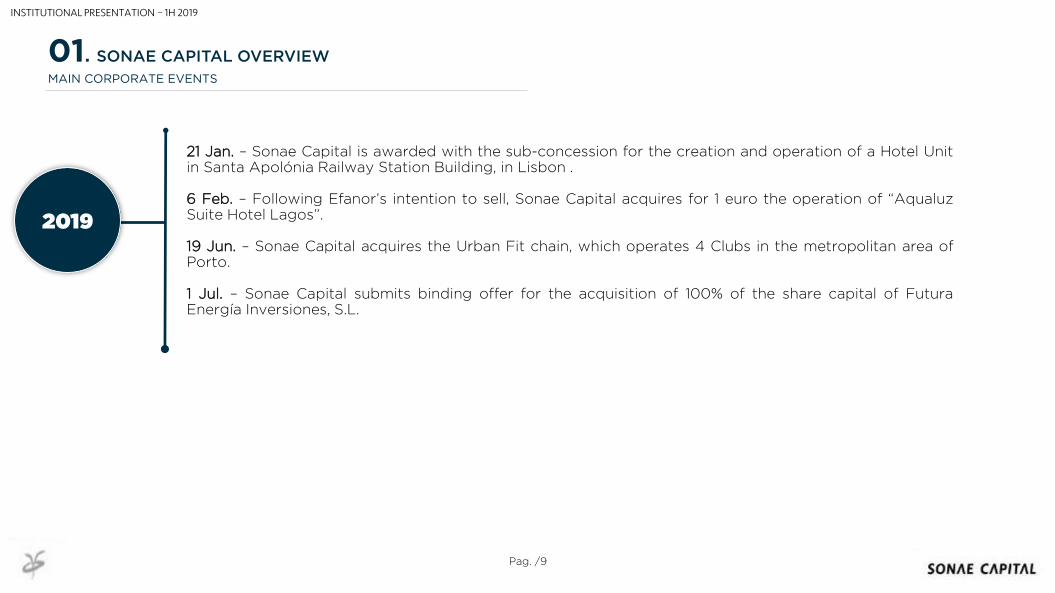
21 Jan. – Sonae Capital is awarded with the sub-concession for the creation and operation of a Hotel Unitin Santa Apolónia Railway Station Building, in Lisbon .
6 Feb. – Following Efanor’s intention to sell, Sonae Capital acquires for 1 euro the operation of “AqualuzSuite Hotel Lagos”.
19 Jun. – Sonae Capital acquires the Urban Fit chain, which operates 4 Clubs in the metropolitan area ofPorto.
1 Jul. – Sonae Capital submits binding offer for the acquisition of 100% of the share capital of FuturaEnergía Inversiones, S.L.
2019
01. SONAE CAPITAL OVERVIEW
MAIN CORPORATE EVENTS
INSTITUTIONAL PRESENTATION – 1H 2019
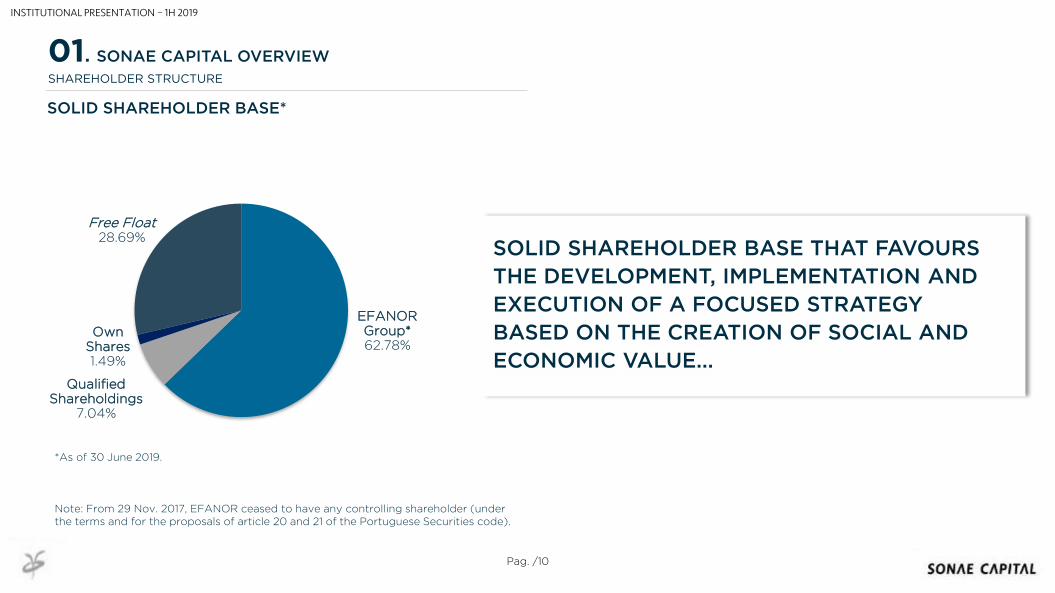
SOLID SHAREHOLDER BASE THAT FAVOURS
THE DEVELOPMENT, IMPLEMENTATION AND
EXECUTION OF A FOCUSED STRATEGY
BASED ON THE CREATION OF SOCIAL AND
ECONOMIC VALUE...
EFANOR Group*62.78%
Qualified Shareholdings
7.04%
Own Shares1.49%
Free Float28.69%
Note: From 29 Nov. 2017, EFANOR ceased to have any controlling shareholder (under the terms and for the proposals of article 20 and 21 of the Portuguese Securities code).
Pag. /10
*As of 30 June 2019.
SOLID SHAREHOLDER BASE*
SHAREHOLDER STRUCTURE
01. SONAE CAPITAL OVERVIEW
INSTITUTIONAL PRESENTATION – 1H 2019
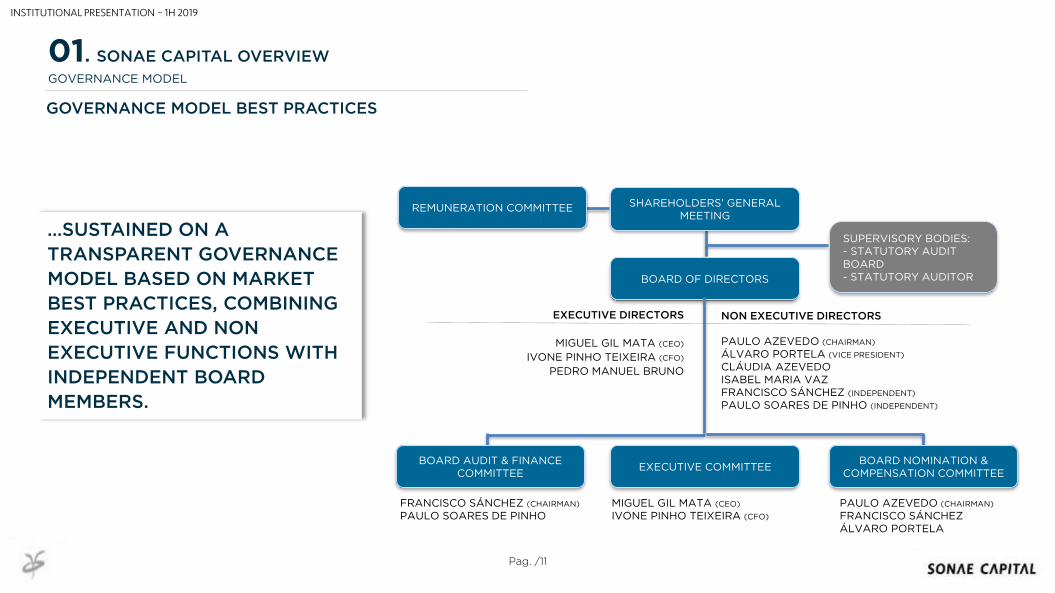
…SUSTAINED ON A
TRANSPARENT GOVERNANCE
MODEL BASED ON MARKET
BEST PRACTICES, COMBINING
EXECUTIVE AND NON
EXECUTIVE FUNCTIONS WITH
INDEPENDENT BOARD
MEMBERS.
Pag. /11
GOVERNANCE MODEL BEST PRACTICES
GOVERNANCE MODEL
SHAREHOLDERS’ GENERAL MEETING
BOARD OF DIRECTORS
SUPERVISORY BODIES:- STATUTORY AUDIT BOARD- STATUTORY AUDITOR
EXECUTIVE DIRECTORS
MIGUEL GIL MATA (CEO)
IVONE PINHO TEIXEIRA (CFO)
PEDRO MANUEL BRUNO
MIGUEL GIL MATA (CEO)
IVONE PINHO TEIXEIRA (CFO)
NON EXECUTIVE DIRECTORS
PAULO AZEVEDO (CHAIRMAN)
ÁLVARO PORTELA (VICE PRESIDENT)
CLÁUDIA AZEVEDOISABEL MARIA VAZFRANCISCO SÁNCHEZ (INDEPENDENT)
PAULO SOARES DE PINHO (INDEPENDENT)
PAULO AZEVEDO (CHAIRMAN)
FRANCISCO SÁNCHEZÁLVARO PORTELA
REMUNERATION COMMITTEE
FRANCISCO SÁNCHEZ (CHAIRMAN)
PAULO SOARES DE PINHO
01. SONAE CAPITAL OVERVIEW
BOARD AUDIT & FINANCE COMMITTEE
EXECUTIVE COMMITTEEBOARD NOMINATION &
COMPENSATION COMMITTEE
INSTITUTIONAL PRESENTATION – 1H 2019
IDENTIFY NEW BUSINESS OPPORTUNITIES IN SEGMENTS WITH HIGH GROWTH POTENTIAL, AND
PROVIDE THEM WITH RESOURCES TO ENABLE GROWTH UNTIL THEY BECAME SELF-SUSTAINABLE
WITH MECHANISMS FOR EFFICIENT CAPITAL ALLOCATION.
Pag. /12
STRATEGY PURPOSE
CORPORATE STRATEGY
01. SONAE CAPITAL OVERVIEW
INSTITUTIONAL PRESENTATION – 1H 2019
...
INC
UB
AT
ION
&
PO
RT
FO
LIO
M
AN
AG
EM
EN
T
DIV
ES
TM
EN
T
PO
RT
FO
LIO
M
AN
AG
EM
EN
T
INC
UB
AT
ION
NO
N-C
OR
E A
SS
ET
S
(sta
rtin
gp
oin
t)
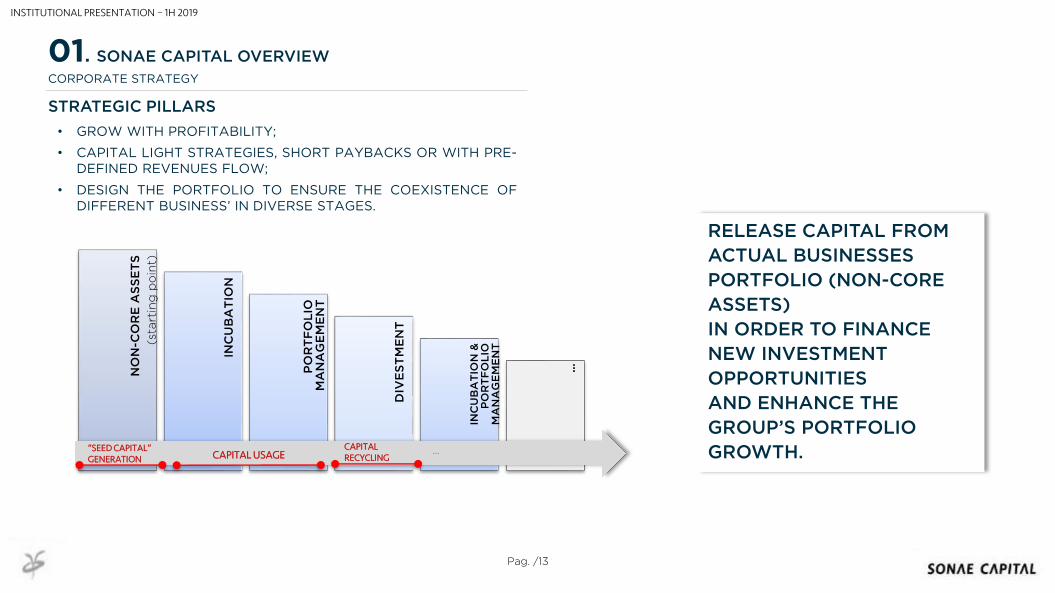
RELEASE CAPITAL FROM
ACTUAL BUSINESSES
PORTFOLIO (NON-CORE
ASSETS)
IN ORDER TO FINANCE
NEW INVESTMENT
OPPORTUNITIES
AND ENHANCE THE
GROUP’S PORTFOLIO
GROWTH.
Pag. /13
CORPORATE STRATEGY
STRATEGIC PILLARS
• GROW WITH PROFITABILITY;
• CAPITAL LIGHT STRATEGIES, SHORT PAYBACKS OR WITH PRE-DEFINED REVENUES FLOW;
• DESIGN THE PORTFOLIO TO ENSURE THE COEXISTENCE OFDIFFERENT BUSINESS’ IN DIVERSE STAGES.
“SEED CAPITAL”GENERATION CAPITAL USAGE
CAPITAL RECYCLING
...
01. SONAE CAPITAL OVERVIEW
INSTITUTIONAL PRESENTATION – 1H 2019
Pag. /14
CORPORATE STRATEGY
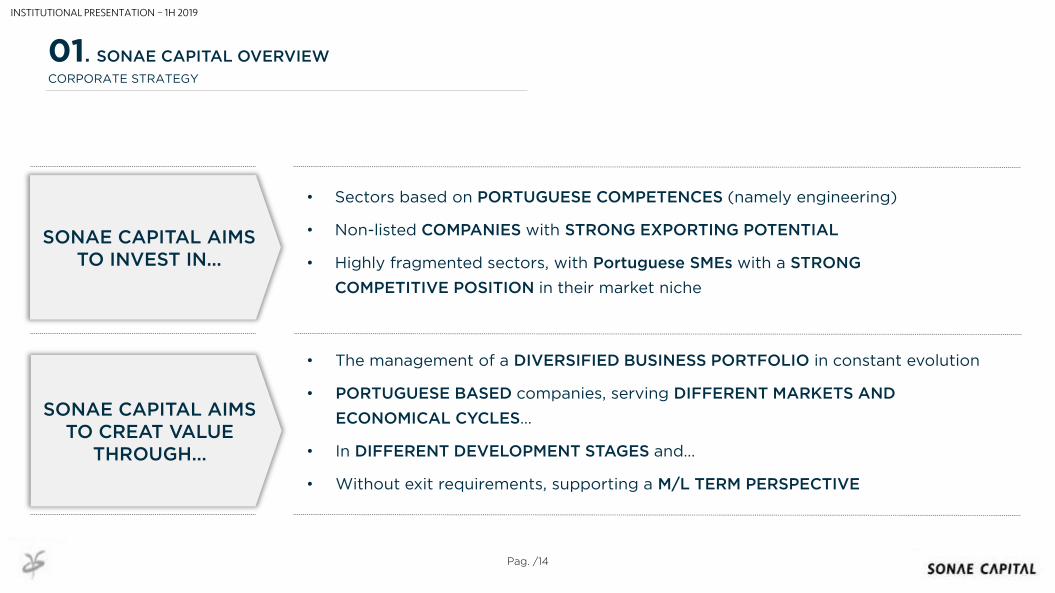
SONAE CAPITAL AIMS TO INVEST IN...
SONAE CAPITAL AIMS TO CREAT VALUE
THROUGH...
• Sectors based on PORTUGUESE COMPETENCES (namely engineering)
• Non-listed COMPANIES with STRONG EXPORTING POTENTIAL
• Highly fragmented sectors, with Portuguese SMEs with a STRONG
COMPETITIVE POSITION in their market niche
• The management of a DIVERSIFIED BUSINESS PORTFOLIO in constant evolution
• PORTUGUESE BASED companies, serving DIFFERENT MARKETS AND
ECONOMICAL CYCLES…
• In DIFFERENT DEVELOPMENT STAGES and…
• Without exit requirements, supporting a M/L TERM PERSPECTIVE
01. SONAE CAPITAL OVERVIEW
INSTITUTIONAL PRESENTATION – 1H 2019
Pag. /15
COMPETITIVE POSITION
IMPROVEMENT
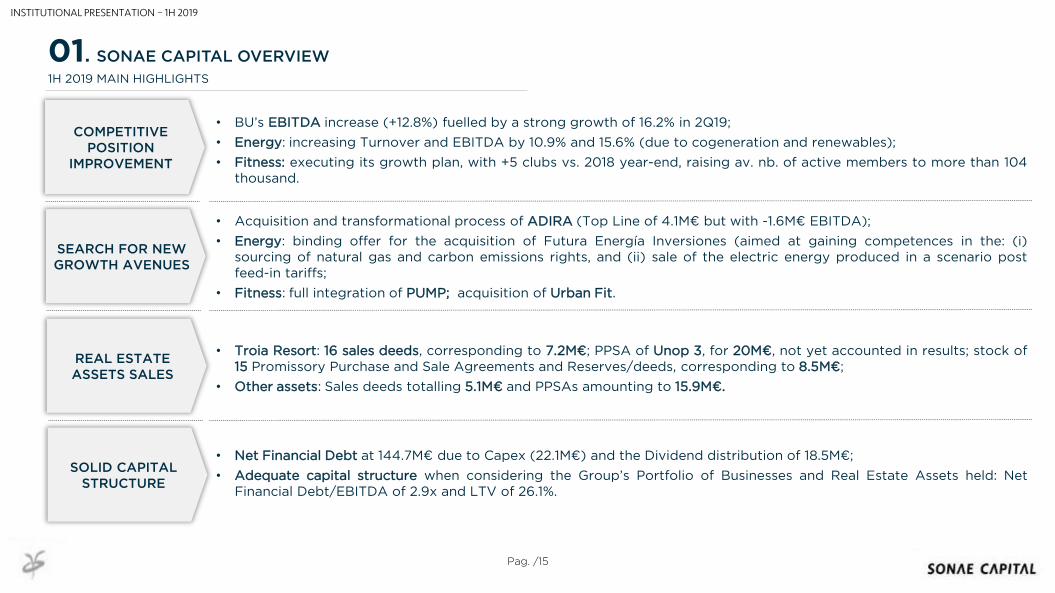
• BU’s EBITDA increase (+12.8%) fuelled by a strong growth of 16.2% in 2Q19;
• Energy: increasing Turnover and EBITDA by 10.9% and 15.6% (due to cogeneration and renewables);
• Fitness: executing its growth plan, with +5 clubs vs. 2018 year-end, raising av. nb. of active members to more than 104thousand.
1H 2019 MAIN HIGHLIGHTS
SEARCH FOR NEW GROWTH AVENUES
REAL ESTATE ASSETS SALES
SOLID CAPITAL STRUCTURE
• Acquisition and transformational process of ADIRA (Top Line of 4.1M€ but with -1.6M€ EBITDA);
• Energy: binding offer for the acquisition of Futura Energía Inversiones (aimed at gaining competences in the: (i)sourcing of natural gas and carbon emissions rights, and (ii) sale of the electric energy produced in a scenario postfeed-in tariffs;
• Fitness: full integration of PUMP; acquisition of Urban Fit.
• Troia Resort: 16 sales deeds, corresponding to 7.2M€; PPSA of Unop 3, for 20M€, not yet accounted in results; stock of15 Promissory Purchase and Sale Agreements and Reserves/deeds, corresponding to 8.5M€;
• Other assets: Sales deeds totalling 5.1M€ and PPSAs amounting to 15.9M€.
• Net Financial Debt at 144.7M€ due to Capex (22.1M€) and the Dividend distribution of 18.5M€;
• Adequate capital structure when considering the Group’s Portfolio of Businesses and Real Estate Assets held: NetFinancial Debt/EBITDA of 2.9x and LTV of 26.1%.
01. SONAE CAPITAL OVERVIEW
INSTITUTIONAL PRESENTATION – 1H 2019
Pag. /16
1H 2019 CONSOLIDATED RESULTS
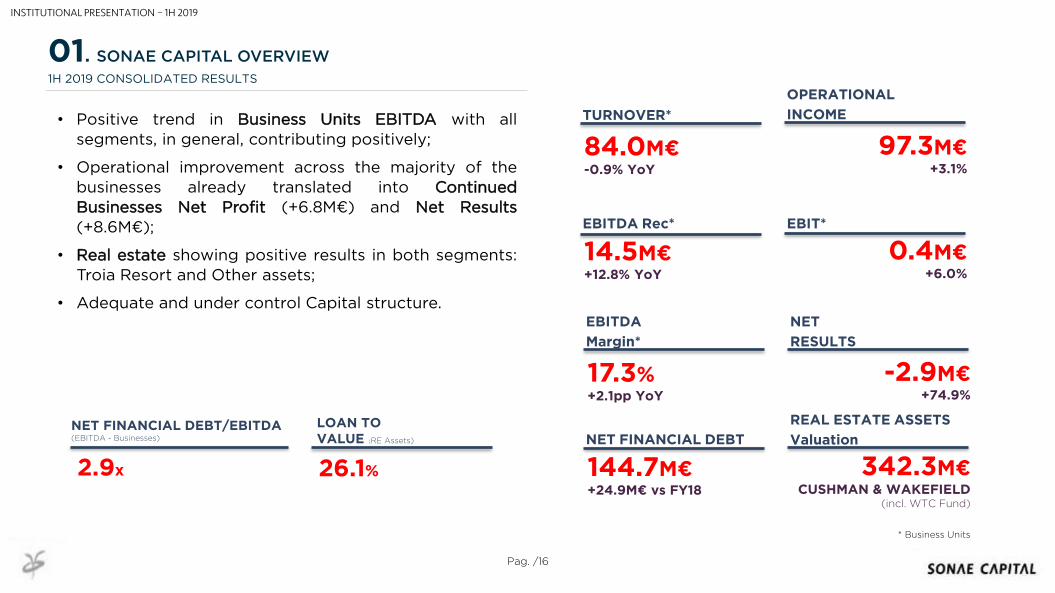
• Positive trend in Business Units EBITDA with all
segments, in general, contributing positively;
• Operational improvement across the majority of thebusinesses already translated into ContinuedBusinesses Net Profit (+6.8M€) and Net Results(+8.6M€);
• Real estate showing positive results in both segments:Troia Resort and Other assets;
• Adequate and under control Capital structure.
LOAN TO VALUE (RE Assets)
26.1%
NET FINANCIAL DEBT/EBITDA (EBITDA - Businesses)
2.9x
TURNOVER*
84.0M€-0.9% YoY
OPERATIONAL
INCOME
97.3M€+3.1%
EBITDA Rec*
14.5M€+12.8% YoY
* Business Units
0.4M€+6.0%
EBITDA
Margin*
17.3%+2.1pp YoY
NET
RESULTS
-2.9M€+74.9%
NET FINANCIAL DEBT
144.7M€+24.9M€ vs FY18
REAL ESTATE ASSETS
Valuation
342.3M€CUSHMAN & WAKEFIELD
(incl. WTC Fund)
01. SONAE CAPITAL OVERVIEW
EBIT*
INSTITUTIONAL PRESENTATION – 1H 2019
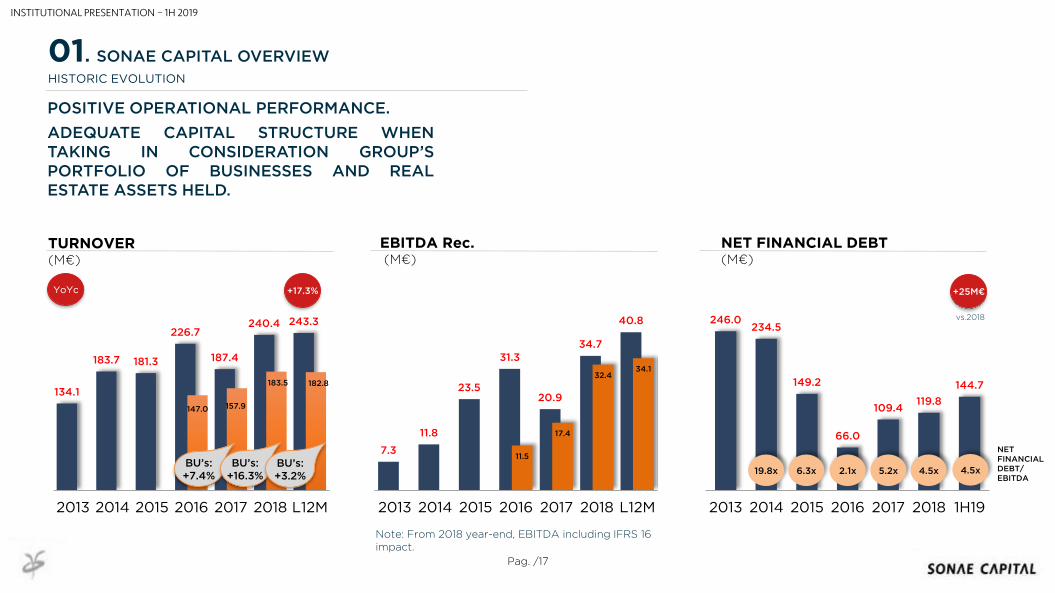
7.3
11.8
23.5
31.3
20.9
34.7
40.8
11.5
17.4
32.434.1
2013 2014 2015 2016 2017 2018 L12M
134.1
183.7 181.3
226.7
187.4
240.4 243.3
147.0 157.9
183.5 182.8
2013 2014 2015 2016 2017 2018 L12M
246.0234.5
149.2
66.0
109.4119.8
144.7
2013 2014 2015 2016 2017 2018 1H19
NET FINANCIAL DEBT(M€)
TURNOVER(M€)
EBITDA Rec.(M€)
Pag. /17
POSITIVE OPERATIONAL PERFORMANCE.
ADEQUATE CAPITAL STRUCTURE WHENTAKING IN CONSIDERATION GROUP’SPORTFOLIO OF BUSINESSES AND REALESTATE ASSETS HELD.
+17.3%YoYc
19.8x 6.3x 2.1x 5.2x
NET FINANCIAL DEBT/EBITDA
HISTORIC EVOLUTION
01. SONAE CAPITAL OVERVIEW
4.5x
+25M€
BU’s:+7.4%
BU’s:+16.3%
INSTITUTIONAL PRESENTATION – 1H 2019
4.5xBU’s:+3.2%
Note: From 2018 year-end, EBITDA including IFRS 16 impact.
vs.2018
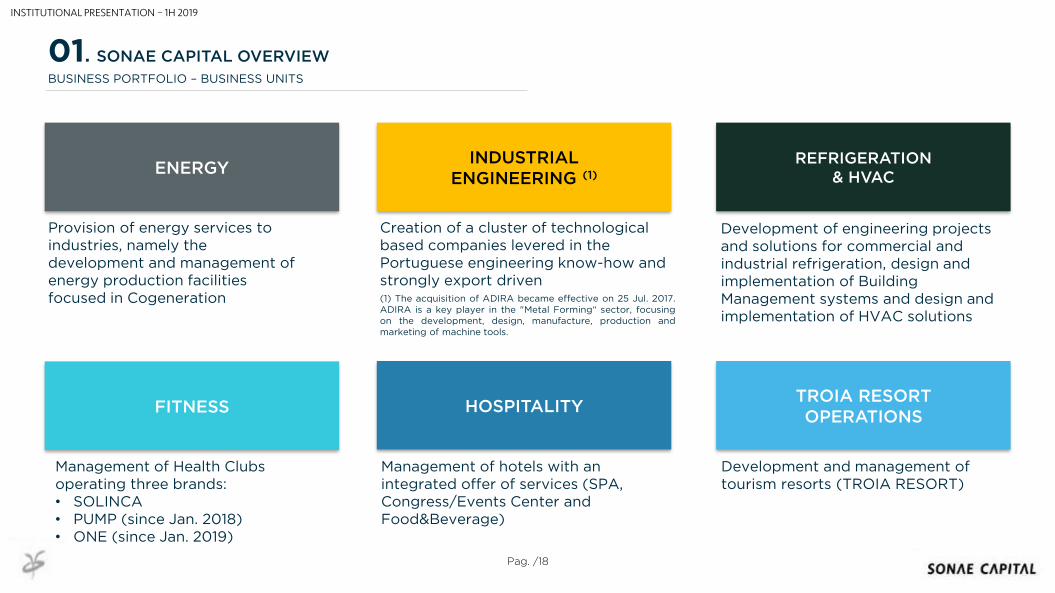
ENERGY
TROIA RESORTOPERATIONS
REFRIGERATION & HVAC
HOSPITALITYFITNESS
Development and management of tourism resorts (TROIA RESORT)
Provision of energy services to industries, namely the development and management of energy production facilities focused in Cogeneration
Management of hotels with an integrated offer of services (SPA, Congress/Events Center and Food&Beverage)
Management of Health Clubs operating three brands:• SOLINCA• PUMP (since Jan. 2018)• ONE (since Jan. 2019)
Pag. /18
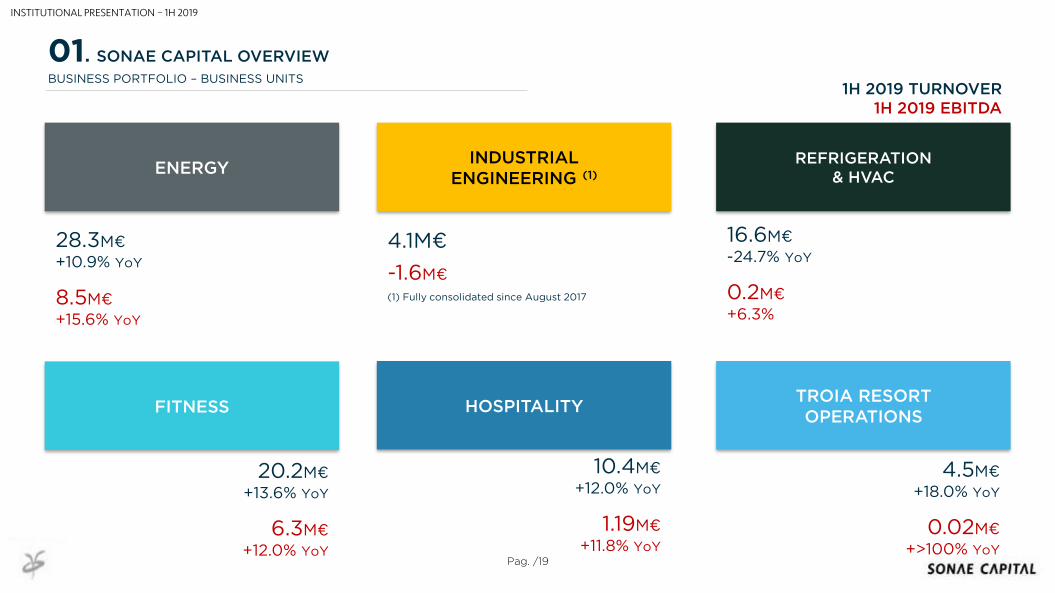
BUSINESS PORTFOLIO – BUSINESS UNITS
Development of engineering projects and solutions for commercial and industrial refrigeration, design and implementation of Building Management systems and design and implementation of HVAC solutions
INDUSTRIAL ENGINEERING (1)
Creation of a cluster of technological based companies levered in the Portuguese engineering know-how and strongly export driven(1) The acquisition of ADIRA became effective on 25 Jul. 2017.ADIRA is a key player in the "Metal Forming“ sector, focusingon the development, design, manufacture, production andmarketing of machine tools.
01. SONAE CAPITAL OVERVIEW
INSTITUTIONAL PRESENTATION – 1H 2019
Pag. /19
1H 2019 TURNOVER 1H 2019 EBITDA
28.3M€
+10.9% YoY
8.5M€
+15.6% YoY
4.1M€
-1.6M€
(1) Fully consolidated since August 2017
16.6M€
-24.7% YoY
0.2M€
+6.3%
20.2M€
+13.6% YoY
6.3M€
+12.0% YoY
10.4M€
+12.0% YoY
1.19M€
+11.8% YoY
4.5M€
+18.0% YoY
0.02M€
+>100% YoY
01. SONAE CAPITAL OVERVIEW
BUSINESS PORTFOLIO – BUSINESS UNITS
ENERGY
TROIA RESORTOPERATIONS
REFRIGERATION & HVAC
HOSPITALITYFITNESS
INDUSTRIAL ENGINEERING (1)
INSTITUTIONAL PRESENTATION – 1H 2019
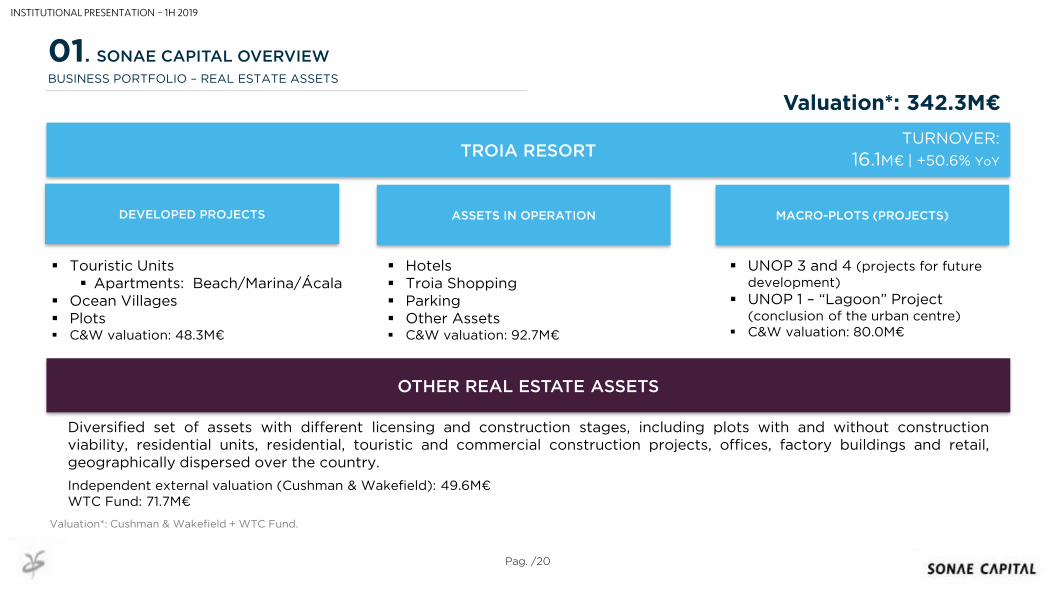
OTHER REAL ESTATE ASSETS
TROIA RESORT
Pag. /20
MACRO-PLOTS (PROJECTS)ASSETS IN OPERATIONDEVELOPED PROJECTS
Diversified set of assets with different licensing and construction stages, including plots with and without constructionviability, residential units, residential, touristic and commercial construction projects, offices, factory buildings and retail,geographically dispersed over the country.
Independent external valuation (Cushman & Wakefield): 49.6M€WTC Fund: 71.7M€
Touristic Units Apartments: Beach/Marina/Ácala
Ocean Villages Plots C&W valuation: 48.3M€
Hotels Troia Shopping Parking Other Assets C&W valuation: 92.7M€
UNOP 3 and 4 (projects for future development)
UNOP 1 – “Lagoon” Project (conclusion of the urban centre)
C&W valuation: 80.0M€
Valuation*: 342.3M€
TURNOVER:
16.1M€ | +50.6% YoY
01. SONAE CAPITAL OVERVIEW
BUSINESS PORTFOLIO – REAL ESTATE ASSETS
Valuation*: Cushman & Wakefield + WTC Fund.
INSTITUTIONAL PRESENTATION – 1H 2019

Troia Resort
Op.5.4%
Hospitality12.3%
Fitness24.0%
Energy33.7%
Ref. & HVAC19.8%
Industrial Eng.4.8%
Pag. /21
BUSINESS PORTFOLIO
4.50 3.81 +18.0%
10.4 9.3 +12.0%
20.2 17.7 +13.6%
28.3 25.6 +10.9%
16.6 22.1 -24.7%
4.1 6.4 -36.0%
84.0 84.8 -0.9%
8.9 6.6 +35.7%
7.2 4.1 +74.7%
16.1 10.7 +50.6%
TROIA RESORT OP.
HOSPITALITY
FITNESS
ENERGY
REF. & HVAC
IND. ENG.
REAL ESTATE
TURNOVER (M€)
0.0 -0.8 -
1.2 1.1 +11.8%
6.3 5.6 +12.0%
8.5 7.3 +15.6%
0.2 0.2 +6.3%
-1.6 -0.5 -
14.5 12.9 +12.8%
1.2 -1.0 -
4.5 1.6 -
5.8 0.6 -
0.4% -21.5% +22.0pp
11.5% 11.5% -
31.0% 31.5% -0.4pp
29.9% 28.7% +1.2pp
1.2% 0.9% +0.4pp
-39.5% -7.5% -32.0pp
17.3% 15.2% +2.1pp
1H19 1H18 D 19/18 1H19 1H18 D 19/18 1H19 1H18 D 19/18
EBITDA (M€) EBITDA Margin (%)
BU’STOP LINE1H 2019
1H 2019 PERFORMANCE SHOWS BUSINESS UNITS’S CONSISTENT GROWTH PATH, WITH EBITDA UP BY 12.8% YOY, DRIVEN BY M&A(ENERGY AND FITNESS) AND ORGANIC GROWTH
TROIA RESORT
OTHER REAL ESTATE
BUSINESS UNITS
01. SONAE CAPITAL OVERVIEW
INSTITUTIONAL PRESENTATION – 1H 2019
AGENDA
02 BUSINESSESPORTFOLIO
INSTITUTIONAL PRESENTATION – 1H 2019
02BUSINESSES PORTFOLIO
INSTITUTIONAL PRESENTATION – 1H 2019
Pag. /24
02
BUSINEESES PORTFOLIO
ENERGY
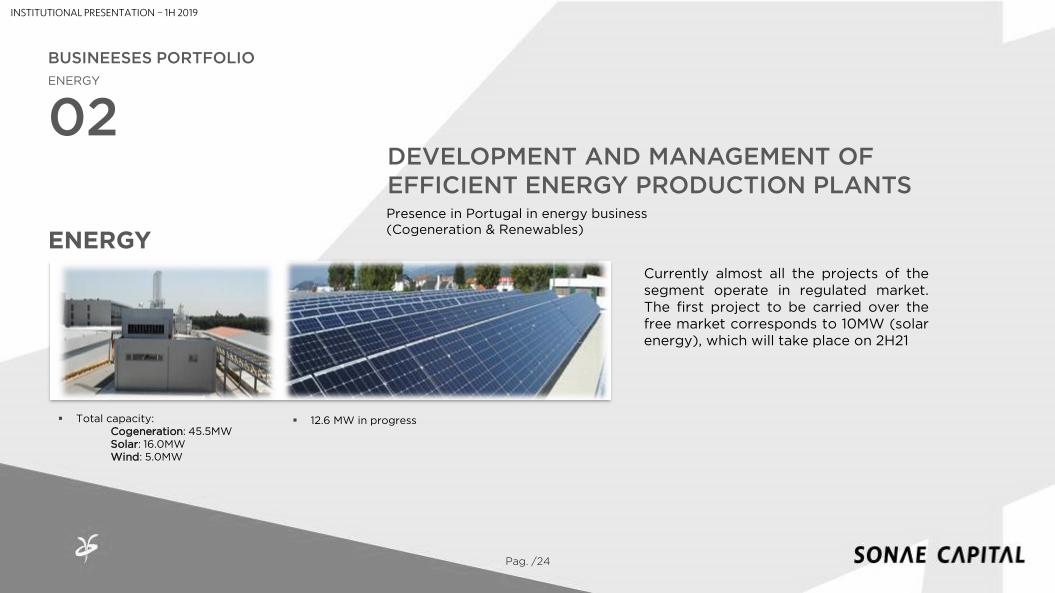
ENERGY
Presence in Portugal in energy business (Cogeneration & Renewables)
Total capacity:Cogeneration: 45.5MWSolar: 16.0MWWind: 5.0MW
DEVELOPMENT AND MANAGEMENT OF EFFICIENT ENERGY PRODUCTION PLANTS
Currently almost all the projects of thesegment operate in regulated market.The first project to be carried over thefree market corresponds to 10MW (solarenergy), which will take place on 2H21
INSTITUTIONAL PRESENTATION – 1H 2019
12.6 MW in progress
02
Pag. /25
BUSINEESES PORTFOLIO
ENERGY
ENERGY
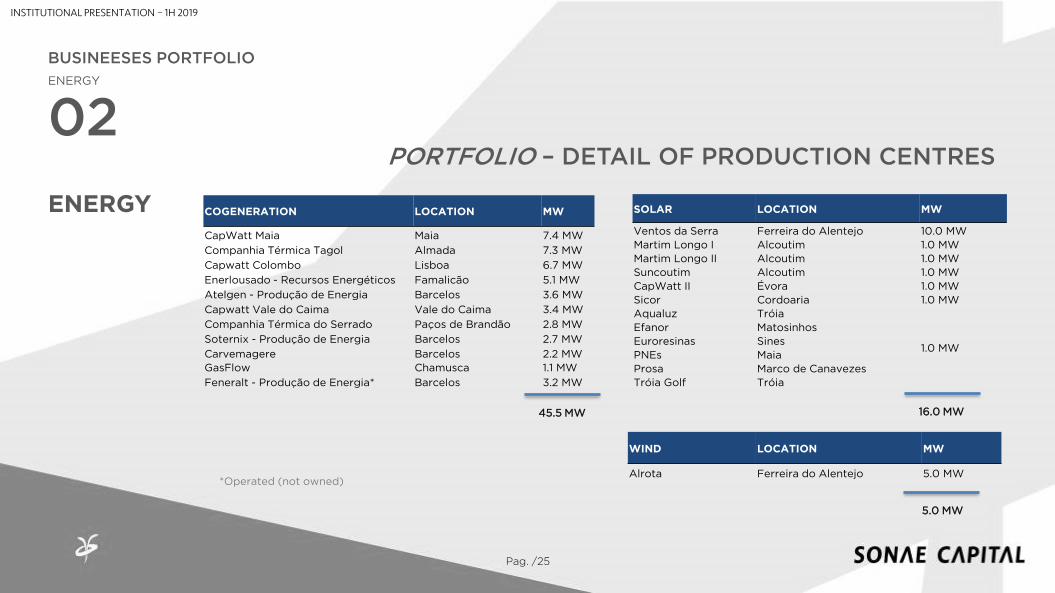
PORTFOLIO – DETAIL OF PRODUCTION CENTRES
INSTITUTIONAL PRESENTATION – 1H 2019
COGENERATION LOCATION MW
CapWatt Maia Maia 7.4 MW
Companhia Térmica Tagol Almada 7.3 MW
Capwatt Colombo Lisboa 6.7 MW
Enerlousado - Recursos Energéticos Famalicão 5.1 MW
Atelgen - Produção de Energia Barcelos 3.6 MW
Capwatt Vale do Caima Vale do Caima 3.4 MW
Companhia Térmica do Serrado Paços de Brandão 2.8 MW
Soternix - Produção de Energia Barcelos 2.7 MW
Carvemagere Barcelos 2.2 MW
GasFlow Chamusca 1.1 MW
Feneralt - Produção de Energia* Barcelos 3.2 MW
*Operated (not owned)
45.5 MW
SOLAR LOCATION MW
Ventos da Serra Ferreira do Alentejo 10.0 MW
Martim Longo I Alcoutim 1.0 MW
Martim Longo II Alcoutim 1.0 MW
Suncoutim Alcoutim 1.0 MW
CapWatt II Évora 1.0 MW
Sicor Cordoaria 1.0 MW
Aqualuz Tróia
1.0 MW
Efanor Matosinhos
Euroresinas Sines
PNEs Maia
Prosa Marco de Canavezes
Tróia Golf Tróia
16.0 MW
5.0 MW
WIND LOCATION MW
Alrota Ferreira do Alentejo 5.0 MW
Pag. /26
02
47.450.6
38.2
45.2
25.6
52.6
28.3
2014 2015 2016 2017 1H18 2018 1H19
+6.7% -24.4% +18.3%
9.59.2
7.8
14.2
7.3
15.1
8.520,0%
18,2%
20,4%
31.4%
28.7%29.7% 29.9%
12,0%10,6%
12,1%
16.0%
10.1%9.2%
10.6%
2014 2015 2016 2017 1H18 2018 1H19
EBITDAMargin
EBITMargin
YoY -2.7% -15.2% +81.8%
BUSINEESES PORTFOLIO
ENERGY
ENERGY
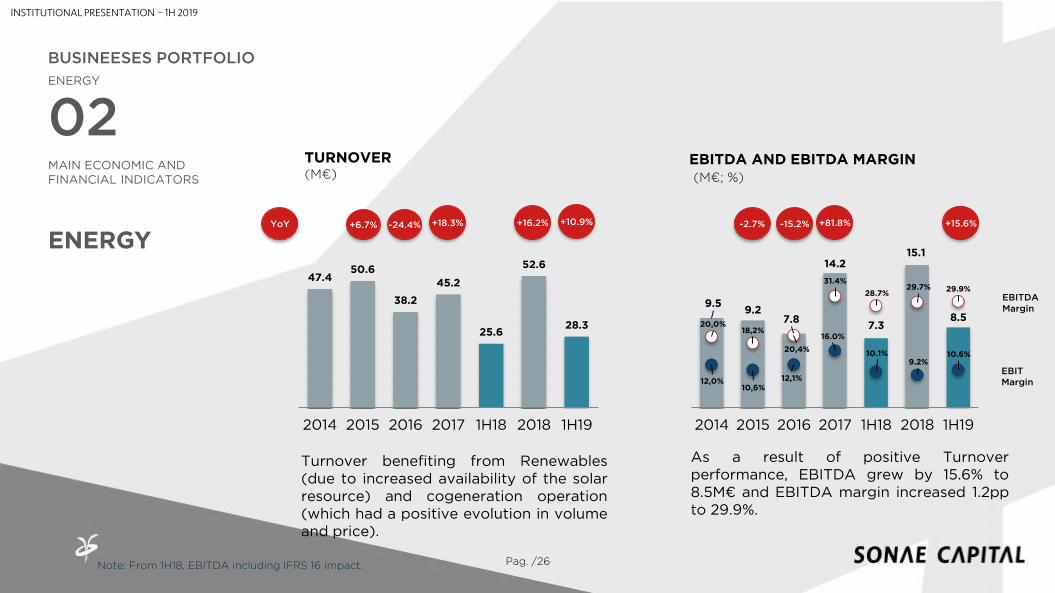
MAIN ECONOMIC AND FINANCIAL INDICATORS
TURNOVER(M€)
EBITDA AND EBITDA MARGIN(M€; %)
Turnover benefiting from Renewables(due to increased availability of the solarresource) and cogeneration operation(which had a positive evolution in volumeand price).
As a result of positive Turnoverperformance, EBITDA grew by 15.6% to8.5M€ and EBITDA margin increased 1.2ppto 29.9%.
+16.2%
INSTITUTIONAL PRESENTATION – 1H 2019
+10.9%
Note: From 1H18, EBITDA including IFRS 16 impact.
+15.6%
OUTLOOK
LOOK FOR NEW BUSINESS OPPORTUNITIES BOTH INPORTUGAL AND INTERNATIONALLY, BASED ON A PRE-DEFINED RISK AND PROFITABILITY CRITERIA.
IN PORTUGAL, THE COMPETITIVE POSITION REINFORCEMENTIS FORECASTED BASED ON ENLARGED OPERATEDTECHNOLOGIES. INTERNATIONALLY, FOCUS WILL BE BASEDON INTERNAL COMPETENCES LINKED TO COGENERATION.
Pag. /27
02
BUSINEESES PORTFOLIO
ENERGY
ENERGY
INSTITUTIONAL PRESENTATION – 1H 2019
BUSINESSES PORTFOLIO
02INDUSTRIAL ENGINEERING
INSTITUTIONAL PRESENTATION – 1H 2019
02
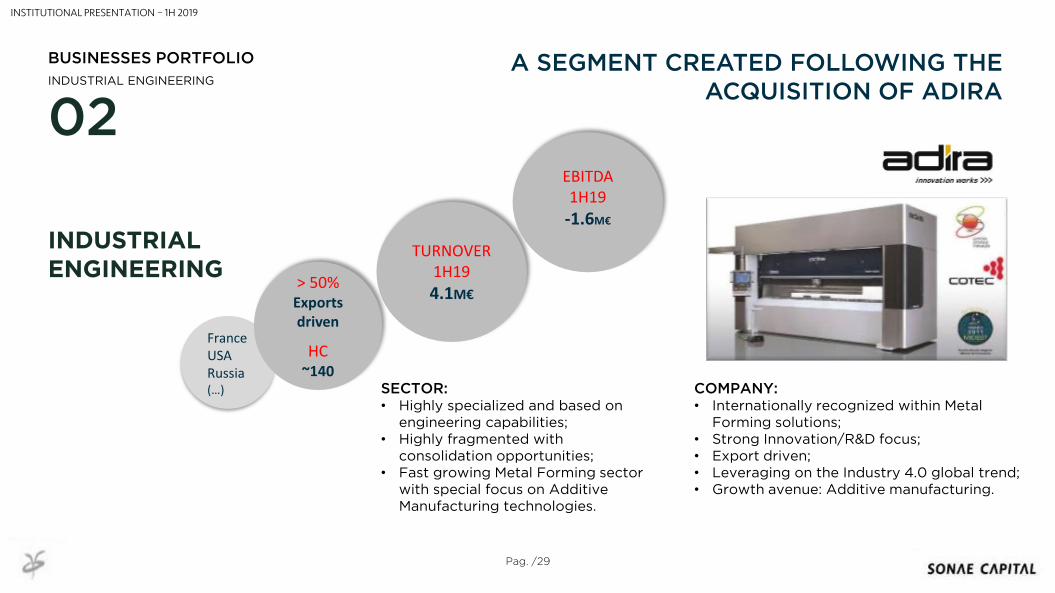
SECTOR:• Highly specialized and based on
engineering capabilities;• Highly fragmented with
consolidation opportunities;• Fast growing Metal Forming sector
with special focus on Additive Manufacturing technologies.
COMPANY:• Internationally recognized within Metal
Forming solutions;• Strong Innovation/R&D focus;• Export driven;• Leveraging on the Industry 4.0 global trend;• Growth avenue: Additive manufacturing.
TURNOVER1H19
4.1M€
INDUSTRIALENGINEERING
BUSINESSES PORTFOLIO
INDUSTRIAL ENGINEERINGA SEGMENT CREATED FOLLOWING THE
ACQUISITION OF ADIRA
EBITDA 1H19
-1.6M€
FranceUSARussia(…)
> 50%Exports driven
HC~140
Pag. /29
INSTITUTIONAL PRESENTATION – 1H 2019
02
INDUSTRIALENGINEERING
BUSINESSES PORTFOLIO
INDUSTRIAL ENGINEERINGA SEGMENT CREATED FOLLOWING THE
ACQUISITION OF ADIRA
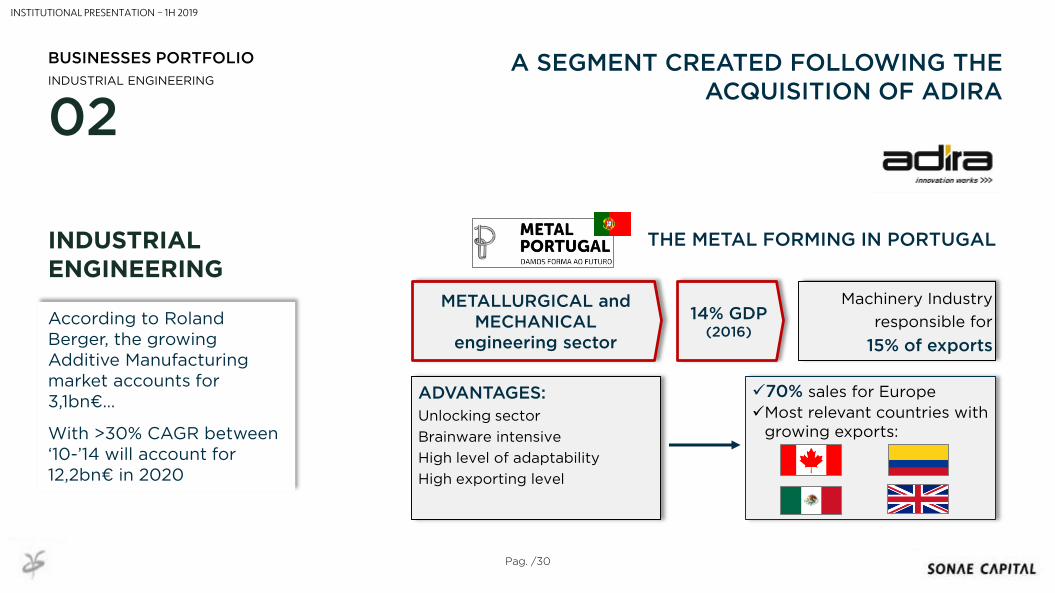
THE METAL FORMING IN PORTUGAL
70% sales for Europe
Most relevant countries with growing exports:
Machinery Industry
responsible for
15% of exports
METALLURGICAL and MECHANICAL
engineering sector
ADVANTAGES:
Unlocking sector
Brainware intensive
High level of adaptability
High exporting level
14% GDP(2016)
According to Roland Berger, the growing Additive Manufacturing market accounts for 3,1bn€…
With >30% CAGR between ‘10-’14 will account for 12,2bn€ in 2020
Pag. /30
INSTITUTIONAL PRESENTATION – 1H 2019

02
BUSINESSES PORTFOLIO
INDUSTRIAL ENGINEERINGA SEGMENT CREATED FOLLOWING THE
ACQUISITION OF ADIRA
A RELEVANT PLAYER IN THE METAL FORMING, WITH OVER 60 YEARS OF HISTORY AND A MAJOR EXPORTING ACTIVITY
LASERSPECIAL
BENDING CELLS
CUSTOMIZED SOLUTIONS
SERVICE
• Installation and guarantees
• Technical assistance
• Technical training sessions
• Machines retrofitting
REPRESENTANT.
Commercial activity for other brand’s machines in order to fill the
client’s offer
BENDING
SHEARS
STANDARDADDITIVE
MANUFACTURING
New business unit that
started activity in 2016
Main target sectors
AUTOMAKERS AEROSPACIAL METALIC BUILDINGS
TELECOM & IT METAL FURNITURE
ENVIRONMENT & RENEWABLE
ENERGY
May-17 INOVATION AWARD
Portfolio aligned with the major
growing segments
worldwide, providing
standard and premium solutions
Pag. /31
INSTITUTIONAL PRESENTATION – 1H 2019

BUSINESSES PORTFOLIO
02
INSTITUTIONAL PRESENTATION – 1H 2019
IMAGEM
Pag. /33
02
BISINESSES PORTFOLIO
REFRIGERATION & HVAC
REFRIGERATION & HVAC
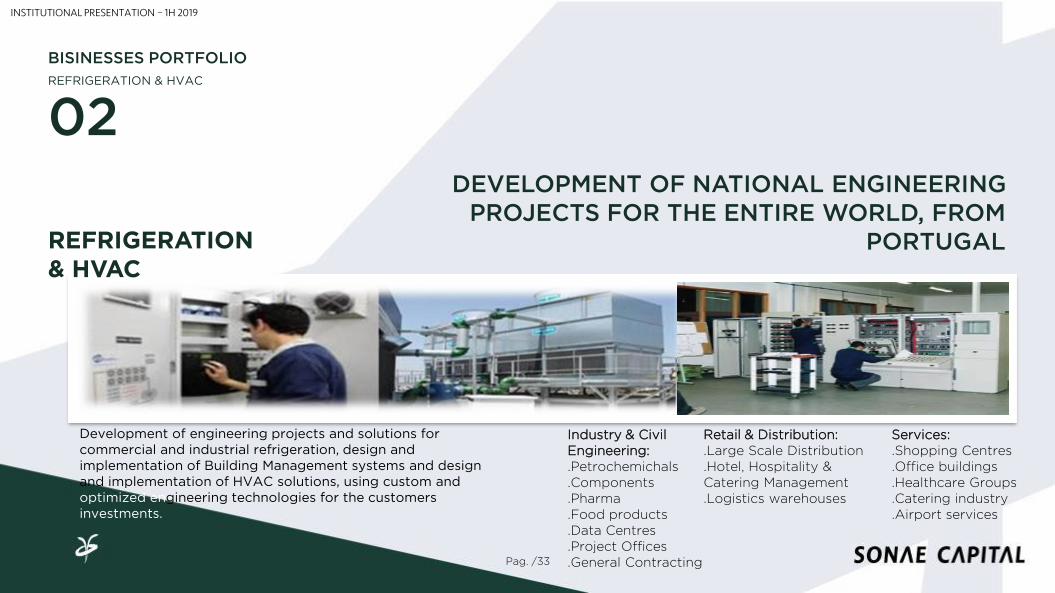
Industry & Civil Engineering:.Petrochemichals.Components.Pharma.Food products.Data Centres.Project Offices.General Contracting
Retail & Distribution:.Large Scale Distribution.Hotel, Hospitality & Catering Management.Logistics warehouses
Services:.Shopping Centres.Office buildings.Healthcare Groups.Catering industry.Airport services
Development of engineering projects and solutions for commercial and industrial refrigeration, design and implementation of Building Management systems and design and implementation of HVAC solutions, using custom and optimized engineering technologies for the customers investments.
DEVELOPMENT OF NATIONAL ENGINEERING PROJECTS FOR THE ENTIRE WORLD, FROM
PORTUGAL
INSTITUTIONAL PRESENTATION – 1H 2019
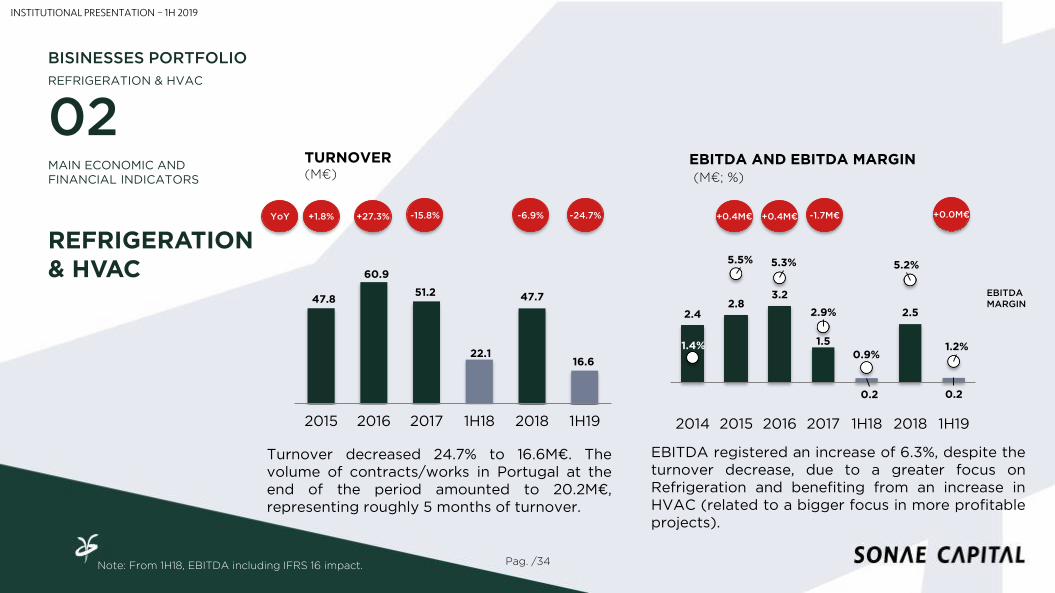
Turnover decreased 24.7% to 16.6M€. Thevolume of contracts/works in Portugal at theend of the period amounted to 20.2M€,representing roughly 5 months of turnover.
EBITDA registered an increase of 6.3%, despite theturnover decrease, due to a greater focus onRefrigeration and benefiting from an increase inHVAC (related to a bigger focus in more profitableprojects).
Pag. /34
MAIN ECONOMIC AND FINANCIAL INDICATORS
02
EBITDAMARGIN47.8
60.9
51.2
22.1
47.7
16.6
2015 2016 2017 1H18 2018 1H19
2.42.8
3.2
1.5
0.2
2.5
0.2
1.4%
5.5% 5.3%
2.9%
0.9%
5.2%
1.2%
2014 2015 2016 2017 1H18 2018 1H19
+1.8% +27.3% -15.8% +0.4M€ +0.4M€ -1.7M€YoY
BISINESSES PORTFOLIO
REFRIGERATION & HVAC
REFRIGERATION & HVAC
TURNOVER(M€)
EBITDA AND EBITDA MARGIN(M€; %)
-6.9%
INSTITUTIONAL PRESENTATION – 1H 2019
Note: From 1H18, EBITDA including IFRS 16 impact.
-24.7% +0.0M€

OUTLOOK
AFTER THE RESTRUCTURING AND STRATEGICREPOSITIONING PROCESS COMPLETION, CONTINUEFOCUSED ON VALUE CREATION OPPORTUNITIES, WITHSPECIAL EMPHASIS ON THE REFRIGERATION SEGMENTAND ON THE INTERNATIONALIZATION PROCESS BASEDON EXPORTS.
Pag. /35
02
BISINESSES PORTFOLIO
REFRIGERATION & HVAC
REFRIGERATION & HVAC
INSTITUTIONAL PRESENTATION – 1H 2019

FITNESS
BUSINESSES PORTFOLIO
02
INSTITUTIONAL PRESENTATION – 1H 2019
FITNESS
02
IMAGEM
FITNESS
BUSINESSES PORTFOLIO
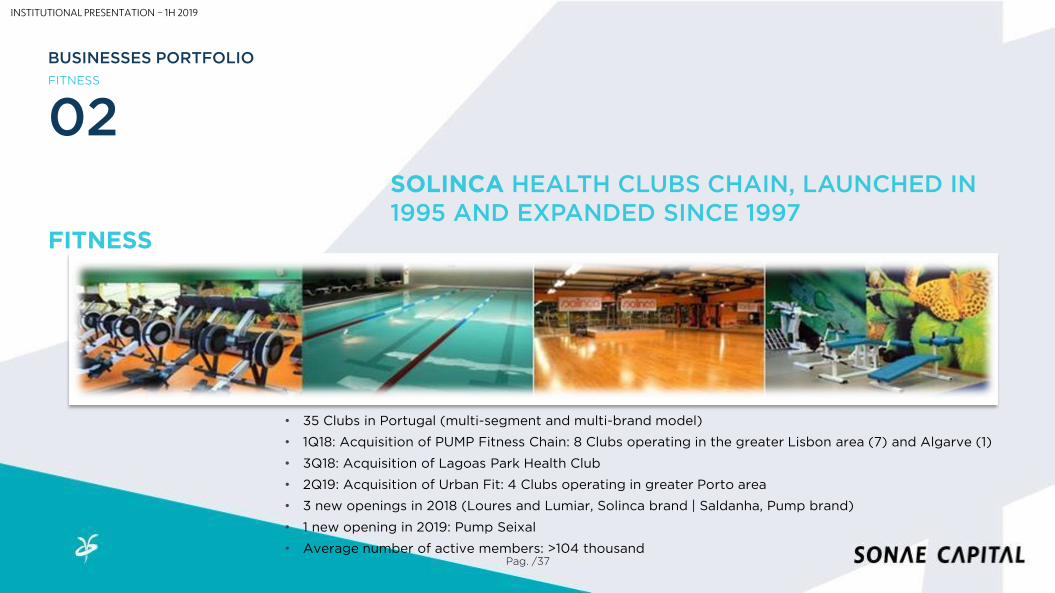
SOLINCA HEALTH CLUBS CHAIN, LAUNCHED IN 1995 AND EXPANDED SINCE 1997
• 35 Clubs in Portugal (multi-segment and multi-brand model)
• 1Q18: Acquisition of PUMP Fitness Chain: 8 Clubs operating in the greater Lisbon area (7) and Algarve (1)
• 3Q18: Acquisition of Lagoas Park Health Club
• 2Q19: Acquisition of Urban Fit: 4 Clubs operating in greater Porto area
• 3 new openings in 2018 (Loures and Lumiar, Solinca brand | Saldanha, Pump brand)
• 1 new opening in 2019: Pump Seixal
• Average number of active members: >104 thousandPag. /37
INSTITUTIONAL PRESENTATION – 1H 2019

Reinforcement of the competitive position,reflected in the increased av. number ofactive members (104 thousand) and in theincreased turnover.
The performance registered at the Turnover level is also reflected at the EBITDA, which increased by 12.0% y.o.y..
Pag. /38
FITNESS
02
FITNESS
13.715.2
18.1
23.3
17.7
36.1
20.2
2014 2015 2016 2017 1H18 2018 1H19
1.4 1.8 2.2 1.85.6
10.9
6.3
10.0%12.0%
11.9%
7.7%
31.5%30.3%
31.0%
2014 2015 2016 2017 1H18 2018 1H19
+10.6% +19.1% +28.5% +0.5M€ +0.3M€ -0.4M€YoY
BUSINESSES PORTFOLIO
TURNOVER (M€)
MAIN ECONOMIC AND FINANCIL INDICATORS
EBITDA AND EBITDA MARGIN(M€; %)
EBITDAMARGIN
+55.4%
INSTITUTIONAL PRESENTATION – 1H 2019
Note: From 1H18, EBITDA including IFRS 16 impact.
+13.6% +0.8M€
OUTLOOK
SEARCH FOR NEW VALUE CREATION OPPORTUNITIES, WHILEIMPLEMENTING AN EXPANSION PLAN ALREADY DEFINEDFOLLOWING A CAPITAL LIGHT APPROACH.
Pag. /39
FITNESS
02
FITNESS
BUSINESSES PORTFOLIO
INSTITUTIONAL PRESENTATION – 1H 2019
HOSPITALITY
BUSINESSES PORTFOLIO
02
INSTITUTIONAL PRESENTATION – 1H 2019
02
Pag. /41
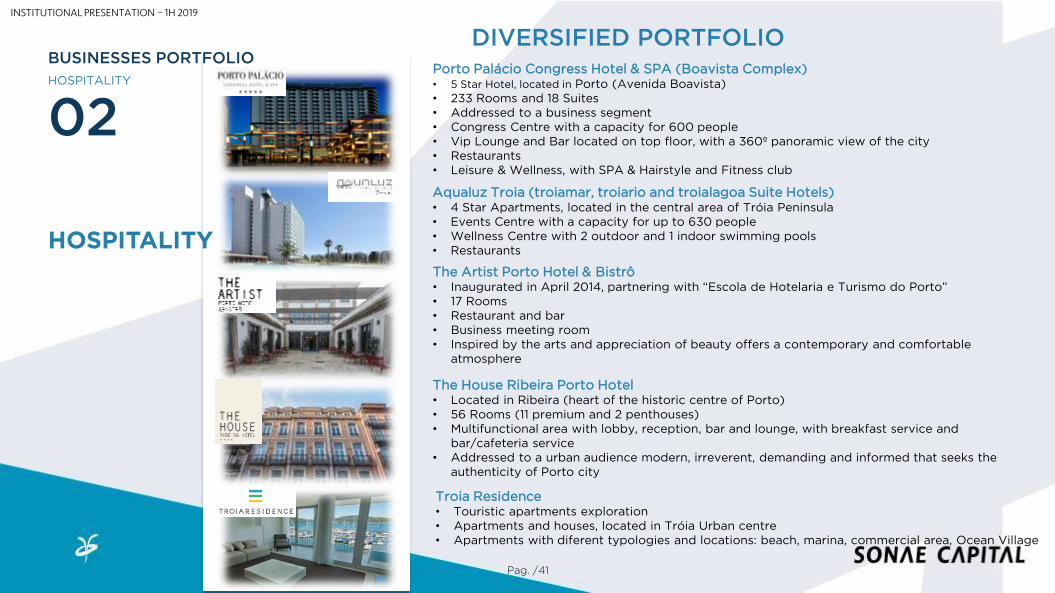
Troia Residence• Touristic apartments exploration• Apartments and houses, located in Tróia Urban centre• Apartments with diferent typologies and locations: beach, marina, commercial area, Ocean Village
HOSPITALITY
HOSPITALITY
BUSINESSES PORTFOLIOPorto Palácio Congress Hotel & SPA (Boavista Complex)• 5 Star Hotel, located in Porto (Avenida Boavista)• 233 Rooms and 18 Suites• Addressed to a business segment• Congress Centre with a capacity for 600 people• Vip Lounge and Bar located on top floor, with a 360º panoramic view of the city• Restaurants• Leisure & Wellness, with SPA & Hairstyle and Fitness club
Aqualuz Troia (troiamar, troiario and troialagoa Suite Hotels)• 4 Star Apartments, located in the central area of Tróia Peninsula• Events Centre with a capacity for up to 630 people• Wellness Centre with 2 outdoor and 1 indoor swimming pools• Restaurants
The Artist Porto Hotel & Bistrô• Inaugurated in April 2014, partnering with “Escola de Hotelaria e Turismo do Porto”• 17 Rooms• Restaurant and bar • Business meeting room• Inspired by the arts and appreciation of beauty offers a contemporary and comfortable
atmosphere
DIVERSIFIED PORTFOLIO
The House Ribeira Porto Hotel• Located in Ribeira (heart of the historic centre of Porto)• 56 Rooms (11 premium and 2 penthouses)• Multifunctional area with lobby, reception, bar and lounge, with breakfast service and
bar/cafeteria service• Addressed to a urban audience modern, irreverent, demanding and informed that seeks the
authenticity of Porto city
INSTITUTIONAL PRESENTATION – 1H 2019
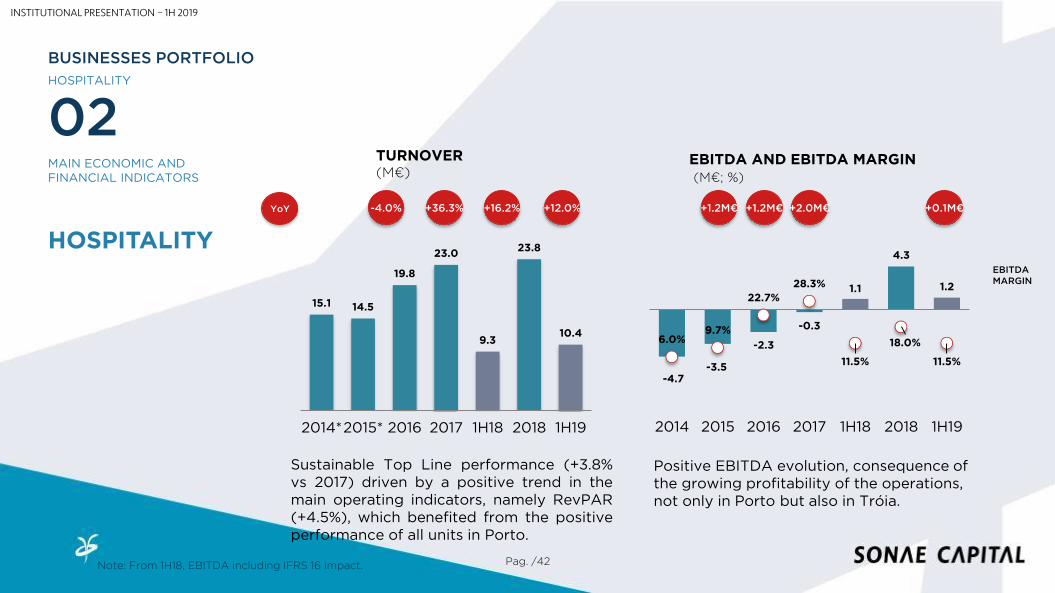
Sustainable Top Line performance (+3.8%vs 2017) driven by a positive trend in themain operating indicators, namely RevPAR(+4.5%), which benefited from the positiveperformance of all units in Porto.
Positive EBITDA evolution, consequence of the growing profitability of the operations, not only in Porto but also in Tróia.
Pag. /42
EBITDAMARGIN
02
15.1 14.5
19.8
23.0
9.3
23.8
10.4
2014*2015* 2016 2017 1H18 2018 1H19
-4.7-3.5
-2.3
-0.3
1.1
4.3
1.2
6.0%9.7%
22.7%
28.3%
11.5%
18.0%
11.5%
2014 2015 2016 2017 1H18 2018 1H19
YoY +16.2% +2.0M€+36.3%-4.0% +1.2M€+1.2M€
HOSPITALITY
HOSPITALITY
BUSINESSES PORTFOLIO
TURNOVER (M€)
MAIN ECONOMIC AND FINANCIAL INDICATORS
EBITDA AND EBITDA MARGIN(M€; %)
+12.0% +0.1M€
INSTITUTIONAL PRESENTATION – 1H 2019
Note: From 1H18, EBITDA including IFRS 16 impact.
OUTLOOK
CONTINUE IMPROVING PROFITAILITY AND THE COMPETITIVEPOSITION OF CURRENT OPERATIONS.
SEARCH FOR NON-ORGANIC SOLUTIONS TATH IMPROVE THEOVERALL COMPETITIVE POSITION OF THE SEGMENT.
Pag. /43
02
HOSPITALITY
HOSPITALITY
BUSINESSES PORTFOLIO
INSTITUTIONAL PRESENTATION – 1H 2019
BUSINESSES PORTFOLIO
02TROIA RESORT - OPERTIONS
INSTITUTIONAL PRESENTATION – 1H 2019
Pag. /45
02
TROIA RESORTOPERATIONS
BUSINESSES PORTFOLIO
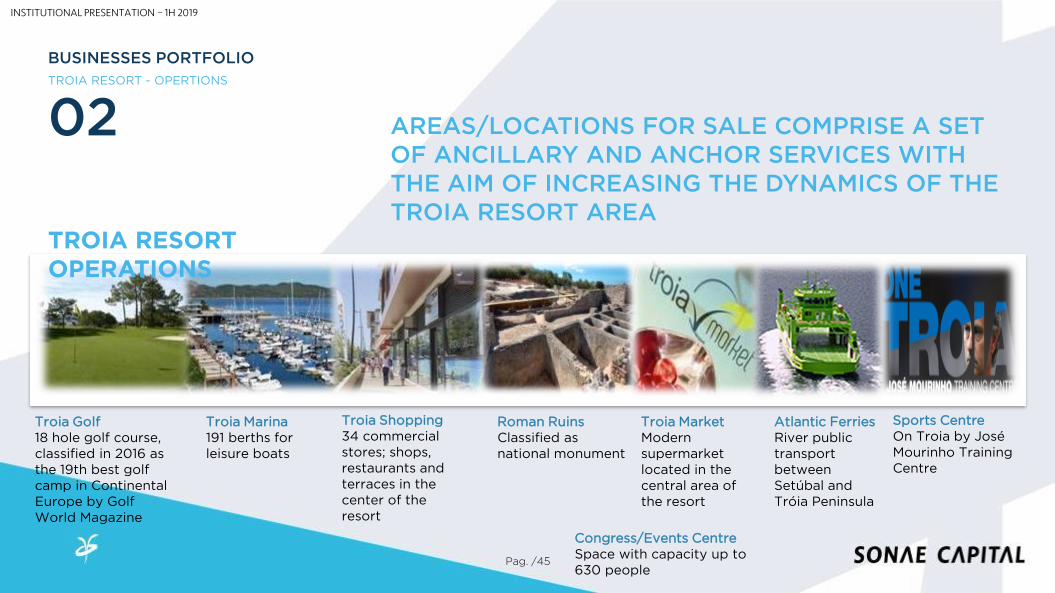
TROIA RESORT - OPERTIONS
Troia Marina191 berths for leisure boats
Troia MarketModern supermarket located in the central area of the resort
Troia Shopping34 commercial stores; shops, restaurants and terraces in the center of the resort
AREAS/LOCATIONS FOR SALE COMPRISE A SET OF ANCILLARY AND ANCHOR SERVICES WITH THE AIM OF INCREASING THE DYNAMICS OF THE TROIA RESORT AREA
Atlantic FerriesRiver public transport between Setúbal and Tróia Peninsula
Roman RuinsClassified as national monument
Congress/Events CentreSpace with capacity up to 630 people
Troia Golf18 hole golf course, classified in 2016 as the 19th best golf camp in Continental Europe by Golf World Magazine
Sports CentreOn Troia by José Mourinho Training Centre
INSTITUTIONAL PRESENTATION – 1H 2019
TURNOVER(M€)
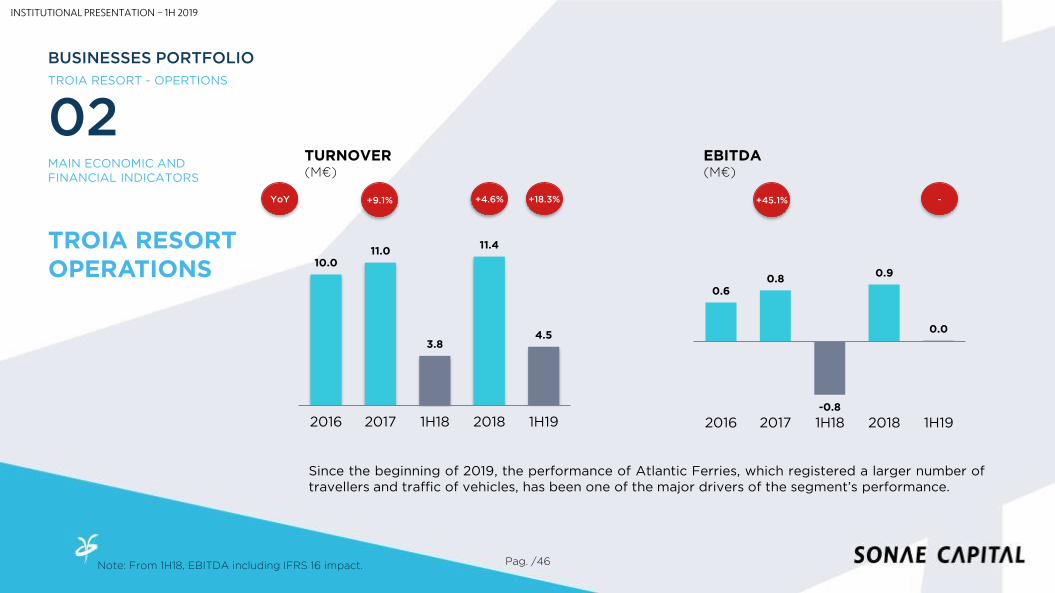
Since the beginning of 2019, the performance of Atlantic Ferries, which registered a larger number oftravellers and traffic of vehicles, has been one of the major drivers of the segment’s performance.
Pag. /46
MAIN ECONOMIC AND FINANCIAL INDICATORS
02
10.011.0
3.8
11.4
4.5
2016 2017 1H18 2018 1H19
+4.6%+9.1%YoY
EBITDA(M€)
0.60.8
-0.8
0.9
0.0
2016 2017 1H18 2018 1H19
-+45.1%
TROIA RESORTOPERATIONS
BUSINESSES PORTFOLIO
TROIA RESORT - OPERTIONS
INSTITUTIONAL PRESENTATION – 1H 2019
Note: From 1H18, EBITDA including IFRS 16 impact.
+18.3%
Pag. /47
OUTLOOK
MAXIMIZE OPERATIONS PROFITABILITY TO ENSURE ITSSELF-SUSTAINABILITY.
02
TROIA RESORTOPERATIONS
BUSINESSES PORTFOLIO
TROIA RESORT - OPERTIONS
INSTITUTIONAL PRESENTATION – 1H 2019
AGENDA
03 REAL ESTATEASSETS
1. TROIA RESORT2. OTHER REAL ESTATE ASSETS
INSTITUTIONAL PRESENTATION – 1H 2019
REAL ESTATE
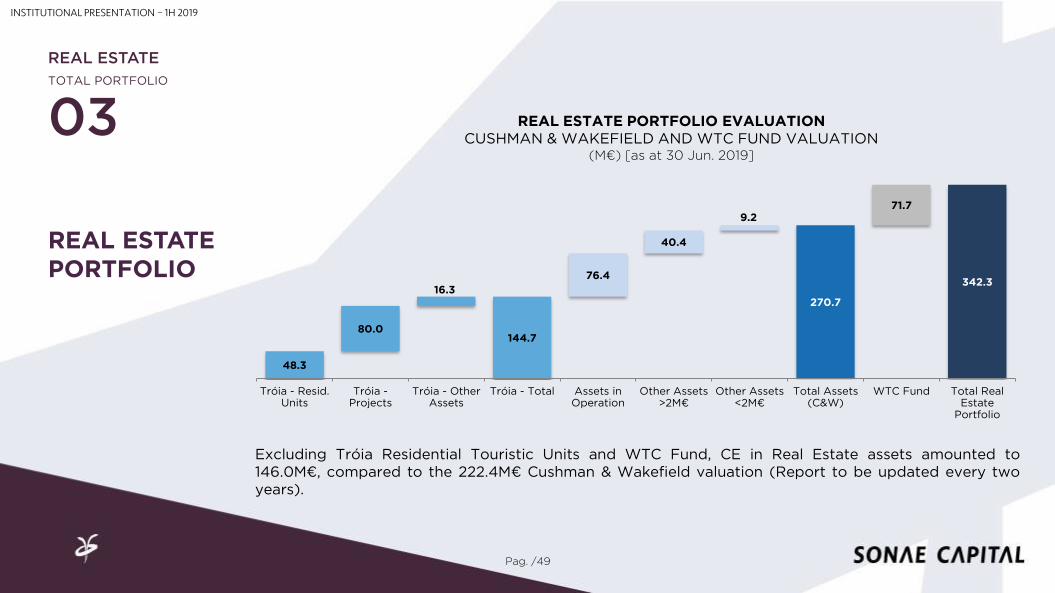
Excluding Tróia Residential Touristic Units and WTC Fund, CE in Real Estate assets amounted to146.0M€, compared to the 222.4M€ Cushman & Wakefield valuation (Report to be updated every twoyears).
Pag. /49
REAL ESTATEPORTFOLIO
03TOTAL PORTFOLIO
REAL ESTATE PORTFOLIO EVALUATIONCUSHMAN & WAKEFIELD AND WTC FUND VALUATION
(M€) [as at 30 Jun. 2019]
INSTITUTIONAL PRESENTATION – 1H 2019
48.3
80.0
16.3
144.7
76.4
40.4
9.2
270.7
71.7
342.3
Tróia - Resid.Units
Tróia -Projects
Tróia - OtherAssets
Tróia - Total Assets inOperation
Other Assets >2M€
Other Assets <2M€
Total Assets(C&W)
WTC Fund Total RealEstate
Portfolio

REAL ESTATE
03.1
TROIA RESORT
INSTITUTIONAL PRESENTATION – 1H 2019
Pag. /51
03.1
TROIA RESORT
REAL ESTATE
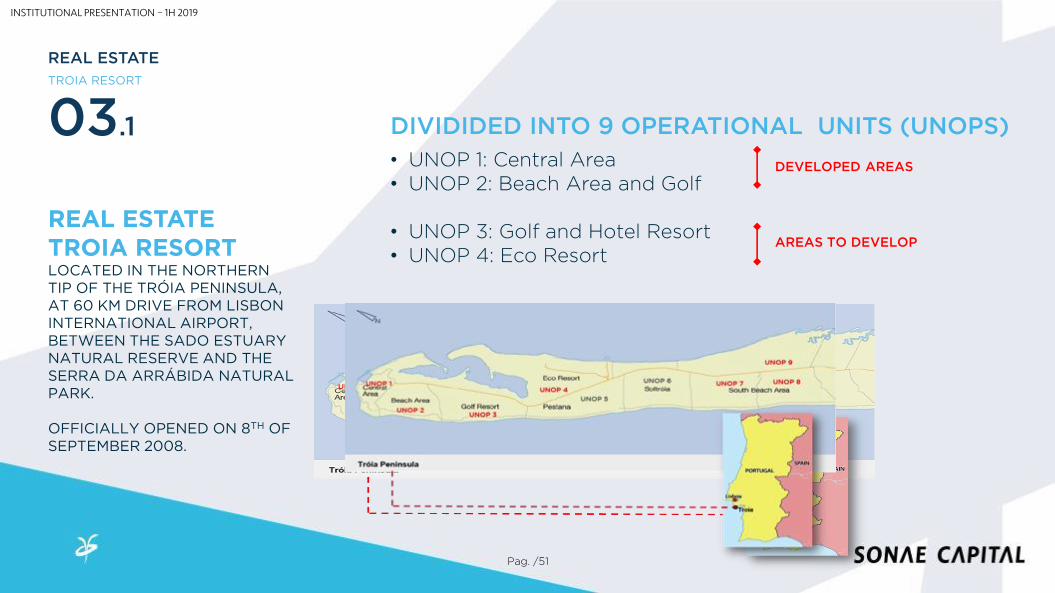
DIVIDIDED INTO 9 OPERATIONAL UNITS (UNOPS)
• UNOP 1: Central Area• UNOP 2: Beach Area and Golf
• UNOP 3: Golf and Hotel Resort• UNOP 4: Eco Resort
LOCATED IN THE NORTHERN TIP OF THE TRÓIA PENINSULA, AT 60 KM DRIVE FROM LISBON INTERNATIONAL AIRPORT,BETWEEN THE SADO ESTUARY NATURAL RESERVE AND THE SERRA DA ARRÁBIDA NATURAL PARK.
OFFICIALLY OPENED ON 8TH OF SEPTEMBER 2008.
REAL ESTATETROIA RESORT
DEVELOPED AREAS
AREAS TO DEVELOP
INSTITUTIONAL PRESENTATION – 1H 2019
Pag. /52
03.1
TROIA RESORT
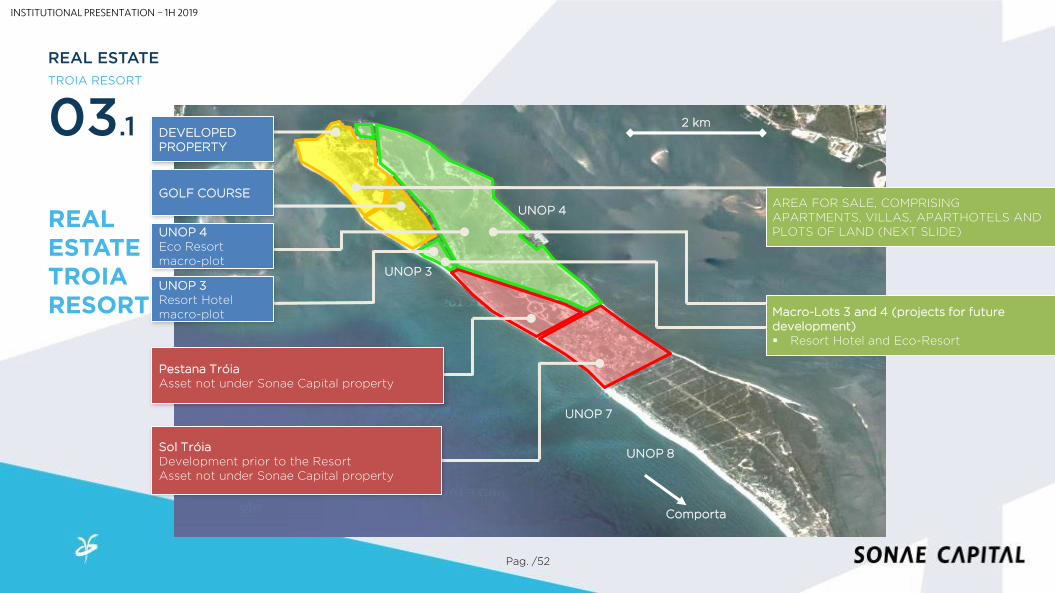
REAL ESTATE
REAL ESTATETROIARESORT
2 km
Comporta
AREA FOR SALE, COMPRISING APARTMENTS, VILLAS, APARTHOTELS AND PLOTS OF LAND (NEXT SLIDE)
GOLF COURSE
Pestana TróiaAsset not under Sonae Capital property
Macro-Lots 3 and 4 (projects for future development) Resort Hotel and Eco-Resort
DEVELOPED PROPERTY
UNOP 8
UNOP 7
UNOP 4
UNOP 3UNOP 3Resort Hotel macro-plot
UNOP 4Eco Resort macro-plot
Sol TróiaDevelopment prior to the ResortAsset not under Sonae Capital property
INSTITUTIONAL PRESENTATION – 1H 2019
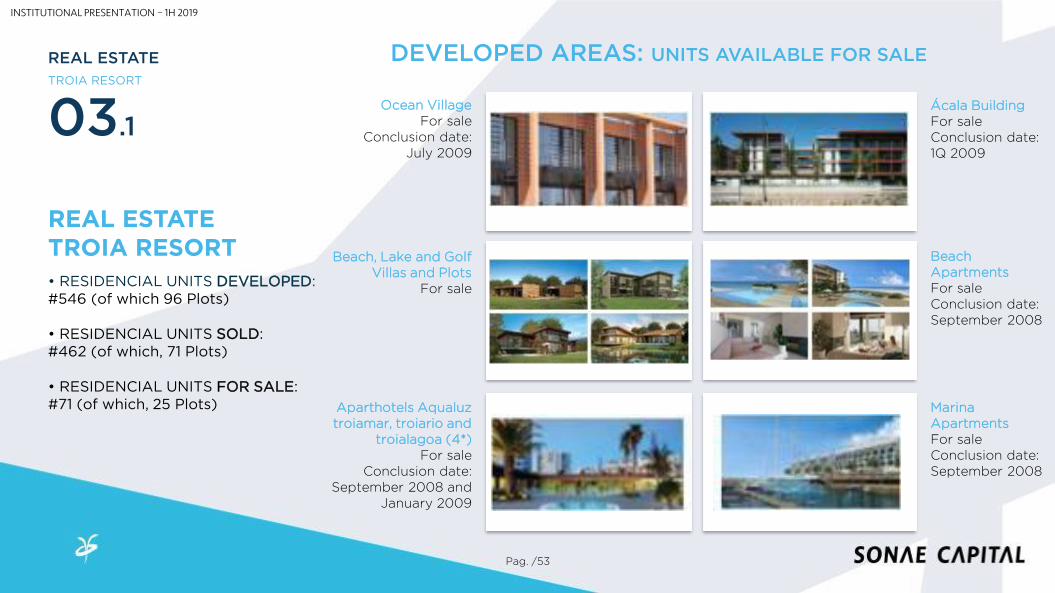
IMAGEM IMAGEM
IMAGEM IMAGEM
IMAGEM IMAGEM
Pag. /53
03.1
TROIA RESORT
REAL ESTATE
REAL ESTATETROIA RESORT
• RESIDENCIAL UNITS DEVELOPED: #546 (of which 96 Plots)
• RESIDENCIAL UNITS SOLD:#462 (of which, 71 Plots)
• RESIDENCIAL UNITS FOR SALE: #71 (of which, 25 Plots)
Ocean VillageFor sale
Conclusion date: July 2009
Beach, Lake and GolfVillas and Plots
For sale
Aparthotels Aqualuz troiamar, troiario and
troialagoa (4*)For sale
Conclusion date: September 2008 and
January 2009
Ácala BuildingFor saleConclusion date: 1Q 2009
Beach ApartmentsFor saleConclusion date: September 2008
Marina ApartmentsFor saleConclusion date: September 2008
DEVELOPED AREAS: UNITS AVAILABLE FOR SALE
INSTITUTIONAL PRESENTATION – 1H 2019
Pag. /54
03.1
TROIA RESORT
REAL ESTATE
REAL ESTATETROIA RESORT
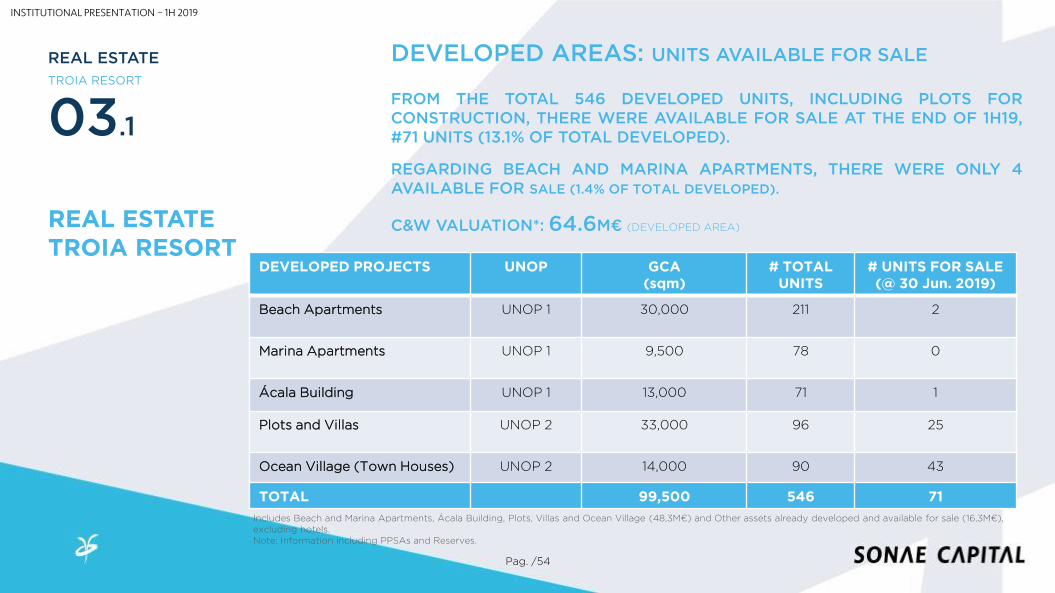
DEVELOPED AREAS: UNITS AVAILABLE FOR SALE
FROM THE TOTAL 546 DEVELOPED UNITS, INCLUDING PLOTS FORCONSTRUCTION, THERE WERE AVAILABLE FOR SALE AT THE END OF 1H19,#71 UNITS (13.1% OF TOTAL DEVELOPED).
REGARDING BEACH AND MARINA APARTMENTS, THERE WERE ONLY 4AVAILABLE FOR SALE (1.4% OF TOTAL DEVELOPED).
C&W VALUATION*: 64.6M€ (DEVELOPED AREA)
DEVELOPED PROJECTS UNOP GCA(sqm)
# TOTALUNITS
# UNITS FOR SALE (@ 30 Jun. 2019)
Beach Apartments UNOP 1 30,000 211 2
Marina Apartments UNOP 1 9,500 78 0
Ácala Building UNOP 1 13,000 71 1
Plots and Villas UNOP 2 33,000 96 25
Ocean Village (Town Houses) UNOP 2 14,000 90 43
TOTAL 99,500 546 71
Includes Beach and Marina Apartments, Ácala Building, Plots, Villas and Ocean Village (48,3M€) and Other assets already developed and available for sale (16,3M€), excluding hotels.Note: Information including PPSAs and Reserves.
INSTITUTIONAL PRESENTATION – 1H 2019
Pag. /55
03.1
TROIA RESORT
REAL ESTATE
REAL ESTATETROIA RESORT
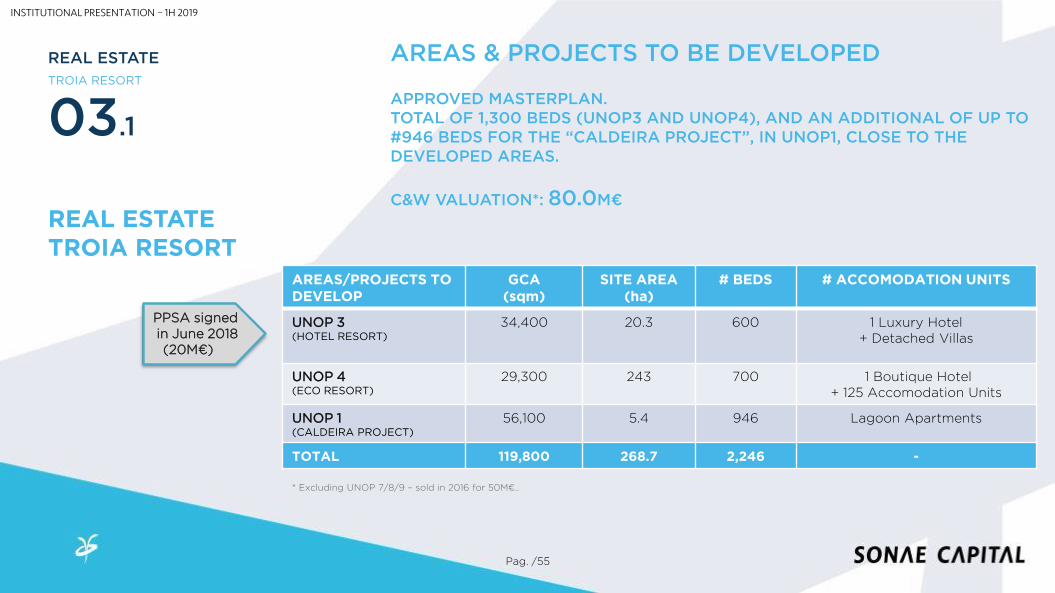
AREAS/PROJECTS TO DEVELOP
GCA(sqm)
SITE AREA(ha)
# BEDS # ACCOMODATION UNITS
UNOP 3 (HOTEL RESORT)
34,400 20.3 600 1 Luxury Hotel+ Detached Villas
UNOP 4 (ECO RESORT)
29,300 243 700 1 Boutique Hotel+ 125 Accomodation Units
UNOP 1 (CALDEIRA PROJECT)
56,100 5.4 946 Lagoon Apartments
TOTAL 119,800 268.7 2,246 -
AREAS & PROJECTS TO BE DEVELOPED
APPROVED MASTERPLAN.TOTAL OF 1,300 BEDS (UNOP3 AND UNOP4), AND AN ADDITIONAL OF UP TO #946 BEDS FOR THE “CALDEIRA PROJECT”, IN UNOP1, CLOSE TO THE DEVELOPED AREAS.
C&W VALUATION*: 80.0M€
* Excluding UNOP 7/8/9 – sold in 2016 for 50M€..
PPSA signed in June 2018(20M€)
INSTITUTIONAL PRESENTATION – 1H 2019
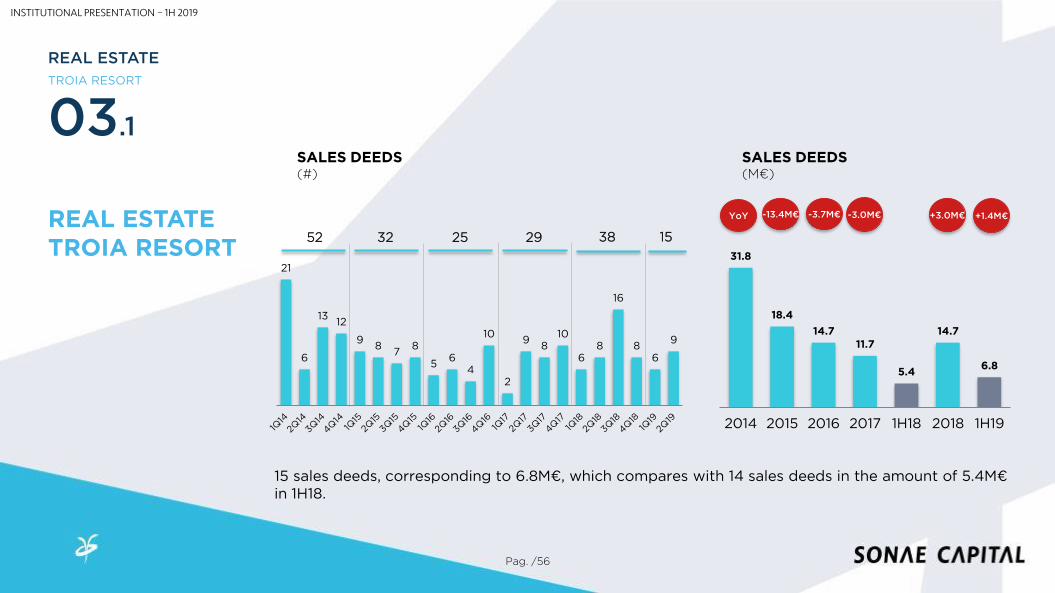
15 sales deeds, corresponding to 6.8M€, which compares with 14 sales deeds in the amount of 5.4M€in 1H18.
SALES DEEDS(#)
Pag. /56
21
6
1312
98
78
56
4
10
2
98
10
68
16
86
9
52 32 25 29
31.8
18.4
14.711.7
5.4
14.7
6.8
2014 2015 2016 2017 1H18 2018 1H19
SALES DEEDS(M€)
-13.4M€ -3.7M€ -3.0M€YoY
03.1
TROIA RESORT
REAL ESTATE
REAL ESTATETROIA RESORT
+3.0M€
38
INSTITUTIONAL PRESENTATION – 1H 2019
15
+1.4M€
Pag. /57
OUTLOOK
SALE CURRENT INVENTORY.
PLACE IN AN ACTIVE WAY THE AREAS NOT YET DEVELOPED,ENSURING THAT REAL ESTATE DEVELOPMENT PROJECTSARE ADEQUATE TO EACH ONE OF THE SPECIFIC MACRO-PLOT.
03.1
TROIA RESORT
REAL ESTATE
REAL ESTATETROIA RESORT
INSTITUTIONAL PRESENTATION – 1H 2019

REAL ESTATE
03.2
OTHER REAL ESTATE ASSETS
Pag. /58
OTHER REALESTATE ASSETS
ASSETS TARGETED TO THE FINANCING OF THE GROUP CORPORATE STRATEGY – CAPITAL
GENERATION
REAL ESTATE ASSETS AVAILABLE FOR SALE
This block considers all the real estate assets of the Sonae Capital Group, except the units already developed and in commercialization in the Troia Resort and the assets held by the WTC Fund.
Capital Employed: 146.0M€C&W* Valuation: 222.4M€
WTC Fund: 71.7M€ Block of assets in Oporto, Av. da Boavista, including the Porto Palacio Hotel:
* Adjusted valuation as at 31 Dec. 2018.
INSTITUTIONAL PRESENTATION – 1H 2019
Pag. /59
OUTLOOK
SALE OF NON CORE REAL ESTATE ASSETS, THROUGH ASPECIFIC BUSINESS UNIT, BENEFITING FROM THEIMPROVED ECONOMIC AND FINANCIAL CONDITIONS ANDTHE PERSPECTIVES FOR THE SECTOR ON THEPORTUGUESE MARKET.
THE DISPOSAL OF THESE REAL ESTATE ASSETS IS ONEOF THE KEY TRIGGERS FOR THE EFFECTIVE CORPORATESTRATEGY IMPLEMENTATION.
03.2
OTHER REALESTATE ASSETS
REAL ESTATE
OTHER REAL ESTATE ASSETS
INSTITUTIONAL PRESENTATION – 1H 2019

AGENDA
04 RECENTPERFORMANCE
INSTITUTIONAL PRESENTATION – 1H 2019

Pag. /61
1H 2019 CONSOLIDATED RESULTS
• Positive trend in Business Units EBITDA with all
segments, in general, contributing positively;
• Operational improvement across the majority of thebusinesses already translated into ContinuedBusinesses Net Profit (+6.8M€) and Net Results(+8.6M€);
• Real estate showing positive results in both segments:Troia Resort and Other assets;
• Adequate and under control Capital structure.
LOAN TO VALUE (RE Assets)
26.1%
NET FINANCIAL DEBT/EBITDA (EBITDA - Businesses)
2.9x
TURNOVER*
84.0M€-0.9% YoY
OPERATIONAL
INCOME
97.3M€+3.1%
EBITDA Rec*
14.5M€+12.8% YoY
* Business Units
0.4M€+6.0%
EBITDA
Margin*
17.3%+2.1pp YoY
NET
RESULTS
-2.9M€+74.9%
NET FINANCIAL DEBT
144.7M€+24.9M€ vs FY18
REAL ESTATE ASSETS
Valuation
342.3M€CUSHMAN & WAKEFIELD
(incl. WTC Fund)
EBIT*
INSTITUTIONAL PRESENTATION – 1H 2019
04. RECENT PERFORMANCE
7.3
11.8
23.5
31.3
20.9
34.7
40.8
11.5
17.4
32.434.1
2013 2014 2015 2016 2017 2018 L12M
134.1
183.7 181.3
226.7
187.4
240.4 243.3
147.0 157.9
183.5 182.8
2013 2014 2015 2016 2017 2018 L12M
246.0234.5
149.2
66.0
109.4119.8
144.7
2013 2014 2015 2016 2017 2018 1H19
NET FINANCIAL DEBT(M€)
TURNOVER(M€)
EBITDA Rec.(M€)
Pag. /62
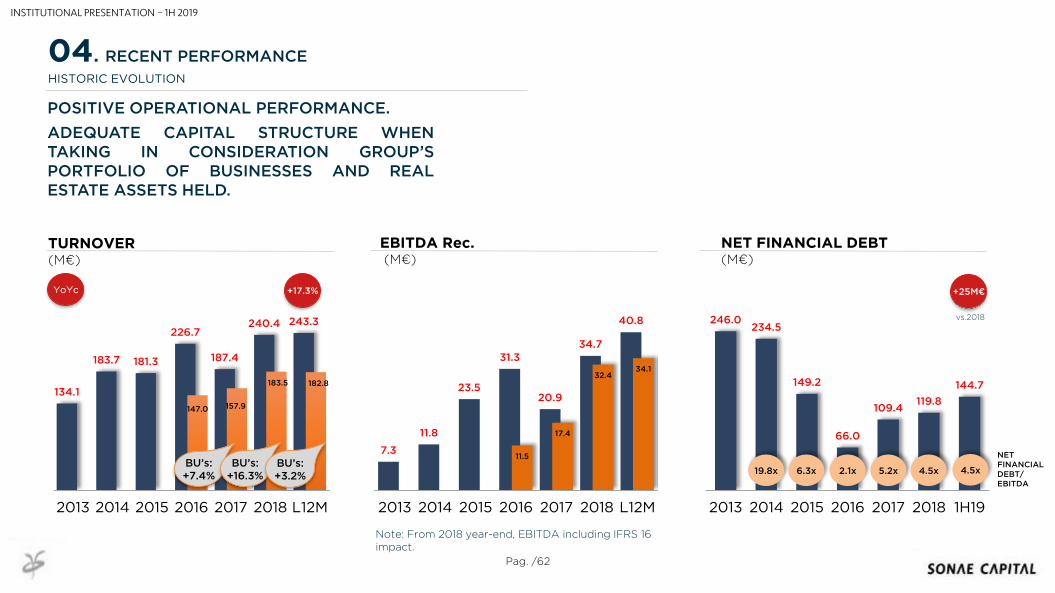
POSITIVE OPERATIONAL PERFORMANCE.
ADEQUATE CAPITAL STRUCTURE WHENTAKING IN CONSIDERATION GROUP’SPORTFOLIO OF BUSINESSES AND REALESTATE ASSETS HELD.
+17.3%YoYc
19.8x 6.3x 2.1x 5.2x
NET FINANCIAL DEBT/EBITDA
HISTORIC EVOLUTION
4.5x
+25M€
BU’s:+7.4%
BU’s:+16.3%
INSTITUTIONAL PRESENTATION – 1H 2019
4.5xBU’s:+3.2%
Note: From 2018 year-end, EBITDA including IFRS 16 impact.
vs.2018
04. RECENT PERFORMANCE
Troia Resort
Op.5.4%
Hospitality12.3%
Fitness24.0%
Energy33.7%
Ref. & HVAC19.8%
Industrial Eng.4.8%
Pag. /63
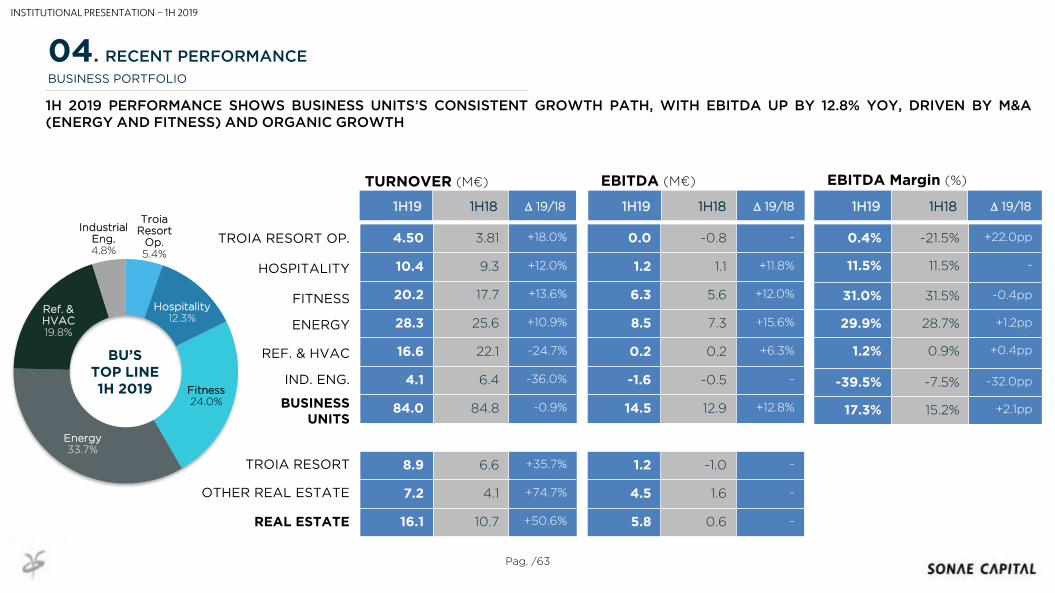
BUSINESS PORTFOLIO
4.50 3.81 +18.0%
10.4 9.3 +12.0%
20.2 17.7 +13.6%
28.3 25.6 +10.9%
16.6 22.1 -24.7%
4.1 6.4 -36.0%
84.0 84.8 -0.9%
8.9 6.6 +35.7%
7.2 4.1 +74.7%
16.1 10.7 +50.6%
TROIA RESORT OP.
HOSPITALITY
FITNESS
ENERGY
REF. & HVAC
IND. ENG.
REAL ESTATE
TURNOVER (M€)
0.0 -0.8 -
1.2 1.1 +11.8%
6.3 5.6 +12.0%
8.5 7.3 +15.6%
0.2 0.2 +6.3%
-1.6 -0.5 -
14.5 12.9 +12.8%
1.2 -1.0 -
4.5 1.6 -
5.8 0.6 -
0.4% -21.5% +22.0pp
11.5% 11.5% -
31.0% 31.5% -0.4pp
29.9% 28.7% +1.2pp
1.2% 0.9% +0.4pp
-39.5% -7.5% -32.0pp
17.3% 15.2% +2.1pp
1H19 1H18 D 19/18 1H19 1H18 D 19/18 1H19 1H18 D 19/18
EBITDA (M€) EBITDA Margin (%)
BU’STOP LINE1H 2019
1H 2019 PERFORMANCE SHOWS BUSINESS UNITS’S CONSISTENT GROWTH PATH, WITH EBITDA UP BY 12.8% YOY, DRIVEN BY M&A(ENERGY AND FITNESS) AND ORGANIC GROWTH
TROIA RESORT
OTHER REAL ESTATE
BUSINESS UNITS
INSTITUTIONAL PRESENTATION – 1H 2019
04. RECENT PERFORMANCE
Pag. /64
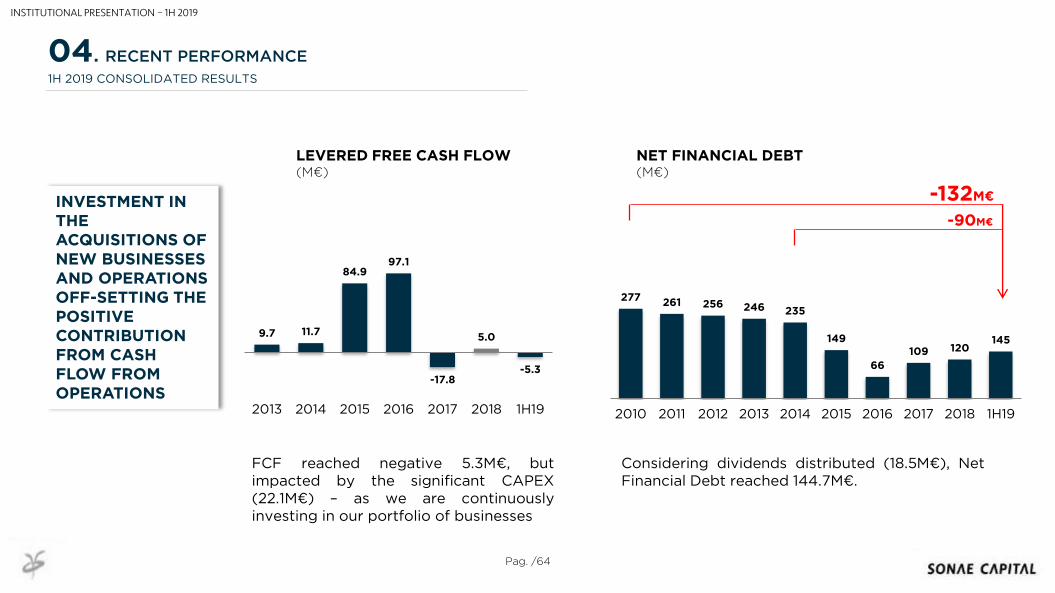
INVESTMENT IN THE ACQUISITIONS OF NEW BUSINESSES AND OPERATIONS OFF-SETTING THE POSITIVE CONTRIBUTION FROM CASH FLOW FROM OPERATIONS
9.7 11.7
84.997.1
-17.8
5.0
-5.3
2013 2014 2015 2016 2017 2018 1H19
277 261 256 246 235
149
66
109 120145
2010 2011 2012 2013 2014 2015 2016 2017 2018 1H19
LEVERED FREE CASH FLOW(M€)
NET FINANCIAL DEBT(M€)
FCF reached negative 5.3M€, butimpacted by the significant CAPEX(22.1M€) – as we are continuouslyinvesting in our portfolio of businesses
Considering dividends distributed (18.5M€), NetFinancial Debt reached 144.7M€.
04. RECENT PERFORMANCE
1H 2019 CONSOLIDATED RESULTS
-132M€
-90M€
INSTITUTIONAL PRESENTATION – 1H 2019
89.9
54.8
1H19*
Page /65
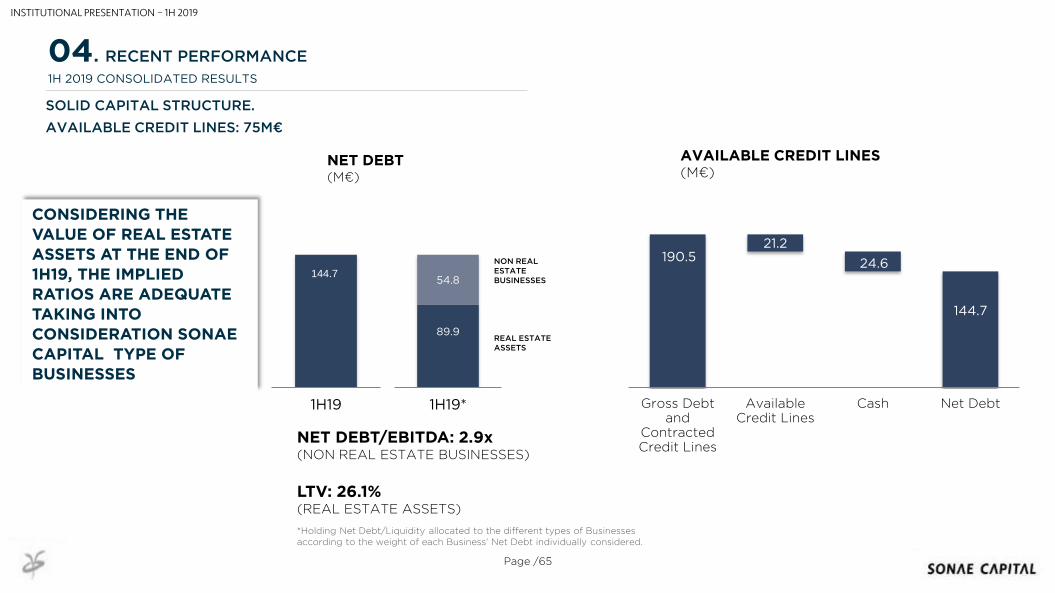
CONSIDERING THE VALUE OF REAL ESTATE ASSETS AT THE END OF 1H19, THE IMPLIED RATIOS ARE ADEQUATE TAKING INTO
CONSIDERATION SONAE CAPITAL TYPE OF BUSINESSES
REAL ESTATE ASSETS
NON REAL ESTATE BUSINESSES
NET DEBT/EBITDA: 2.9x(NON REAL ESTATE BUSINESSES)
LTV: 26.1%(REAL ESTATE ASSETS)
190.521.2
24.6
144.7
Gross Debtand
ContractedCredit Lines
AvailableCredit Lines
Cash Net Debt
144.7
1H19
SOLID CAPITAL STRUCTURE.
AVAILABLE CREDIT LINES: 75M€
04. RECENT PERFORMANCE
1H 2019 CONSOLIDATED RESULTS
NET DEBT(M€)
AVAILABLE CREDIT LINES (M€)
*Holding Net Debt/Liquidity allocated to the different types of Businesses according to the weight of each Business’ Net Debt individually considered.
INSTITUTIONAL PRESENTATION – 1H 2019
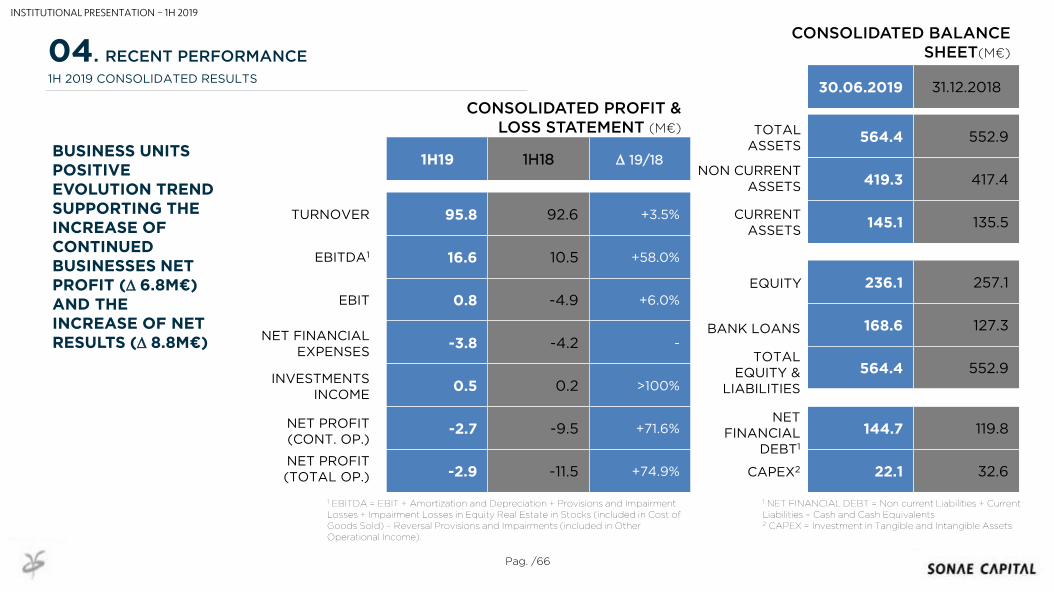
95.8 92.6 +3.5%
16.6 10.5 +58.0%
0.8 -4.9 +6.0%
-3.8 -4.2 -
0.5 0.2 >100%
-2.7 -9.5 +71.6%
-2.9 -11.5 +74.9%
1H19 1H18 D 19/18
30.06.2019 31.12.2018
564.4 552.9
419.3 417.4
145.1 135.5
236.1 257.1
168.6 127.3
564.4 552.9
144.7 119.8
22.1 32.6
Pag. /66
04. RECENT PERFORMANCE
1H 2019 CONSOLIDATED RESULTS
1 EBITDA = EBIT + Amortization and Depreciation + Provisions and ImpairmentLosses + Impairment Losses in Equity Real Estate in Stocks (included in Cost ofGoods Sold) – Reversal Provisions and Impairments (included in OtherOperational Income).
1 NET FINANCIAL DEBT = Non current Liabilities + CurrentLiabilities – Cash and Cash Equivalents2 CAPEX = Investment in Tangible and Intangible Assets
CONSOLIDATED PROFIT & LOSS STATEMENT (M€)
CONSOLIDATED BALANCE SHEET(M€)
TURNOVER
EBITDA1
EBIT
NET FINANCIAL EXPENSES
INVESTMENTS INCOME
NET PROFIT (CONT. OP.)
TOTAL ASSETS
NON CURRENT ASSETS
CURRENT ASSETS
EQUITY
BANK LOANS
TOTAL EQUITY &
LIABILITIES
NET FINANCIAL
DEBT1
CAPEX2NET PROFIT (TOTAL OP.)
BUSINESS UNITS POSITIVE EVOLUTION TREND SUPPORTING THE INCREASE OF CONTINUED BUSINESSES NET PROFIT (D 6.8M€) AND THE INCREASE OF NET RESULTS (D 8.8M€)
INSTITUTIONAL PRESENTATION – 1H 2019
AGENDA
05 KEYMESSAGES
INSTITUTIONAL PRESENTATION – 1H 2019
BUSINESS UNITS
i. Energy: maintaining strong turnover and EBITDA performance (+10.9% and +15.6% respectively).
ii. Industrial Engineering: process of deep transformation, with the required suitability to the Group’s processes and theallocation of adequate resources to a consistent growth path.
iii. Refrigeration & HVAC: focusing on projects of greater value and complexity, where our contribution is better perceived.
iv. Fitness: executing its growth plan, with +5 clubs versus 2018 year-end and raising average number of active members tomore than 104 thousand.
v. Hospitality: increasing turnover and EBITDA by 12% and 11.8% respectively.
vi. Troia Resort - Operations: Working in the repositioning of Tróia, in order to drive up customer experience in Resort tolevels of excellence.
REAL ESTATE ASSETS
i. Real Estate – Troia Resort: PPSA of UNOP 3 in the amount of 20M€; 15 sales deeds, corresponding to 6.8M€. Already in3Q19 (up to the date of 1H 2019 results report), 1 additional sales deed (0.4M€) and 15 PPSAs and reserves in the amount of8.5M€.
ii. Other Real Estate Assets: sales deeds totalling 5.1M€, alongside with PPSAs and Reserves of 15.9M€.
Pag. /68
BUSINESS UNITS & REAL ESTATE ASSETS
POSITIVE TREND IN BUSINESS UNITS EBITDA WITH ALL SEGMENTS IN GENERAL CONTRIBUTING POSITIVELY
05. KEY MESSAGES
INSTITUTIONAL PRESENTATION – 1H 2019
Pag. /69
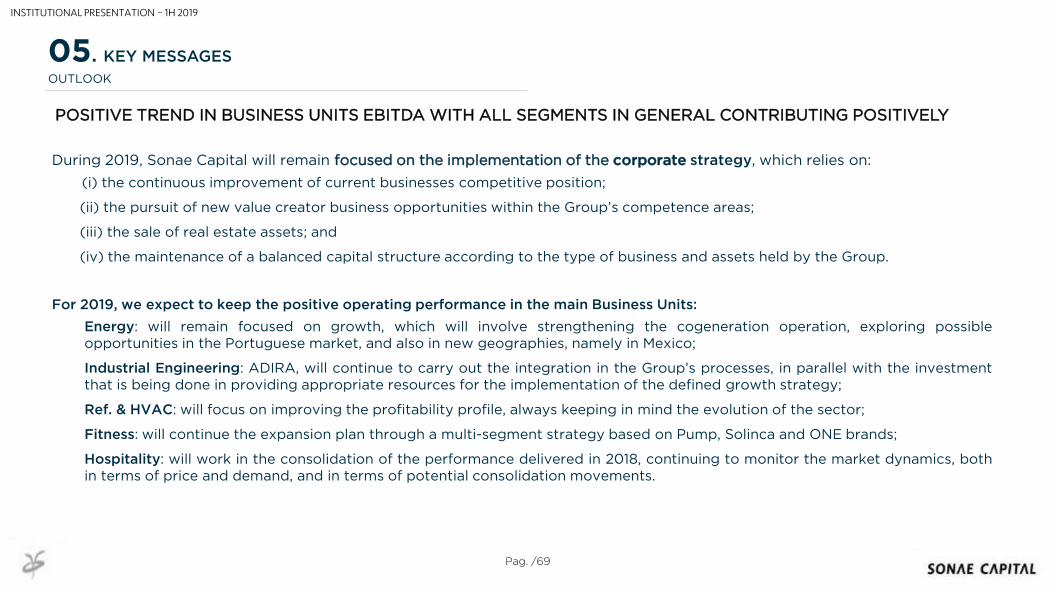
During 2019, Sonae Capital will remain focused on the implementation of the corporate strategy, which relies on:
(i) the continuous improvement of current businesses competitive position;
(ii) the pursuit of new value creator business opportunities within the Group’s competence areas;
(iii) the sale of real estate assets; and
(iv) the maintenance of a balanced capital structure according to the type of business and assets held by the Group.
For 2019, we expect to keep the positive operating performance in the main Business Units:
Energy: will remain focused on growth, which will involve strengthening the cogeneration operation, exploring possibleopportunities in the Portuguese market, and also in new geographies, namely in Mexico;
Industrial Engineering: ADIRA, will continue to carry out the integration in the Group’s processes, in parallel with the investmentthat is being done in providing appropriate resources for the implementation of the defined growth strategy;
Ref. & HVAC: will focus on improving the profitability profile, always keeping in mind the evolution of the sector;
Fitness: will continue the expansion plan through a multi-segment strategy based on Pump, Solinca and ONE brands;
Hospitality: will work in the consolidation of the performance delivered in 2018, continuing to monitor the market dynamics, bothin terms of price and demand, and in terms of potential consolidation movements.
OUTLOOK
05. KEY MESSAGES
INSTITUTIONAL PRESENTATION – 1H 2019
POSITIVE TREND IN BUSINESS UNITS EBITDA WITH ALL SEGMENTS IN GENERAL CONTRIBUTING POSITIVELY
AGENDA
APPENDIX
INSTITUTIONAL PRESENTATION – 1H 2019
Pag. /71
COMPETITIVE POSITION
IMPROVEMENT
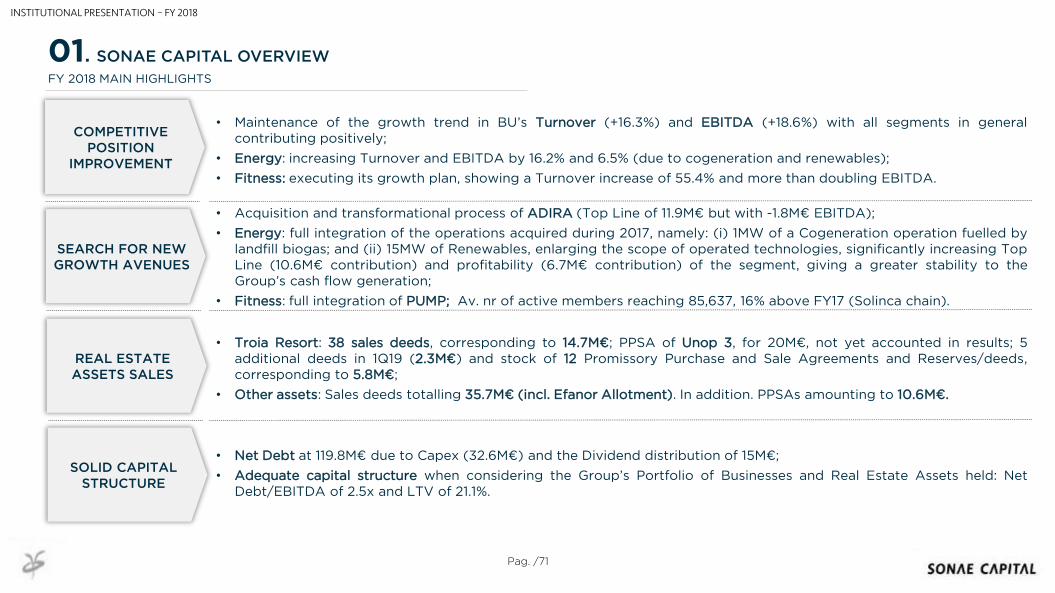
• Maintenance of the growth trend in BU’s Turnover (+16.3%) and EBITDA (+18.6%) with all segments in generalcontributing positively;
• Energy: increasing Turnover and EBITDA by 16.2% and 6.5% (due to cogeneration and renewables);
• Fitness: executing its growth plan, showing a Turnover increase of 55.4% and more than doubling EBITDA.
FY 2018 MAIN HIGHLIGHTS
SEARCH FOR NEW GROWTH AVENUES
REAL ESTATE ASSETS SALES
SOLID CAPITAL STRUCTURE
• Acquisition and transformational process of ADIRA (Top Line of 11.9M€ but with -1.8M€ EBITDA);
• Energy: full integration of the operations acquired during 2017, namely: (i) 1MW of a Cogeneration operation fuelled bylandfill biogas; and (ii) 15MW of Renewables, enlarging the scope of operated technologies, significantly increasing TopLine (10.6M€ contribution) and profitability (6.7M€ contribution) of the segment, giving a greater stability to theGroup’s cash flow generation;
• Fitness: full integration of PUMP; Av. nr of active members reaching 85,637, 16% above FY17 (Solinca chain).
• Troia Resort: 38 sales deeds, corresponding to 14.7M€; PPSA of Unop 3, for 20M€, not yet accounted in results; 5additional deeds in 1Q19 (2.3M€) and stock of 12 Promissory Purchase and Sale Agreements and Reserves/deeds,corresponding to 5.8M€;
• Other assets: Sales deeds totalling 35.7M€ (incl. Efanor Allotment). In addition. PPSAs amounting to 10.6M€.
• Net Debt at 119.8M€ due to Capex (32.6M€) and the Dividend distribution of 15M€;
• Adequate capital structure when considering the Group’s Portfolio of Businesses and Real Estate Assets held: NetDebt/EBITDA of 2.5x and LTV of 21.1%.
01. SONAE CAPITAL OVERVIEW
INSTITUTIONAL PRESENTATION – FY 2018
Pag. /72
FY 2018 CONSOLIDATED RESULTS
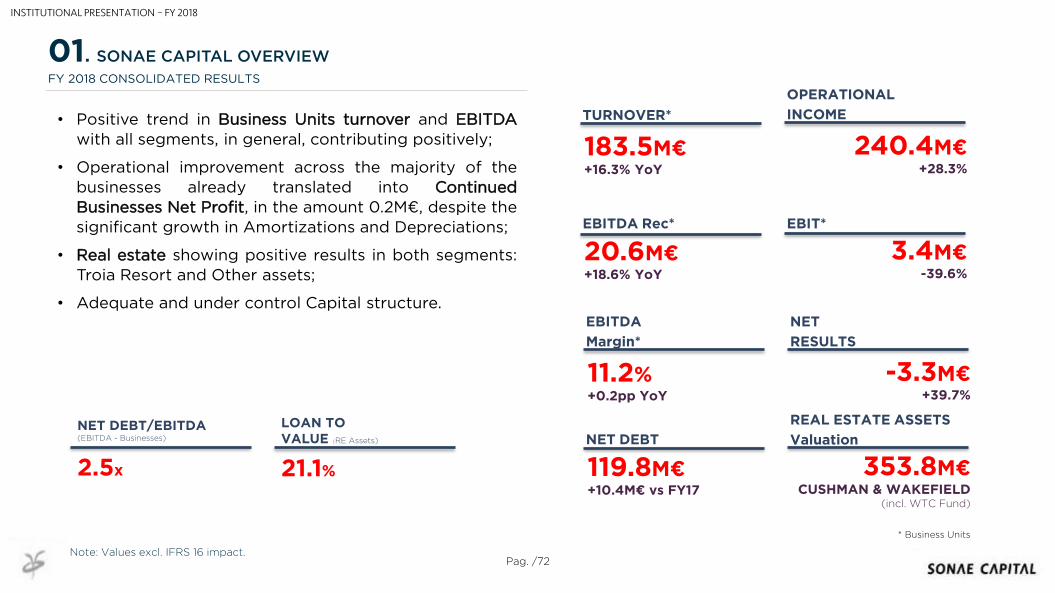
• Positive trend in Business Units turnover and EBITDA
with all segments, in general, contributing positively;
• Operational improvement across the majority of thebusinesses already translated into ContinuedBusinesses Net Profit, in the amount 0.2M€, despite thesignificant growth in Amortizations and Depreciations;
• Real estate showing positive results in both segments:Troia Resort and Other assets;
• Adequate and under control Capital structure.
LOAN TO VALUE (RE Assets)
21.1%
NET DEBT/EBITDA (EBITDA - Businesses)
2.5x
TURNOVER*
183.5M€+16.3% YoY
OPERATIONAL
INCOME
240.4M€+28.3%
EBITDA Rec*
20.6M€+18.6% YoY
* Business Units
3.4M€-39.6%
EBITDA
Margin*
11.2%+0.2pp YoY
NET
RESULTS
-3.3M€+39.7%
NET DEBT
119.8M€+10.4M€ vs FY17
REAL ESTATE ASSETS
Valuation
353.8M€CUSHMAN & WAKEFIELD
(incl. WTC Fund)
01. SONAE CAPITAL OVERVIEW
EBIT*
INSTITUTIONAL PRESENTATION – FY 2018
Note: Values excl. IFRS 16 impact.
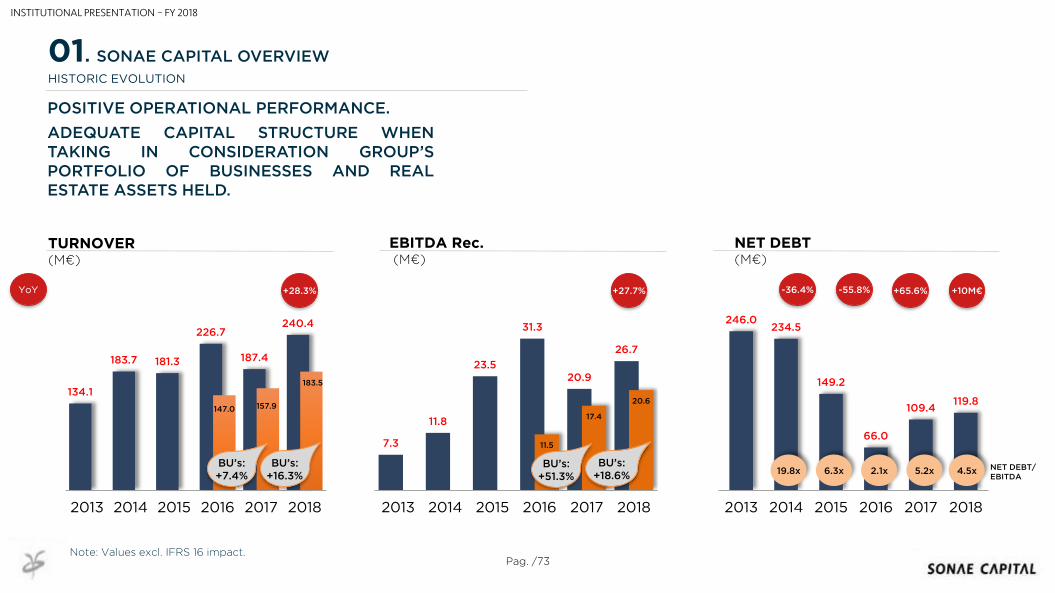
7.3
11.8
23.5
31.3
20.9
26.7
11.5
17.4
20.6
2013 2014 2015 2016 2017 2018
134.1
183.7 181.3
226.7
187.4
240.4
147.0 157.9
183.5
2013 2014 2015 2016 2017 2018
246.0234.5
149.2
66.0
109.4119.8
2013 2014 2015 2016 2017 2018
NET DEBT(M€)
TURNOVER(M€)
EBITDA Rec.(M€)
Pag. /73
POSITIVE OPERATIONAL PERFORMANCE.
ADEQUATE CAPITAL STRUCTURE WHENTAKING IN CONSIDERATION GROUP’SPORTFOLIO OF BUSINESSES AND REALESTATE ASSETS HELD.
-36.4% -55.8% +65.6%+28.3% +27.7%YoY
19.8x 6.3x 2.1x 5.2x NET DEBT/EBITDA
HISTORIC EVOLUTION
01. SONAE CAPITAL OVERVIEW
4.5x
+10M€
BU’s:+7.4%
BU’s:+18.6%
BU’s:+16.3%
INSTITUTIONAL PRESENTATION – FY 2018
BU’s:+51.3%
Note: Values excl. IFRS 16 impact.

Pag. /74
FY 2018 TURNOVER FY 2018 EBITDA
52.6M€
+16.2% YoY
15.1M€
+6.5% YoY
11.9M€
-1.8M€
(1) Fully consolidated since August 2017
47.7M€
-6.9% YoY
2.2M€
+45.1%
36.1M€
+55.4% YoY
4.5M€
>100% YoY
23.8M€
+3.8% YoY
0.05M€
-
11.4M€
+4.6% YoY
0.6M€
-19.7% YoY
01. SONAE CAPITAL OVERVIEW
BUSINESS PORTFOLIO – BUSINESS UNITS
ENERGY
TROIA RESORTOPERATIONS
REFRIGERATION & HVAC
HOSPITALITYFITNESS
INDUSTRIAL ENGINEERING (1)
INSTITUTIONAL PRESENTATION – FY 2018
Note: Values excl. IFRS 16 impact.
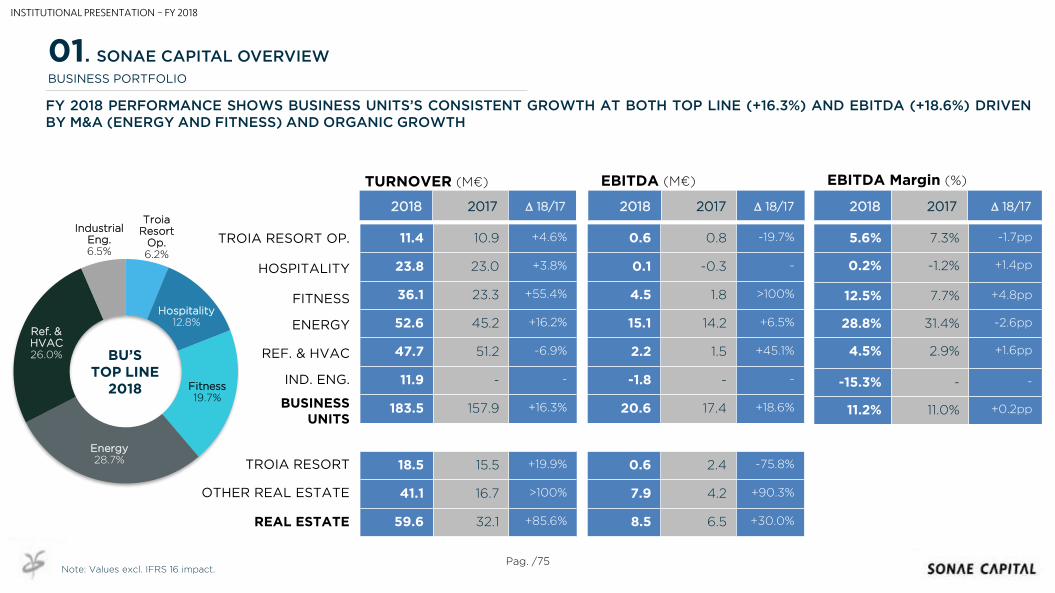
Troia Resort
Op.6.2%
Hospitality12.8%
Fitness19.7%
Energy28.7%
Ref. & HVAC26.0%
Industrial Eng.6.5%
Pag. /75
BUSINESS PORTFOLIO
11.4 10.9 +4.6%
23.8 23.0 +3.8%
36.1 23.3 +55.4%
52.6 45.2 +16.2%
47.7 51.2 -6.9%
11.9 - -
183.5 157.9 +16.3%
18.5 15.5 +19.9%
41.1 16.7 >100%
59.6 32.1 +85.6%
TROIA RESORT OP.
HOSPITALITY
FITNESS
ENERGY
REF. & HVAC
IND. ENG.
REAL ESTATE
TURNOVER (M€)
0.6 0.8 -19.7%
0.1 -0.3 -
4.5 1.8 >100%
15.1 14.2 +6.5%
2.2 1.5 +45.1%
-1.8 - -
20.6 17.4 +18.6%
0.6 2.4 -75.8%
7.9 4.2 +90.3%
8.5 6.5 +30.0%
5.6% 7.3% -1.7pp
0.2% -1.2% +1.4pp
12.5% 7.7% +4.8pp
28.8% 31.4% -2.6pp
4.5% 2.9% +1.6pp
-15.3% - -
11.2% 11.0% +0.2pp
2018 2017 D 18/17 2018 2017 D 18/17 2018 2017 D 18/17
EBITDA (M€) EBITDA Margin (%)
BU’STOP LINE
2018
FY 2018 PERFORMANCE SHOWS BUSINESS UNITS’S CONSISTENT GROWTH AT BOTH TOP LINE (+16.3%) AND EBITDA (+18.6%) DRIVENBY M&A (ENERGY AND FITNESS) AND ORGANIC GROWTH
TROIA RESORT
OTHER REAL ESTATE
BUSINESS UNITS
01. SONAE CAPITAL OVERVIEW
INSTITUTIONAL PRESENTATION – FY 2018
Note: Values excl. IFRS 16 impact.
Maia | July 2019
INSTITUTIONAL PRESENTATION
SONAE CAPITAL1H 2019 RESULTS