Institutional Presentation - 2019 · 2019-11-18 · Institutional Presentation - 2019. ... STS MHC...
38
Institutional Presentation - 2019
Transcript of Institutional Presentation - 2019 · 2019-11-18 · Institutional Presentation - 2019. ... STS MHC...

Institutional Presentation - 2019

Content
World Port Container Throughput
Macroeconomic Context
Container Ports in Brazil
Port of Santos
About Santos Brasil
Tecon Santos
Tecon Imbituba
Tecon Vila do Conde
TEV – Vehicle Terminal
Logistics
Investments & Financial Highlights
Corporate Governance
ESG 2
03
04
06
07
09
12
18
23
28
29
31
36
37

9,365
10,530
10,698
10,732
11,857
12,284
13,259
13,860
13,951
14,965
17,065
19,448
20,770
21,281
21,904
24,719
27,427
33,600
51,425
213,720
Largest countries in container handling World port container throughput in 2017 -> 752 million TEU
Source: ANTAQ, CEPAL and United Nations Conference about Trading and Development - UNCTAD 3
China
USA
Singapore
South Korea
Malaysia
Japan
United Arab
Emirates
Hong Kong
Germany
Spain
Taiwan
Netherlands
Indonesia
India
Vietnam
Belgium
Thailand
Italy
United Kingdom
Brazil
Brazil: world’s 20th largest container throughput in 2017 (‘000 TEU)
Rank Port Country Volume (TEU) 1 Colón Panama 4,324,478
2 Santos Brazil 4,122,243
3 Manzanillo Mexico 3,078,505
4 Cartagena Colombia 2,862,787
5 Panamá Pacífico Panama 2,520,587
6 El Calao Peru 2,340,657
7 Guayaquil Equador 2,064,281
8 Kingston Jamaica 1,833,053
9 Buenos Aires Argentina 1,797,955
10 San Antonio Chile 1,660,832
11 San Juan Puerto Rico 1,405,348
12 Buenaventura Colombia 1,369,139
13 Caucedo Dominican Republic 1,331,907
14 Lázaro Cardenas Mexico 1,314,798
15 Limón-Monin Costa Rica 1,187,140
16 Veracruz Mexico 1,176,253
17 Freeport Bahamas 1,050,140
18 Itajaí Brazil 1,045,813
19 Valparaíso Chile 903,296
20 Altamira Mexico 820,092
Port of Santos: Latin America’s 2nd largest container throughput in 2018

3,5
4,0 4,2
4,6 4,6 4,54,3 4,6
5,0
3,33,9
4,1
4,44,7 4,7 4,5 4,7
5,0
1,761,67
1,962,17
2,36
3,39 3,453,20
3,68
2010 2011 2012 2013 2014 2015 2016 2017 2018
Imported Containers (MM TEU) Exported Containers (MM TEU) Exchange Rate
6,8
7,9 8,49,2
10,0 9,9 9,610,2
10,97.5%
4.0%
1.9% 3.0%
0.5%
-3.5% -3.5%
1.0% 1.1%
2010 2011 2012 2013 2014 2015 2016 2017 2018
Brazil (MM TEU) GDP
GDP X Brazil Container Throughput Exchange Rate X Long Haul Cntrs
4
Macroeconomic indicators
Source: IBGE, ANTAQ and IPEADATA
Containers volume: resiliency amidst economy slowdown
0%
2%
4%
6%
8%
10%
12%
14%
16%
IPCA (12 months) Selic (12 months)
*** 0,2%
0,4%
0,6%
0,8%
1,0%
1,2%
1,4%
-30%
-20%
-10%
0%
10%
20%
jan-10 nov-10 set-11 jul-12 mai-13 mar-14 jan-15 nov-15 set-16 jul-17 mai-18
Industrial Activity - %YoY (L) Monthly Selic (R)
Inflation x Interest Rate Industrial Activity x Interest Rate

2,73,0
3,23,4
3,7 3,83,6
3,9
4,17.5%
4.0%
1.9%
3.0%
0.5%
-3.5% -3.5%
1.0% 1.1%
2010 2011 2012 2013 2014 2015 2016 2017 2018
Port of Santos (MM TEU) GDP
63 71 71 78 80 79 77 82 8429 29 27 26 28 31 31 34 3468 70 71 66 72 67 66 75 74
462487 501 515 534 577 570
613 631
2010 2011 2012 2013 2014 2015 2016 2017 2018
Containerized Cargo General Cargo Liquid and Gaseous Bulk Solid Bulk
622 657 671 684 714 754 743 805 823
5 6 7 9 10 10 11 12 134 5 5 5 5 5 6 5 7
100 105 110 111 116 118 117 118 122
1821 17 17
17 16 17 2119
2010 2011 2012 2013 2014 2015 2016 2017 2018
Containerized Cargo General Cargo Liquid and Gaseous Bulk Solid Bulk
127 136 139 142 148 149 150 157 161
Brazil Cabotage Cargo Breakdown (MM Ton) Brazil Long-Haul Cargo Breakdown (MM Ton)
1,1 1,31,8
2,1 2,3 2,3 2,32,5
2,8
5,6
6,5 6,46,9 7,0 6,8
6,56,8
7,2
2010 2011 2012 2013 2014 2015 2016 2017 2018
Cabotage Long Haul
Brazil GDP X Port of Santos Container Throughput (MM TEU)
5
Port sector in Brazil Resiliency amidst economy slowdown
Source: ANTAQ
Brazil Container Throughput (MM TEU)

Port sector in Brazil South and Southeast ports are the largest in volume
Source: ANTAQ and IBGE 6
4.122
327
366
210
1.112
766
737
634
85
455
310
360
154
3.854
281
283
195
1.108
725
744
592
50
461
301
284
117
Santos
Rio de Janeiro
Itaguai / Sepetiba
Vitoria
Itajaí / Navegantes
Paranaguá
Rio Grande
Itapoá / S. F. do Sul
Imbituba
Suape
Salvador
Pecém / Fortaleza
Vila do Conde
2018 2017
Container throughput - main Brazilian ports (‘000TEU) North Northeast Southeast South
% Population 9% 28% 42% 14%
% GDP 6% 15% 53% 17%
% Volume (TEU) 7% 12% 46% 35%

12
Port of Santos ‘Must-call port’ in South America
7
Largest Port in South America
> 25% of Brazilian Trade Balance
Hinterland covers 55% of Brazil’s GDP
Connected to Brazil’s main roads and railways
~90% of São Paulo’s industrial base is located
less than 200 kilometers from the Port of Santos
Libra
Rodrimar
Ecoporto
BTP
DPW Santos

799 775 801 1,048
1,224 1,560
1,883
2,268 2,446 2,533
2,685
2,252
2,722 2,984 3,104
3,448 3,656 3,780
3,565 3,854
4,122
9M19
248
302
346 350 436 612
746
1,008 1,159 1,253 1,270
1,044
1,355 1,487
1,733 1,811
1,380 1,314 1,426
1,316 1,446
1998 1999 2000 2001 2002 2003 2004 2005 2006 2007 2008 2009 2010 2011 2012 2013 2014 2015 2016 2017 2018 2019
Port of Santos Tecon Santos
3,061
BTP 39,2%
Santos Brasil40,3%
DP World Santos 16,0%
Libra 3,9%
Others 0,6%
8 Source: CODESP and Santos Brasil
Port of Santos Tecon Santos’ market-share recovery: 40.3% in 9M19 vs. 35.4% in FY18
2018 x 2017
- Port of Santos: +4.0% (+7.0% in TEU)
- Tecon Santos: +7.8% (+9.5% in TEU)
Market share – 9M19 Container throughput (TEU x 1,000)
CAGR 1998 – 2018
- Port of Santos: 8.5%
- Tecon Santos: 9.2%
Container throughput (TEU x 1,000)

About Santos Brasil History
1997
Santos Brasil is
founded, and Tecon
Santos is acquired in
an auction under a
25-year leasing period
Initial Public
Offering
2006
2007
Mesquita, now
Santos Brasil
Logística,
is acquired
2008
Tecon
Imbituba
and Tecon
Vila do Conde
are acquired
2009
The Santos Vehicle
Terminal - TEV is
acquired under a lease 2013
Tecon Santos
operates the vessel
with the highest cargo
capacity ever to call
at the Port of Santos
Tecon Santos
renews its lease
for additional
25 years
2015
2016
Migration to the
B3 Novo Mercado
2017
Tecon Vila do
Conde renews its
lease for additional
15 years
2018
Tecon Santos reaches a
new productivity record
of 243.58 MPH
(Moves per Hour)
9

About Santos Brasil
Publicly-traded company, listed in B3’s Novo Mercado segment
Five terminals on the Brazilian coast
- Three container terminals
- One vehicle terminal
- One general cargo terminal
Container throughput: 1.68 million TEU (twenty-foot equivalent
unit) in 2018
Port-to-Door full logistics solution (Santos Brasil Logística)
17% of the Brazilian container throughput in 2018*
* Source : ANTAQ
TECON
IMBITUBA
DISTRIBUTION
CENTER (SÃO BERNARDO
DO CAMPO)
TECON
SANTOS
TECON VILA
DO CONDE
TEV
BONDED LOGISTICS
CENTERS (SANTOS AND GUARUJÁ)
TCG IMBITUBA (GENERAL CARGO TERMINAL)
Highlights
10

Container terminal operation The container cycle in a import operation (reverse for exports)
11
1 Ship arrives at the
Port 2 Ship-to-Shore (STS) or
Mobile Harbor Cranes
(MHC)
3 Trucks 4 Reach Stackers 6 Port Warehouse/ De-
Consolidation
5b Reefer Containers
5a Regular Containers
7 Customs 8 Road 9 Logistics Unit 10 Importer
Containers are transported by
ships, which dock at the
terminal’s quayline
Cranes unload the containers
from the ships, positioning
them in trucks and/or terminal
tractors
After the container is placed
on the truck's bed, it is taken
to the (reefer or dry) backyard
RTGs are used to lift the
containers from flat-bed trucks
and to position them in the
stockpiles at the yard.
Containers are stored before
collected by the client
Reefer containers are
positioned in a reefer yard.
Connections and
functionalities are regularly
monitored (i.e. temperature)
Regular containers are taken to the
common yard, where they are positioned
according to the order
in which they will most likely be moved into
trucks to leave the terminal
Cargo of dry
containers is partially
unstuffed (fee is
charged over the
importer)
After the container is placed in
the yard or warehouse,
customs have the green light
to make any required
inspection or to clear the
cargo
The containers transportation
is made by truck, train (Tecon
Santos) or barge (Tecon Vila
do Conde)
Containers can be transported
by road to freight processing
units in the region

TECON
SANTOS

7
Tecon Santos Best solution for containers in South America
13
Geographic Footprint
Market Share 2018
RS
SC
PR
SP
MG
GO
MT
AC
AM
RR
RO BA
PI
MA PA
AP
TO
CE RN
PE AL
SE
MS
RJ
ES
DF
PB
SC
Rio +
Itaguaí
Southeastern
Ports
Tecon
Santos
SP
SP
MG
RJ
ES
Vitória
Growth capacity: CAPEX plan of c.R$1.5 billion, already started
Lease contract renewed until 2047
Equipment 100% GPS-controlled
Connected to Brazil’s main roads and railways
4 internal railway tracks
35.4% 35.6%
15.6%12.6%
0.8%
Tecon Santos BTP DP World Santos Libra Others

7
Tecon Santos Infrastructure and other information
14
Security
Scanner (non-invasive
inspection)
Surveillance cameras
Restricted access
General data
Depth: 13.5m
Quayline extension: 980m +
310m (TEV)
Area: 596,000 m2
Annual capacity: 2,000,000
TEU
Allows
Post-
Panamax
vessels
to dock
at the
Port
Equipment #
Ship-to-Shore
MHC
Reach Stackers
RTG
13¹
1
18
46
STS MHC Reach Stacker RTG
(1) There are currently 11 STS cranes in operation. In 2018, 2 cranes were acquired, expected to be delivered in 2020.
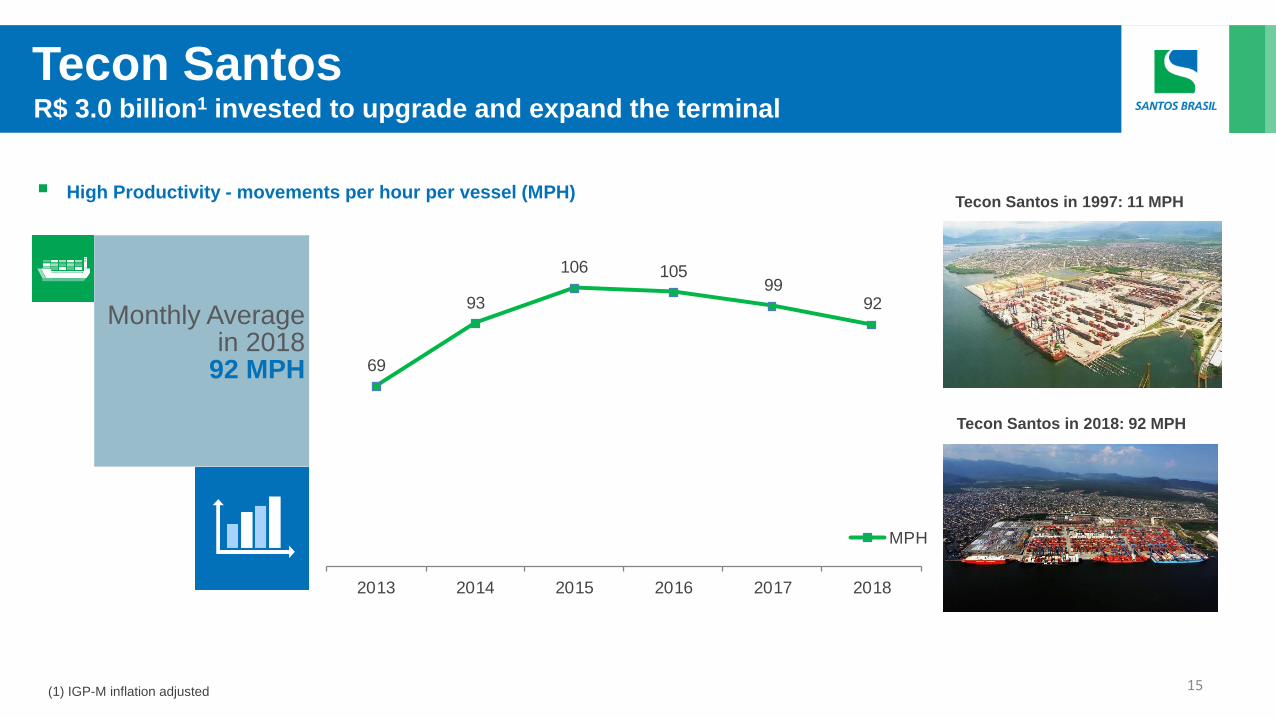
R$ 3.0 billion1 invested to upgrade and expand the terminal
High Productivity - movements per hour per vessel (MPH)
Tecon Santos
15 (1) IGP-M inflation adjusted
Tecon Santos in 1997: 11 MPH
Tecon Santos in 2018: 92 MPH
69
93
106 10599
92
2013 2014 2015 2016 2017 2018
MPH
Monthly Average in 2018
92 MPH

Automation
Focus on efficiency
New Capacity
2,400,000 TEU
Estimated CapEx
R$ 1.5 billion
Investments contracted (FY18)
c.R$ 100M
NEW LAYOUT
Investment cycle in progress: cutting-edge technology, modern layout
Tecon Santos
Quay extension
16

Tecon Santos Phases of the project
Phase 1
Berths extension
and modernization
to attend ships with
366 meters length
Phase 2
Backyard capacity
expansion
Improvement of the
road-rail access
Phase 3
Automation:
increasing capacity
and cost reduction
17

Inserir imagem aqui,
preenchendo o espaço por
completo.
Tecon Imbituba
TECON
IMBITUBA
18

14.5m draft: port terminal ready to receive Super-Post-Panamax
vessels of 366 meters length
Close to Santa Catarina and Rio Grande do Sul industrial zones
25-year lease contract (starting in 2008), with a renewal option
for additional 25 years
Beneficiary of adjacent infrastructure projects: widening of BR-
101 federal highway and the construction of Coastal Railway
(“Ferrovia Translitorânea”)
Favorable meteorological conditions and 24-hour access
Tecon Imbituba hosts 2 terminal types: Container and General
Cargo
One-stop shop: ship, DEPOT and container freight station (CFS)
operations
7
Tecon Imbituba Strategic Location at Southern Region, with developed logistical access
19
Geographic Footprint
Market Share 2018
RS
SC
PR
SP
MG
GO
MT
AC
AM
RR
RO BA
PI
MA PA
AP
TO
CE RN
PE AL
SE
MS
RJ
ES
DF
PB
RS
SC
PR
Tecon Rio Grande
Itapoá
TCP
Southern
Ports
APM & Portonave
Imbituba
Hinterland
3.3%
28.7% 28.7%
24.7%
14.6%
Tecon Imbituba Tecon Rio Grande Portonave
Porto Itapoá Porto Itajaí

7
Tecon Imbituba Infrastructure and other information
20
Security
Scanner (non-invasive
inspection)
Surveillance cameras
Restricted access
General data
Depth: 15.0m
Quayline extension: 660m
Area: 207,000m2
Annual Capacity: 450,000 TEU
Equipment #
Ship-to-Shore
MHC
Reach Stackers
2
2
8
STS MHC Reach Stacker
Allows
Super-
Post-
Panamax
vessels
to dock
at the
Port

TECON VILA DO CONDE
PARANAGUÁ
765,785 TEU*
Tecon Imbituba Potential for volume increase
21
ITAPOÁ / SÃO FRANCISCO DO SUL
634,197 TEU*
ITAJAÍ / NAVEGANTES
1,111,938 TEU*
RIO GRANDE
736,967 TEU*
Container Terminal
Imbituba Hinterland
Pork And Poultry Production
Rio Grande do Sul Industrial Zone
IMBITUBA
84,885 TEU*
* Source: Volume in 2018 (ANTAQ)
(1) Brazilian Association of Animal Protein 2018 Annual Report; (2) InvestRS – Rio Grande do Sul State
Nearby Agricultural
Area
The states of Rio Grande do Sul and Santa
Catarina together accounted for 40.5% of
Brazilian chicken and 69.7% of pork exports
in 2017(1)
With Premium
Logistics Premium transportation logistics with 2 main
roads and railways under construction
Nearby Industrial
Cluster
Rio Grande do Sul holds the largest
concentration of biodiesel, tobacco,
automation, agricultural & road machinery,
wine, trailers & car bodies, and leather &
footwear producers / manufacturers in
Brazil(2)
Tecon Imbituba and its peer terminals (Itajaí/Navegantes and Rio
Grande) are equidistant from the industrial zones and the
consumption centers in the Southern region

R$ 965 million(1) invested since 2008
Improving Productivity - movements per hour per vessel (MPH)
Tecon Imbituba
22 (1) IGP-M inflation adjusted. Includes investments in Imbituba General Cargo terminal
Montlhy Average in 2018
60 MPH

TECON
VILA DO
CONDE
23

Located in the North region of Brazil, with no physical constraints
to receive long haul vessels
Dominant container terminal in Pará state, well connected to other
Brazilian ports via cabotage
Connected to all continents, directly, through Caribbean hub ports
and Panama Canal
Offers container stuffing and unstuffing services, as well as
refrigerated warehousing
Capacity expanded in 2018: investments in new equipment and
infrastructure modernization
Lease contract recently renewed for an additional 15-year period
(by 2033)
Important commodities export hub in the region (e.g. timber, frozen
meat, pepper, agricultural products, metals, minerals and fruits)
7
Tecon Vila do Conde Located in the delta of Amazon River
24
Market Share 2018
Geographic Footprint
RS
SC
PR
SP
MG
GO
MT
AC
AM
RR
RO BA
PI
MA PA
AP
TO
CE RN
PE AL
SE
MS
RJ
ES
DF
PB
Northern
Ports
PA
PI
MA
AP
CE
Vila do Conde
Belém Itaqui
Fortaleza
(Pecém)
2539 45
6578
103
1614
15
2013 2014 2015 2016 2017 2018
Vila do Conde¹ Belém²
# ‘000 containers
(1) Santos Brasil; (2) ANTAQ;

7
Tecon Vila do Conde Infrastructure and other information
25
Security
Scanner (non-invasive
inspection)
Surveillance cameras
Restricted access
General data
Depth: 13.5m
Quayline extension: 254m
Area: 86,615 m2
Annual Capacity: 217,000 TEU
Allows
Post-
Panamax
vessels
to dock
at the
Port
Equipment #
MHC
Reach Stackers
3
11
MHC Reach Stacker

TECON VILA DO CONDE
Vila do Conde x BELÉM
Main Cargo: Wood
Vila do Conde x MACAPÁ - AP
Main Cargos: Chemical Products
Vila do Conde x SANTARÉM X ITAITUBA
Main Cargo: Wood
Vila do Conde x MUNGUBA
Main Cargoes: Kaolin and Cellulose
Vila do Conde x CAMETÁ
Main Cargo: Palm Oil
Vila do Conde x TUCURUÍ
Main Cargo: Silicon
Vila do Conde x MANAUS - AM
Main Cargos: Spare Parts and
Chemical Products
Vila do Conde x ALTAMIRA
Main Cargo: Machinery
Tecon Vila do Conde North Region: inland waterway cargo transportation
26
VILA DO
CONDE

7 27
Tecon Vila do Conde Recent upgrade and capacity expansion to 217,000 TEU annual capacity

Neighbor to Tecon Santos
Handling of different types of cargo: trains, dismantled industrial
plants, power transformers, dismantled machinery, large sculptures
etc
Annual capacity: 300,000 vehicles
- Static capacity: 10,000 vehicles
- FY18 throughput: 241,291 vehicles
- Total area: 164,000 m²
- Quayline extension: 310 meters
TEV - Vehicle Terminal Largest vehicle terminal in Brazil
28

29
Taylor-made logistics services, integrating maritime transportation to exporters’ and importers’ supply chain
Potential to increase customers’ competitiveness: eg. “K10” logistics operation for BASF
Synergies between integrated logistics and port operations
Infrastructure:
- Distribution Center in São Bernardo do Campo (105,000m²)
- CLIA Guarujá (bonded warehouse - 52,900m²)
- CLIA Santos (bonded warehouse - 64,755m²)
- Truck fleet (130 vehicles)
Logistics Vertical integration

Port terminals and Logistics
Main clients
30

31
Investments R$ 5 billion(1) in 22 years
M&A
1997 – Tecon Santos bidding
2006 – Santos Brasil IPO
2007 – Santos Brasil Logística acquisition
2008 – Tecon Imbituba bidding & Tecon Vila do Conde acquisition
2009 – Vehicles terminal bidding
CAPEX
2004/2006 – Tecon Santos first expansion
2008/2010 – Tecon Santos second expansion
2008/2011 – Tecon Imbituba expansion
274
95
190 220
86 5 12 10 48 28
61 91
112 97
127
297 197
124
184
98 85
28 27 15 7
72
1997 1998 1999 2000 2001 2002 2003 2004 2005 2006 2007 2008 2009 2010 2011 2012 2013 2014 2015 2016 2017 2018
M&A CAPEX
(1) IGP-M inflation adjusted

147
87 84 107
78 80
15.2%
10.5% 10.2% 11.6% 11.2% 10.8%
2015 2016 2017 2018 9M18 9M19
(23) (28)
(5)
3
(1)
5
-2.4% -3.4%
-0.6%
0.3%
-0.1% -0.7%
2015 2016 2017 2018 9M18 9M19
965 829 824
922 700 742
2015 2016 2017 2018 9M18 9M19
Port Terminals (quay)
39%
Port Terminals (warehousing)
30%
Logistics26%
Vehicle terminal5%
36
EBITDA and EBITDA Mg. Financial Highlights
32 (1) Does not consider intracompany eliminations;
(2) Pro-forma EBITDA adds leasing and rent expenses;
Net Revenue (R$M)
Pro Forma EBITDA² (R$M) and EBITDA margin (%)
Net Revenue Breakdown (3Q19)
Net Income (R$M) and Net margin (%)

82% 88% 97%
78% 90% 89%
18% 12% 3% 22%
10% 11%
2015 2016 2017 2018 3Q18 3Q19
Local Currency Foreign currency
168
122 108
75 55
74
2015 2016 2017 2018 9M18 9M19
340
233 233 227 209
461
59%
29% 26%
43% 52%
76%
2015 2016 2017 2018 3Q18 3Q19
108
40
(38) (27)
(39)
(3)
0.73x
0.46x
-0.45x -0.25x
-0.37x
-0.03x
2015 2016 2017 2018 3Q18 3Q19
EBITDA and EBITDA Mg. Debt Leverage and Cash Flow
33
S&P – Corporate rating in national scale: brAAA
(1) Last-twelve-month pro-forma EBITDA;
Gross Debt (R$M) and Long Term Debt (%)
Operating Cash Flow (R$M) Net Debt (R$M) and Net Debt / pro-forma EBITDA¹
Gross Debt – Currency Breakdown

464
112
27 18
305
Cash & Equivalents Short Term 2020 2021 2022+
411
50
Local Currency Foreign currency
36
EBITDA and EBITDA Mg. Debt highlights and financial ratios
34
Net cash of R$ 3.3 million at 09/30/2019
Debt Currency Outstanding (R$M) %
NCE BRL 103.2 22.4%
Finimp USD/EUR 15.7 3.4%
Finame BRL 2.3 0.5%
Debentures BRL 295.3 64.1%
CCE BRL 10.3 2.2%
CCE USD 34.0 7.4%
Total 460.9 100.0%
Financial indicators – 3Q19
Debt leverage -0.03x net debt / pro-forma EBITDA LTM
Coverage ratio 1.0 pro-forma EBITDA LTM / interest expenses LTM
Current ratio 2.1 current assets / current liabilities
Quick ratio 2.1 (current assets - inventories) / current liabilities
Cash ratio 1.6 cash & equivalents / current liabilities
Debt Amortization (R$M)
Gross Debt - currency breakdown

51% 52%
82%
42%
99% 97%
31%45%
16%
16%
1% 3%9%38%
8% 3% 1% 3%
28 2715 7
7287
2014 2015 2016 2017 2018 9M19
Port Terminals Logistics Corporate TEV Total (R$M)
1831
85
187205
194
70
4 2 3
2008 2009 2010 2011 2012 2013 2014 2015 2016 2017 2018
Dividends and Interest on Equity distribution (R$M)
CapEx and Dividends R$ million
Capital Expenditures (R$M)

100% Tag Along for all minority shareholders
One Share, One Vote (no shareholders agreement)
Board of directors: 7 members formed by shareholders
Permanent Fiscal Board
Management:
- Stock Options, Performance Shares and Matching for key executives;
- Compensation program for managers and employees: EBITDA and EVA oriented;
- Individual performance plans = clear and targets;
- Progression, promotion and compensation based on meritocracy;
THE BANK OF NEW YORK ADR
DEPARTMENT29,7%
PW237 Participações
22,3%
Dynamo6,2%
Multi STS Participações
5,8%
Richard Klien2,6%
Others32,7%
Management0,4%
Treasury0,3%
38
Corporate Governance “Novo Mercado” listing on B3 – STBP3
36 Total of 669,798,378 voting shares
(1) Includes the participation of the fund ‘RK Exclusivo FIA’
Shareholding Structure (Oct/19)

Sustainability Report¹ compliant with GRI Standard since 2011;
19.2% reduction in CO2 emission per TEU handled in our
terminals;
‘ZeroAcidente’ (Zero Accident) campaign, in 2019: dissemination
of risk and accident prevention culture;
42 37
(1) Acesse o site: Santos Brasil - Sustentabilidade
R$ 26 million invested in training over the last 6 years;
‘Formare Aprendiz’ program: 251 youngsters graduated since
2009; 86 have been hired;
Revision of all compliance policies and codes in 2019: launch
of the New Code of Conduct;
The Best Company in Corporate Governance
in the infrastructure sector – Época magazine
360 yearbook 7th edition.
Awarded as an Outstanding Company in the
Solid Waste Management category – Exame
magazine Sustainability Guide 2018 edition.
Awards 2014 2015 2016 2017 2018
CO2 Emission
CO2 Emission (tons) 30,435 30,337 31,437 31,556 32,297
Port Operation (kgCO2e/TEU¹) 17.32 15.49 15.32 14.85 13.99
Bonded Warehouses (kgCO2e/TEU) 26.57 27.21 19.81 27.61 25.03
Truck Transportation (kgCO2e/TEU) 1.03 0.97 1.01 1.02 1.02
Distribution Center (kgCO2e/TEU) 0.99 1.30 0.63 0.53 0.41
Water
Water consuption (m³) 82,611 69,858 84,817 110,041 82,724
Employees (Own + Fixed third party) 48,645 50,274 48,539 43,587 41,139
Water consumption (m³) per capita 1.70 1.39 1.75 2.52 2.01
Residues
Non-recyclable (tons) 117 119 723 594 627
Recyclable (tons) 395 156 1,454 1,646 1,552
Total residues (tons) 512 275 2,176 2,239 2,179
1. Twenty-Foot Equivalent Unit – unit related to a twenty-foot length container;
Environmental, Social and Governance

45
IR contact, Web and Social Medias
SantosBrasil
santosbrasil_
santosbrasiloficial
santos-brasil
+55 (11) 3279-3279