Institutional Equity Research...
6
REDUCE Escorts Automobile | India Institutional Equity Research Company Update | March 27, 2019 1 Target Price: Rs760 CMP* (Rs) 819 Upside/ (Downside) (%) (7.2) Bloomberg Ticker ESC IN Market Cap. (Rs bn) 100.4 Free Float (%) 60 Shares O/S (mn) 122.6 Likely Monsoon Delay & Expected Down-cycle Warrants Rating Downgrade Escorts (ESC) has delivered a strong performance over last 3 years with ~23% CAGR in its tractor sales over FY15-FY19E on the back of up-cycle in tractor segment. Moreover, favourable geographic-mix coupled with its strategic initiatives helped ESC in gaining market share in FY19. However, following a spectacular performance, the tractor industry is expected to take a pause in FY20E and would undergo cyclical downturn in FY21E. Further, extended winter in 2019 may lead to delayed monsoon this time, which may have negative impact on the agrarian output in FY20E and resultantly would impact the tractor volume across regions in FY20E. Though non agri usage of tractors would drive the volume to some extent, it would not be sufficient to compensate the expected fall in agri-driven tractor demand. Therefore, we reduce our tractor volume growth forecast for ESC for FY20E and FY21E. In view of expected down-cycle, we also lower our target P/E valuation multiple on ESC from 14x to 13x 1-Year forward. Moreover, recent price run-up makes the stock’s valuation higher than its fair value. Thus, we downgrade our recommendation on the stock to REDUCE from BUY with a revised Target Price of Rs760 (from Rs875 earlier). Market Share to Rise; Margin to Remain under Pressure amid Higher Competition We believe that ESC would continue to gain market share in 1HFY20E, supported by its product strength, marketing strategy and favourable geographic-mix. However, post 2019 monsoon, we expect the other geographies in Western and Southern regions (weaker markets of ESC) would bounce back and its market share would stabilise, as M&M would regain lost market shares. Though, overall inventory level across tractor industry is ~8 week at present, which is 3-4 weeks higher than the normal level, ESC’s inventory remains under control. We believe that competitive intensity would increase due to higher inventory, going forward compelling M&M and Sonalika to offer higher incentives in 1QFY20E, which would further increase pricing pressure. ESC’s construction equipment business is also expected to witness similar slowdown in FY20E, as the major infrastructure related spending to taper down in election year. Notably, operating leverage of this business has higher sensitivity on margins. We believe that higher RM cost and wage inflation coupled with limited pricing power would lead to ~60bps contraction in ESC’s margin over FY19-FY21E to 11.4%. Outlook & Valuation We expect ESC’s tractor volume to grow by 5% YoY in FY20E and fall by 7% YoY in FY21E. Therefore, we reduce our tractor volume estimates by 1% and construction equipment volume by 3% each for FY20E and FY21E. We lower our revenue and EBIDTA estimates by 2%/3% and 4%/6% for FY20E/ FY21E, respectively. Accordingly, we cut our EPS estimates by 4%/6% for FY20E/FY21E. Valuing the stock at 13x FY21E EPS, we downwardly revise our Target Price to Rs760 from Rs875 earlier. In view of expected down-cycle for tractor industry, likely slowdown in construction equipment segment, margin pressure and recent price run-up, we downgrade our recommendation on ESC to REDUCE from BUY owing to unfavourable risk reward at current valuation. Research Analyst: Mitul Shah Contact: 022 3303 4628 Email: [email protected] Share price (%) 1 mth 3 mth 12 mth Absolute performance 23.5 19.2 (0.7) Relative to Nifty 17.6 13.0 (13.1 ) Shareholding Pattern (%) Sep-18 Dec-18 Promoter 40.1 40.1 Public 59.9 59.9 1 Year Stock Price Performance Note: * CMP as on March 27, 2019 Key Financial Y/E Mar (Rs mn) FY18 FY19E FY20E FY21E Net Sales 49,951 62,105 68,596 68,121 EBITDA 5,572 7,459 8,264 7,745 EBITDA margin (%) 11.2 12.0 12.0 11.4 Adj. Net Profit 3,493 4,900 5,396 5,009 EPS(Rs) 40.8 57.2 63.0 58.5 PER (x) 20.1 14.3 13.0 14.0 EV/ EBITDA 12.1 9.1 8.3 8.9 RoE (%) 15.3 17.5 16.4 13.2 Source: Company, RSec Research 400 500 600 700 800 900 1000 1100 Mar-18 May-18 Jun-18 Aug-18 Sep-18 Nov-18 Dec-18 Feb-19 Mar-19
Transcript of Institutional Equity Research...

REDUCEEscortsAutomobile | India
Institutional Equity Research
Company Update | March 27, 2019
1
Target Price: Rs760
CMP* (Rs) 819
Upside/ (Downside) (%) (7.2)
Bloomberg Ticker ESC IN
Market Cap. (Rs bn) 100.4
Free Float (%) 60
Shares O/S (mn) 122.6
Likely Monsoon Delay & Expected Down-cycle Warrants Rating Downgrade
Escorts (ESC) has delivered a strong performance over last 3 years with ~23% CAGR in its tractor sales over FY15-FY19E on the back of up-cycle in tractor segment. Moreover, favourable geographic-mix coupled with its strategic initiatives helped ESC in gaining market share in FY19. However, following a spectacular performance, the tractor industry is expected to take a pause in FY20E and would undergo cyclical downturn in FY21E. Further, extended winter in 2019 may lead to delayed monsoon this time, which may have negative impact on the agrarian output in FY20E and resultantly would impact the tractor volume across regions in FY20E. Though non agri usage of tractors would drive the volume to some extent, it would not be sufficient to compensate the expected fall in agri-driven tractor demand. Therefore, we reduce our tractor volume growth forecast for ESC for FY20E and FY21E. In view of expected down-cycle, we also lower our target P/E valuation multiple on ESC from 14x to 13x 1-Year forward. Moreover, recent price run-up makes the stock’s valuation higher than its fair value. Thus, we downgrade our recommendation on the stock to REDUCE from BUY with a revised Target Price of Rs760 (from Rs875 earlier).
Market Share to Rise; Margin to Remain under Pressure amid Higher CompetitionWe believe that ESC would continue to gain market share in 1HFY20E, supported by its product strength, marketing strategy and favourable geographic-mix. However, post 2019 monsoon, we expect the other geographies in Western and Southern regions (weaker markets of ESC) would bounce back and its market share would stabilise, as M&M would regain lost market shares. Though, overall inventory level across tractor industry is ~8 week at present, which is 3-4 weeks higher than the normal level, ESC’s inventory remains under control. We believe that competitive intensity would increase due to higher inventory, going forward compelling M&M and Sonalika to offer higher incentives in 1QFY20E, which would further increase pricing pressure. ESC’s construction equipment business is also expected to witness similar slowdown in FY20E, as the major infrastructure related spending to taper down in election year. Notably, operating leverage of this business has higher sensitivity on margins. We believe that higher RM cost and wage inflation coupled with limited pricing power would lead to ~60bps contraction in ESC’s margin over FY19-FY21E to 11.4%.
Outlook & ValuationWe expect ESC’s tractor volume to grow by 5% YoY in FY20E and fall by 7% YoY in FY21E. Therefore, we reduce our tractor volume estimates by 1% and construction equipment volume by 3% each for FY20E and FY21E. We lower our revenue and EBIDTA estimates by 2%/3% and 4%/6% for FY20E/FY21E, respectively. Accordingly, we cut our EPS estimates by 4%/6% for FY20E/FY21E. Valuing the stock at 13x FY21E EPS, we downwardly revise our Target Price to Rs760 from Rs875 earlier. In view of expected down-cycle for tractor industry, likely slowdown in construction equipment segment, margin pressure and recent price run-up, we downgrade our recommendation on ESC to REDUCE from BUY owing to unfavourable risk reward at current valuation.
Research Analyst: Mitul Shah
Contact: 022 3303 4628
Email: [email protected]
Share price (%) 1 mth 3 mth 12 mth
Absolute performance 23.5 19.2 (0.7)
Relative to Nifty 17.6 13.0 (13.1 )
Shareholding Pattern (%) Sep-18 Dec-18
Promoter 40.1 40.1
Public 59.9 59.9
1 Year Stock Price Performance
Note: * CMP as on March 27, 2019
Key Financial Y/E Mar (Rs mn) FY18 FY19E FY20E FY21E
Net Sales 49,951 62,105 68,596 68,121
EBITDA 5,572 7,459 8,264 7,745
EBITDA margin (%) 11.2 12.0 12.0 11.4
Adj. Net Profit 3,493 4,900 5,396 5,009
EPS(Rs) 40.8 57.2 63.0 58.5
PER (x) 20.1 14.3 13.0 14.0
EV/ EBITDA 12.1 9.1 8.3 8.9
RoE (%) 15.3 17.5 16.4 13.2Source: Company, RSec Research
400
500
600
700
800
900
1000
1100
Mar
-18
May
-18
Jun-
18
Aug
-18
Sep-
18
Nov
-18
Dec
-18
Feb-
19
Mar
-19

EscortsAutomobile | India
Institutional Equity Research
2
Target Price: Rs760
CMP* (Rs) 819
Upside/ (Downside) (%) (7.2)
Bloomberg Ticker ESC IN
REDUCE
Exhibit 1: Revised vs. Old Estimates
FY19E FY20E FY21E
Y/E Mar (Rs mn) Old New % change Old New % change Old New % change
Tractor Vol 96,022 96,022 - 101,784 100,824 (1.0 94,659 93,766 (1.0)
Construction Eqp Vol 6,710 6,710 - 7,179 6,984 (2.7) 7,179 6,984 (2.7)
Net revenues 62,105 62,105 - 69,697 68,596 (1.6) 69,929 68,121 (2.6)
EBIDTA 7,459 7,459 - 8,622 8,264 (4.1) 8,276 7,745 (6.4)
EBIDTA margin (%) 12.0 12.0 - 12.4 12.0 (32) bps 11.8 11.4 (47) bps
Adj. Net Profit 4,900 4,900 - 5,621 5,396 (4.0) 5,355 5,009 (6.5)
EPS (Rs.) 57.2 57.2 - 65.6 63.0 (4.0) 62.5 58.5 (6.5)
Source: RSec Research
Key Risks f Post ongoing slow down any revival in tractor industry in FY20 and FY21.
f Major success of new launches in domestic and overseas markets.
f Sharp decline in commodity prices.
EscortsAutomobile | India
Institutional Equity Research
3
Target Price: Rs760
CMP* (Rs) 819
Upside/ (Downside) (%) (7.2)
Bloomberg Ticker ESC IN
REDUCE
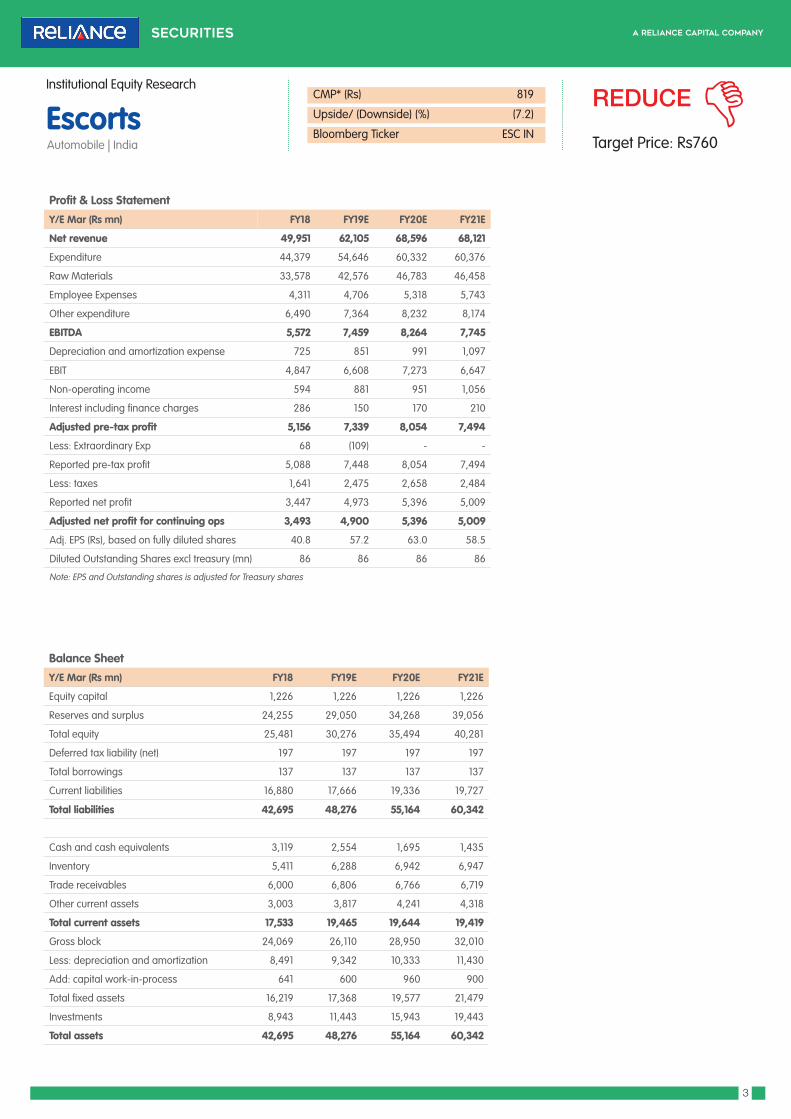
Profit & Loss Statement
Y/E Mar (Rs mn) FY18 FY19E FY20E FY21E
Net revenue 49,951 62,105 68,596 68,121
Expenditure 44,379 54,646 60,332 60,376
Raw Materials 33,578 42,576 46,783 46,458
Employee Expenses 4,311 4,706 5,318 5,743
Other expenditure 6,490 7,364 8,232 8,174
EBITDA 5,572 7,459 8,264 7,745
Depreciation and amortization expense 725 851 991 1,097
EBIT 4,847 6,608 7,273 6,647
Non-operating income 594 881 951 1,056
Interest including finance charges 286 150 170 210
Adjusted pre-tax profit 5,156 7,339 8,054 7,494
Less: Extraordinary Exp 68 (109) - -
Reported pre-tax profit 5,088 7,448 8,054 7,494
Less: taxes 1,641 2,475 2,658 2,484
Reported net profit 3,447 4,973 5,396 5,009
Adjusted net profit for continuing ops 3,493 4,900 5,396 5,009
Adj. EPS (Rs), based on fully diluted shares 40.8 57.2 63.0 58.5
Diluted Outstanding Shares excl treasury (mn) 86 86 86 86
Note: EPS and Outstanding shares is adjusted for Treasury shares
Balance Sheet
Y/E Mar (Rs mn) FY18 FY19E FY20E FY21E
Equity capital 1,226 1,226 1,226 1,226
Reserves and surplus 24,255 29,050 34,268 39,056
Total equity 25,481 30,276 35,494 40,281
Deferred tax liability (net) 197 197 197 197
Total borrowings 137 137 137 137
Current liabilities 16,880 17,666 19,336 19,727
Total liabilities 42,695 48,276 55,164 60,342
Cash and cash equivalents 3,119 2,554 1,695 1,435
Inventory 5,411 6,288 6,942 6,947
Trade receivables 6,000 6,806 6,766 6,719
Other current assets 3,003 3,817 4,241 4,318
Total current assets 17,533 19,465 19,644 19,419
Gross block 24,069 26,110 28,950 32,010
Less: depreciation and amortization 8,491 9,342 10,333 11,430
Add: capital work-in-process 641 600 960 900
Total fixed assets 16,219 17,368 19,577 21,479
Investments 8,943 11,443 15,943 19,443
Total assets 42,695 48,276 55,164 60,342

EscortsAutomobile | India
Institutional Equity Research
4
Target Price: Rs760
CMP* (Rs) 819
Upside/ (Downside) (%) (7.2)
Bloomberg Ticker ESC IN
REDUCE
Cash Flow Statement
Y/E Mar (Rs mn) FY18 FY19E FY20E FY21E
Operating cashflow
Pre-tax income 5,088 7,448 8,054 7,494
Add: depreciation and amortization 725 851 991 1,097
Add: interest expense (net) 214 150 170 210
Less: other adjustments (250) - - -
Less: taxes paid (1,020) (2,475) (2,658) (2,484)
Add: working capital changes (36) (1,712) 632 356
Total operating cashflow 4,722 4,262 7,189 6,673
Free cash flow 3,717 2,222 4,349 3,613
Investing cashflow
Capital expenditure (1,006) (2,041) (2,840) (3,060)
Investments (3,024) (2,500) (4,500) (3,500)
Others 246 41 (360) 60
Total investing cashflow (3,784) (4,500) (7,700) (6,500)
Financing cashflow
Share issuances 2 - - -
Loans (2,131) - - -
Dividend (161) (178) (178) (222)
Interest Payment (209) (150) (170) (210)
Less: Others 2,503 - - -
Total financing cashflow 4 (328) (348) (432)
Net change in cash 942 (566) (859) (259)
Opening cash 545 3,119 2,553 1,694
Closing cash 1,487 2,553 1,694 1,435

EscortsAutomobile | India
Institutional Equity Research
5
Target Price: Rs760
CMP* (Rs) 819
Upside/ (Downside) (%) (7.2)
Bloomberg Ticker ESC IN
REDUCE
Key Ratios
Y/E Mar FY18 FY19E FY20E FY21E
Growth Ratios (%)
Net revenue 22.0 24.3 10.5 (0.7)
EBITDA 72.1 33.9 10.8 (6.3)
Adjusted net profit 76.0 40.3 10.1 (7.2)
Other Ratios (%)
Effective tax rate 32 33 33 33
EBITDA margin 11.2 12.0 12.0 11.4
Adjusted net income margin 7.0 7.9 7.9 7.4
Debt/equity 0.0 0.0 0.0 0.0
ROaCE 15.5 17.7 16.5 13.4
ROaE 15.3 17.5 16.4 13.2
Total asset turnover ratio (x) 1.2 1.3 1.2 1.1
Inventory days 45 42 42 42
Debtor days 44 40 36 36
Creditor days 101 85 85 85
Per share numbers (Rs)
Diluted earnings 40.8 57.2 63.0 58.5
Free cash 43.4 25.9 50.7 42.2
Book value 297.4 353.3 414.2 470.1
Valuations (x)
P/E 20.1 14.3 13.0 14.0
EV/EBITDA 12.1 9.1 8.3 8.9
P/B 2.8 2.3 2.0 1.7
Note: EPS and Outstanding shares is adjusted for Treasury shares

EscortsAutomobile | India
Institutional Equity Research
6
Target Price: Rs760
CMP* (Rs) 819
Upside/ (Downside) (%) (7.2)
Bloomberg Ticker ESC IN
REDUCE
Rating GuidesRating Expected absolute returns (%) over 12 months
BUY >10%
HOLD -5% to 10%
REDUCE >-5%
Reliance Securities Limited (RSL), the broking arm of Reliance Capital is one of the India’s leading retail broking houses. Reliance Capital is amongst India’s leading and most valuable financial services
companies in the private sector. Reliance Capital has interests in asset management and mutual funds, life and general insurance, commercial finance, equities and commodities broking, wealth
management services, distribution of financial products, private equity, asset reconstruction, proprietary investments and other activities in financial services. The list of associates of RSL is available on
the website www.reliancecapital.co.in. RSL is registered as a Research Analyst under SEBI (Research Analyst) Regulations, 2014
General Disclaimers: This Research Report (hereinafter called ‘Report’) is prepared and distributed by RSL for information purposes only. The recommendations, if any, made herein are expression of
views and/or opinions and should not be deemed or construed to be neither advice for the purpose of purchase or sale of any security, derivatives or any other security through RSL nor any solicitation
or offering of any investment /trading opportunity on behalf of the issuer(s) of the respective security(ies) referred to herein. These information / opinions / views are not meant to serve as a professional
investment guide for the readers. No action is solicited based upon the information provided herein. Recipients of this Report should rely on information/data arising out of their own investigations.
Readers are advised to seek independent professional advice and arrive at an informed trading/investment decision before executing any trades or making any investments. This Report has been
prepared on the basis of publicly available information, internally developed data and other sources believed by RSL to be reliable. RSL or its directors, employees, affiliates or representatives do not
assume any responsibility for, or warrant the accuracy, completeness, adequacy and reliability of such information / opinions / views. While due care has been taken to ensure that the disclosures and
opinions given are fair and reasonable, none of the directors, employees, affiliates or representatives of RSL shall be liable for any direct, indirect, special, incidental, consequential, punitive or exemplary
damages, including lost profits arising in any way whatsoever from the information / opinions / views contained in this Report.
Risks: Trading and investment in securities are subject to market risks. There are no assurances or guarantees that the objectives of any of trading / investment in securities will be achieved. The trades/
investments referred to herein may not be suitable to all categories of traders/investors. The names of securities mentioned herein do not in any manner indicate their prospects or returns. The value
of securities referred to herein may be adversely affected by the performance or otherwise of the respective issuer companies, changes in the market conditions, micro and macro factors and forces
affecting capital markets like interest rate risk, credit risk, liquidity risk and reinvestment risk. Derivative products may also be affected by various risks including but not limited to counter party risk, market
risk, valuation risk, liquidity risk and other risks. Besides the price of the underlying asset, volatility, tenor and interest rates may affect the pricing of derivatives.
Disclaimers in respect of jurisdiction: The possession, circulation and/or distribution of this Report may be restricted or regulated in certain jurisdictions by appropriate laws. No action has been or will
be taken by RSL in any jurisdiction (other than India), where any action for such purpose(s) is required. Accordingly, this Report shall not be possessed, circulated and/or distributed in any such country or
jurisdiction unless such action is in compliance with all applicable laws and regulations of such country or jurisdiction. RSL requires such recipient to inform himself about and to observe any restrictions
at his own expense, without any liability to RSL. Any dispute arising out of this Report shall be subject to the exclusive jurisdiction of the Courts in India.
Disclosure of Interest: The research analysts who have prepared this Report hereby certify that the views /opinions expressed in this Report are their personal independent views/opinions in respect of
the securities and their respective issuers. None of RSL, research analysts, or their relatives had any known direct /indirect material conflict of interest including any long/short position(s) in any specific
security on which views/opinions have been made in this Report, during its preparation. RSL’s Associates may have other potential/material conflict of interest with respect to any recommendation and
related information and opinions at the time of publication of research report. RSL, its Associates, the research analysts, or their relatives might have financial interest in the issuer company(ies) of the
said securities. RSL or its Associates may have received a compensation from the said issuer company(ies) in last 12 months for the brokerage or non brokerage services.RSL, its Associates, the research
analysts or their relatives have not received any compensation or other benefits directly or indirectly from the said issuer company(ies) or any third party in last 12 months in any respect whatsoever for
preparation of this report.
The research analysts has served as an officer, director or employee of the said issuer company(ies)?: No
RSL, its Associates, the research analysts or their relatives holds ownership of 1% or more, in respect of the said issuer company(ies).?: No
Copyright: The copyright in this Report belongs exclusively to RSL. This Report shall only be read by those persons to whom it has been delivered. No reprinting, reproduction, copying, distribution of this
Report in any manner whatsoever, in whole or in part, is permitted without the prior express written consent of RSL.
RSL’s activities were neither suspended nor have defaulted with any stock exchange with whom RSL is registered. Further, there does not exist any material adverse order/judgments/strictures assessed
by any regulatory, government or public authority or agency or any law enforcing agency in last three years. Further, there does not exist any material enquiry of whatsoever nature instituted or pending
against RSL as on the date of this Report.
Important These disclaimers, risks and other disclosures must be read in conjunction with the information / opinions / views of which they form part of.
RSL CIN: U65990MH2005PLC154052. SEBI registration no. ( Stock Brokers: NSE - INB / INF / INE 231234833; BSE - INB / INF / INE 011234839, Depository Participants: CDSL IN-DP-257-2016 IN-DP-
NSDL-363-2013, Research Analyst: INH000002384); AMFI ARN No.29889.
Date Reco CMP TP
28-Jan-19 BUY 675 875
08-Jan-19 BUY 731 875
12-Dec-18 BUY 642 1,015
01-Nov-18 BUY 639 1,015
14-Sept-18 BUY 780 1,015
PLEASE CLICK HERE FOR PREVIOUS REPORTS
Rating History


![Index [] · Index 1. Home Equity Products Fact Sheets All Purpose Fixed Rate Home Equity Revolving Home Equity Line of Credit Equity Enhancement Fixed Rate Home Equity](https://static.fdocuments.in/doc/165x107/5b6357717f8b9a0e428bd458/index-index-1-home-equity-products-fact-sheets-all-purpose-fixed-rate-home.jpg)