Institutional Equities Two-wheeler Sector - Nirmal Bang wheeler sector- 26 May 2015.pdf · wheeler...
48
Please refer to the disclaimer towards the end of the document. Institutional Equities Re-initiating Coverage Slow But Steady Two-wheeler stock prices on a YTD basis have underperformed Nifty by 6%-18% as volume growth decelerated after the festive season last year. Adding to it, unseasonal rains in CY15 adversely impacted crop output, leading to weak rural demand. The outlook for the next two quarters looks challenging because of: 1) Crop damage, and 2) High base of 1HFY15. We believe that strong pent-up demand and rising market penetration in rural areas will drive a secular ~9% volume CAGR over the next five years. Valuation of two-wheeler companies like Hero MotoCorp and Bajaj Auto having return ratios in the range of 30%-40% are trading inexpensively at 14x-16x FY17E earnings, restricting downside risk. We have re-initiated coverage on two-wheeler companies with Buy rating on Hero MotoCorp, Accumulate rating on Bajaj Auto and Sell rating on TVS Motor Company. Two-wheeler industry eyeing economic recovery and pent-up demand: Domestic two-wheeler industry posted a CAGR of 8% over FY11-FY15, largely led by scooterisation trend, whereby scooter sales registered a robust 21% CAGR over the period while motorcycle sales witnessed a muted 4% CAGR over the same period. Given the replacement cycle age of five to six years for motorcycles, we believe that strong pent-up demand could come through in FY17/FY18 for motorcycles. Adding to it, demand recovery on the back of improvement in the economy and a normal monsoon will drive domestic two-wheeler growth .It should be noted that motorcycle sales posted a healthy 11% CAGR over FY10-FY12, when the economy picked up. Rural market penetration will continue to drive growth for two-wheelers: Two- wheeler sales growth over the next four-five years will largely come from increased rural market penetration which, as per rating agency Crisil, currently stands at 39% of addressable rural households. It is estimated that by 2020 ~40mn rural households will enter the addressable two-wheeler market. The existing household two-wheeler penetration in India in the addressable income segment (i.e. income of over Rs90,000 per annum) is estimated at around 52% in 2014-15, which is likely to increase to 63% by 2019-20 , largely led by the sharp rise in rural market penetration from 39% to 50%. Two-wheeler industry outperformed car industry in the past: Generally, given the lower market penetration in cars and higher penetration in two-wheelers, the market has a bias towards cars over two-wheelers with the belief that car industry’s growth will outperform that of two-wheelers, However, it is worth noting that two wheeler industry, on a consistent basis in the last few years, has outperformed the car industry in good as well as bad times. Given the low expectations of growth from two-wheeler industry over FY16/FY17, there are higher prospects of this industry’s growth springing a surprise in FY17, just like in 1HFY15 when the car industry reported a muted growth of 4% and the two-wheeler industry reported a strong growth of 16%. Valuations: Valuation of two-wheeler companies like Hero MotoCorp and Bajaj Auto having return ratios in the range of 30%-40% are trading inexpensively at 14x-16x FY17E earnings, restricting downside risk. We have re-initiated coverage on two- wheeler companies with Buy rating on Hero MotoCorp, Accumulate rating on Bajaj Auto and Sell rating on TVS Motor Company. View: Neutral Gaurant Dadwal [email protected] +91-22-3926 8145 One-Year Indexed Performance 70 80 90 100 110 120 130 140 150 May-14 Jul-14 Sep-14 Nov-14 Jan-15 Mar-15 May-15 S&P BSE India Auto IDX NSE CNX NIFTY INDEX Source: Bloomberg (Rsmn) Market capitalisation CMP Target (%) Up/ EPS (Rs) P/E (x) RoE (%) Companies Rating (Rsbn) (US$bn) (Rs) Price (Rs) (Down) FY15 FY16E FY17E FY15 FY16E FY17E FY15 FY16E FY17E Hero MotoCorp Buy 519.2 8.2 2,588 2,981 15 127.2 150.7 186.3 20.3 17.2 13.9 41.8 41.5 42.2 Bajaj Auto Acc. 666.4 12.6 2,302 2,401 4 109.0 123.4 140.7 21.1 18.6 16.3 31.1 30.9 30.2 TVS Motor Sell 109.2 1.7 230 193 (16) 7.3 10.2 12.9 31.4 22.5 17.9 22.7 26.7 27.7 Source: Bloomberg, Nirmal Bang Institutional Equities Research 26 May 2015 Two-wheeler Sector
-
Upload
truongdien -
Category
Documents
-
view
214 -
download
2
Transcript of Institutional Equities Two-wheeler Sector - Nirmal Bang wheeler sector- 26 May 2015.pdf · wheeler...

Please refer to the disclaimer towards the end of the document.
Institutional Equities
Re-
initi
atin
g C
over
age
Slow But Steady Two-wheeler stock prices on a YTD basis have underperformed Nifty by 6%-18% as volume growth decelerated after the festive season last year. Adding to it, unseasonal rains in CY15 adversely impacted crop output, leading to weak rural demand. The outlook for the next two quarters looks challenging because of: 1) Crop damage, and 2) High base of 1HFY15. We believe that strong pent-up demand and rising market penetration in rural areas will drive a secular ~9% volume CAGR over the next five years. Valuation of two-wheeler companies like Hero MotoCorp and Bajaj Auto having return ratios in the range of 30%-40% are trading inexpensively at 14x-16x FY17E earnings, restricting downside risk. We have re-initiated coverage on two-wheeler companies with Buy rating on Hero MotoCorp, Accumulate rating on Bajaj Auto and Sell rating on TVS Motor Company.
Two-wheeler industry eyeing economic recovery and pent-up demand: Domestic two-wheeler industry posted a CAGR of 8% over FY11-FY15, largely led by scooterisation trend, whereby scooter sales registered a robust 21% CAGR over the period while motorcycle sales witnessed a muted 4% CAGR over the same period. Given the replacement cycle age of five to six years for motorcycles, we believe that strong pent-up demand could come through in FY17/FY18 for motorcycles. Adding to it, demand recovery on the back of improvement in the economy and a normal monsoon will drive domestic two-wheeler growth .It should be noted that motorcycle sales posted a healthy 11% CAGR over FY10-FY12, when the economy picked up.
Rural market penetration will continue to drive growth for two-wheelers: Two-wheeler sales growth over the next four-five years will largely come from increased rural market penetration which, as per rating agency Crisil, currently stands at 39% of addressable rural households. It is estimated that by 2020 ~40mn rural households will enter the addressable two-wheeler market. The existing household two-wheeler penetration in India in the addressable income segment (i.e. income of over Rs90,000 per annum) is estimated at around 52% in 2014-15, which is likely to increase to 63% by 2019-20 , largely led by the sharp rise in rural market penetration from 39% to 50%. Two-wheeler industry outperformed car industry in the past: Generally, given the lower market penetration in cars and higher penetration in two-wheelers, the market has a bias towards cars over two-wheelers with the belief that car industry’s growth will outperform that of two-wheelers, However, it is worth noting that two wheeler industry, on a consistent basis in the last few years, has outperformed the car industry in good as well as bad times. Given the low expectations of growth from two-wheeler industry over FY16/FY17, there are higher prospects of this industry’s growth springing a surprise in FY17, just like in 1HFY15 when the car industry reported a muted growth of 4% and the two-wheeler industry reported a strong growth of 16%.
Valuations: Valuation of two-wheeler companies like Hero MotoCorp and Bajaj Auto having return ratios in the range of 30%-40% are trading inexpensively at 14x-16x FY17E earnings, restricting downside risk. We have re-initiated coverage on two-wheeler companies with Buy rating on Hero MotoCorp, Accumulate rating on Bajaj Auto and Sell rating on TVS Motor Company.
View: Neutral
Gaurant Dadwal [email protected] +91-22-3926 8145
One-Year Indexed Performance
70
80
90
100
110
120
130
140
150
May-14 Jul-14 Sep-14 Nov-14 Jan-15 Mar-15 May-15
S&P BSE India Auto IDX NSE CNX NIFTY INDEX
Source: Bloomberg
(Rsmn) Market capitalisation CMP Target (%) Up/ EPS (Rs) P/E (x) RoE (%)
Companies Rating (Rsbn) (US$bn) (Rs) Price (Rs) (Down) FY15 FY16E FY17E FY15 FY16E FY17E FY15 FY16E FY17E
Hero MotoCorp Buy 519.2 8.2 2,588 2,981 15 127.2 150.7 186.3 20.3 17.2 13.9 41.8 41.5 42.2
Bajaj Auto Acc. 666.4 12.6 2,302 2,401 4 109.0 123.4 140.7 21.1 18.6 16.3 31.1 30.9 30.2
TVS Motor Sell 109.2 1.7 230 193 (16) 7.3 10.2 12.9 31.4 22.5 17.9 22.7 26.7 27.7
Source: Bloomberg, Nirmal Bang Institutional Equities Research
26 May 2015
Two-wheeler Sector

Institutional Equities
2 Automobile Sector
Table of Content
Our coverage universe …………………………………….…………………………………..……………………...03 Investment rationale …………………………………….…………………………………………..……….………...06 Two-wheeler industry eyeing economic recovery and pent-up demand…………………………..……...……….07 Scooterisation trend………….……………………………………………………………………………..…….…….08 Established players lost market share, largely to HMSI……..………………………………………………………10 Hero MotoCorp retains market share in motorcycles in FY15………………..……………………...…..……..….12 New launches in premium motorcycle and scooter segments ……….………………………..…………………..14 OEMs adding capacity in anticipation of better FY17/FY18……….……………..…………………………….…..15 OEMs expand dealer network……….……………..…………………………………………………………………..16
Companies
Bajaj Auto……………………………………………………………………….……………....….….….…..19
Hero MotoCorp……………………………………………...…………………….…………..……..….……29
TVS Motor………………………………………………………………………………………………..……39

Institutional Equities
3 Automobile Sector
Our Coverage Universe
Bajaj Auto
BAL underperformed benchmark index Nifty on a YTD basis by 6%. The underperformance was largely because of steep market share loss in the domestic motorcycle segment and weak export demand. Going forward, we expect a PAT CAGR of 10% over FY15-FY17 because we see improvement in volume growth and profitability in FY16/FY17. Post 4QFY15 results, the stock has run up sharply, trading at 16.3x one-year forward earnings. We have valued BAL at 16x FY17E EPS of Rs141+ Rs151/share for stake in KTM and assigned Accumulate rating to it with a target price of Rs2,401.
Exhibit 1: Bajaj Auto’s one-year forward P/E band
0
500
1,000
1,500
2,000
2,500
3,000 A
ug
-08
De
c-0
8
Ap
r-0
9
Au
g-0
9
De
c-0
9
Ap
r-1
0
Au
g-1
0
De
c-1
0
Ap
r-1
1
Au
g-1
1
De
c-1
1
Ap
r-1
2
Au
g-1
2
De
c-1
2
Ap
r-1
3
Au
g-1
3
De
c-1
3
Ma
y-1
4
Au
g-1
4
De
c-1
4
Ma
y-1
5
(Rs)
Price 14 16 18 20
Source: Bloomberg, Nirmal Bang Institutional Equities Research
Exhibit 2: Bajaj Auto’s relative performance to Nifty
80
90
100
110
120
130
140
May-14 Jul-14 Sep-14 Nov-14 Jan-15 Mar-15 May-15
Bajaj Auto NSE CNX NIFTY INDEX
Source: Bloomberg, Nirmal Bang Institutional Equities Research
Exhibit 3: Our estimates are broadly in line with consensus estimates
NBIE estimates Bloomberg estimates Deviation (%)
(Rsmn) FY16E FY17E FY16E FY17E FY16E FY17E
Net sales 232,275 260,036 241,985 274,968 (4.0) (5.4)
EBITDA 46,105 52,583 47,649 54,347 (3.2) (3.2)
EBITDA margin (%) 19.4 19.7 19.7 19.8 (0.3) (0.0)
PAT 35,701 40,701 36,690 41,930 (2.7) (2.9)
EPS (Rs) 123 141 127 145 (3.2) (3.2)
Source: Bloomberg, Nirmal Bang Institutional Equities Research

Institutional Equities
4 Automobile Sector
Hero MotoCorp
We like Hero MotoCorp as the company could surprise positively on low expectations. Further, we believe the market share loss in the motorcycle segment over FY10-FY14 bottomed out with the company gaining a 110bps market share in motorcycles in FY15. Margins could expand by a realistic 175bps in FY17E over FY15 and could surprise positively if demand picks up by the end of FY16. Successful launch of scooters and also penetration in key export markets of Nigeria and Latin America in FY16 remains the joker in the pack. On realistic low estimates, the stock currently trades at 13.9x FY17E earnings of Rs186.3. We have assigned Buy rating to the stock with a target price of Rs2,981, up 15% from the current market price.
Exhibit 4: Hero MotoCorp’s one-year forward P/E ratio
-
500
1,000
1,500
2,000
2,500
3,000
3,500 M
ay-
05
No
v-0
5
Ma
y-0
6
No
v-0
6
Ma
y-0
7
No
v-0
7
Ma
y-0
8
No
v-0
8
Ma
y-0
9
No
v-0
9
Ma
y-1
0
No
v-1
0
Ma
y-1
1
No
v-1
1
Ma
y-1
2
No
v-1
2
Ma
y-1
3
No
v-1
3
Ma
y-1
4
No
v-1
4
Ma
y-1
5
(Rs)
Price 14 16 18 20
Source: Bloomberg, Nirmal Bang Institutional Equities Research
Exhibit 5: Hero MotoCorp’s performance versus BSE Nifty
80
90
100
110
120
130
140
150
May-14 Jul-14 Sep-14 Nov-14 Jan-15 Mar-15 May-15
Hero MotoCorp NSE CNX NIFTY INDEX
Source: Bloomberg, Nirmal Bang Institutional Equities Research
Exhibit 6: Our earnings estimates for FY17 are 7% above consensus estimates
NBIE estimates Bloomberg estimates Deviation (%)
(Rsmn) FY16E FY17E FY16E FY17E FY16E FY17E
Net sales 294,560 335,967 299,590 338,780 (1.7) (0.8)
EBITDA 39,531 49,000 40,720 47,640 (2.9) 2.9
EBITDA margin (%) 13.4 14.6 13.59 14.06 (0.2) 0.5
PAT 30,102 37,210 30,000 34,870 0.3 6.7
EPS (Rs) 150.7 186.3 149.9 174.1 0.6 7.0
Source: Bloomberg, Nirmal Bang Institutional Equities Research

Institutional Equities
5 Automobile Sector
TVS Motor
TVS Motor has been one of the best performing stocks in last one year with a 84% outperformance against benchmark Nifty. After a solid FY15, full of successful new vehicle launches and a robust 22% volume growth, we have factored in 10%/14% volume growth for FY16E/FY17E, respectively, and margin expansion of 100bps/60bps to 7.1%/7.6%, respectively, for the same period. The stock trades expensively at 23x/18x FY16E/FY17E earnings, i.e. at a premium to its historical average and compared to peers like Hero MotoCorp and Bajaj Auto. We have valued TVS Motor at 15x FY17E earnings, at a discount to Bajaj Auto and Hero MotoCorp’s multiple of 16x and assigned Sell rating to the stock with a target price of Rs193, down 16% from the current market price. We believe a re-rating is possible only after the company starts reporting better-than-expected EBITDA margin, which we believe is unlikely in the near term despite strong volume growth expectations.
Exhibit 7: TVS Motor’s one-year forward P/E
(100)
(50)
0
50
100
150
200
250
300
350
Ma
y-0
5
No
v-0
5
Ma
y-0
6
No
v-0
6
Ma
y-0
7
No
v-0
7
Ma
y-0
8
No
v-0
8
Ma
y-0
9
No
v-0
9
Ma
y-1
0
No
v-1
0
Ma
y-1
1
No
v-1
1
Ma
y-1
2
No
v-1
2
Ma
y-1
3
No
v-1
3
Ma
y-1
4
No
v-1
4
Ma
y-1
5
(Rs)
Price 15 20 25 30
Source: Bloomberg, Nirmal Bang Institutional Equities Research
Exhibit 8: TVS Motor stock’s performance versus Nifty
50
70
90
110
130
150
170
190
210
230
250
270
May-14 Jul-14 Sep-14 Nov-14 Jan-15 Mar-15 May-15
TVS Motor Company NSE CNX NIFTY INDEX
Source: Bloomberg, Nirmal Bang Institutional Equities Research
Exhibit 9: Our earnings estimates are significantly below consensus estimates
NBIE estimates Bloomberg estimates Deviation (%)
(Rsmn) FY16E FY17E FY16E FY17E FY16E FY17E
Net sales 114,867 134,071 120,860 143,380 (5.0) (6.5)
EBITDA 8,075 10,229 8,780 11,730 (8.0) (12.8)
EBITDA margin (%) 7.0 7.6 7.26 8.18 (0.2) (0.6)
PAT 4,849 6,113 5,220 7,350 (7.1) (16.8)
EPS (Rs) 10.2 12.9 10.97 15.4 (7.0) (16.4)
Source: Bloomberg, Nirmal Bang Institutional Equities Research
Institutional Equities
6 Automobile Sector
Investment Rationale
Expect re-acceleration in growth over the next five years
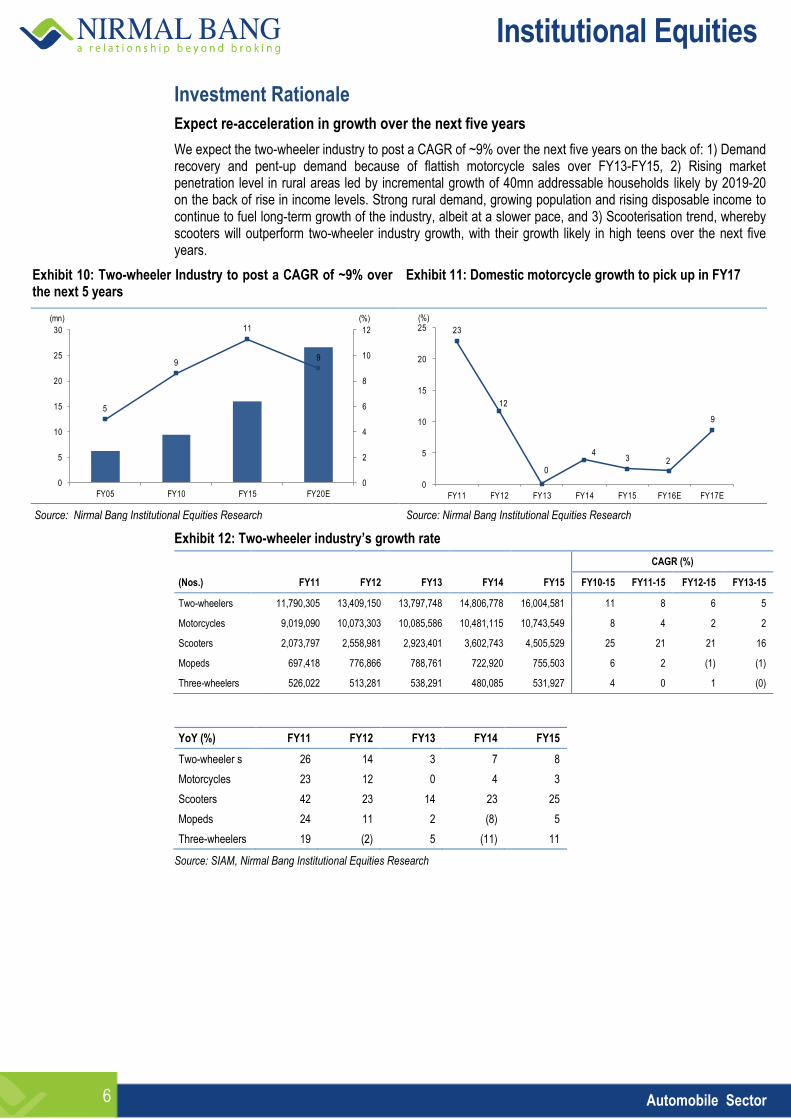
We expect the two-wheeler industry to post a CAGR of ~9% over the next five years on the back of: 1) Demand recovery and pent-up demand because of flattish motorcycle sales over FY13-FY15, 2) Rising market penetration level in rural areas led by incremental growth of 40mn addressable households likely by 2019-20 on the back of rise in income levels. Strong rural demand, growing population and rising disposable income to continue to fuel long-term growth of the industry, albeit at a slower pace, and 3) Scooterisation trend, whereby scooters will outperform two-wheeler industry growth, with their growth likely in high teens over the next five years.
Exhibit 10: Two-wheeler Industry to post a CAGR of ~9% over the next 5 years
Exhibit 11: Domestic motorcycle growth to pick up in FY17
5
9
11
9
0
2
4
6
8
10
12
0
5
10
15
20
25
30
FY05 FY10 FY15 FY20E
(mn) (%)
23
12
0
4 3 2
9
0
5
10
15
20
25
FY11 FY12 FY13 FY14 FY15 FY16E FY17E
(%)
Source: Nirmal Bang Institutional Equities Research Source: Nirmal Bang Institutional Equities Research
Exhibit 12: Two-wheeler industry’s growth rate
CAGR (%)
(Nos.)
FY11 FY12 FY13 FY14 FY15 FY10-15 FY11-15 FY12-15 FY13-15
Two-wheelers
11,790,305 13,409,150 13,797,748 14,806,778 16,004,581 11 8 6 5
Motorcycles
9,019,090 10,073,303 10,085,586 10,481,115 10,743,549 8 4 2 2
Scooters
2,073,797 2,558,981 2,923,401 3,602,743 4,505,529 25 21 21 16
Mopeds
697,418 776,866 788,761 722,920 755,503 6 2 (1) (1)
Three-wheelers
526,022 513,281 538,291 480,085 531,927 4 0 1 (0)
YoY (%) FY11 FY12 FY13 FY14 FY15
Two-wheeler s 26 14 3 7 8
Motorcycles 23 12 0 4 3
Scooters 42 23 14 23 25
Mopeds 24 11 2 (8) 5
Three-wheelers 19 (2) 5 (11) 11
Source: SIAM, Nirmal Bang Institutional Equities Research

Institutional Equities
7 Automobile Sector
Two-wheeler industry eyeing economic recovery and pent-up demand
Domestic two-wheeler industry posted a CAGR of 8% over FY11-FY15, largely led by scooterisation trend, whereby scooters witnessed a robust 21% CAGR while motorcycle sales reported a muted 4% CAGR over the same period. Given the replacement cycle age of five-six years for motorcycles, we believe that strong pent-up demand may be visible over FY17/FY18 for motorcycles, driving domestic two-wheeler growth, as motorcycle sales constitute 67% of domestic two-wheeler industry’s sales. It should be noted that motorcycle sales posted a healthy 11% CAGR over FY10-FY12, when the economy picked up. In the long– run, we expect the two-wheeler industry to report a CAGR of 8%-9% over next 5 years.
Exhibit 13: Domestic two-wheeler sales Exhibit 14: Scooters posted a robust 21% CAGR over the past five years
0
2,000,000
4,000,000
6,000,000
8,000,000
10,000,000
12,000,000
14,000,000
16,000,000
18,000,000
FY09 FY10 FY11 FY12 FY13 FY14 FY15
(Nos)
(2)
3
12 9
27
42
25
14
23 25
17 13
(12)
1
26 23
12
0 4 3
(20)
(10)
0
10
20
30
40
50
FY06 FY07 FY08 FY09 FY10 FY11 FY12 FY13 FY14 FY15
(%)
Source: SIAM, Nirmal Bang Institutional Equities Research Source: SIAM, Nirmal Bang Institutional Equities Research
Exhibit 15 : Domestic motorcycle sales remain flat Exhibit 16: Robust scooter sales
0
2,000,000
4,000,000
6,000,000
8,000,000
10,000,000
12,000,000
FY09 FY10 FY11 FY12 FY13 FY14 FY15
(Nos)
0
500,000
1,000,000
1,500,000
2,000,000
2,500,000
3,000,000
3,500,000
4,000,000
4,500,000
5,000,000
FY09 FY10 FY11 FY12 FY13 FY14 FY15
(Nos)
Source: SIAM, Nirmal Bang Institutional Equities Research Source: SIAM, Nirmal Bang Institutional Equities Research
Rural market penetration to drive two-wheeler industry’s growth in coming years
Currently, India is the second-largest two-wheeler market in the world, with a two-wheeler population of ~ 76mn. Asia accounts for over 80% of overall global two-wheeler sales led by China, India, Indonesia and Vietnam. It should be noted that India remains one of the lowest penetrated markets among others in Asia, largely because of the rural-urban divide, where rural market penetration remained low at ~39% versus 67% in case of urban market in 2015E. According to Crisil, the existing household two-wheeler penetration in the country in the addressable income segment (i.e. income of over Rs90,000 per annum) is estimated at around 52%/42% in 2014-15E, which is likely to increase to 63% by 2019-20E, largely led by rural market penetration rising sharply from 39% to 50%.

Institutional Equities
8 Automobile Sector
Exhibit 17: Two-wheeler penetration in India Exhibit 18: Rural addressable households to increase by ~40mn in five years
49
67
90
29
39
50
39
52
63
0
10
20
30
40
50
60
70
80
90
100
2009-10 2014-15E 2019-20
Urban Rural All India
(%)
161173
183
73
103
142
0
20
40
60
80
100
120
140
160
180
200
2009-10 2014-15E 2019-20
Rural total Households (mn) Addressable Households (mn)
(mn)
Source: Crisil Source: Crisil
Scooterisation trend
Two-wheeler industry’s growth in the past few years has come on the back of robust sales as scooter is the preferred second alternative two-wheeler in a family because of ease and comfort in using it. Scooter contribution has almost doubled from 16% of domestic two-wheeler sales to 28% of sales in FY15. We expect scooters to continue to grow in double-digits for the next few years and drive growth for companies going forward. From our coverage universe, we expect Hero MotoCorp and TVS Motor’s scooter sales to grow 16%/10% and 21%/15% in FY16E/FY17E, respectively.
Exhibit 19: Rising share of scooters in two-wheeler sales
78 77 75 73 71 67
6 6 6 6 55
16 17 19 21 24 28
0%
10%
20%
30%
40%
50%
60%
70%
80%
90%
100%
2009-10 2010-11 2011-12 2012-13 2013-14 2014-15
Motorcycle Moped Scooter Source: SIAM, Nirmal Bang Institutional Equities Research
Exhibit 20: Most OEMs witness increase in the share of scooter mix
Motorcycle mix Scooter mix
(%) FY14 FY15 bps change FY14 FY15 bps change
Hero 89 88 (41) 11 12 41
HMSI 47 41 (521) 53 59 521
TVS Motor 33 32 (100) 26 32 641
Bajaj 100 100 - - - -
Yamaha India 63 62 (185) 37 38 185
Suzuki 17 19 248 83 81 (248)
Mahindra 77 72 (476) 23 28 476
Two Wheeler Industry 71 67 (366) 24 28 382
Source: SIAM, Nirmal Bang Institutional Equities Research

Institutional Equities
9 Automobile Sector
Two-wheelers have outperformed car industry in the past
Generally, given the lower market penetration in cars and higher penetration in two-wheelers, the market has a bias towards cars over two-wheelers with the belief that car industry’s growth will outperform that of two-wheelers. However, it is worth noting that two wheeler industry, on a consistent basis in the last few years, has outperformed the car industry in good as well as bad times. Given the low expectations of growth from two-wheeler industry over FY16/FY17, there are higher prospects of this industry’s growth springing a surprise in FY17, just like in 1HFY15 when the car industry reported a muted growth of 4% and the two-wheeler industry reported a strong growth of 16%. A stronger correlation is also visible in car sales versus motorcycle sales, which makes us believe that two-wheelers should witness growth in FY17/FY18 if the economy picks up over the next two years.
It is only in recent months that car sales outperformed two-wheeler sales and that too because of: 1) Weak motorcycle sales on account of subdued rural demand 2) Fall in crude oil prices resulting in demand revival for petrol cars, 3) Improved sentiment in urban areas, and 4) Market leader in cars, Maruti Suuzki India, doing well because of new vehicle launches and revival in petrol car demand.
It should be noted that the car industry in FY15 grew solely because of Maruti Suzuki India’s strong performance, with the company reporting a domestic 11% YoY volume growth in FY15.
Exhibit 21: Domestic two-wheeler have outgrown passenger vehicle growth rate
Exhibit 22: Monthly trend also paints a similar picture, but two-wheelers underperformed in recent months because of rural market weakness
(10)
(5)
0
5
10
15
20
25
30
35
FY07 FY08 FY09 FY10 FY11 FY12 FY13 FY14 FY15
Total passenger vehicles Total Two wheelers
(%)
(15)
(10)
(5)
0
5
10
15
20
25
Ap
r-1
3
Ma
y-1
3
Jun
-13
Jul-1
3
Au
g-1
3
Se
p-1
3
Oct
-13
No
v-1
3
De
c-1
3
Jan
-14
Fe
b-1
4
Ma
r-1
4
Ap
r-1
4
Ma
y-1
4
Jun
-14
Jul-1
4
Au
g-1
4
Se
p-1
4
Oct
-14
No
v-1
4
De
c-1
4
Jan
-15
Fe
b-1
5
Ma
r-1
5
Motorcycle Industry growth rate PV Industry growth rate
(%)
Source: SIAM, Nirmal Bang Institutional Equities Research Source: SIAM, Nirmal Bang Institutional Equities Research
Exhibit 23: Recent underperformance largely because of weak motorcycle sales.
Exhibit 24: Two-wheeler industry’s growth surprised positively in 1HFY15 , writing off higher market penetration assumption
(15)
(10)
(5)
0
5
10
15
20
25
30
Ap
r-1
3
Ma
y-1
3
Jun
-13
Jul-1
3
Au
g-1
3
Se
p-1
3
Oct
-13
No
v-1
3
De
c-1
3
Jan
-14
Fe
b-1
4
Ma
r-1
4
Ap
r-1
4
Ma
y-1
4
Jun
-14
Jul-1
4
Au
g-1
4
Se
p-1
4
Oct
-14
No
v-1
4
De
c-1
4
Jan
-15
Fe
b-1
5
Ma
r-1
5
2W Industry growth rate PV Industry growth rate
(%)
(10)
(5)
0
5
10
15
20
25
30
Ap
r-1
3
Ma
y-1
3
Jun
-13
Jul-1
3
Au
g-1
3
Se
p-1
3
Oct
-13
No
v-1
3
De
c-1
3
Jan
-14
Fe
b-1
4
Ma
r-1
4
Ap
r-1
4
Ma
y-1
4
Jun
-14
Jul-1
4
Au
g-1
4
Se
p-1
4
Oct
-14
No
v-1
4
De
c-1
4
Jan
-15
Fe
b-1
5
Ma
r-1
5(%)
Source: SIAM, Nirmal Bang Institutional Equities Research Source: SIAM, Nirmal Bang Institutional Equities Research
Institutional Equities
10 Automobile Sector
Exhibit 25: Two-wheeler industry has outgrown car industry
CAGR (%)
YoY (%) FY11 FY12 FY13 FY14 FY15 FY10-15 FY11-15 FY12-15 FY13-15
Car Industry 29 4 2 (7) 4 6 1 (0) (1)
Two wheeler 26 14 3 7 8 11 8 6 5
Motorcycles 23 12 0 4 3 8 4 2 2
Scooters 42 23 14 23 25 25 21 21 16
Mopeds 24 11 2 (8) 5 6 2 (1) (1)
3W 19 (2) 5 (11) 11 4 0 1 (0)
Source: SIAM, Nirmal Bang Institutional Equities Research
Established players lost market share, largely to HMSI
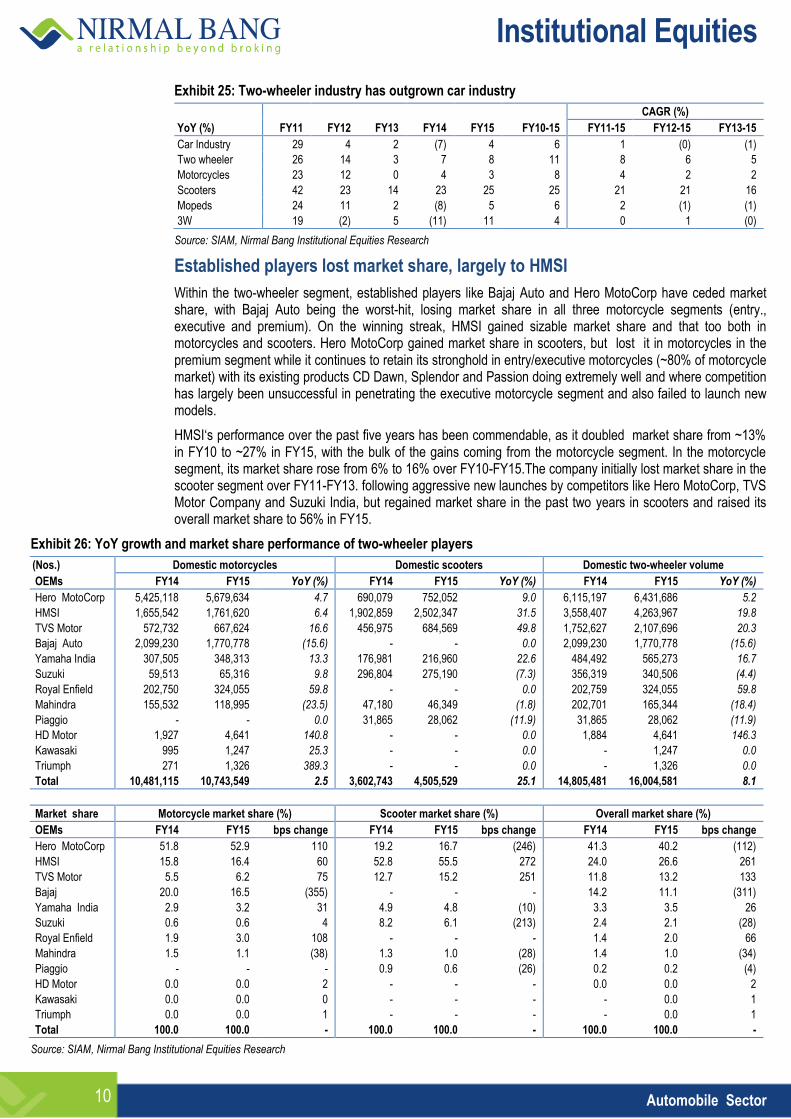
Within the two-wheeler segment, established players like Bajaj Auto and Hero MotoCorp have ceded market share, with Bajaj Auto being the worst-hit, losing market share in all three motorcycle segments (entry., executive and premium). On the winning streak, HMSI gained sizable market share and that too both in motorcycles and scooters. Hero MotoCorp gained market share in scooters, but lost it in motorcycles in the premium segment while it continues to retain its stronghold in entry/executive motorcycles (~80% of motorcycle market) with its existing products CD Dawn, Splendor and Passion doing extremely well and where competition has largely been unsuccessful in penetrating the executive motorcycle segment and also failed to launch new models.
HMSI‘s performance over the past five years has been commendable, as it doubled market share from ~13% in FY10 to ~27% in FY15, with the bulk of the gains coming from the motorcycle segment. In the motorcycle segment, its market share rose from 6% to 16% over FY10-FY15.The company initially lost market share in the scooter segment over FY11-FY13. following aggressive new launches by competitors like Hero MotoCorp, TVS Motor Company and Suzuki India, but regained market share in the past two years in scooters and raised its overall market share to 56% in FY15.
Exhibit 26: YoY growth and market share performance of two-wheeler players
(Nos.) Domestic motorcycles Domestic scooters Domestic two-wheeler volume
OEMs FY14 FY15 YoY (%) FY14 FY15 YoY (%) FY14 FY15 YoY (%)
Hero MotoCorp 5,425,118 5,679,634 4.7 690,079 752,052 9.0 6,115,197 6,431,686 5.2
HMSI 1,655,542 1,761,620 6.4 1,902,859 2,502,347 31.5 3,558,407 4,263,967 19.8
TVS Motor 572,732 667,624 16.6 456,975 684,569 49.8 1,752,627 2,107,696 20.3
Bajaj Auto 2,099,230 1,770,778 (15.6) - - 0.0 2,099,230 1,770,778 (15.6)
Yamaha India 307,505 348,313 13.3 176,981 216,960 22.6 484,492 565,273 16.7
Suzuki 59,513 65,316 9.8 296,804 275,190 (7.3) 356,319 340,506 (4.4)
Royal Enfield 202,750 324,055 59.8 - - 0.0 202,759 324,055 59.8
Mahindra 155,532 118,995 (23.5) 47,180 46,349 (1.8) 202,701 165,344 (18.4)
Piaggio - - 0.0 31,865 28,062 (11.9) 31,865 28,062 (11.9)
HD Motor 1,927 4,641 140.8 - - 0.0 1,884 4,641 146.3
Kawasaki 995 1,247 25.3 - - 0.0 - 1,247 0.0
Triumph 271 1,326 389.3 - - 0.0 - 1,326 0.0
Total 10,481,115 10,743,549 2.5 3,602,743 4,505,529 25.1 14,805,481 16,004,581 8.1
Market share Motorcycle market share (%) Scooter market share (%) Overall market share (%)
OEMs FY14 FY15 bps change FY14 FY15 bps change FY14 FY15 bps change
Hero MotoCorp 51.8 52.9 110 19.2 16.7 (246) 41.3 40.2 (112)
HMSI 15.8 16.4 60 52.8 55.5 272 24.0 26.6 261
TVS Motor 5.5 6.2 75 12.7 15.2 251 11.8 13.2 133
Bajaj 20.0 16.5 (355) - - - 14.2 11.1 (311)
Yamaha India 2.9 3.2 31 4.9 4.8 (10) 3.3 3.5 26
Suzuki 0.6 0.6 4 8.2 6.1 (213) 2.4 2.1 (28)
Royal Enfield 1.9 3.0 108 - - - 1.4 2.0 66
Mahindra 1.5 1.1 (38) 1.3 1.0 (28) 1.4 1.0 (34)
Piaggio - - - 0.9 0.6 (26) 0.2 0.2 (4)
HD Motor 0.0 0.0 2 - - - 0.0 0.0 2
Kawasaki 0.0 0.0 0 - - - - 0.0 1
Triumph 0.0 0.0 1 - - - - 0.0 1
Total 100.0 100.0 - 100.0 100.0 - 100.0 100.0 -
Source: SIAM, Nirmal Bang Institutional Equities Research

Institutional Equities
11 Automobile Sector
Exhibit 27: Two-wheeler industry’s market share movement: Bajaj Auto cedes maximum market share
17 19 20 19 18 14 11
49 48 45 45 4341
40
14 13 13 15 19 24 27
15 14 15 14 13 12 13
5 6 7 7 8 9 9
0
10
20
30
40
50
60
70
80
90
100
FY09 FY10 FY11 FY12 FY13 FY14 FY15
Bajaj Auto Hero Motocorp HMSI TVS Motor Company Others
(%)
Source: SIAM, Nirmal Bang Institutional Equities Research
HMSI continues to gain market share in scooters
HMSI has ruled the domestic scooter space since a long time and continues to do so. What is even more commendable is that despite the rise in competitive intensity, the company steadily gained market share from FY11. In FY15 too, the company gained a 272bps market share. Scooters now contribute ~ 59% to HMSI’s two-wheeler volume versus 53% in FY14.
Exhibit 28: Market share trend in scooters – HMSI continues to gain market share
57
51
42
48 4953
56
1314 17 16
19 1917
0
10
20
30
40
50
60
FY09 FY10 FY11 FY12 FY13 FY14 FY15
HMSI TVS Motor Hero MotoCorp Suzuki India
(%)
Source: SIAM, Nirmal Bang Institutional Equities Research
Exhibit 29: Monthly scooter market share (%)
Domestic scooter market share FY14 Apr-14 May-14 Jun-14 Jul-14 Aug-14 Sep-14 Oct-14 Nov-14 Dec-14 Jan-15 Feb-15 Mar-15 FY15
HMSI 52.8 51.7 53.0 51.5 58.0 59.0 55.0 52.0 56.1 55.7 56.4 56.3 60.4 55.5
TVS Motor 12.7 13.5 14.6 17.0 15.4 17.4 15.5 17.5 15.9 13.8 13.8 14.8 13.2 15.2
Hero MotoCorp 19.2 19.1 17.9 18.3 14.2 12.7 15.3 15.5 16.2 19.9 19.0 18.2 14.8 16.7
Suzuki motorcycle 8.2 7.0 7.4 6.3 6.3 4.4 7.5 7.1 6.1 4.8 5.9 5.4 5.1 6.1
Mahindra two-wheelers 1.3 0.9 0.7 0.6 0.5 0.5 0.7 1.6 1.1 1.1 1.4 1.4 1.7 1.0
Piaggio 0.9 0.7 0.6 0.7 0.5 0.7 0.6 0.8 0.6 0.5 0.6 0.6 0.6 0.6
Yamaha India 4.9 7.2 5.8 5.6 5.0 5.4 5.4 5.5 4.0 4.2 2.8 3.3 4.1 4.8
Source: SIAM, Nirmal Bang Institutional Equities Research

Institutional Equities
12 Automobile Sector
Hero MotoCorp retains market share in motorcycles in FY15
In the two-wheeler segment, developing successful brand remains a key challenge as witnessed in the various new launches by OEMs (original equipment manufacturers) in the two-wheeler space, but only a few succeeded and most of them, over the recent years, failed to come out with successful brands. Hero MotoCorp, after the split with Honda, weathered the competition successfully on the back of strong Splendor and Passion brands which dominate the entry/executive segments of the motorcycle market with a strong 65% share. We think it’s commendable that Splendor and Passion have held their feet strong on the ground despite aggressive launches by competitors like Bajaj Auto, TVS Motor, HMSI, Suzuki and Yamaha India, but only a handful of them tasted success while the rest either disappeared or come down to low single-digits, including Bajaj’ Auto’s Discover family.
Exhibit 30: Market share trend – motorcycles
60 5855 56
53 52 53
2224
27 25 2420
16
6 6 7 812
16 16
0
10
20
30
40
50
60
FY09 FY10 FY11 FY12 FY13 FY14 FY15
Hero MotoCorp Bajaj Auto HMSI TVS Motor
(%)
Source: SIAM, Nirmal Bang Institutional Equities Research
Exhibit 31: Monthly market share - motorcycles
(%) FY14 Apr-14 May-14 Jun-14 Jul-14 Aug-14 Sep-14 Oct-14 Nov-14 Dec-14 Jan-15 Feb-15 Mar-15 FY15
Hero MotoCorp 51.8 54.4 53.4 53.8 54.0 53.7 48.6 48.7 53.7 55.4 54.0 52.7 53.7 52.9
Bajaj Auto 20.0 18.3 17.9 16.9 14.6 15.1 18.9 20.3 15.0 13.7 14.8 15.0 15.7 16.5
HMSI 15.8 14.4 15.5 16.3 17.2 16.8 17.0 16.1 16.0 15.6 17.2 18.0 16.9 16.4
TVS Motor 5.5 5.7 6.2 5.9 5.9 6.4 7.3 6.7 6.6 6.0 6.0 6.0 5.5 6.2
Yamaha India 2.9 3.0 2.7 2.6 3.7 3.6 3.4 3.3 3.4 3.7 3.2 3.3 2.9 3.2
Suzuki Motorcycles 0.6 0.4 0.4 0.3 0.2 0.4 0.9 0.8 0.9 0.8 0.8 0.8 0.8 0.6
Royal Enfield 1.9 2.5 2.5 2.8 3.1 2.9 2.6 2.5 3.2 3.6 3.2 3.8 3.8 3.0
Source: SIAM, Nirmal Bang Institutional Equities Research

Institutional Equities
13 Automobile Sector
Exhibit 32: Entry, executive and premium market share - monthly
Economy (%) FY14 Apr-14 May-14 Jun-14 Jul-14 Aug-14 Sep-14 Oct-14 Nov-14 Dec-14 Jan-15 Feb-15 Mar-15 FY15 YoY
bps change
Bajaj Auto (Boxer, CT, Platina, Discover) 17.2 15.0 15.5 14.0 10.9 9.4 13.6 13.8 9.7 9.6 9.7 11.1 12.6 12.1 (508)
Hero MotoCorp (CD Dawn, CD Deluxe, Splendor, Passion) 66.2 71.1 69.0 69.6 71.7 71.4 64.5 64.6 71.1 74.6 72.9 73.0 71.4 70.2 402
Honda Motorcycle (CB Twister, Dream Yuga) 8.7 6.0 6.6 7.7 8.9 10.7 11.1 11.3 10.6 8.5 10.2 9.0 9.4 9.2 49
Yamaha India Motor (Crux, YBR 110) 0.6 0.5 0.5 0.4 0.5 0.5 0.4 0.5 0.4 0.4 0.5 0.4 0.4 0.5 (14)
TVS Motor (MAX, Victor GX, Jive, Max 4r, Star City, Sport) 5.0 5.2 6.3 6.0 6.1 6.5 8.3 7.3 6.5 5.1 5.7 5.9 5.3 6.2 126
Mahindra 2W (Pantero) 2.3 2.1 2.2 2.2 2.0 1.6 2.1 2.3 1.6 1.7 1.1 0.6 0.9 1.7 (55)
Executive
Bajaj Auto Ltd (Boxer, Platina, Discover, KTM) 13.9 13.1 10.4 7.6 6.1 5.2 4.5 6.0 4.1 4.1 3.7 3.7 3.3 6.4 (754)
Hero MotoCorp Ltd (Super Splendor, Glamour, Ignitor) 39.5 41.4 42.3 41.7 43.4 34.4 47.8 40.6 41.6 41.4 37.6 37.7 42.6 41.4 189
Honda Motorcycle & Scooter India (Pvt) Ltd (CB Shine, CBF Stunner/Fi) 38.4 39.6 42.2 46.3 46.9 54.7 41.7 47.6 50.5 52.6 56.0 55.8 51.8 47.8 939
Yamaha India Motor Pvt Ltd (SS 125, Enticer, YD125) 0.7 0.5 0.5 0.5 0.8 1.0 0.6 1.3 0.5 0.6 0.9 0.9 0.7 0.7 (3)
Suzuki Motorcycle India Pvt Ltd (Hayate, Slingshot) 2.8 1.8 1.7 1.7 0.8 0.9 2.6 2.4 1.1 0.7 0.9 1.5 1.5 1.5 (132)
TVS Motor Company Ltd (Victor GLX, Flame, Star City 125, Phoenix) 4.5 3.6 2.8 2.2 2.0 3.7 2.9 2.1 2.2 0.7 0.9 0.4 0.1 2.1 (241)
Premium
Bajaj Auto (Boxer, Discover, Pulsar) 40.9 37.9 37.9 42.8 38.4 49.3 53.8 58.6 55.2 46.8 50.4 47.5 48.6 47.6 663
Hero MotoCorpd (Achiever, Hunk, CBZ X-Treme, Impulse) 9.7 16.0 14.5 13.8 13.4 6.3 3.8 3.5 3.8 2.6 4.0 8.0 8.0 8.1 (164)
Honda Motorcycle & Scooter India (CB Unicorn, CB Unicorn Dazzler, CBR 150R)
26.7 24.1 27.0 22.6 21.0 16.0 20.7 16.8 11.0 18.1 20.3 17.1 17.2 19.5 (715)
Yamaha India Motor (FZ, Fazer, SZ, R15) 22.3 21.9 20.4 20.7 27.1 26.4 21.6 21.1 29.9 32.5 25.3 27.3 26.2 24.6 226
Suzuki Motorcycle India (GS150R) 0.4 0.1 0.2 0.2 0.1 2.0 0.0 0.1 0.0 0.0 0.0 0.0 0.0 0.3 (10)
Source: SIAM, Nirmal Bang Institutional Equities Research
Exhibit 33: Vehicle launches which failed in entry and executive motorcycle segments
Exhibit 34: Model launches which failed in premium motorcycle segment in the past few years
Bajaj Auto Wind 125
XCD 125
XCD 135
Discover 150
Boxer 150
Yamaha India G5
Gladiator
Alba
YBR 125 SS
YD 125
Freedom110
TVS Motor MAX 100 R
Centra
Victor 125
Flame
Jive
TVS Phoenix
Suzuki Heat
Zeus
Sling Shot
M&M Stallio
Pantero
Centuro
Hero MotoCorp Karizma
Impulse
Yamaha India R1
Fazer
VMAX
SZ
FZ1
Source: Nirmal Bang Institutional Equities Research Source: Nirmal Bang Institutional Equities Research

Institutional Equities
14 Automobile Sector
New launches in premium motorcycle and scooter segments
Given the ongoing rural slowdown, most of the two-wheeler OEMs have postponed their new motorcycle launches planned in 2HFY16 and are now banking on new scooter launches and premium motorcycles whose demand remains strong as they are largely preferred in urban and semi- urban areas. Most OEMs have planned new premium motorcycle launches as this segment is growing versus overall market size of the industry and also because demand for these motorcycles is less impacted by weakness in rural areas. OEMs are also banking on scooters in 1HFY15 because despite strong growth in the past few years the demand continues to remain strong. To cite an instance, Hero MotoCorp postponed its motorcycle launches in 2HFY16 and will instead launch two scooter models in 1HFY16. Also, it should be noted that competitive intensity has eased in entry segment motorcycles with no new launch planned by existing players in the near future.
Exhibit 35: Upcoming scooter launches
Scooters
OEM Model
Hero MotoCorp
Dare
Dash
ZIR
Honda Motorcycle and Scooters India PCX125
Yamaha India Motorcycles Ray 125
D'elight
Vespa Fly 125
946
Source: Nirmal Bang Institutional Equities Research
Exhibit 36: Upcoming motorcycle launches – largely in premium category
Bajaj Auto
Pulsar 150 NS
Pulsar 400 SS
Pulsar 160 NS
Pulsar 400 CS
RS400
180NS
200NS FI
Hero MotoCorp
Impulse 250
HX250R
RNT
Hastur
Honda Motorcycle and Scooters India
CBR 650F
CBR300R
CB500F
CBR500R
CB500X
Suzuki Motorcycle Gladius 650
Yamaha India Motorcycles YZF R25
YZF-R3
Mahindra & Mahindra Mojo 300
KTM
390 Adventure
1190 Adventure
1050 Adventure
TVS Motor Apache
TVS Victor
Source: Nirmal Bang Institutional Equities Research
Institutional Equities
15 Automobile Sector
OEMs adding capacity in anticipation of better FY17/FY18
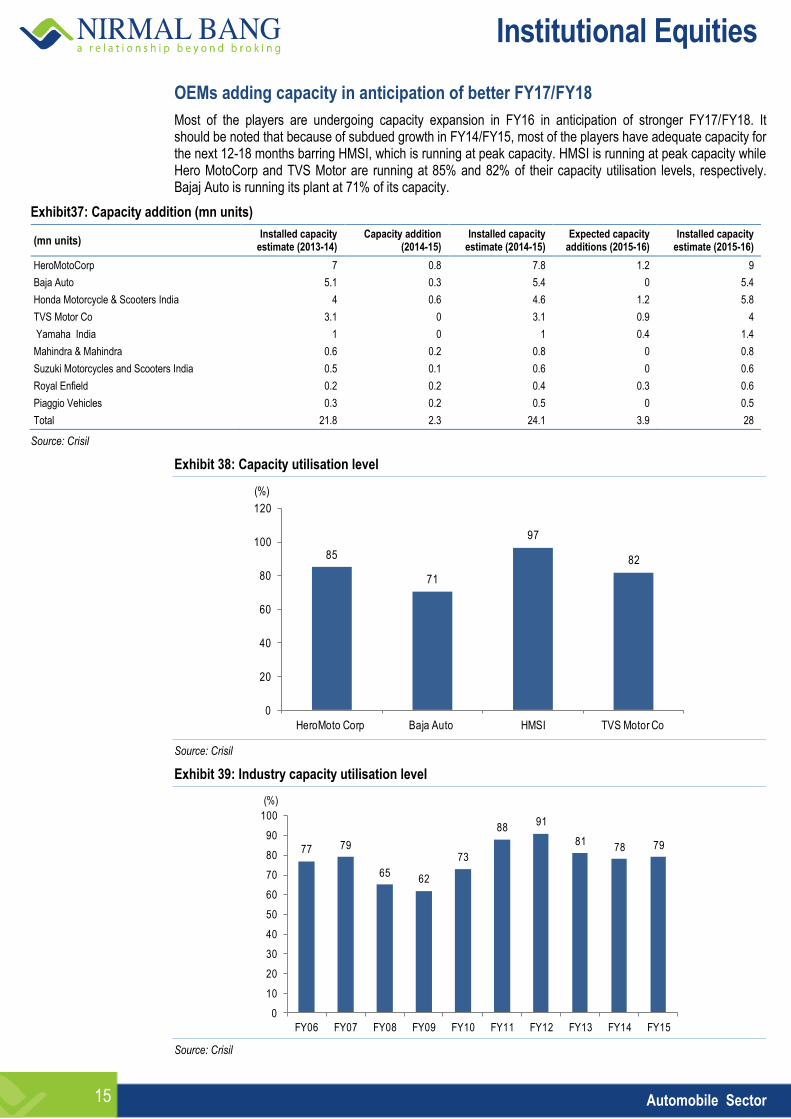
Most of the players are undergoing capacity expansion in FY16 in anticipation of stronger FY17/FY18. It should be noted that because of subdued growth in FY14/FY15, most of the players have adequate capacity for the next 12-18 months barring HMSI, which is running at peak capacity. HMSI is running at peak capacity while Hero MotoCorp and TVS Motor are running at 85% and 82% of their capacity utilisation levels, respectively. Bajaj Auto is running its plant at 71% of its capacity.
Exhibit37: Capacity addition (mn units)
(mn units) Installed capacity
estimate (2013-14) Capacity addition
(2014-15) Installed capacity
estimate (2014-15) Expected capacity
additions (2015-16) Installed capacity
estimate (2015-16)
HeroMotoCorp 7 0.8 7.8 1.2 9
Baja Auto 5.1 0.3 5.4 0 5.4
Honda Motorcycle & Scooters India 4 0.6 4.6 1.2 5.8
TVS Motor Co 3.1 0 3.1 0.9 4
Yamaha India 1 0 1 0.4 1.4
Mahindra & Mahindra 0.6 0.2 0.8 0 0.8
Suzuki Motorcycles and Scooters India 0.5 0.1 0.6 0 0.6
Royal Enfield 0.2 0.2 0.4 0.3 0.6
Piaggio Vehicles 0.3 0.2 0.5 0 0.5
Total 21.8 2.3 24.1 3.9 28
Source: Crisil
Exhibit 38: Capacity utilisation level
85
71
97
82
0
20
40
60
80
100
120
HeroMoto Corp Baja Auto HMSI TVS Motor Co
(%)
Source: Crisil
Exhibit 39: Industry capacity utilisation level
77 79
6562
73
8891
8178 79
0
10
20
30
40
50
60
70
80
90
100
FY06 FY07 FY08 FY09 FY10 FY11 FY12 FY13 FY14 FY15
(%)
Source: Crisil

Institutional Equities
16 Automobile Sector
OEMs expand dealer network
Given the lower penetration in rural areas, OEMs expanded their capacities in rural and semi–urban areas. Most of the players who witnessed increase in the dealer base have tried their fortune in scooter segment which has witnessed robust growth in the past few years on the back of scooterisation trend in urban and semi-urban areas. Also, OEMs have aggressively launched new products in entry and executive motorcycle segments, and ramped up their network in smaller towns and villages which offer more room for growth compared to urban areas. Hero MotoCorp’s dealer base has witnessed a low single-digit growth in dealer base over the past three years, but the company penetrated deeper into rural areas by adding more touch-points than dealers. To cite an example, Hero MotoCorp’s touch-points in FY12 stood at ~3,700 which the company almost doubled to more than 6,000 in FY15.
Exhibit 40: Major expansion of dealer base of most companies
FY12 FY15
Players Dealers (nos) Dealers (nos) % Change
Bajaj Auto 600 675 13
Hero Honda 700 800 14
TVS Motor 650 900 38
Mahindra & Mahindra 370 500 35
Honda Motorcycle & Scooters 400 768 92
Suzuki Motorcyles India 200 330 65
Yamaha India 450 410 (9)
Source: Crisil, Nirmal Bang Institutional Equities Research

Institutional Equities
17 Automobile Sector
CCoommppaannyy SSeeccttiioonn

Institutional Equities
18 Automobile Sector
This page has been intentionally left blank

Please refer to the disclaimer towards the end of the document.
Institutional Equities
Reuters: BAJA.BO; Bloomberg: BJAUT IN
Bajaj Auto
Re-
initi
atin
g C
over
age
Valuation Factors In Positives
We re-initiate coverage on Bajaj Auto (BAL) with Accumulate rating and a one- year target price of Rs2,390. After declining 6% YTD, the stock has moved up sharply by 15% in the past one month on the back of pick-up in exports and improved domestic market share with the launch of CT 100 motorcycle. We expect market share gains for BAL in the motorcycle segment in FY16 on the back of successful launch of CT 100, which is expected to offset falling Discover sales. As regards exports, we believe the company will post a 10% growth in FY16E because headwinds such as political instability in some countries and currency devaluations have somewhat eased. We have valued Bajaj Auto at 16x FY17E EPS of Rs141 + Rs151/share for stake in KTM and assigned Accumulate rating to it with a target price of Rs 2,401.
Volume to grow for the first time in three years: BAL reported volume decline of 3%/9%/2% in FY13/FY14/FY15, respectively, and lost a 680bps market share to competitors over FY13-FY15 as new vehicles launched struggled. With the introduction of CT 100 and Platina (electric start), domestic motorcycle volume gained momentum, while export outlook improved with headwinds easing. We expect BAL to report 8%/11% YoY growth in volume for FY16/FY17, respectively. We expect domestic market growth of 6% and export market growth of 10% in FY16.
Market share losses bottom out: Recent launches of CT 100 and Platina (electric start) gained strong momentum in the past couple of months, with BAL’s market share improving from ~15% in 4QFY15 to 18.2% as of end-April 2015. Ramp-up in volume of CT 100 and Platina (electric start) helped the company to offset the sharp decline in Discover volume, where its recent monthly run-rate had slipped below 30,000 units per month versus 57,000 units in 1HFY15 and 82,000 units in FY14. We believe the market share losses for BAL since FY13 have bottomed out at 15% in 4QFY15 and expect the company to regain market share of ~17% in FY16.
Exports in recovery mode: Exports in 4QFY15 fell sharply by 11% YoY and 27% QoQ on economic/political factors and devaluation of currencies impacting demand. With currency headwinds easing and general elections concluded in Nigeria and Sri Lanka, export demand witnessed a healthy improvement in April 2015. BAL is targeting 10%-11% volume growth in exports in FY16, while in 1QFY16 it is looking at ~ 0.48mn units versus 0.35mn units in 4QFY15 with the order book expected to remain healthy in May and June 2015.We have factored in a 10% export volume growth in FY16E.
Earnings to post a 10% CAGR over FY15-FY17E: Despite a worsening mix of higher contribution of entry segment motorcycles and weak exports, BAL reported adjusted margin of ~ 19% for 4QFY15. Margins for FY15 stood at 19%, which continues to remain miles ahead of competitors Hero MotoCorp (~13%), TVS Motor (~6.5%) and HMSI (~10%-11%). We expect the margins to improve marginally to 19.4% and 19.7% in FY16/FY17, respectively, from 19% in FY15 and earnings CAGR of 10% over FY15-FY17 driven by a 8% volume growth and marginal EBITDA margin improvement. We have valued BAL at 16x FY17E EPS of Rs 141 + Rs151/share for stake in KTM and assigned Accumulate rating to it with a target price of Rs2,401.
ACCUMULATE
Sector: Automobile
CMP: Rs2,302
Target Price: Rs2,401
Upside: 4%
Gaurant Dadwal [email protected] +91-22-3926 8145
Key Data
Current Shares O/S (mn) 289.4
Mkt Cap (Rsbn/US$bn) 666.1/12.6
52 Wk H / L (Rs) 2,695/1,913
Daily Vol. (3M NSE Avg.) 507,994
Share Holding (%) 2QFY15 3QFY15 4QFY15
Promoter 50.0 50.0 49.2
FII 17.7 18.8 17.0
DII 8.0 18.8 17.0
Others 24.3 24.2 25.1
One-Year Indexed Stock Performance
80
90
100
110
120
130
140
May-14 Jul-14 Sep-14 Nov-14 Jan-15 Mar-15 May-15
Bajaj Auto NSE CNX NIFTY INDEX
Price Performance (%)
1 M 6 M 1 Yr
Bajaj Auto 15.2 (12.9) 16.5
Nifty Index 0.8 (1.1) 13.6
Source: Bloomberg
Y/E March (Rsmn) FY13 FY14 FY15 FY16E FY17E
Revenues 194,890 197,176 211,039 232,275 260,036 YoY (%) 2.4 0.8 7.3 10.1 11.9 EBITDA 36,381 41,057 41,166 46,105 52,583 EBITDA (%) 18.2 20.4 19.0 19.4 19.7 Adj. PAT 30,436 32,420 31,540 35,701 40,701 YoY (%) 1.3 6.6 (13.2) 26.9 14.0 FDEPS (Rs) 105.2 112.0 109.0 123.4 140.7 RoE (%) 43.7 37.0 31.1 30.9 30.2
RoCE (%) 46.9 42.8 36.5 36.1 35.7
P/E (x) 21.9 20.5 21.1 18.6 16.3 EV/EBITDA 17.4 15.5 14.6 12.7 10.7
EV/sales 3.2 3.2 2.8 2.5 2.1
Source: Company, Nirmal Bang Institutional Equities Research
26 May 2015

Institutional Equities
20 Bajaj Auto
We assign Accumulate rating to BAL with a target price of Rs2,401
BAL underperformed benchmark index Nifty on a YTD basis by 6%. The underperformance was largely because of steep market share loss in the domestic motorcycle segment and weak export demand. Going forward, we expect a PAT CAGR of 10% over FY15-FY17 because we see improvement in volume growth and profitability in FY16/FY17. Post 4QFY15 results, the stock has run up sharply, trading at 16.3x one-year forward earnings. We have valued BAL at 16x FY17E EPS of Rs141+ Rs151/share for stake in KTM and assigned Accumulate rating to it with a target price of Rs2,401.
Exhibit 1: Bajaj Auto’s relative performance to Nifty Exhibit 2: One-year forward P/E band
80
90
100
110
120
130
140
May-14 Jul-14 Sep-14 Nov-14 Jan-15 Mar-15 May-15
Bajaj Auto NSE CNX NIFTY INDEX
0
500
1,000
1,500
2,000
2,500
3,000
Au
g-0
8
De
c-0
8
Ap
r-0
9
Au
g-0
9
De
c-0
9
Ap
r-1
0
Au
g-1
0
De
c-1
0
Ap
r-1
1
Au
g-1
1
De
c-1
1
Ap
r-1
2
Au
g-1
2
De
c-1
2
Ap
r-1
3
Au
g-1
3
De
c-1
3
Ma
y-1
4
Au
g-1
4
De
c-1
4
Ma
y-1
5
(Rs)
Price 14 16 18 20 Source: Bloomberg, Nirmal Bang Institutional Equities Research Source: Bloomberg, Nirmal Bang Institutional Equities Research
Exhibit 3: Our estimates are broadly in line with consensus estimates
NBIE estimates Bloomberg estimates Deviation (%)
(Rsmn) FY16E FY17E FY16E FY17E FY16E FY17E
Net sales 232,275 260,036 241,985 274,968 4.2 5.7
EBITDA 46,105 52,583 47,649 54,347 3.3 3.4
EBITDA margin (%) 19.4 19.7 19.7 19.8 (31.1) (1.9)
PAT 35,701 40,701 36,690 41,930 2.8 3.0
EPS (Rs) 123 141 127 145 3.3 3.3
Source: Bloomberg, Nirmal Bang Institutional Equities Research

Institutional Equities
21 Bajaj Auto
Investment Rationale
Volume to grow for the first time in three years
BAL reported volume decline of 3%/9%/2% in FY13/FY14/FY15, respectively, and lost a 680bps market share to competitors over FY13-FY15 as new vehicles launched struggled. With the introduction of CT 100 and Platina (electric start), domestic motorcycle volume gained momentum, while export outlook improved with headwinds easing. We expect BAL to report 8%/11% YoY growth in volume for FY16/FY17, respectively. We expect domestic market growth of 6% and export market growth of 10% in FY16.
Exhibit 4: New launches to drive improvement in volumes Exhibit 5: After three years of weak volumes , growth to pick up in FY16
3,400,000
3,600,000
3,800,000
4,000,000
4,200,000
4,400,000
4,600,000
4,800,000
FY11 FY12 FY13 FY14 FY15 FY16E FY17E
(Nos.)
34
14
(3)
(9)
(2)
8 11
(15)
(10)
(5)
-
5
10
15
20
25
30
35
40
FY11 FY12 FY13 FY14 FY15 FY16E FY17E
(%)
Source: Company, Nirmal Bang Institutional Equities Research Source: Company, Nirmal Bang Institutional Equities Research
Exhibit 6: Two-wheeler volume to witness sharp improvement Exhibit 7: Exports to continue growth momentum
3,000,000
3,100,000
3,200,000
3,300,000
3,400,000
3,500,000
3,600,000
3,700,000
3,800,000
3,900,000
4,000,000
FY11 FY12 FY13 FY14 FY15 FY16E FY17E
(Nos.)
0
500,000
1,000,000
1,500,000
2,000,000
2,500,000
FY11 FY12 FY13 FY14 FY15 FY16E FY17E
(Nos.)
Source: Company, Nirmal Bang Institutional Equities Research Source: Company, Nirmal Bang Institutional Equities Research
Exhibit 8: Volume estimates
(Units) FY12 FY13 FY14 FY15 FY16E FY17E
Domestic 3,834,405 3,757,094 3,422,403 3,292,084 3,532,754 3,867,436
2-wheeler 2,566,757 2,463,863 2,099,230 1,770,778 1,859,317 2,026,655
3-wheeler 1,267,648 1,293,231 1,323,173 1,521,306 1,673,437 1,840,780
Exports 507,317 477,213 447,618 519,117 580,503 679,358
2-wheeler 195,141 223,287 186,856 234,345 264,406 315,846
3-wheeler 312,176 253,926 260,762 284,772 316,097 363,511
Total 4,341,722 4,234,307 3,870,021 3,811,201 4,113,256 4,546,793
YoY Growth (%)
Domestic 13.2 (2.0) (8.9) (3.8) 7.3 9.5
2-wheeler 6.3 (4.0) (14.8) (15.6) 5.0 9.0
3-wheeler 30.4 2.0 2.3 15.0 10.0 10.0
Exports 17.3 (5.9) (6.2) 16.0 11.8 17.0
2-wheeler (3.0) 14.4 (16.3) 25.4 12.8 19.5
3-wheeler 35.1 (18.7) 2.7 9.2 11.0 15.0
Total 13.7 (2.5) (8.6) (1.5) 7.9 10.5
Source: Company, Nirmal Bang Institutional Equities Research

Institutional Equities
22 Bajaj Auto
Market share losses bottom out
Recent launches of CT 100 and Platina (electric start) gained strong momentum in the past couple of months, with BAL’s market share improving from ~15% in 4QFY15 to 18.2% as of end-April 2015. Ramp-up in volume of CT 100 and Platina (electric start) helped the company to offset the sharp decline in Discover volume, where its recent monthly run-rate had slipped below 30,000 units per month versus 57,000 units in 1HFY15 and 82,000 units in FY14. We believe the market share losses for BAL since FY13 have bottomed out at 15% in 4QFY15 and expect the company to regain market share of ~17% in FY16.
Exhibit 9: Two-wheeler industry’s market share movement- Bajaj Auto sheds maximum market share
Exhibit 10: Market share trend – motorcycles
17 19 20 19 18 14 11
49 48 45 45 4341
40
14 13 13 15 19 24 27
15 14 15 14 13 12 13
5 6 7 7 8 9 9
0
10
20
30
40
50
60
70
80
90
100
FY09 FY10 FY11 FY12 FY13 FY14 FY15
Bajaj Auto Hero Motocorp HMSI TVS Motor Company Others
(%)
60 5855 56
53 52 53
2224
27 25 2420
16
6 6 7 812
16 16
0
10
20
30
40
50
60
FY09 FY10 FY11 FY12 FY13 FY14 FY15
Hero MotoCorp Bajaj Auto HMSI TVS Motor
(%)
Source: SIAM, Nirmal Bang Institutional Equities Research Source: SIAM, Nirmal Bang Institutional Equities Research
Focus on premium and economy segments
BAL revisited its strategy after Discover sales failed to gain market share in the executive segment. The company now plans to focus entirely on economy and premium segments, which account for ~40% of the motorcycle industry. The company dominated the premium segment with a market-leading share in excess of 30% on the back of Pulsar model, while in entry segment the launch of Platina and CT100 increased its market share to 33% and 40% in March 2015 and April 2015, respectively, versus FY15 average of 23%. In premium segment, BAL recently launched Pulsar variants RS200/AS200/AS150 and plans to launch more variants to strengthen its position in premium segment motorcycles. BAL is targeting a market share of 23%-24% by the end of 4QFY16, as it expects to gain market share in economy and premium motorcycles.
Exhibit 11: Monthly motorcycle market share – Bajaj Auto Exhibit 12: Bajaj Auto’s market share in entry, executive, premium segments – continuous market share loss in executive segment
23
21
18
17
18 19 19 18 18
17
15 15
19
20
15
14
15 15 16
18
10
12
14
16
18
20
22
24
Se
p 2
01
3
Oct
20
13
No
v 2
01
3
De
c 2
01
3
Jan
20
14
Fe
b 2
01
4
Ma
r 20
14
Ap
r 20
14
Ma
y 2
01
4
Jun
20
14
Jul 2
01
4
Au
g 2
01
4
Se
p 2
01
4
Oct
20
14
No
v 2
01
4
De
c 2
01
4
Jan
20
15
Fe
b 2
01
5
Ma
r 20
15
Ap
r 20
15
(%)
0
5
10
15
20
25
30
35
40
45
Se
p 2
01
3
Oct
20
13
No
v 2
01
3
De
c 2
01
3
Jan
20
14
Fe
b 2
01
4
Ma
r 20
14
Ap
r 20
14
Ma
y 2
01
4
Jun
20
14
Jul 2
01
4
Au
g 2
01
4
Se
p 2
01
4
Oct
20
14
No
v 2
01
4
De
c 2
01
4
Jan
20
15
Fe
b 2
01
5
Ma
r 20
15
Ap
r 20
15
Entry Executive Premium
(%)
Source: Crisil, Nirmal Bang Institutional Equities Research Source: Crisil, Nirmal Bang Institutional Equities Research

Institutional Equities
23 Bajaj Auto
Exhibit 13: Model-wise monthly sales
(Nos.) Sep
2013 Oct
2013 Nov
2013 Dec
2013 Jan
2014 Feb
2014 Mar
2014 Apr
2014 May 2014
Jun 2014
Jul 2014
Aug 2014
Sep 2014
Oct 2014
Nov 2014
Dec 2014
Jan 2015
Feb 2015
Mar 2015
Apr 2015
CT 100 - - - - - - - - - - - - - - - -
6,845 29,189 53,440
Pulsar 69,023 64,169 43,252 30,803 47,738 44,439 49,971 53,605 56,420 52,875 46,035 50,814 71,396 70,810 48,397 38,446 52,966 43,954 48,156 51,296
Platina 100/125 40,985 49,199 34,734 26,269 39,345 36,131 42,955 48,563 57,023 47,750 31,413 31,599 53,200 55,766 31,427 28,948 35,571 35,076 29,252 27,224
Discover 100cc 58,060 82,423 65,899 60,965 59,977 59,720 40,344 36,653 38,215 29,553 25,085 25,350 37,301 35,894 22,903 19,918 20,912 13,698 12,415 15,326
Discover 125cc 28,558 25,290 14,040 14,964 17,005 11,982 31,878 23,702 20,133 12,914 17,291 24,236 38,160 34,614 19,446 14,495 13,709 10,807 9,382 8,067
Eliminator/Avenger 4,612 5,491 3,263 1,984 2,996 2,850 3,617 3,136 3,331 3,585 3,536 3,964 5,257 4,754 3,362 2,910 4,136 3,315 3,561 3,284
Source: Crisil, Nirmal Bang Institutional Equities Research
Exports in recovery mode
Exports in 4QFY15 fell sharply by 11% YoY and 27% QoQ as economic/political factors and devaluation of currencies impacted demand. With currencies stabilising and general elections concluded in Nigeria and Sri Lanka, export demand witnessed a healthy improvement in April 2015 .BAL is targeting 10%-11% volume growth in exports in FY16, while in 1QFY16 it is looking at ~ 0.48mn units versus 0.35mn units in 4QFY15 as the order book is likely to remain healthy in May and June 2015. We have factored in a 10% export volume growth in FY16E.
After elections in March 2015, motorcycle demand revived in Nigeria with the monthly run-rate stabilising at 30,000-35,000 units per month versus a low of 15,000 units per month in 4QFY15 and a high of ~48,000 units per month in 3QFY15. In Egypt and Latin America also, the company witnessed a pick-up in demand from 1QFY16.
Exhibit 14: Quarterly exports fell sharply in 4QFY15 because of multiple headwinds
Exhibit 15: Headwinds have eased , export volume to grow in FY16/FY17
0
100,000
200,000
300,000
400,000
500,000
600,000
1Q
FY
12
2Q
FY
12
3Q
FY
12
4Q
FY
12
1Q
FY
13
2Q
FY
13
3Q
FY
13
4Q
FY
13
1Q
FY
14
2Q
FY
14
3Q
FY
14
4Q
FY
14
1Q
FY
15
2Q
FY
15
3Q
FY
15
4Q
FY
15
(Nos.)
0
500,000
1,000,000
1,500,000
2,000,000
2,500,000
FY11 FY12 FY13 FY14 FY15 FY16E FY17E
(Nos.)
Source: Company, Nirmal Bang Institutional Equities Research Source: Company, Nirmal Bang Institutional Equities Research

Institutional Equities
24 Bajaj Auto
Exports have strong potential for growth
BAL currently exports its products to 48 countries (Asia, Middle East , Africa and Latin America), which have a combined market size of 5.65mn units and plans to enter another 28 countries (developed markets) in two years which have a combined market size of 2.75mn units. It is noteworthy that BAL has a leadership position in 85% of the markets it exports to, largely in Africa and Latin America. Exports offer significant room to grow from the current level because two-wheeler penetration in Africa and Latin America is still much less compared to Asia and Middle East markets. Further, penetration into developed markets over a span of two-five years with high-end motorcycles offers strong revenue growth potential.
Exhibit 16: Motorcycle penetration in African and Latin American markets remains low
0
10
20
30
40
50
60
70
80
90
Africa Asia and Middle East Latin America
(Motorcycle Penetration /1,000)
Source: Company
Exhibit 17: Bajaj Auto’s share in two-wheelers in key export markets Exhibit18: Bajaj Auto’s market share in three-wheelers
Bajaj Auto’s market share - country-wise estimates for FY15 Ranking in
country
South Asia and Middle East
Sri Lanka 80% 1
Bangladesh 54% 1
Nepal 40% 1
Egypt 28% 1
Iran 28% 2
ASEAN Philippines 30% 1
Africa
Uganda 88% 1
South Sudan 58% 1
Ethiopia 49% 1
Nigeria 42% 1
Congo 33% 1
Kenya 25% 1
Angola 29% 1
Tanzania 16% 2
Latin America
Colombia 44% 1
Guatemala 34% 1
Nicaragua 46% 1
Honduras 18% 2
Peru 19% 2
Bajaj Auto’s market share – country-wise estimates for FY15
Ranking in country
South Asia and Middle East
Sri Lanka 91% 1
Bangladesh 98% 1
Egypt 98% 1
Africa
Sudan 97% 1
Nigeria 52% 1
Ethiopia 51% 1
Latin America
Mexico 92% 1
Central America 82% 1
Peru 83% 1
Colombia 64% 1
Source: Company Source: Company

Institutional Equities
25 Bajaj Auto
Margins to remain stable in the range of 19%-20%
Despite a worsening mix of higher contribution of entry segment motorcycles and weak exports, BAL reported adjusted margins of ~19% for 4QFY15. Margins for FY15 at 19% continues to remain miles ahead of competitors Hero MotoCorp (~13%), TVS Motor (~6.5%) and HMSI (~10%-11%). We expect margins to improve marginally to 19.4%/19.7% in FY16/FY17, respectively, from 19.0% in FY15 because of: 1) Better operating leverage following volume growth, and 2) Weak realisation in INR terms in FY16 (management guidance of US dollar realisation of Rs63.5 ) to offset the negative impact of rising contribution of entry segment motorcycles.
Exhibit 19: Margins adversely impacted in 4QFY15 because of one-offs
Exhibit 20: Expect improvement in EBITDA margin over the next two years
17.9 18.4 18.7 17.6
18.5
21.9 22.1
18.9 17.6
18.9
21.7
17.7
0
5
10
15
20
25
1Q
FY
12
2Q
FY
12
3Q
FY
12
4Q
FY
12
1Q
FY
13
2Q
FY
13
3Q
FY
13
4Q
FY
13
1Q
FY
14
2Q
FY
14
3Q
FY
14
4Q
FY
14
(%)
19
19
18
20
19
19
20
17.0
17.5
18.0
18.5
19.0
19.5
20.0
20.5
21.0
FY11 FY12 FY13 FY14 FY15 FY16E FY17E
(%)
Source: Company, Nirmal Bang Institutional Equities Research Source: Company, Nirmal Bang Institutional Equities Research
Exhibit 21: Quarterly volume fell sharply in 4QFY15 Exhibit 22: Gross margin continues to improve despite tough
environment in domestic and export markets
600,000
700,000
800,000
900,000
1,000,000
1,100,000
1,200,000
1Q
FY
12
2Q
FY
12
3Q
FY
12
4Q
FY
12
1Q
FY
13
2Q
FY
13
3Q
FY
13
4Q
FY
13
1Q
FY
14
2Q
FY
14
3Q
FY
14
4Q
FY
14
1Q
FY
15
2Q
FY
15
3Q
FY
15
4Q
FY
15
(Nos.)
2627
29 29
26 26 2627
29
31
29 2928
2930
31
22
24
26
28
30
32
34
36
1Q
FY
12
2Q
FY
12
3Q
FY
12
4Q
FY
12
1Q
FY
13
2Q
FY
13
3Q
FY
13
4Q
FY
13
1Q
FY
14
2Q
FY
14
3Q
FY
14
4Q
FY
14
1Q
FY
15
2Q
FY
15
3Q
FY
15
4Q
FY
15
(%)
Source: Company, Nirmal Bang Institutional Equities Research Source: Company, Nirmal Bang Institutional Equities Research
Exhibit 23: Quarterly realisation trend – Sharp improvement because of a richer product mix and weak INR/USD rate
Exhibit 24: EBITDA/vehicle declines in 4QFY15
(4)
(2)
-
2
4
6
8
10
12
25,000
30,000
35,000
40,000
45,000
50,000
55,000
1Q
FY
12
2Q
FY
12
3Q
FY
12
4Q
FY
12
1Q
FY
13
2Q
FY
13
3Q
FY
13
4Q
FY
13
1Q
FY
14
2Q
FY
14
3Q
FY
14
4Q
FY
14
1Q
FY
15
2Q
FY
15
3Q
FY
15
4Q
FY
15
Realisation YoY
(Rs) (%)
-
2,000
4,000
6,000
8,000
10,000
12,000
14,000
1Q
FY
12
2Q
FY
12
3Q
FY
12
4Q
FY
12
1Q
FY
13
2Q
FY
13
3Q
FY
13
4Q
FY
13
1Q
FY
14
2Q
FY
14
3Q
FY
14
4Q
FY
14
1Q
FY
15
2Q
FY
15
3Q
FY
15
4Q
FY
15
(Rs)
Source: Company, Nirmal Bang Institutional Equities Research Source: Company, Nirmal Bang Institutional Equities Research

Institutional Equities
26 Bajaj Auto
Financials
Earnings CAGR of 10% likely over FY15-FY17E
After three years of weak sales, BAL is likely to report improvement in volume, which is expected to rise 8%/11% in FY16/FY17, respectively. We expect margins to improve marginally by 70bps over FY15-FY17, purely because of better operating leverage, while on the earnings front we expect the company to report a 10% CAGR over FY15-FY17E.
Exhibit 25: Net sales trend Exhibit 26: PAT trend
0
50,000
100,000
150,000
200,000
250,000
300,000
FY11 FY12 FY13 FY14 FY15 FY16E FY17E
(Rsmn)
-
5,000
10,000
15,000
20,000
25,000
30,000
35,000
40,000
45,000
FY11 FY12 FY13 FY14 FY15 FY16E FY17E
(Rsmn)
Source: Company, Nirmal Bang Institutional Equities Research Source: Company, Nirmal Bang Institutional Equities Research
Key Risks
Valuation
BAL underperformed benchmark index Nifty on a YTD basis by 6%. The underperformance was largely because of steep market share loss in the domestic motorcycle segment and weak export demand. Going forward, we expect a PAT CAGR of 10% over FY15-FY17 because we see improvement in volume growth and profitability in FY16/FY17. Post 4QFY15 results, the stock has run up sharply, trading at 16.3x one-year forward earnings. We have valued BAL at 16x FY17E EPS of Rs141+ Rs151/share for stake in KTM and assigned Accumulate rating to it with a target price of Rs2,401.
Exhibit 27: Investment in KTM
KTM
CMP (in euros) 120
Market cap (in euros) 1,300
Market cap (Rsmn) 90,986
Bajaj Auto’s 47.99% 43,664
Invested value 43,664
Invested value/ share 151
Source: Company, Nirmal Bang Institutional Equities Research
Institutional Equities
27 Bajaj Auto
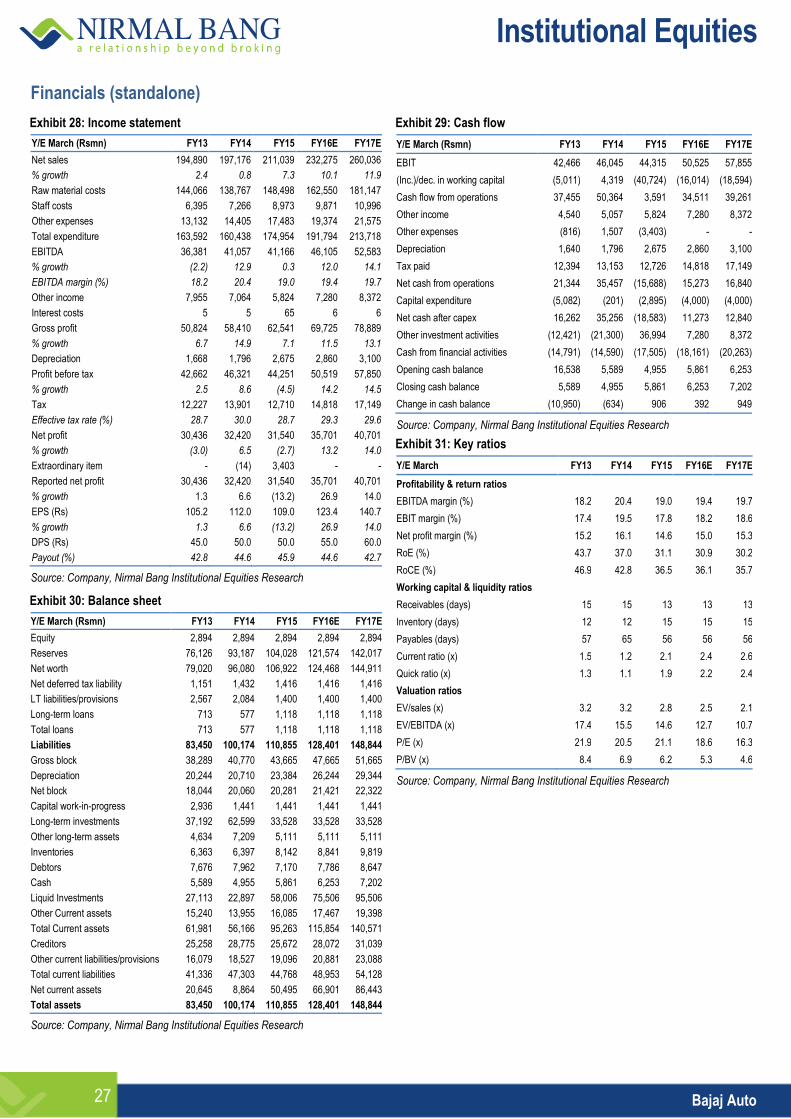
Financials (standalone)
Exhibit 28: Income statement
Y/E March (Rsmn) FY13 FY14 FY15 FY16E FY17E
Net sales 194,890 197,176 211,039 232,275 260,036
% growth 2.4 0.8 7.3 10.1 11.9
Raw material costs 144,066 138,767 148,498 162,550 181,147
Staff costs 6,395 7,266 8,973 9,871 10,996
Other expenses 13,132 14,405 17,483 19,374 21,575
Total expenditure 163,592 160,438 174,954 191,794 213,718
EBITDA 36,381 41,057 41,166 46,105 52,583
% growth (2.2) 12.9 0.3 12.0 14.1
EBITDA margin (%) 18.2 20.4 19.0 19.4 19.7
Other income 7,955 7,064 5,824 7,280 8,372
Interest costs 5 5 65 6 6
Gross profit 50,824 58,410 62,541 69,725 78,889
% growth 6.7 14.9 7.1 11.5 13.1
Depreciation 1,668 1,796 2,675 2,860 3,100
Profit before tax 42,662 46,321 44,251 50,519 57,850
% growth 2.5 8.6 (4.5) 14.2 14.5
Tax 12,227 13,901 12,710 14,818 17,149
Effective tax rate (%) 28.7 30.0 28.7 29.3 29.6
Net profit 30,436 32,420 31,540 35,701 40,701
% growth (3.0) 6.5 (2.7) 13.2 14.0
Extraordinary item - (14) 3,403 - -
Reported net profit 30,436 32,420 31,540 35,701 40,701
% growth 1.3 6.6 (13.2) 26.9 14.0
EPS (Rs) 105.2 112.0 109.0 123.4 140.7
% growth 1.3 6.6 (13.2) 26.9 14.0
DPS (Rs) 45.0 50.0 50.0 55.0 60.0
Payout (%) 42.8 44.6 45.9 44.6 42.7
Source: Company, Nirmal Bang Institutional Equities Research
Exhibit 30: Balance sheet
Y/E March (Rsmn) FY13 FY14 FY15 FY16E FY17E
Equity 2,894 2,894 2,894 2,894 2,894
Reserves 76,126 93,187 104,028 121,574 142,017
Net worth 79,020 96,080 106,922 124,468 144,911
Net deferred tax liability 1,151 1,432 1,416 1,416 1,416
LT liabilities/provisions 2,567 2,084 1,400 1,400 1,400
Long-term loans 713 577 1,118 1,118 1,118
Total loans 713 577 1,118 1,118 1,118
Liabilities 83,450 100,174 110,855 128,401 148,844
Gross block 38,289 40,770 43,665 47,665 51,665
Depreciation 20,244 20,710 23,384 26,244 29,344
Net block 18,044 20,060 20,281 21,421 22,322
Capital work-in-progress 2,936 1,441 1,441 1,441 1,441
Long-term investments 37,192 62,599 33,528 33,528 33,528
Other long-term assets 4,634 7,209 5,111 5,111 5,111
Inventories 6,363 6,397 8,142 8,841 9,819
Debtors 7,676 7,962 7,170 7,786 8,647
Cash 5,589 4,955 5,861 6,253 7,202
Liquid Investments 27,113 22,897 58,006 75,506 95,506
Other Current assets 15,240 13,955 16,085 17,467 19,398
Total Current assets 61,981 56,166 95,263 115,854 140,571
Creditors 25,258 28,775 25,672 28,072 31,039
Other current liabilities/provisions 16,079 18,527 19,096 20,881 23,088
Total current liabilities 41,336 47,303 44,768 48,953 54,128
Net current assets 20,645 8,864 50,495 66,901 86,443
Total assets 83,450 100,174 110,855 128,401 148,844
Source: Company, Nirmal Bang Institutional Equities Research
Exhibit 29: Cash flow
Y/E March (Rsmn) FY13 FY14 FY15 FY16E FY17E
EBIT 42,466 46,045 44,315 50,525 57,855
(Inc.)/dec. in working capital (5,011) 4,319 (40,724) (16,014) (18,594)
Cash flow from operations 37,455 50,364 3,591 34,511 39,261
Other income 4,540 5,057 5,824 7,280 8,372
Other expenses (816) 1,507 (3,403) - -
Depreciation 1,640 1,796 2,675 2,860 3,100
Tax paid 12,394 13,153 12,726 14,818 17,149
Net cash from operations 21,344 35,457 (15,688) 15,273 16,840
Capital expenditure (5,082) (201) (2,895) (4,000) (4,000)
Net cash after capex 16,262 35,256 (18,583) 11,273 12,840
Other investment activities (12,421) (21,300) 36,994 7,280 8,372
Cash from financial activities (14,791) (14,590) (17,505) (18,161) (20,263)
Opening cash balance 16,538 5,589 4,955 5,861 6,253
Closing cash balance 5,589 4,955 5,861 6,253 7,202
Change in cash balance (10,950) (634) 906 392 949
Source: Company, Nirmal Bang Institutional Equities Research
Exhibit 31: Key ratios
Y/E March FY13 FY14 FY15 FY16E FY17E
Profitability & return ratios
EBITDA margin (%) 18.2 20.4 19.0 19.4 19.7
EBIT margin (%) 17.4 19.5 17.8 18.2 18.6
Net profit margin (%) 15.2 16.1 14.6 15.0 15.3
RoE (%) 43.7 37.0 31.1 30.9 30.2
RoCE (%) 46.9 42.8 36.5 36.1 35.7
Working capital & liquidity ratios
Receivables (days) 15 15 13 13 13
Inventory (days) 12 12 15 15 15
Payables (days) 57 65 56 56 56
Current ratio (x) 1.5 1.2 2.1 2.4 2.6
Quick ratio (x) 1.3 1.1 1.9 2.2 2.4
Valuation ratios
EV/sales (x) 3.2 3.2 2.8 2.5 2.1
EV/EBITDA (x) 17.4 15.5 14.6 12.7 10.7
P/E (x) 21.9 20.5 21.1 18.6 16.3
P/BV (x) 8.4 6.9 6.2 5.3 4.6
Source: Company, Nirmal Bang Institutional Equities Research
Institutional Equities
28 Bajaj Auto
This page has been intentionally left blank

Please refer to the disclaimer towards the end of the document.
Institutional Equities
Reuters: HROM.BO; Bloomberg: HMCL IN
Hero MotoCorp
Re-
initi
atin
g C
over
age
Market Leader At Attractive Valuation We have re-initiated coverage on Hero MotoCorp with a one-year target price of Rs2,981, up 15% from the current market price. Our target price is based on 16x FY17E EPS of Rs.186. The stock currently trades at 13.9x FY17E earnings i.e. at a discount to its long-term average P/E of 16x. We believe the current market price offers a good entry point as we expect high single-digit volume growth and a 175bps margin expansion from FY15 levels. Hero MotoCorp stock, on a YTD basis has corrected sharply and has underperformed benchmark index Nifty by 16%. Underperformance to benchmark Nifty index: Hero MotoCorp has underperformed benchmark index Nifty by ~16% On a YTD basis because of three main reasons: 1) Rise in advertisement spending, resulting in EBITDA margin being lower than expectations, 2) Weak demand in rural areas, and 3) Promoters selling close to 5% of their equity stake. Advertisement spending, as a percentage of sales, in 4QFY15 was ~90bps higher than the historical average, which is expected to normalise in the coming quarters and remain at ~2.4% of sales versus historical average of 2.0%. Demand is likely to improve from 2HFY16 and rise more in FY17. Market share likely to improve in FY16/FY17: Hero MotoCorp has lost ~112bps market share in the domestic two-wheeler market in FY15,and a major portion of the market share loss was in 2Q/3QFY15 with the company facing capacity constraints in scooters. In the motorcycle segment, the company ended FY15 with a market share gain of 110bps. The motorcycle segment’s market share gain in FY15 came after four years of losses and also at a time when competitors turned aggressive in the motorcycle segment. As regards scooters, the company plans to launch three new scooters (110cc Dash in 2QFY16, Dare 125cc some time later, and Zir - a 157cc scooter - in CY16), which coupled with the recent scooter capacity expansion from 60,000 units/month to 100,000 units/month could help the company regain market share lost in FY15. It should also be noted that HMSI (Honda Motorcycles and Scooters India) is running its plant at peak capacity and new capacity will be commissioned only by the end of FY16, which will be a positive for Hero MotoCorp. EBITDA margin likely to witness a 175bps margin expansion over FY16E/FY17E: Hero MotoCorp ended FY15 with EBITDA margin of 12.8% and 2HFY15 posting weak EBITDA margin of 12.2% versus average of 13.5% in 1HFY15. Gross margin improved sharply in 4QFY15 led by cost reduction initiatives, but higher advertisement spending because of sponsorship of various sporting events in 2HFY15 and higher research and development (R&D) costs impacted margins adversely. The company saved Rs3.3bn under its cost reduction LEAP project in FY15, which is likely to result in an additional ~Rs 4.7bn of savings by FY17E. It could also drive ~200bps-250bps EBITDA margin expansion in FY17E. We have factored in a 175bps EBITDA margin expansion in FY17E from the FY15 level. Valuation: We like Hero MotoCorp as the company could surprise positively on low expectations. Further, we believe the market share loss in motorcycle segment over FY10-FY14 bottomed out with the company gaining a 110bps market share in motorcycles in FY15. Margins could expand by 175bps in FY17E over FY15 and could surprise positively if demand picks up by the end of FY16. Successful launch of scooters and also penetration in key export markets of Nigeria and Latin America in FY16 remains the joker in the pack. On realistic low estimates, the stock currently trades at 13.9x FY17E earnings of Rs186. We have assigned Buy rating to the stock with a target price of Rs2,981, up 15% from the current market price
BUY
Sector: Automobile
CMP: Rs2,588
Target Price: Rs2,981
Upside: 15%
Gaurant Dadwal [email protected] +91-22-3926 8145
Key Data
Current Shares O/S (mn) 199.7
Mkt Cap (Rsbn/US$bn) 519.2/8.2
52 Wk H / L (Rs) 3,272/2,251
Daily Vol. (3M NSE Avg.) 840,328
Share holding (%) 2QFY15 3QFY15 4QFY15
Promoter 39.9 39.9 34.6
FII 34.3 39.3 40.8
DII 8.4 7.4 10.9
Others 17.3 13.3 13.7
One -Year Indexed Stock Performance
Price Performance (%)
1 M 6 M 1 Yr
Hero MoroCorp 10.5 (14.6) 10.7
Nifty Index 0.8 (1.1) 13.6
Source: Bloomberg
Y/E March (Rsmn) FY13 FY14 FY15 FY16E FY17E
Revenues 237,681 252,755 275,853 294,560 335,967
YoY (%) 0.8 6.3 9.1 6.8 14.1
EBITDA 32,845 35,401 35,414 39,531 49,000
EBITDA (%) 13.8 14.0 12.8 13.4 14.6
Adj. PAT 21,182 21,091 23,848 30,102 37,210
YoY (%) (10.9) (0.4) 13.1 26.2 23.6
FDEPS (Rs) 106.1 105.6 127.2 150.7 186.3
ROE (%) 45.6 39.8 41.8 41.5 42.2
ROCE (%) 39.0 44.1 49.5 49.6 50.8
P/E (x) 24.4 24.5 20.3 17.2 13.9
EV/EBITDA 14.9 13.6 13.9 12.3 9.8
EV/Sales 2.1 1.9 1.8 1.6 1.4
Source: Company, Nirmal Bang Institutional Equities Research
80
90
100
110
120
130
140
150
May-14 Jul-14 Sep-14 Nov-14 Jan-15 Mar-15 May-15
Hero MotoCorp NSE CNX NIFTY INDEX
26 May 2015

Institutional Equities
30 Hero MotoCorp
We assign Buy rating to HMCL with a target price of Rs2,981
We like Hero MotoCorp as the company could surprise positively on low expectations. Further, we believe the market share loss in the motorcycle segment over FY10-FY14 bottomed out with the company gaining a 110bps market share in motorcycles in FY15. Margins could expand by 175bps in FY17E over FY15 and could surprise positively if demand picks up by the end of FY16. Successful launch of scooters and also penetration in key export markets of Nigeria and Latin America in FY16 remains the joker in the pack. On realistic low estimates, the stock currently trades at 13.9x FY17E earnings of Rs186. We have assigned Buy rating to the stock with a target price of Rs2,981, up 15% from the current market price.
Exhibit 1: Hero MotoCorp’s relative performance to Nifty Exhibit 2: One-year forward P/E band
Source: Bloomberg, Nirmal Bang Institutional Equities Research Source: Bloomberg, Nirmal Bang Institutional Equities Research
Exhibit 3: Our earnings estimates for FY17 are 7% above consensus estimates
NBIE estimates Bloomberg estimates Deviation (%)
(Rsmn) FY16E FY17E FY16E FY17E FY16E FY17E
Net sales 294,560 335,967 299,590 338,780 (1.7) (0.8)
EBITDA 39,531 49,000 40,720 47,640 (2.9) 2.9
EBITDA margin (%) 13.4 14.6 13.59 14.06 (0.2) 0.5
PAT 30,102 37,210 30,000 34,870 0.3 6.7
EPS (Rs) 150.7 186.3 149.86 174.11 0.6 7.0
Source: Bloomberg, Nirmal Bang Institutional Equities Research
80
90
100
110
120
130
140
150
May-14 Jul-14 Sep-14 Nov-14 Jan-15 Mar-15 May-15
Hero MotoCorp NSE CNX NIFTY INDEX
-
500
1,000
1,500
2,000
2,500
3,000
3,500
Ma
y-0
5
No
v-0
5
Ma
y-0
6
No
v-0
6
Ma
y-0
7
No
v-0
7
Ma
y-0
8
No
v-0
8
Ma
y-0
9
No
v-0
9
Ma
y-1
0
No
v-1
0
Ma
y-1
1
No
v-1
1
Ma
y-1
2
No
v-1
2
Ma
y-1
3
No
v-1
3
Ma
y-1
4
No
v-1
4
Ma
y-1
5
(Rs)
Price 14 16 18 20
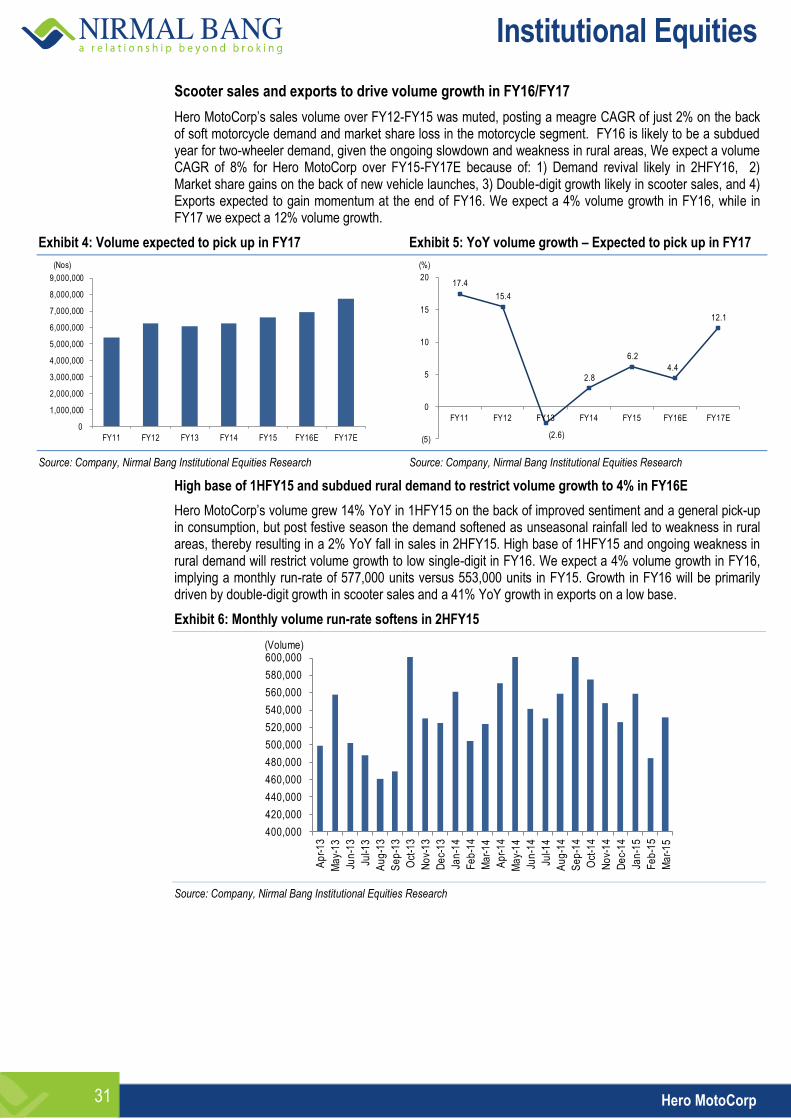
Institutional Equities
31 Hero MotoCorp
Scooter sales and exports to drive volume growth in FY16/FY17
Hero MotoCorp’s sales volume over FY12-FY15 was muted, posting a meagre CAGR of just 2% on the back of soft motorcycle demand and market share loss in the motorcycle segment. FY16 is likely to be a subdued year for two-wheeler demand, given the ongoing slowdown and weakness in rural areas, We expect a volume CAGR of 8% for Hero MotoCorp over FY15-FY17E because of: 1) Demand revival likely in 2HFY16, 2) Market share gains on the back of new vehicle launches, 3) Double-digit growth likely in scooter sales, and 4) Exports expected to gain momentum at the end of FY16. We expect a 4% volume growth in FY16, while in FY17 we expect a 12% volume growth.
Exhibit 4: Volume expected to pick up in FY17 Exhibit 5: YoY volume growth – Expected to pick up in FY17
Source: Company, Nirmal Bang Institutional Equities Research Source: Company, Nirmal Bang Institutional Equities Research
High base of 1HFY15 and subdued rural demand to restrict volume growth to 4% in FY16E
Hero MotoCorp’s volume grew 14% YoY in 1HFY15 on the back of improved sentiment and a general pick-up in consumption, but post festive season the demand softened as unseasonal rainfall led to weakness in rural areas, thereby resulting in a 2% YoY fall in sales in 2HFY15. High base of 1HFY15 and ongoing weakness in rural demand will restrict volume growth to low single-digit in FY16. We expect a 4% volume growth in FY16, implying a monthly run-rate of 577,000 units versus 553,000 units in FY15. Growth in FY16 will be primarily driven by double-digit growth in scooter sales and a 41% YoY growth in exports on a low base.
Exhibit 6: Monthly volume run-rate softens in 2HFY15
Source: Company, Nirmal Bang Institutional Equities Research
0
1,000,000
2,000,000
3,000,000
4,000,000
5,000,000
6,000,000
7,000,000
8,000,000
9,000,000
FY11 FY12 FY13 FY14 FY15 FY16E FY17E
(Nos)
17.4
15.4
(2.6)
2.8
6.2
4.4
12.1
(5)
0
5
10
15
20
FY11 FY12 FY13 FY14 FY15 FY16E FY17E
(%)
400,000
420,000
440,000
460,000
480,000
500,000
520,000
540,000
560,000
580,000
600,000
Ap
r-1
3
Ma
y-1
3
Jun
-13
Jul-1
3
Au
g-1
3
Se
p-1
3
Oct
-13
No
v-1
3
De
c-1
3
Jan
-14
Fe
b-1
4
Ma
r-1
4
Ap
r-1
4
Ma
y-1
4
Jun
-14
Jul-1
4
Au
g-1
4
Se
p-1
4
Oct
-14
No
v-1
4
De
c-1
4
Jan
-15
Fe
b-1
5
Ma
r-1
5
(Volume)

Institutional Equities
32 Hero MotoCorp
Exhibit 7: Monthly YoY volume growth falls sharply post festive season
Source: SIAM, Nirmal Bang Institutional Equities Research
Exhibit 8: Hero MotoCorp’s volume growth seen at 12% in FY17E
(Nos.) FY12 FY13 FY14 FY15 FY16E FY17E
Motorcycles 6,235,205 6,073,581 6,245,960 6,631,703 6,923,084 7,762,739
Scooters 5,779,621 5,499,245 5,538,356 5,799,695 5,957,480 6,591,088
Domestic sales 455,584 574,336 707,604 832,008 965,604 1,171,651
Motorcycle 6,042,902 5,912,538 6,115,197 6,431,686 6,641,048 7,339,684
Scooters 5,628,513 5,362,730 5,425,118 5,679,634 5,776,188 6,319,149
Export sales 414,389 549,808 690,079 752,052 864,860 1,020,535
Motorcycles 192,303 161,043 130,763 200,017 282,037 423,055
Scooters 151,108 136,515 113,238 120,061 181,292 271,938
Motorcycles 41,195 24,528 17,525 79,956 100,745 151,117
YoY growth (%)
Total sales 15.4 (2.6) 2.8 6.2 4.4 12.1
Motorcycles 14.7 (4.9) 0.7 4.7 2.7 10.6
Scooters 26.0 26.1 23.2 17.6 16.1 21.3
Domestic sales 14.7 (2.2) 3.4 5.2 3.3 10.5
Motorcycles 14.3 (4.7) 1.2 4.7 1.7 9.4
Scooters 20.8 32.7 25.5 9.0 15.0 18.0
Export sales 44.5 (16.3) (18.8) 53.0 41.0 50.0
Motorcycles 31.9 (9.7) (17.1) 6.0 51.0 50.0
Scooters 122.9 (40.5) (28.6) 356.2 26.0 50.0
Source: Company, Nirmal Bang Institutional Equities Research
Market share likely to witness improvement in FY16
Hero MotoCorp lost ~112bps market share in the domestic two-wheeler market in FY15 and bulk of the market share loss was in 2Q/3QFY15 with the company shedding market share in scooters (loss of market share in Pleasure model and also because of capacity constraints in scooters). In the motorcycle segment, the company ended FY15 with a market share gain of 110 bps. The gain in motorcycle market share in FY15 was after four years of losses and came at a time when competitors turned aggressive in the motorcycle segment On the scooter front, the company plans to launch three new scooters (110cc Dash in 2QFY16, Dare 125cc at some stage later and Zir - a 157cc scooter - in CY16), which coupled with the recent scooter capacity expansion from 60,000 units/month to 85,000 units/month will help the company regain market share lost in FY15. It should also be noted that HMSI is running at peak capacity and new capacity will be commissioned only by the end of FY16, which will be a positive for Hero MotoCorp.
(15)
(10)
(5)
0
5
10
15
20
25
30
Ap
r-1
3
Ma
y-1
3
Jun
-13
Jul-1
3
Au
g-1
3
Se
p-1
3
Oct
-13
No
v-1
3
De
c-1
3
Jan
-14
Fe
b-1
4
Ma
r-1
4
Ap
r-1
4
Ma
y-1
4
Jun
-14
Jul-1
4
Au
g-1
4
Se
p-1
4
Oct
-14
No
v-1
4
De
c-1
4
Jan
-15
Fe
b-1
5
Ma
r-1
5
(%)

Institutional Equities
33 Hero MotoCorp
Exhibit 9: Monthly two-wheeler market share - owing to capacity constraints in scooters in 1HFY15, the company lost market share
Exhibit 10: Scooter market share – following capacity constraints, market share dipped in 1HFY15
Source: SIAM, Nirmal Bang Institutional Equities Research Source: SIAM, Nirmal Bang Institutional Equities Research
Exhibit 11: Market share gains in motorcycles in FY15
Source: SIAM, Nirmal Bang Institutional Equities Research
HMSI running at peak capacity, Hero MotoCorp likely to be key beneficiary
Hero MotoCorp lost market share in scooters and also in motorcycles (in 150cc and above segments). Key beneficiaries of Hero MotoCorp’s market share loss in scooters were HMSI and TVS Motor Company, while in the premium segment the market share loss was witnessed by Yamaha and Royal Enfield. In the scooter space, HMSI is running its plant at peak capacity, gaining market share from Hero MotoCorp in scooters as well as motorcycles, but new capacity of HMSI is likely to be commissioned by end of FY16 i.e. when its new Gujarat plant is commissioned. On the other hand, Hero MotoCorp, at the current run-rate, has idle capacity in motorcycles and scooters. With Hero MotoCorp also increasing its scooter capacity in 3QFY15, the company is well placed to take advantage of HMSI’s capacity constraints in FY16.
35
37
39
41
43
45
47
Ap
r-1
3
Ma
y-1
3
Jun
-13
Jul-1
3
Au
g-1
3
Se
p-1
3
Oct
-13
No
v-1
3
De
c-1
3
Jan
-14
Fe
b-1
4
Ma
r-1
4
Ap
r-1
4
Ma
y-1
4
Jun
-14
Jul-1
4
Au
g-1
4
Se
p-1
4
Oct
-14
No
v-1
4
De
c-1
4
Jan
-15
Fe
b-1
5
Ma
r-1
5
(%)
10
12
14
16
18
20
22
Ap
r-1
3
Ma
y-1
3
Jun
-13
Jul-1
3
Au
g-1
3
Se
p-1
3
Oct
-13
No
v-1
3
De
c-1
3
Jan
-14
Fe
b-1
4
Ma
r-1
4
Ap
r-1
4
Ma
y-1
4
Jun
-14
Jul-1
4
Au
g-1
4
Se
p-1
4
Oct
-14
No
v-1
4
De
c-1
4
Jan
-15
Fe
b-1
5
Ma
r-1
5
(%)
40
42
44
46
48
50
52
54
56
58
60
Ap
r-1
3
Ma
y-1
3
Jun
-13
Jul-1
3
Au
g-1
3
Se
p-1
3
Oct
-13
No
v-1
3
De
c-1
3
Jan
-14
Fe
b-1
4
Ma
r-1
4
Ap
r-1
4
Ma
y-1
4
Jun
-14
Jul-1
4
Au
g-1
4
Se
p-1
4
Oct
-14
No
v-1
4
De
c-1
4
Jan
-15
Fe
b-1
5
Ma
r-1
5
(%)

Institutional Equities
34 Hero MotoCorp
Exhibit 12: Capacity utilisation level – HMSI touches peak capacity
Source: Crisil
Exhibit 13: Hero MotoCorp has a strong product pipeline for the next two years which will drive market share gains
Hero Dash Hero Dare Hero Zir Hero HX 25R
110cc scooter 125cc scooter 157cc scooter 249cc Motorcycle
Launch date: 2QFY16 Launch date: 2Q/3QFY16 Launch date: CY16 Launch date: 2Q/3QFY16
Source: Company, Nirmal Bang Institutional Equities Research
Exports expected to gain momentum in FY17
Hero MotoCorp’s competitors, Bajaj Auto and TVS Motor Company, have de-risked their domestic business model by expanding footprint globally, with exports accounting for 47% and 19% of their sales volume, respectively. In case of Hero MotoCorp, exports account for just 4% of sales volume because of restrictions laid down in the past by Honda, which has a global reach. After the break-up with Honda Motors, Hero MotoCorp has access to all markets globally, offering a good long-term growth opportunity for the company.
Hero MotoCorp is expanding global reach and is targeting sales of 1.2mn units (10% of volume ) by 2020 against 200,000 currently. To achieve this, the company plans to foray into 50 countries by 2018 against 25 countries currently. Exports currently account for just 4% of overall sales and we believe the same is likely to increase to 6% by the end of FY17E as the company is entering bigger markets such as Latin America , Africa and South East Asia. The company is setting up a assembly unit in Columbia, which will be commissioned by the end of 2QFY16, and will also cater to other Latin American countries. Further, with the likely foray into large two-wheeler markets by the end of FY16 - Nigeria ( market size of 1mn units per annum) and Argentina/Mexico (market size of 0.5mn units per annum), Hero MotoCorp could witness a sharp pick-up in export momentum by FY17. We expect export volume of 0.28mn/0.42mn units in FY16/FY17, respectively.
85
71
97
82
0
20
40
60
80
100
120
HeroMoto Corp Baja Auto HMSI TVS Motor Co
(%)

Institutional Equities
35 Hero MotoCorp
Exhibit 14: Exports to grow robustly on a low base
Source: Company, Nirmal Bang Institutional Equities Research
EBTIDA margin expected to improve 175bps by FY17 led by cost-cutting Initiatives
Hero MotoCorp ended FY15 with EBITDA margin of 12.8%, and 2HFY15 reporting weak EBITDA margin of 12.2% versus average 13.5% in 1HFY15. Gross margin improved sharply in 4QFY15 led by cost- reduction initiatives, but higher advertisement spending because of sponsorship of various sporting events in 2HFY15 and also higher R&D costs impacted margins adversely. Advertisement spending, as a percentage of sales, has been historically below 2% of net sales, but in FY15 the same increased to 2.4% and is expected to remain at an elevated level as the company is aiming at building its brand in overseas markets.
The company saved Rs 3.3bn through the cost reduction LEAP project in FY15, which is likely to lead to an additional ~Rs 4.7bn of savings by FY17E. If this is achieved, it could drive ~200bps-250bps EBITDA margin expansion in FY17E. We have factored in a 175bps EBITDA margin expansion in FY17E from the FY15 level.
Exhibit 15: EBITDA margin declines following a sharp increase in other expenditure
Exhibit 16: Sharp Increase in other expenditure
Source: Company, Nirmal Bang Institutional Equities Research Source: Company, Nirmal Bang Institutional Equities Research
0
50,000
100,000
150,000
200,000
250,000
300,000
350,000
400,000
450,000
FY11 FY12 FY13 FY14 FY15 FY16E FY17E
(Nos)
14.615.8 15.6 15.3 15.0
13.912.6
13.814.9 14.5
13.113.7 13.5 13.5
12.0 12.3
0
2
4
6
8
10
12
14
16
18
1Q
FY
12
2Q
FY
12
3Q
FY
12
4Q
FY
12
1Q
FY
13
2Q
FY
13
3Q
FY
13
4Q
FY
13
1Q
FY
14
2Q
FY
14
3Q
FY
14
4Q
FY
14
1Q
FY
15
2Q
FY
15
3Q
FY
15
4Q
FY
15
(%)
7.88.7 8.3 8.3 8.1
9.8 10.1 10.39.2
9.910.7 10.8
10.1 10.5
11.7
13.0
0
2
4
6
8
10
12
14
1Q
FY
12
2Q
FY
12
3Q
FY
12
4Q
FY
12
1Q
FY
13
2Q
FY
13
3Q
FY
13
4Q
FY
13
1Q
FY
14
2Q
FY
14
3Q
FY
14
4Q
FY
14
1Q
FY
15
2Q
FY
15
3Q
FY
15
4Q
FY
15
(%)

Institutional Equities
36 Hero MotoCorp
Exhibit 17: Gross margin improves sharply in 4QFY15
Source: Company, Nirmal Bang Institutional Equities Research
Increase in advertisement spending is a step in the right direction
Hero MotoCorp’s advertisement spending, as a percentage of sales, has traditionally been below 2% of sales , However, in FY15 the same increased to 2.45% and is likely to remain at a higher level for the next two-three years as the company is focusing on brand-building in export markets. We believe the increase in advertisement spending is a step in the right direction as domestic market penetration will increase over the next four-five years and will restrict volume growth. We believe that exports could be the next big trigger for the company as it plans to derive 10% of volume from exports by 2020. It should also be noted that increase in advertisement spending is likely to be offset by cost-cutting LEAP project, which is expected to add 150bps to margins of the company by FY17E. Although the company is targeting 15% EBITDA margin over the next two years, we expect a 14.6% EBITDA margin for FY17, leaving room for an increase in other expenses.
Exhibit 18: Advertisement expenses to increase in future
Source: Company, Nirmal Bang Institutional Equities Research
25.3
27.527.2
26.826.3
27.3
25.9
27.8 27.7
28.5
27.3
28.1
27.4
28.128.3
29.8
23
24
25
26
27
28
29
30
31
1Q
FY
12
2Q
FY
12
3Q
FY
12
4Q
FY
12
1Q
FY
13
2Q
FY
13
3Q
FY
13
4Q
FY
13
1Q
FY
14
2Q
FY
14
3Q
FY
14
4Q
FY
14
1Q
FY
15
2Q
FY
15
3Q
FY
15
4Q
FY
15
(%)
-
0.5
1.0
1.5
2.0
2.5
3.0
FY11 FY12 FY13 FY14 FY15 FY16E FY17E
(%)

Institutional Equities
37 Hero MotoCorp
Financials
Earnings growth of 47% likely over FY15-FY17E
We expect a 47% growth in FY17 earnings over FY15 as the company is likely to post a 8% volume CAGR over FY15-FY17E and a 175bps EBITDA margin expansion in FY17E over FY15. We believe our earnings estimates have upside risk as volume recovery is likely in FY17 and market share gains in scooters could be above our estimate.
Exhibit 19: Net sales projection Exhibit 20: PAT projection
Source: Company, Nirmal Bang Institutional Equities Research Source: Company, Nirmal Bang Institutional Equities Research
Valuation
We like Hero MotoCorp as the company could surprise positively on low expectations. Further, we believe the market share loss in the motorcycle segment over FY10-FY14 bottomed out with the company gaining a 110bps market share in motorcycles in FY15. Margins could expand by 175bps in FY17E over FY15 and could surprise positively if demand picks up by the end of FY16. Successful launch of scooters and also penetration in key export markets of Nigeria and Latin America in FY16 remains the joker in the pack. On realistic low estimates, the stock currently trades at 13.9x FY17E earnings of Rs186. We have assigned Buy rating to the stock with a target price of Rs2,981, up 15% from the current market price.
0
50,000
100,000
150,000
200,000
250,000
300,000
350,000
FY11 FY12 FY13 FY14 FY15 FY16E FY17E
(Rsmn)
-
5,000
10,000
15,000
20,000
25,000
30,000
35,000
40,000
FY11 FY12 FY13 FY14 FY15 FY16E FY17E
(Rsmn)

Institutional Equities
38 Hero MotoCorp
Financials (standalone)
Exhibit 21: Income statement
Y/E March (Rsmn) FY13 FY14 FY15 FY16E FY17E
Net sales 237,681 252,755 275,853 294,560 335,967
% growth 0.8 6.3 9.1 6.8 14.1
Raw material costs 173,977 182,299 197,539 207,694 233,732
Staff costs 8,209 9,300 11,729 12,639 13,641
Other expenses 22,651 25,755 31,171 34,695 39,595
Total expenditure 204,836 217,354 240,439 255,028 286,967
EBITDA 32,845 35,401 35,414 39,531 49,000
% growth (9.2) 7.8 0.0 11.6 24.0
EBITDA margin (%) 13.8 14.0 12.8 13.4 14.6
Other income 3,984 4,464 4,927 5,371 6,160
Interest costs 119 118 111 111 111
Gross profit 63,705 70,456 78,314 86,866 102,235
% growth 1.2 10.6 11.2 10.9 17.7
Depreciation 11,418 11,074 5,400 3,573 4,190
Profit before tax 25,292 28,673 34,831 41,218 50,859
% growth (11.7) 13.4 21.5 18.3 23.4
Tax 4,110 7,582 9,432 11,116 13,649
Effective tax rate (%) 16.3 26.4 27.1 27.0 26.8
Net profit 21,182 21,091 25,399 30,102 37,210
% growth (10.9) (0.4) 20.4 18.5 23.6
Extraordinary item - - (1,550) - -
Reported net profit 21,182 21,091 23,848 30,102 37,210
% growth (10.9) (0.4) 13.1 26.2 23.6
EPS (Rs) 106.1 105.6 127.2 150.7 186.3
% growth (10.9) (0.4) 20.4 18.5 23.6
DPS (Rs) 60.0 65.0 60.0 70.0 85.0
Payout (%) 57 62 47 46 46
Source: Company, Nirmal Bang Institutional Equities Research
Exhibit 23: Balance sheet
Y/E March (Rsmn) FY13 FY14 FY15 FY16E FY17E
Equity 399 399 399 399 399
Reserves 49,663 55,599 65,014 79,150 96,483
Net worth 50,063 55,999 65,413 79,549 96,882
Net deferred tax liabilities 4,346 (815) (422) (735) (735)
LT liabilities/provisions 302 500 656 656 656
Liabilities 54,710 55,683 65,647 79,470 96,803
Gross block 66,851 69,089 79,768 93,768 109,268
Depreciation 36,141 46,657 52,057 55,630 59,820
Net block 30,710 22,433 27,711 38,138 49,448
Capital work-in-progress 621 8,541 8,541 8,541 8,541
Long-term Investments 6,145 8,129 8,638 8,638 8,638
Other long-term assets 8,165 5,252 6,770 6,770 6,770
Inventories 6,368 6,696 8,155 7,988 9,110
Debtors 6,650 9,206 13,896 14,378 16,398
Cash 1,810 1,175 1,592 5,408 5,729
Liquid Investments 30,094 32,759 22,903 25,903 32,903
Other current assets 5,855 5,723 6,275 6,973 7,952
Total current assets 50,776 55,559 52,821 60,651 72,093
Creditors 27,610 28,787 31,494 35,089 39,483
Other current liabilities/provisions 14,097 15,443 7,341 8,179 9,203
Total current liabilities 41,707 44,230 38,834 43,268 48,686
Net current assets 9,069 11,329 13,987 17,383 23,406
Total assets 54,710 55,683 65,647 79,470 96,803
Source: Company, Nirmal Bang Institutional Equities Research
Exhibit 22: Cash flow
Y/E March (Rsmn) FY13 FY14 FY15 FY16E FY17E
EBIT 25,411 28,791 34,942 41,329 50,970
(Inc.)/dec. in working capital (7,872) 545 (12,097) 3,823 1,297
Cash flow from operations 17,539 29,336 22,845 45,152 52,268
Other income 3,987 4,446 4,927 5,371 6,160
Other expenses 69 165 1,550 - -
Depreciation 11,418 11,074 5,400 3,573 4,190
Tax paid 6,133 6,495 9,432 11,116 13,649
Net cash from operations 18,904 29,634 15,436 32,238 36,648
Capital expenditure (6,004) (9,328) (12,229) (14,000) (15,500)
Net cash after capex 12,900 20,307 3,207 18,238 21,148
Other investment activities (1,326) (6,866) 11,196 2,058 (840)
Cash from financial activities (10,533) (14,076) (13,985) (16,480) (19,988)
Opening cash balance 768 1,810 1,175 1,592 5,408
Closing cash balance 1,810 1,175 1,592 5,408 5,729
Change in cash balance 1,042 (635) 417 3,816 320
Source: Company, Nirmal Bang Institutional Equities Research
Exhibit 24:Key ratios
Y/E March FY13 FY14 FY15 FY16E FY17E
Profitability & return ratios
EBITDA margin (%) 13.8 14.0 12.8 13.4 14.6
EBIT margin (%) 9.0 9.6 10.9 12.2 13.3
Net profit margin (%) 8.9 8.3 9.2 10.2 11.1
RoE (%) 45.6 39.8 41.8 41.5 42.2
RoCE (%) 39.0 44.1 49.5 49.6 50.8
Working capital & liquidity ratios
Receivables (days) 10 14 19 18 18
Inventory (days) 10 10 11 10 10
Payables (days) 50 50 50 50 50
Current ratio (x) 1.2 1.3 1.4 1.4 1.5
Quick ratio (x) 1.1 1.1 1.2 1.2 1.3
Valuation ratios
EV/sales (x) 2.1 1.9 1.8 1.6 1.4
EV/EBITDA (x) 14.9 13.6 13.9 12.3 9.8
P/E (x) 24.4 24.5 20.3 17.2 13.9
P/BV (x) 10.3 9.2 7.9 6.5 5.3
Source: Company, Nirmal Bang Institutional Equities Research

Please refer to the disclaimer towards the end of the document.
Institutional Equities
Reuters: TVSM.BO; Bloomberg: TVSL IN
TVS Motor Company
Re-
initi
atin
g C
over
age
Unlikely To Deliver On High Expectations TVS Motor Company’s (TVS Motor) sharp 86% run-up in its stock price in the past one year has been on the back of a 133bps market share gain across the two-wheeler segment. The stock currently trades at a premium multiple to its historical average and its peers, factoring in further gains in market share and also margin expansion over the next two years. We, however, are cautious despite the high optimism in respect of TVS Motor’s market share gains, likely success of Victor motorcycle slated for launch in FY16 and EBITDA margin improvement because intense competition will cap market share gains as well as margin expansion. Our earnings estimates for FY16/FY17 are 7%/16% below Bloomberg consensus estimates, respectively. We have re-initiated coverage on TVS Motor with a Sell rating and a target price of Rs193 based on 15xFY17E earnings. Volume growth likely to decelerate in FY16: TVS Motor’s performance in FY15 (more than 22% volume growth) was exceptional, with the company outperforming industry growth and also peers on the back of successful new vehicle launches. However, in FY16, we believe its volume growth will decelerate to low double-digit (10%). TVS Motor did exceptionally well on the back of new launches of Star city model in motorcycles and in scooters (Jupiter and Wego) leading to market share gains. However, its scooter sales in the past few months have moderated, with its monthly run-rate falling to 52,000 units versus a peak of 68,000 units. We estimate volume growth to decelerate to 10%/14% in FY16/17 respectively, from 22% in FY15. Victor’s success will not be easy: TVS Motor has limited presence in the executive motorcycle segment and plans to launch Victor model in the segment. The street is optimistic about Victor’s success, while we believe it will be difficult for Victor to achieve runaway success, given Hero MotoCorp’s stronghold in this segment. It has to be noted that Hero MotoCorp has gained market share in this segment and continues to dominate it with a 70% market share, despite aggressive new launches from competitors. Hero MotoCorp’s products in this segment i.e. Splendor and Passion, command strong brand recall and have proven their worth amid Discover series and Dream series motorcycles from Bajaj Auto and HMSI, respectively. It should also be also noted that TVS Motor, in the past, had failed to create a mark in motorcycles with its brands like Flame, Jive and Phoenix failing after the initial euphoria. Don’t expect significant margin expansion: TVS Motor is targeting more than 10% EBITDA margin over the next three years. For FY15, it reported flattish EBITDA margin and that too in a year when volume grew robustly by 22% on the back of a richer product mix. FY15 was also the highest growth period for the company after FY11 with all-time high volume. Improvement in margins in FY15 was because of lower other expenses with volume growing robustly. The street is factoring in 7.3%/ 8.3% EBITDA margin in FY16E/FY17E, respectively, and we believe it will be difficult for TVS Motor to meet street expectations as the company’s priority currently is to gain market share. We expect just a 100bps improvement in EBITDA margin in FY16 to 7% as two new vehicle launches from the company expected in FY16 and increasing competitive intensity will result in higher branding and advertisement expenses, thereby restricting significant margin expansion in FY16. For FY17, we expect a 7.6% EBITDA margin , lower than the street estimate of 8.3% Valuation: After a solid FY15, full of successful new vehicle launches and a robust 22% volume growth, we have factored in 10%/14% volume growth for FY16E/FY17E, respectively, and margin expansion of 100bps/60bps to 7.1%/7.6%, respectively, for the same period. The stock trades expensively at 23x/18x FY16E/FY17E earnings, i.e. at a premium to its historical average and compared to peers like Hero MotoCorp and Bajaj Auto. We have valued TVS Motor at 15x FY17E earnings, at a discount to Bajaj Auto and Hero MotoCorp’s multiple of 16x and assigned Sell rating to the stock with a target price of Rs193, down 16% from the current market price. We believe a re-rating is possible only after the company starts reporting better-than-expected EBITDA margin, which we believe is unlikely in the near term despite strong volume growth expectations.
SELL
Sector: Automobile
CMP: Rs230
Target Price: Rs 193
Downside: 16%
Gaurant Dadwal [email protected] +91-22-3926 8145
Key Data
Current Shares O/S (mn) 475.1
Mkt Cap (Rsbn/US$bn) 109.2/1.7
52 Wk H / L (Rs) 322/113
Daily Vol. (3M NSE Avg.) 2,840,506
Shareholding (%) 2QFY15 3QFY15 4QFY15
Promoter 57.4 57.4 57.4
FII 11.6 13.1 14.2
DII 11.8 12.1 12.1
Others 19.1 17.4 16.3
One Year Indexed Stock Performance
50
70
90
110
130
150
170
190
210
230
250
270
May-14 Jul-14 Sep-14 Nov-14 Jan-15 Mar-15 May-15
TVS Motor Company NSE CNX NIFTY INDEX
Price Performance (%)
1 M 6 M 1 Yr
TVS Motor Co. (1.0) 3.7 86.1
Nifty Index 0.8 (1.1) 13.6
Source: Bloomberg
Y/E March (Rsmn) FY13 FY14 FY15 FY16E FY17E
Revenues 71,724 79,651 100,982 114,867 134,071 YoY (%) 0.4 11.1 26.8 13.7 16.7 EBITDA 4,000 4,717 6,043 8,075 10,229 EBITDA (%) 5.6 5.9 6.0 7.0 7.6 Adj. PAT 1,070 2,552 3,479 4,849 6,113 YoY (%) (57.1) 28.4 36.3 39.4 26.1 FDEPS (Rs) 4.2 5.3 7.3 10.2 12.9 ROE (%) 16.5 19.2 22.7 26.7 27.7 ROCE (%) 14.7 17.5 20.5 25.8 29.3 P/E (x) 55.2 43.0 31.4 22.5 17.9 EV/EBITDA 28.6 24.0 19.6 14.6 11.3 EV/Sales 1.6 1.4 1.2 1.0 0.9
Source: Company, Nirmal Bang Institutional Equities Research
26 May 2015

Institutional Equities
TVS Motor Company 40
Valuation: TVS Motor has been one of the best performing stocks in last one year with a 84% outperformance against benchmark Nifty. After a solid FY15, full of successful new vehicle launches and a robust 22% volume growth, we have factored in 10%/14% volume growth for FY16E/FY17E, respectively, and margin expansion of 100bps/60bps to 7.1%/7.6%, respectively, for the same period. The stock trades expensively at 23x/18x FY16E/FY17E earnings, i.e. at a premium to its historical average and compared to peers like Hero MotoCorp and Bajaj Auto. We have valued TVS Motor at 15x FY17E earnings, at a discount to Bajaj Auto and Hero MotoCorp’s multiple of 16x and assigned Sell rating to the stock with a target price of Rs193, down 16% from the current market price. We believe a re-rating is possible only after the company starts reporting better-than-expected EBITDA margin, which we believe is unlikely in the near term despite strong volume growth expectations.
Exhibit 1: TVS Motor Company relative performance to Nifty Exhibit 2: One-year forward P/E band
5070
90
110
130150
170
190
210230
250
270
May-14 Jul-14 Sep-14 Nov-14 Jan-15 Mar-15 May-15
TVS Motor Company’s NSE CNX NIFTY INDEX (100)
(50)
0
50
100
150
200
250
300
350
Ma
y-0
5
No
v-0
5
Ma
y-0
6
No
v-0
6
Ma
y-0
7
No
v-0
7
Ma
y-0
8
No
v-0
8
Ma
y-0
9
No
v-0
9
Ma
y-1
0
No
v-1
0
Ma
y-1
1
No
v-1
1
Ma
y-1
2
No
v-1
2
Ma
y-1
3
No
v-1
3
Ma
y-1
4
No
v-1
4
Ma
y-1
5
(Rs)
Price 15 20 25 30 Source: Bloomberg, Nirmal Bang Institutional Equities Research Source: Bloomberg, Nirmal Bang Institutional Equities Research
Exhibit 3: Our earnings estimates are significantly below consensus estimates
NBIE estimates Bloomberg estimates Deviation (%)
(Rsmn) FY16E FY17E FY16E FY17E FY16E FY17E
Net sales 114,867 134,071 120,860 143,380 (5.0) (6.5)
EBITDA 8,075 10,229 8,780 11,730 (8.0) (12.8)
EBITDA margin (%) 7.0 7.6 7.26 8.18 (0.2) (0.6)
PAT 4,849 6,113 5,220 7,350 (7.1) (16.8)
EPS (Rs) 10.2 12.9 10.97 15.4 (7.0) (16.4)
Source: Bloomberg, Nirmal Bang Institutional Equities Research

Institutional Equities
TVS Motor Company 41
Volume growth likely to decelerate in FY16
TVS Motor’s performance in FY15 (more than 22% volume growth) was exceptional, with the company outperforming industry growth and also peers on the back of successful new vehicle launches. However, in FY16, we believe its volume growth will decelerate to low double-digit (10%). TVS Motor did exceptionally well on the back of new launches of Star city model in motorcycles and in scooters (Jupiter and Wego) leading to market share gains. However, its scooter sales in the past few months have moderated, with its monthly run-rate falling to 52,000 units versus a peak of 68,000 units. We estimate volume growth to decelerate to 10%/14% in FY16/17 respectively, from 22% in FY15
Exhibit 4: Yearly volume growth Exhibit 5: Growth chart showing deceleration in sales
0
500,000
1,000,000
1,500,000
2,000,000
2,500,000
3,000,000
3,500,000
FY11 FY12 FY13 FY14 FY15 FY16E FY17E
(Nos)
32.2
8.1
(7.5)
2.4
22.2
10.1
14.3
(10)
(5)
0
5
10
15
20
25
30
35
FY11 FY12 FY13 FY14 FY15 FY16E FY17E
(%)
Source: Company, Nirmal Bang Institutional Equities Research Source: Company, Nirmal Bang Institutional Equities Research
Exhibit 6: Volume estimates
(Nos.) FY12 FY13 FY14 FY15 FY16E FY17E
Total - Two-wheelers 2,156,379 1,983,050 1,999,319 2,432,857 2,664,922 3,033,590
Motorcycle 841,346 749,429 793,479 960,559 1,065,471 1,235,798
Scooters 529,091 441,552 475,668 707,026 778,851 899,553
Mopeds 785,942 792,069 730,172 765,272 820,599 898,239
Domestic 1,895,480 1,771,391 1,752,627 2,107,696 2,272,434 2,522,134
Motorcycle 621,722 558,447 572,732 667,624 711,020 775,011
Scooters 496,892 424,183 456,975 684,569 753,026 865,980
Mopeds 776,866 788,761 722,920 755,503 808,388 881,143
Exports 260,899 211,659 246,692 325,161 392,488 511,456
Motorcycle 219,624 190,982 220,747 292,935 354,451 460,787
Scooters 32,199 17,369 18,693 22,457 25,826 33,573
Mopeds 9,076 3,308 7,252 9,769 12,211 17,096
Total- Three-wheelers 39,768 49,190 80,842 108,379 134,241 165,724
Domestic 14,201 15,616 12,515 17,606 20,775 23,891
Exports 25,567 33,574 68,327 90,773 113,466 141,833
Total volume 2,196,147 2,032,240 2,080,161 2,541,236 2,799,163 3,199,314
YoY (%) 8.1 (7.5) 2.4 22.2 10.1 14.3
Source: Company, Nirmal Bang Institutional Equities Research
Market share declines
TVS Motor gained a 155bps market share in FY15 in the scooter segment, largely from Hero MotoCorp as its new launches - Jupiter and Wego - achieved good success, which coupled with a low base of FY14 resulted in a strong 47% YoY growth in scooter sales in FY15. However, in the past few months, TVS Motor’s scooter sales decelerated and it lost market share in 2HFY15 compared to 1 HFY15 to competitors, largely to Hero MotoCorp. TVS Motor lost a 80bps market share in 2HFY15 after Hero MotoCorp ramped up its capacity and production. It should be noted that although Jupiter’s monthly volume has been on the rise, Wego’s sales have been decelerating. We expect a low double-digit growth in scooters in FY16 and believe there will be little positive surprise above our numbers as there are: 1) No new scooter launches slated in FY16, and 2) Scooter industry growth is likely to moderate in FY16 after a robust 21% CAGR over FY11-FY15.

Institutional Equities
TVS Motor Company 42
Exhibit 7: Motorcycle market share gains in FY15 Exhibit 8: TVS Motor gained market share in scooters also in FY15
7.0
6.2
5.5 5.5
6.2
4
5
6
7
8
FY11 FY12 FY13 FY14 FY15
(%)
21.9
19.4
14.5
12.7
15.2
0
5
10
15
20
25
FY11 FY12 FY13 FY14 FY15
(%)
Source: SIAM, Nirmal Bang Institutional Equities Research Source: SIAM, Nirmal Bang Institutional Equities Research
Exhibit 9: Monthly market share in scooters under pressure with Wego sales decelerating
6
8
10
12
14
16
18
20
Ap
r-1
3
Ma
y-1
3
Jun
-13
Jul-1
3
Au
g-1
3
Se
p-1
3
Oct
-13
No
v-1
3
De
c-1
3
Jan
-14
Fe
b-1
4
Ma
r-1
4
Ap
r-1
4
Ma
y-1
4
Jun
-14
Jul-1
4
Au
g-1
4
Se
p-1
4
Oct
-14
No
v-1
4
De
c-1
4
Jan
-15
Fe
b-1
5
Ma
r-1
5
(%)
Source: SIAM, Nirmal Bang Institutional Equities Research
Exhibit 10: Wego’s market share has been falling constantly Exhibit 11: Jupiter’s market share continues to grow
0
1
2
3
4
5
6
7
8
9
10
Ap
r-1
2
Ma
y-1
2
Jul-1
2
Se
p-1
2
No
v-1
2
Jan
-13
Ma
r-1
3
Ap
r-1
3
Jun
-13
Au
g-1
3
Oct
-13
De
c-1
3
Fe
b-1
4
Ma
r-1
4
Ma
y-1
4
Jul-1
4
Se
p-1
4
No
v-1
4
Jan
-15
Ma
r-1
5
(%)
0
1
2
3
4
5
6
7
8
9
10
No
v-1
3
De
c-1
3
Jan
-14
Fe
b-1
4
Ma
r-1
4
Ap
r-1
4
Ma
y-1
4
Jun
-14
Jul-1
4
Au
g-1
4
Se
p-1
4
Oct
-14
No
v-1
4
De
c-1
4
Jan
-15
Fe
b-1
5
Ma
r-1
5
(%)
Source: SIAM, Nirmal Bang Institutional Equities Research Source: SIAM, Nirmal Bang Institutional Equities Research
Market share plans are aggressive
TVS Motor plans to gain a 150bps market share in FY16 on the back of sustained success in existing products and the launch of Victor motorcycle in FY16. We believe its 150bps market share gain target for FY16 is very aggressive as competitive intensity is on the rise and most of the players are investing in brand-building and new vehicle launches. After two vehicle launches in FY15, TVS Motor has only one new model slated for launch, and that too in the motorcycle segment in FY16, which alone in our view will not be able to gain a 150bps market share. Victor model’s success will be key to TVS Motor’s ambitious market share gain plan for FY16.

Institutional Equities
TVS Motor Company 43
Exhibit 12: Recently launched Sport losing market share Exhibit 13: Star City continues to do well
0
2
4
6
8
10
12
14
16
Jul-1
4
Au
g-1
4
Se
p-1
4
Oct
-14
No
v-1
4
De
c-1
4
Jan
-15
Fe
b-1
5
Ma
r-1
5
(%)
0
5
10
15
20
25
No
v-1
2
Jan
-13
Ma
r-1
3
Ma
y-1
3
Jul-1
3
Se
p-1
3
No
v-1
3
Jan
-14
Ma
r-1
4
Ma
y-1
4
Jul-1
4
Se
p-1
4
No
v-1
4
Jan
-15
Ma
r-1
5
(%)
Source: SIAM, Nirmal Bang Institutional Equities Research Source: SIAM, Nirmal Bang Institutional Equities Research
Exhibit 14 : Phoenix launch has been unsuccessful Exhibit 15: Apache does better because of the premium
segment doing well
0.0
0.5
1.0
1.5
2.0
2.5
No
v-1
2
Jan
-13
Ma
r-1
3
Ma
y-1
3
Jul-1
3
Se
p-1
3
No
v-1
3
Jan
-14
Ma
r-1
4
Ma
y-1
4
Jul-1
4
Se
p-1
4
No
v-1
4
Jan
-15
Ma
r-1
5
(%)
0
2
4
6
8
10
12
14
16
No
v-1
2
Jan
-13
Ma
r-1
3
Ma
y-1
3
Jul-1
3
Se
p-1
3
No
v-1
3
Jan
-14
Ma
r-1
4
Ma
y-1
4
Jul-1
4
Se
p-1
4
No
v-1
4
Jan
-15
Ma
r-1
5
(%)
Source: SIAM, Nirmal Bang Institutional Equities Research Source: SIAM, Nirmal Bang Institutional Equities Research
Victor’s success in the highly competitive executive segment will not be easy
TVS Motor’s market share in the domestic motorcycle segment is just 6% as despite repetitive attempts, the company has been unsuccessful in making its presence felt in the executive segment (125cc -150cc) , which accounts for 60% of the domestic motorcycle industry. Various models like Flame, Jive and Phoenix have not been able to compete with stronger brands of competitors and it plans to fill this gap by launching Victor motorcycle in the executive segment.
It should be noted that TVS Motor’s Phoenix motorcycle in the executive segment was launched in November 2012 and has not been able to gain significant market share, but on the contrary has weakened considerably in the past few months. Although the street is optimistic about Victor’s success, we feel it will not be a easy ride for Victor to runaway success, given Hero MotoCorp’s stronghold in this segment. It has to be noted that Hero MotoCorp gained market share in this segment and continues to dominate it with a 70% market share, despite aggressive new launches by HMSI and Bajaj Auto in the past. Hero MotoCorp’s products in this segment i.e. Splendor and Passion motorcycles command a strong brand recall and have proven their worth amid Discover series and Dream series motorcycles from Bajaj Auto and HMSI, respectively. It should also be noted that TVS Motor, in the past, had failed to create a mark in the motorcycle segment with its brands like Flame, Jive and Phoenix failing after the initial euphoria.
New launches and high base to require higher marketing expenditure
Given the rising competitive intensity in two-wheelers, where most of the players with a bigger market share and better pricing power have witnessed margin compression following increased advertisement expenditure, we believe TVS Motor will also have to invest more in branding to support its volume. After a robust 22% volume growth and a 150bps market share gain, the company is now targeting another 150bps market share gain in FY16E. We believe that TVS Motor is going through a brand-building exercise and to develop new brands it will have to go for higher advertisement and branding expenditure over the next two years. We have factored in a 10% volume growth in FY16E, which won’t come easily without marketing support as new products from competitors will exert pressure on existing products. We believe that other expenditure will remain elevated in FY16.

Institutional Equities
TVS Motor Company 44
Exhibit 16: Other expenses constantly on the rise as competition is intense and new launches in FY16 require heavy marketing expenditure
12.9
14.0
15.6 15.515.0
15.3
16.3
18.3
16.9 17.0 17.016.3
15.515.115.1
18.3
9
10
11
12
13
14
15
16
17
18
19
1Q
FY
12
2Q
FY
12
3Q
FY
12
4Q
FY
12
1Q
FY
13
2Q
FY
13
3Q
FY
13
4Q
FY
13
1Q
FY
14
2Q
FY
14
3Q
FY
14
4Q
FY
14
1Q
FY
15
2Q
FY
15
3Q
FY
15
4Q
FY
15
(%)
Source: Company, Nirmal Bang Institutional Equities Research
Focus on market share and new product launches will restrict margin expansion
TVS Motor is targeting more than 10% EBITDA margin over the next three years. In FY15, it reported flattish EBITDA margin, despite a robust 22% YoY growth in volume and a richer product mix comprising higher share of three-wheelers. FY15 was also the highest growth period for TVS Motor, after FY11, with all-time high volume, but despite this the margins failed to register improvement, indicating high competitive intensity and the management’s focus on building brands. We believe that defending market share gains of FY15 and branding costs for launch of Victor motorcycle will cap market share gains in FY16/FY17. The street is expecting volume growth in FY16/FY17 to drive margin expansion, while we believe that significant EBITDA margin expansion will come only after the company develops strong brands. We expect just a 160bps improvement in EBITDA margin over FY16E/FY17E versus street estimate of a 230bps improvement over the same period. The street is factoring in 7.3% and 8.3% EBITDA margins for FY16E/FY17E, respectively, and we believe it will be difficult for TVS Motor to meet street expectations.
Exhibit 17: EBITDA margin remains flat despite strong volume growth in FY15
Exhibit 18: EBITDA margin
6.76.9
7.2
6.0 6.36.0 5.9
5.45.6
5.9 6.0
6.9
5.76.1 6.0 6.1
4
5
6
7
8
9
1Q
FY
12
2Q
FY
12
3Q
FY
12
4Q
FY
12
1Q
FY
13
2Q
FY
13
3Q
FY
13
4Q
FY
13
1Q
FY
14
2Q
FY
14
3Q
FY
14
4Q
FY
14
1Q
FY
15
2Q
FY
15
3Q
FY
15
4Q
FY
15
(%)
6.2 6.6
5.6 5.9 6.0
7.0
7.6
4.0
4.5
5.0
5.5
6.0
6.5
7.0
7.5
8.0
8.5
9.0
FY11 FY12 FY13 FY14 FY15 FY16E FY17E
(%)
Source: Company, Nirmal Bang Institutional Equities Research Source: Company, Nirmal Bang Institutional Equities Research

Institutional Equities
TVS Motor Company 45
Exhibit 19: Gross margin improved significantly in 4QFY15
24.8
25.6
28.027.4
26.9
27.728.0
29.0
28.1 27.928.2
27.7
25.925.6
25.8
28.5
22
23
24
25
26
27
28
29
30
1Q
FY
12
2Q
FY
12
3Q
FY
12
4Q
FY
12
1Q
FY
13
2Q
FY
13
3Q
FY
13
4Q
FY
13
1Q
FY
14
2Q
FY
14
3Q
FY
14
4Q
FY
14
1Q
FY
15
2Q
FY
15
3Q
FY
15
4Q
FY
15
(%)
Source: Company, Nirmal Bang Institutional Equities Research
Exports likely to grow robustly
TVS Motor’s exports grew robustly by 29% and 32% YoY in FY14/FY15, respectively, on the back of strong growth in motorcycle and three-wheeler exports. Over FY11-FY15, exports posted a CAGR of 14%, of which three-wheeler exports registered a CAGR of 51% over the same period. Three-wheeler exports offer strong growth visibility in ASEAN and Middle East markets, where Bajaj Auto has a strong presence. We believe the company will continue to report strong robust growth in exports and we expect a 20% volume growth each in FY16/FY17. However, our export estimate for FY16 is below the company’s estimate of 30% growth.
Exhibit 20: Exports register strong double-digit growth YoY
0
100,000
200,000
300,000
400,000
500,000
600,000
FY11 FY12 FY13 FY14 FY15 FY16E FY17E
(Nos)
Source: Company, Nirmal Bang Institutional Equities Research
Exhibit 21: Two-wheeler exports Exhibit 22: Three-wheeler exports offer more room to grow
0
50,000
100,000
150,000
200,000
250,000
300,000
350,000
400,000
450,000
FY11 FY12 FY13 FY14 FY15 FY16E FY17E
(Nos.)
0
20,000
40,000
60,000
80,000
100,000
120,000
140,000
160,000
FY11 FY12 FY13 FY14 FY15 FY16E FY17E
(Nos.)
Source: Company, Nirmal Bang Institutional Equities Research Source: Company, Nirmal Bang Institutional Equities Research

Institutional Equities
TVS Motor Company 46
Our estimates don’t factor revenues from BMW joint venture because of lack of clarity
In FY14, TVS Motor announced a long-term co-operation pact with BMW Motorrad as a result of which the company will jointly produce and develop new premium motorcycles in the 200cc-500cc segment. TVS Motor will invest euro20mn in this joint venture (JV), with the first product likely to be launched in FY16. However, there is limited clarity on the launch timeline and product offerings and, therefore, we have not factored in revenue from this JV in our estimates.
Financials
We expect a top-line CAGR of 15% over FY15-FY17E for TVS Motor on the back of a 12% volume growth during the same period. We have also factored in a 160bps margin expansion in FY17E over FY15, largely led by better gross margin and better operating leverage in FY16E/FY17E. On the earnings front, we expect earnings CAGR of 33% over FY17E-FY18E.
Exhibit 23: Earnings Exhibit 24: Net sales
-
1,000
2,000
3,000
4,000
5,000
6,000
7,000
FY11 FY12 FY13 FY14 FY15 FY16E FY17E
(Rsmn)
0
20,000
40,000
60,000
80,000
100,000
120,000
140,000
FY11 FY12 FY13 FY14 FY15 FY16E FY17E
(Rsmn)
Source: Company, Nirmal Bang Institutional Equities Research Source: Company, Nirmal Bang Institutional Equities Research
Exhibit 25: EBITDA
0
2,000
4,000
6,000
8,000
10,000
12,000
FY11 FY12 FY13 FY14 FY15 FY16E FY17E
(Rsmn)
Source: Company, Nirmal Bang Institutional Equities Research
Valuation
TVS Motor has been one of the best performing stocks in last one year with a 84% outperformance against benchmark Nifty. After a solid FY15, full of successful new vehicle launches and a robust 22% volume growth, we have factored in 10%/14% volume growth for FY16E/FY17E, respectively, and margin expansion of 100bps/60bps to 7.1%/7.6%, respectively, for the same period. The stock trades expensively at 23x/18x FY16E/FY17E earnings, i.e. at a premium to its historical average and compared to peers like Hero MotoCorp and Bajaj Auto. We have valued TVS Motor at 15x FY17E earnings, at a discount to Bajaj Auto and Hero MotoCorp’s multiple of 16x and assigned Sell rating to the stock with a target price of Rs193, down 16% from the current market price. We believe a re-rating is possible only after the company starts reporting better-than-expected EBITDA margin, which we believe is unlikely in the near term despite strong volume growth expectations.

Institutional Equities
TVS Motor Company 47
Financials
Exhibit 26: Income statement
Y/E March (Rsmn) FY13 FY14 FY15 FY16E FY17E
Net sales 71,724 79,651 100,982 114,867 134,071
% growth 0.4 11.1 26.8 13.7 16.7
Raw material costs 52,130 56,825 72,971 81,837 95,279
Staff costs 4,071 4,761 5,854 6,732 7,742
Other expenses 11,523 13,348 16,114 18,222 20,822
Total expenditure 67,724 74,934 94,939 106,791 123,842
EBITDA 4,000 4,717 6,043 8,075 10,229
% growth (14.8) 17.9 28.1 33.6 26.7
EBITDA margin (%) 5.6 5.9 6.0 7.0 7.6
Other income 238 302 326 343 360
Interest costs 480 254 274 174 146
Gross profit 19,594 22,826 28,011 33,029 38,792
% growth 4.2 16.5 22.7 17.9 17.4
Depreciation 1,304 1,317 1,533 1,602 2,011
Profit before tax 2,454 3,449 4,562 6,642 8,432
% growth (22.5) 40.5 32.3 45.6 26.9
Tax 476 909 1,083 1,793 2,319
Effective tax rate (%) 19.4 26.4 23.7 27.0 27.5
Net profit 1,978 2,539 3,479 4,849 6,113
% growth (20.6) 28.4 37.0 39.4 26.1
Extra ordinary items (908) 13 - - -
Reported net profit 1,070 2,552 3,479 4,849 6,113
% growth (57.1) 28.4 36.3 39.4 26.1
EPS (Rs) 4.2 5.3 7.3 10.2 12.9
% growth (20.6) 28.4 37.0 39.4 26.1
DPS (Rs) 1.2 1.4 1.9 2.5 3.0
Payout (%) 28.8 26.2 25.9 24.5 23.3
Source: Company, Nirmal Bang Institutional Equities Research
Exhibit 28: Balance sheet
Y/E March (Rsmn) FY13 FY14 FY15 FY16E FY17E
Equity 475 475 475 475 475
Reserves 11,772 13,678 15,979 19,349 23,801
Net worth 12,247 14,153 16,454 19,824 24,276
Net deferred tax liabilities 931 1,247 1,528 1,528 1,528
LT liabilities/provisions 488 532 437 459 482
Short-term loans 517 335 3,998 3,998 3,998
Long-term loans 4,941 4,424 5,190 4,690 3,290
Total loans 5,459 4,759 9,187 8,687 7,287
Liabilities 19,124 20,690 27,606 30,498 33,573
Gross block 22,479 25,058 29,043 32,043 34,543
Depreciation 12,365 13,681 15,214 16,816 18,647
Net block 10,115 11,377 13,829 15,227 15,896
Capital work-in-progress 361 361 361 361 361
Long-term Investments 8,688 8,959 10,125 9,425 11,225
Other long-term assets 734 863 1,437 1,725 2,070
Inventories 5,097 5,482 8,197 11,920 12,407
Debtors 3,169 3,341 5,039 5,233 6,036
Cash 175 826 54 234 1,089
Other current assets 3,019 4,439 7,001 8,358 9,640
Total current assets 11,458 14,087 20,290 25,745 29,172
Creditors 11,654 14,277 17,386 20,736 23,724
Other current liabilities/provisions 578 680 1,050 1,247 1,426
Total current liabilities 12,232 14,957 18,436 21,984 25,150
Net current assets (773) (870) 1,854 3,761 4,022
Total assets 19,124 20,690 27,606 30,498 33,573
Source: Company, Nirmal Bang Institutional Equities Research
Exhibit 27: Cash flow
Y/E March (Rsmn) FY13 FY14 FY15 FY16E FY17E
EBIT 2,158 3,714 4,836 6,816 8,578
(Inc.)/dec in working capital 643 1,613 (3,496) (1,728) 595
Cash flow from operations 2,802 5,327 1,341 5,088 9,173
Other income 214 542 326 343 360
Other expenses 972 412 - - -
Depreciation 1,304 1,317 1,533 1,602 2,011
Tax paid 535 1,275 1,083 1,793 2,319
Net cash from operations 4,328 5,238 1,464 4,554 8,505
Capital expenditure (995) (2,580) (3,985) (3,000) (2,500)
Net cash after capex 3,333 2,658 (2,521) 1,554 6,005
Other investing activities (78) (18) (839) 1,043 (1,440)
Cash from financial activities (3,211) (1,988) 2,588 (2,417) (3,709)
Opening cash balance 130 175 826 54 234
Closing cash balance 175 826 54 234 1,089
Change in cash balance 44 651 (772) 180 856
Source: Company, Nirmal Bang Institutional Equities Research
Exhibit 29: Key ratios
Y/E March FY13 FY14 FY15 FY16E FY17E
Profitability & return ratios
EBITDA margin (%) 5.6 5.9 6.0 7.0 7.6
EBIT margin (%) 3.8 4.3 4.5 5.6 6.1
Net profit margin (%) 2.8 3.2 3.4 4.2 4.6
RoE (%) 16.5 19.2 22.7 26.7 27.7
RoCE (%) 14.7 17.5 20.5 25.8 29.3
Working capital & liquidity ratios
Receivables (days) 16 16 21 18 18
Inventory (days) 36 37 46 41 37
Payables (days) 81 96 98 98 98
Current ratio (x) 0.9 0.9 1.1 1.2 1.2
Quick ratio (x) 0.5 0.6 0.7 0.6 0.7
Valuation ratios
EV/sales (x) 1.6 1.4 1.2 1.0 0.9
EV/EBITDA (x) 28.6 24.0 19.6 14.6 11.3
P/E (x) 55.2 43.0 31.4 22.5 17.9
P/BV (x) 8.9 7.7 6.6 5.5 4.5
Source: Company, Nirmal Bang Institutional Equities Research
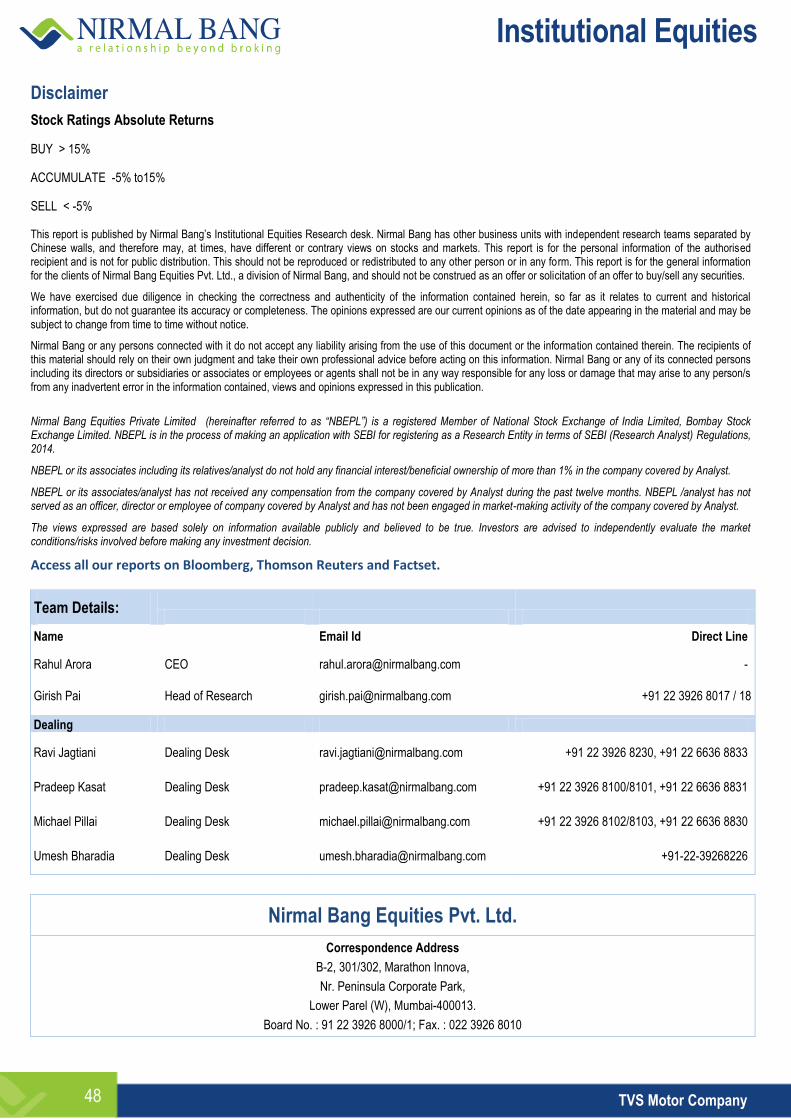
Institutional Equities
TVS Motor Company 48
Disclaimer
Stock Ratings Absolute Returns
BUY > 15%
ACCUMULATE -5% to15%
SELL < -5%
This report is published by Nirmal Bang’s Institutional Equities Research desk. Nirmal Bang has other business units with independent research teams separated by Chinese walls, and therefore may, at times, have different or contrary views on stocks and markets. This report is for the personal information of the authorised recipient and is not for public distribution. This should not be reproduced or redistributed to any other person or in any form. This report is for the general information for the clients of Nirmal Bang Equities Pvt. Ltd., a division of Nirmal Bang, and should not be construed as an offer or solicitation of an offer to buy/sell any securities.
We have exercised due diligence in checking the correctness and authenticity of the information contained herein, so far as it relates to current and historical information, but do not guarantee its accuracy or completeness. The opinions expressed are our current opinions as of the date appearing in the material and may be subject to change from time to time without notice.
Nirmal Bang or any persons connected with it do not accept any liability arising from the use of this document or the information contained therein. The recipients of this material should rely on their own judgment and take their own professional advice before acting on this information. Nirmal Bang or any of its connected persons including its directors or subsidiaries or associates or employees or agents shall not be in any way responsible for any loss or damage that may arise to any person/s from any inadvertent error in the information contained, views and opinions expressed in this publication.
Nirmal Bang Equities Private Limited (hereinafter referred to as “NBEPL”) is a registered Member of National Stock Exchange of India Limited, Bombay Stock Exchange Limited. NBEPL is in the process of making an application with SEBI for registering as a Research Entity in terms of SEBI (Research Analyst) Regulations, 2014.
NBEPL or its associates including its relatives/analyst do not hold any financial interest/beneficial ownership of more than 1% in the company covered by Analyst.
NBEPL or its associates/analyst has not received any compensation from the company covered by Analyst during the past twelve months. NBEPL /analyst has not served as an officer, director or employee of company covered by Analyst and has not been engaged in market-making activity of the company covered by Analyst.
The views expressed are based solely on information available publicly and believed to be true. Investors are advised to independently evaluate the market conditions/risks involved before making any investment decision.
Access all our reports on Bloomberg, Thomson Reuters and Factset.
Team Details:
Name Email Id Direct Line
Rahul Arora CEO [email protected] -
Girish Pai Head of Research [email protected] +91 22 3926 8017 / 18
Dealing
Ravi Jagtiani Dealing Desk [email protected] +91 22 3926 8230, +91 22 6636 8833
Pradeep Kasat Dealing Desk [email protected] +91 22 3926 8100/8101, +91 22 6636 8831
Michael Pillai Dealing Desk [email protected] +91 22 3926 8102/8103, +91 22 6636 8830
Umesh Bharadia Dealing Desk [email protected] +91-22-39268226
Nirmal Bang Equities Pvt. Ltd.
Correspondence Address
B-2, 301/302, Marathon Innova,
Nr. Peninsula Corporate Park,
Lower Parel (W), Mumbai-400013.
Board No. : 91 22 3926 8000/1; Fax. : 022 3926 8010