Institutional Equities Tata Consultancy Services · relatively more crowded. (5) ‘Automation at...
15
Institutional Equities 2QFY20 Result Update Reuters: TCS.BO; Bloomberg: TCS IN Tata Consultancy Services 1H did not deliver; 2H recovery visibility low; margin a challenge TCS’ 2QFY20 was disappointing on both growth and margins. Revenue growth in constant currency (CC) terms was a likely 1.6% QoQ against our estimate of 3%. USD growth QoQ was 0.6% impacted by a likely cross currency headwind of 100bps. The slower growth was due to continued softness in BFSI and unexpected weakness in the Retail vertical. Digital growth softened from 42% YoY in 1QFY20 to ~28% in 2QFY20 not only due to a high base but also as core transformation projects in some verticals seem to have been pushed back due to uncertain macro. This is despite US$5bn+ TCV in each of prior three quarters. As stated in our recent note (TCV, Value Compression and Margins Key ) TCV by itself does not translate into revenue. That’s why 2QFY20’s highest-ever-TCV of US$6.4bn is not a reliable leading indicator of revenue growth going forward. In BFSI, large banks in both North America and Europe continued to remain weak whereas growth in insurance and mid- small banks seemed good. We expect BFSI weakness to persist and be widespread in the coming days (see our recent note Global BFSI malaise ). Geography-wise only UK and Europe drove growth (YoY) while all other geographies grew below company level (8.4% CC YoY). TCS’ EBIT margin of 24% (60bps below our estimate) reflected lack of growth and hiring costs. With 2QFY20 seeing the highest net additions ever, margins were impacted by ‘investments-for-capturing-growth’. With limited margin levers in the light of weak growth in 2H other than INR depreciation, we think margin recovery will be challenging. 2QFY20 was a crucial quarter for TCS in order to achieve double digit growth in FY20. We foresee mid-to-high single digit CC growth in FY20 at best. With low 2H visibility (pointed out by management itself), a turnaround seems out of reach. Post 2QFY20, we broadly retain our estimates for FY20/FY21. We retain our Sell rating on TCS with a September 2021 target price (TP) of Rs1593 (at a target P/E of 16.5x FY21E EPS, 1 SD below the mean for the past five years). This target P/E (highest in our universe) reflects the strong position that TCS holds in the Indian IT services industry through: (1) Breadth and depth in service lines, geographies and verticals, (2) Ability to stitch together integrated offerings, (3) Significant lead in automation skills, (4) Strong and stable base of experienced employees with contextual knowledge and (5) Strong product, platform and agile delivery capabilities.. The strengths of TCS will help it gain market share despite its size and also help to keep its margins among industry’s best. We do not see this situation changing even during the downturn that we forecast - a 0% industry growth in FY21 (see our sector view on the next page). While we reiterate our underweight stance on the sector, TCS would remain one of our key bets. Structural exercise for fixing margins: While the aspired margin bracket of 26%-28% seems out of reach, TCS will carry out a few exercises, namely: (1) Hiring normalization to increase utilization (2) Stabilizing and reducing sub-contractor costs (3) Pyramid Optimization and (4) Cross selling across CXOs to get its margins in order. TCS did indicate that it expects a depreciating bias on the INR which it believes is an intrinsic part of the current business model. Our view is that INR may depreciate against the developed market currencies. The low relative inflation differential between India and the major western markets means that the pace would be far more anemic than had been in the past. TCS looks a solid dividend yield play near term at ~3.5%: TCS delivered cash conversion (OCF/Net Income) of 108%. It also announced Rs5 interim dividend per share and a special dividend of Rs40 per share. It reiterated its capital return philosophy of 80%-100% of a year’s free cash flow. We believe with the new buyback norms in place, capital return from here on will likely be more in the form of dividends. SELL Sector: Information Technology CMP: Rs2,004 Target price: Rs1,593 Downside: 21% Girish Pai Head of Research [email protected] +91-22-6273 8017 Seema Nayak Research Associate [email protected] +91-22-6273 8179 Key Data Current Shares O/S (mn) 3,752.4 Mkt Cap (Rsbn/US$bn) 7,521.5/105.9 52 Wk H / L (Rs) 2,296/1,784 Daily Vol. (3M NSE Avg.) 2,739,432 Price Performance (%) 1 M 6 M 1 Yr TCS (8.2) (1.8) (1.9) Nifty Index 2.1 (3.0) 7.4 Source: Bloomberg Y/E Mar (Rsmn) 2QFY19 1QFY20 2QFY20 YoY (%) QoQ (%) 2QFY20E Deviation (%) Net Sales (USD mn) 5,215 5,485 5,517 5.8 0.6 5,602 (1.5) Net Sales 368,540 381,720 389,770 5.8 2.1 393,787 (1.0) Software Expenses 212,000 227,210 230,630 8.8 1.5 234,072 (1.5) % of Sales 57.5 59.5 59.2 - - 59.4 Gross Margin 156,540 154,510 159,140 1.7 3.0 159,716 (0.4) % of Sales 42.5 40.5 40.8 - - 40.6 - Operating Expenses 58,830 62,310 65,530 11.4 5.2 62,933 4.1 % of Sales 16.0 16.3 16.8 - - 16.0 - EBIT 97,710 92,200 93,610 (4.2) 1.5 96,783 (3.3) EBIT Margin (%) 26.5 24.2 24.0 - - 24.6 - Other Income 5,930 14,180 11,680 97.0 (17.6) 13,998 (16.6) PBT 103,640 106,380 105,290 1.6 (1.0) 110,781 (5.0) Provision for Tax 24,370 24,850 24,710 1.4 (0.6) 26,255 (5.9) Effective Tax Rate 23.5 23.4 23.5 - - 23.7 - Minority share in Profit / Loss 260 220 160 (38.5) (27.3) 220 (27.3) PAT (Reported) 79,010 81,310 80,420 1.8 (1.1) 84,306 (4.6) NPM (%) 21.4 21.3 20.6 - - 21.4 - Source: Company, Nirmal Bang Institutional Equities Research 11 October 2019
Transcript of Institutional Equities Tata Consultancy Services · relatively more crowded. (5) ‘Automation at...

Institutional Equities
2QF
Y20
Res
ult U
pdat
e
Reuters: TCS.BO; Bloomberg: TCS IN
Tata Consultancy Services
1H did not deliver; 2H recovery visibility low; margin a challenge TCS’ 2QFY20 was disappointing on both growth and margins. Revenue growth in constant currency (CC) terms was a likely 1.6% QoQ against our estimate of 3%. USD growth QoQ was 0.6% impacted by a likely cross currency headwind of 100bps. The slower growth was due to continued softness in BFSI and unexpected weakness in the Retail vertical. Digital growth softened from 42% YoY in 1QFY20 to ~28% in 2QFY20 not only due to a high base but also as core transformation projects in some verticals seem to have been pushed back due to uncertain macro. This is despite US$5bn+ TCV in each of prior three quarters. As stated in our recent note (TCV, Value Compression and Margins Key) TCV by itself does not translate into revenue. That’s why 2QFY20’s highest-ever-TCV of US$6.4bn is not a reliable leading indicator of revenue growth going forward. In BFSI, large banks in both North America and Europe continued to remain weak whereas growth in insurance and mid-small banks seemed good. We expect BFSI weakness to persist and be widespread in the coming days (see our recent note Global BFSI malaise). Geography-wise only UK and Europe drove growth
(YoY) while all other geographies grew below company level (8.4% CC YoY). TCS’ EBIT margin of 24% (60bps below our estimate) reflected lack of growth and hiring costs. With 2QFY20 seeing the highest net additions ever, margins were impacted by ‘investments-for-capturing-growth’. With limited margin levers in the light of weak growth in 2H other than INR depreciation, we think margin recovery will be challenging. 2QFY20 was a crucial quarter for TCS in order to achieve double digit growth in FY20. We foresee mid-to-high single digit CC growth in FY20 at best. With low 2H visibility (pointed out by management itself), a turnaround seems out of reach. Post 2QFY20, we broadly retain our estimates for FY20/FY21. We retain our Sell rating on TCS with a September 2021 target price (TP) of Rs1593 (at a target P/E of 16.5x FY21E EPS, 1 SD below the mean for the past five years). This target P/E (highest in our universe) reflects the strong position that TCS holds in the Indian IT services industry through: (1) Breadth and depth in service lines, geographies and verticals, (2) Ability to stitch together integrated offerings, (3) Significant lead in automation skills, (4) Strong and stable base of experienced employees with contextual knowledge and (5) Strong product, platform and agile delivery capabilities.. The strengths of TCS will help it gain market share despite its size and also help to keep its margins among industry’s best. We do not see this situation changing even during the downturn that we forecast - a 0% industry growth in FY21 (see our sector view on the next page). While we reiterate our underweight stance on the sector, TCS would remain one of our key bets. Structural exercise for fixing margins: While the aspired margin bracket of 26%-28% seems out of reach, TCS will carry out a few exercises, namely: (1) Hiring normalization to increase utilization (2) Stabilizing and reducing sub-contractor costs (3) Pyramid Optimization and (4) Cross selling across CXOs to get its margins in order. TCS did indicate that it expects a depreciating bias on the INR which it believes is an intrinsic part of the current business model. Our view is that INR may depreciate against the developed market currencies. The low relative inflation differential between India and the major western markets means that the pace would be far more anemic than had been in the past.
TCS looks a solid dividend yield play near term at ~3.5%: TCS delivered cash conversion (OCF/Net Income) of 108%. It also announced Rs5 interim dividend per share and a special dividend of Rs40 per share. It reiterated its capital return philosophy of 80%-100% of a year’s free cash flow. We believe with the new buyback norms in place, capital return from here on will likely be more in the form of dividends.
SELL
Sector: Information Technology
CMP: Rs2,004
Target price: Rs1,593
Downside: 21%
Girish Pai Head of Research [email protected] +91-22-6273 8017 Seema Nayak Research Associate [email protected] +91-22-6273 8179
Key Data
Current Shares O/S (mn) 3,752.4
Mkt Cap (Rsbn/US$bn) 7,521.5/105.9
52 Wk H / L (Rs) 2,296/1,784
Daily Vol. (3M NSE Avg.) 2,739,432
Price Performance (%)
1 M 6 M 1 Yr
TCS (8.2) (1.8) (1.9)
Nifty Index 2.1 (3.0) 7.4
Source: Bloomberg
Y/E Mar (Rsmn) 2QFY19 1QFY20 2QFY20 YoY (%) QoQ (%) 2QFY20E Deviation (%)
Net Sales (USD mn) 5,215 5,485 5,517 5.8 0.6 5,602 (1.5) Net Sales 368,540 381,720 389,770 5.8 2.1 393,787 (1.0) Software Expenses 212,000 227,210 230,630 8.8 1.5 234,072 (1.5) % of Sales 57.5 59.5 59.2 - - 59.4 Gross Margin 156,540 154,510 159,140 1.7 3.0 159,716 (0.4) % of Sales 42.5 40.5 40.8 - - 40.6 - Operating Expenses 58,830 62,310 65,530 11.4 5.2 62,933 4.1 % of Sales 16.0 16.3 16.8 - - 16.0 - EBIT 97,710 92,200 93,610 (4.2) 1.5 96,783 (3.3) EBIT Margin (%) 26.5 24.2 24.0 - - 24.6 - Other Income 5,930 14,180 11,680 97.0 (17.6) 13,998 (16.6) PBT 103,640 106,380 105,290 1.6 (1.0) 110,781 (5.0) Provision for Tax 24,370 24,850 24,710 1.4 (0.6) 26,255 (5.9) Effective Tax Rate 23.5 23.4 23.5 - - 23.7 - Minority share in Profit / Loss 260 220 160 (38.5) (27.3) 220 (27.3) PAT (Reported) 79,010 81,310 80,420 1.8 (1.1) 84,306 (4.6) NPM (%) 21.4 21.3 20.6 - - 21.4 -
Source: Company, Nirmal Bang Institutional Equities Research
11 October 2019

Institutional Equities
2 Tata Consultancy Services
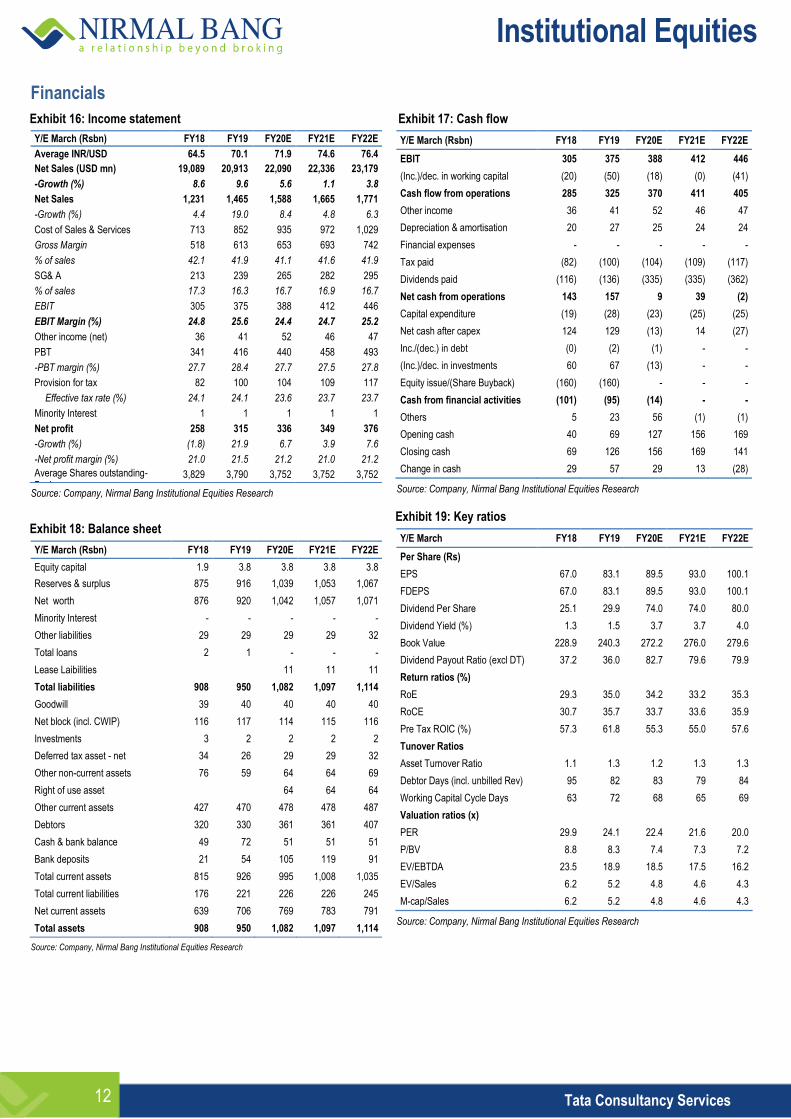
Exhibit 1: Key financials
Y/E March (Rsbn) FY18 FY19 FY20E FY21E FY22E
Revenue (Rsbn) 1,231 1,465 1,588 1,665 1,771
YoY Growth % 4.4 19.0 8.4 4.8 6.3
EBIT (Rsbn) 305 375 388 412 446
% of sales 24.8 25.6 24.4 24.7 25.2
PAT (Rsbn) 258 315 336 349 376
YoY Growth % (1.8) 21.9 6.7 3.9 7.6
FDEPS (Rs) 67.0 83.1 89.5 93.0 100.1
ROE (%) 29.3 35.0 34.2 33.2 35.3
ROCE (%) 30.7 35.7 33.7 33.6 35.9
Pre Tax ROIC (%) 57.3 61.8 55.3 55.0 57.6
P/E (x) 29.9 24.1 22.4 21.6 20.0
P/BV (x) 8.8 8.3 7.4 7.3 7.2
Source: Company, Nirmal Bang Institutional Equities Research
Exhibit 2: Change in our estimates
New Old Change (%)
FY20E FY21E FY22E FY20E FY21E FY22E FY20E FY21E FY22E
INR/USD 71.9 74.6 76.4 71.8 74.6 76.4 0.1 - -
USD Revenue (USD mn) 22,090 22,336 23,179 22,584 22,877 23,621 (2.2) (2.4) (1.9)
Revenue (Rsbn) 1,588 1,665 1,771 1,622 1,705 1,805 (2.1) (2.4) (1.9)
EBIT (Rsbn) 388 412 446 402 425 455 (3.5) (3.2) (1.9)
EBIT Margin (%) 24.4 24.7 25.2 24.8 24.9 25.2 - - -
PAT (Rsbn) 336 349 376 350 355 380 (4.0) (1.7) (1.1)
FDEPS (Rs) 89.5 93.0 100.1 93.3 94.6 101.2 (4.0) (1.7) (1.1)
Source: Company, Nirmal Bang Institutional Equities Research
View on Indian IT services sector: We went back to being cautious on the Indian IT sector in late December 2018 (see report: Street Is Not Factoring Even A Soft Landing; We Downgrade) after being ‘Tactically bullish’ on it through most of 2018. This is based on: (1) Consensus not factoring in significantly softer growth in FY21 as the best demand environment since 2008-09 is largely behind us with corporate capex in both the US and Europe likely to have peaked in 2018. (2) Global BFSI customers could witness pressure on margins from a flattened/inverted yield curve and negative yields across a large part of European bonds (see our recent note Global BFSI malaise) and could therefore curtail IT spending (3) Pressure on cost structure because of tariffs levied on imports from China impacting US manufacturers. (4) Front-office capabilities in digital still largely eluding Indian IT services players, leading to inability to tap into the marketing budgets of customers in a material way. The focus has been on the technology-intensive back-end of digital where we believe the field is relatively more crowded. (5) ‘Automation at scale’ in legacy services constricting the opportunity being addressed by the Indian Industry. This is driven by explosive growth in both intelligent and robotic process automation software industry. (6) Capital return to shareholders not being as potent a stock driver as it was earlier as the cash hoard is shrinking after two to three rounds of buyback over the past four years. Besides, recent taxation introduced on buybacks could be a dampener (7) Talent pressure in the US in new age services because of a tighter H1-B visa regime. We reiterate our no-industry-growth-in-FY21 call initiated in March 2018. We base this scenario on an explicit expectation of a soft landing in the US (0%-1.5% real GDP growth) in 2020. We believe consensus is expecting mid-high single-digit revenue growth in FY21 for the industry, implicitly assuming continued robust growth in the US (2%-2.5%). It is our belief that the street will converge with our no-growth expectations over time. Until the market prices in this scenario, we believe technical factors are not likely to hold the sector up. A hard landing (recession) - not our current base case - could lead to single-digit negative growth for the sector. Just as outperformance of the sector in 2018 was driven largely by P/E multiple expansion in the belief that growth is going to accelerate, we believe the downside in 2019 will be driven by P/E multiple deflation as investors begin to re-calibrate growth expectations on FY20-FY22. We prefer large-caps over mid-caps. The faster growth shown by select mid-caps is a case of ‘rising tide lifting all boats’, a smaller base and lower exposure to legacy services. But as digital demand shifts from the front to back, we believe that traditional large Indian companies will be in a better position to capture the market. We would advise investors to focus on sustainability and not overpay for a riskier business model - some companies have seen client concentration rising over the past two years.
Institutional Equities
3 Tata Consultancy Services
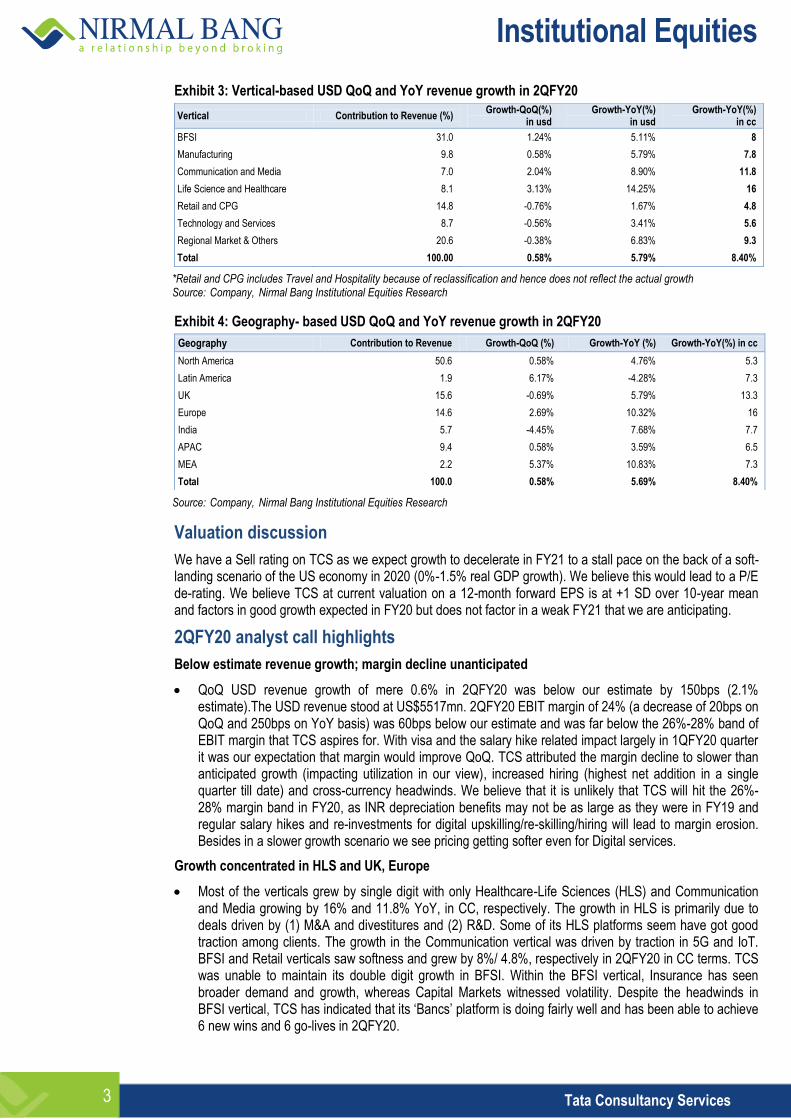
Exhibit 3: Vertical-based USD QoQ and YoY revenue growth in 2QFY20
*Retail and CPG includes Travel and Hospitality because of reclassification and hence does not reflect the actual growth Source: Company, Nirmal Bang Institutional Equities Research
Exhibit 4: Geography- based USD QoQ and YoY revenue growth in 2QFY20
Source: Company, Nirmal Bang Institutional Equities Research
Valuation discussion
We have a Sell rating on TCS as we expect growth to decelerate in FY21 to a stall pace on the back of a soft-landing scenario of the US economy in 2020 (0%-1.5% real GDP growth). We believe this would lead to a P/E de-rating. We believe TCS at current valuation on a 12-month forward EPS is at +1 SD over 10-year mean and factors in good growth expected in FY20 but does not factor in a weak FY21 that we are anticipating.
2QFY20 analyst call highlights
Below estimate revenue growth; margin decline unanticipated
QoQ USD revenue growth of mere 0.6% in 2QFY20 was below our estimate by 150bps (2.1% estimate).The USD revenue stood at US$5517mn. 2QFY20 EBIT margin of 24% (a decrease of 20bps on QoQ and 250bps on YoY basis) was 60bps below our estimate and was far below the 26%-28% band of EBIT margin that TCS aspires for. With visa and the salary hike related impact largely in 1QFY20 quarter it was our expectation that margin would improve QoQ. TCS attributed the margin decline to slower than anticipated growth (impacting utilization in our view), increased hiring (highest net addition in a single quarter till date) and cross-currency headwinds. We believe that it is unlikely that TCS will hit the 26%-28% margin band in FY20, as INR depreciation benefits may not be as large as they were in FY19 and regular salary hikes and re-investments for digital upskilling/re-skilling/hiring will lead to margin erosion. Besides in a slower growth scenario we see pricing getting softer even for Digital services.
Growth concentrated in HLS and UK, Europe
Most of the verticals grew by single digit with only Healthcare-Life Sciences (HLS) and Communication and Media growing by 16% and 11.8% YoY, in CC, respectively. The growth in HLS is primarily due to deals driven by (1) M&A and divestitures and (2) R&D. Some of its HLS platforms seem have got good traction among clients. The growth in the Communication vertical was driven by traction in 5G and IoT. BFSI and Retail verticals saw softness and grew by 8%/ 4.8%, respectively in 2QFY20 in CC terms. TCS was unable to maintain its double digit growth in BFSI. Within the BFSI vertical, Insurance has seen broader demand and growth, whereas Capital Markets witnessed volatility. Despite the headwinds in BFSI vertical, TCS has indicated that its ‘Bancs’ platform is doing fairly well and has been able to achieve 6 new wins and 6 go-lives in 2QFY20.
Vertical Contribution to Revenue (%) Growth-QoQ(%)
in usd Growth-YoY(%)
in usd Growth-YoY(%)
in cc
BFSI 31.0 1.24% 5.11% 8
Manufacturing 9.8 0.58% 5.79% 7.8
Communication and Media 7.0 2.04% 8.90% 11.8
Life Science and Healthcare 8.1 3.13% 14.25% 16
Retail and CPG 14.8 -0.76% 1.67% 4.8
Technology and Services 8.7 -0.56% 3.41% 5.6
Regional Market & Others 20.6 -0.38% 6.83% 9.3
Total 100.00 0.58% 5.79% 8.40%
Geography Contribution to Revenue Growth-QoQ (%) Growth-YoY (%) Growth-YoY(%) in cc
North America 50.6 0.58% 4.76% 5.3
Latin America 1.9 6.17% -4.28% 7.3
UK 15.6 -0.69% 5.79% 13.3
Europe 14.6 2.69% 10.32% 16
India 5.7 -4.45% 7.68% 7.7
APAC 9.4 0.58% 3.59% 6.5
MEA 2.2 5.37% 10.83% 7.3
Total 100.0 0.58% 5.69% 8.40%
Institutional Equities
4 Tata Consultancy Services
Digital revenue growth slows
TCS delivered ~28% YoY revenue growth in Digital (CC terms), contributing 33.2% to overall revenue in 2QFY20,vis-à-vis 42.1% YoY growth in 1QFY20. Now that the digital base has become large, the growth rate has come down sharply. TCS has indicated softness in product led Digital deals which is broad-based across verticals. TCS sounded positive on the prospects of Digital and highlighted the rising demand across all verticals. This quarter has seen a record TCV in terms of Digital deals as well. It also indicated greater action in front end customer experience design (through TCS Interactive) and Digital work places related work. For now, management is focusing on capturing the demand by increased hiring in the new-age skill sets. It stated that getting the right digital talent in the right place and right time is still a challenge.
Vertical commentary
The major industry players are indicating weak BFSI demand. For TCS, the vertical grew by 8% in 2QFY20 vs 9.2% in CC terms YoY, in 1QFY20. This is a result of in large BFS customers across US and Europe. Manufacturing performed better by growing 7.8% YoY in CC vs 5.5% in 1QFY20. Most of the manufacturing growth is coming from the US (from both automotive and non-automotive segments) while the UK and European manufacturing remained soft (which remains largely automotive). The growth in 2QFY20 was driven by Healthcare and Life-Sciences vertical which grew by 16% YoY, in CC. Communication and Media broke into double digit YoY growth by growing 11.8%. Regional Markets and others grew by 9.3%.
Growth slowdown in both US and APAC, MEA, India
North America growth has slowed down from previous quarter. In the US, TCS grew by 5.3% YoY in CC terms and the UK grew by 13.3% YoY in CC terms (vis-à-vis 7.7% and 16% YoY, respectively in 1QFY20). The growth was mainly driven by EU (grew by 16% YoY). Asia Pacific grew by just 6.5% YoY in CC terms vs 9.5% in 1QFY20. India grew by a meager 7.7% in YoY in CC terms vs 15.9% in 1QFY20. Management maintains that emerging markets (EM) are volatile at this point, given the current macro-economic scenario. We would be worried about its relatively large exposure to India and especially to the public sector as there is a risk of high receivable days due to the very poor revenue picture for both Central and State governments.
Different commentary on size of deals
TCS stated that the deals are getting bigger and of longer tenure than they used to previously as many of these deals are becoming transformational in nature and require the stitching together of multiple service line capabilities. The industry commentary (propagated more by the mid-sized players) has been that deal sizes have contracted substantially. We think both may be true. In the league that TCS plays, we believe customers would want it to pick up end-to-end, multi country, multi-service line deals which may be very large in size and to be delivered over a longer tenure.
Pricing – Focus on portfolio profitability
TCS did not indicate that it was getting higher pricing on a like-to-like basis for the services it renders despite the talent crunch. The attempt is to maintain margins at the portfolio level. TCS has been getting selective price increases from certain clients. It stated that productivity is a core proposition that it takes to clients and price increases will not gel with that. This seems a more balanced view in contrast to the one that we heard from Accenture which seems to be focused on getting higher pricing.
TCV shoots up
2QFY20 witnessed very strong order inflow. TCV in 2QFY20 was US$6.4bn, an increase of ~12.3% QoQ and growth of ~30% YoY. This is TCS’s 4th straight quarter of US$5bn plus TCV. Out of the US$6.4bn, US$2.2bn came from BFSI and US$830mn came from Retail. North America contributed US$3.4bn to this quarter’s TCV.
Institutional Equities
5 Tata Consultancy Services
Ignio sees continued momentum
As per management, Ignio -TCS’ cognitive automation software - is doing very well and is expanding from IT operations into business operations. It is helping in end-to-end operational transformation of companies. Ignio cognitive automation software had 10 new wins and 8 go-lives in 2QFY20 and is increasingly being viewed as a critical component of any core transformation to build in greater resilience. It was also indicated that TCS has been able to sign on four new implementation partners which is a positive signal.
Delay in deal ramp-ups
As indicated by management, there have been delay in deal ramp-ups which has led to slower conversion of 1QFY20’s TCV of US$5.7bn. This is due to digital deals (namely, core transformation) impacted by economic volatility. While management is not worried about demand (due to its TCV of US$6.4bn) in the long term, decision making seems to have been impacted by the volatile macro.
Miscellaneous
TCS reported LTM attrition rate (in IT services) of 11.6%, which increased marginally from 1QFY20 (11.5%).
TCS added 14,097 net employees during the quarter – which is the highest till date. Over 30,000 campus offers were made. Total employee count stood at ~450,000. The net addition is inclusive of freshers, lateral hires and those that have been rebadged from some of the large deals it has done. The strong fresher hiring, TCS says is indicative of its belief in medium term demand and in its philosophy of doing business with internal talent. The heavy net addition in 2QFY20 has impacted margin and management has affirmed that it is focused on capturing demand at the moment and will optimize the cost structure going forward.
The number of clients in US$100M+ bracket were up by 3; US$50M+ up by 3; US$20M+ up by 12; US$10M+ up by 33 and US$5M+ up by 41 YoY.
TCS currently has more than ~1100 patents already granted to it against the ~4800 applied for. We believe this forms a critical component of its products and platforms strategy and is visible from its industry leading EBIT margin picture despite its large size.
DSO stood at 66 days vs 70 days 1QFY20.
No impact of the corporate tax cut that has been done by the Indian government in September 2019. A shift to the new tax regime would involve giving up on some of its existing taxation benefits. TCS indicated that it would keep evaluating the situation.

Institutional Equities
6 Tata Consultancy Services
Exhibit 5: USD revenue growth affected by cross-currency headwinds
Source: Company, Nirmal Bang Institutional Equities Research
Exhibit 6: Employee addition shoots up Exhibit 7: Attrition rate increasing, but still under control (%)
Source: Company, Nirmal Bang Institutional Equities Research Source: Company, Nirmal Bang Institutional Equities Research
Exhibit 8: CC YoY revenue growth has decelerated Exhibit 9: Subcontractor charges steady
Source: Company, Nirmal Bang Institutional Equities Research Source: Company, Nirmal Bang Institutional Equities Research
16.0
17.0
16.6
15.2
16.717.7
14.3
11.3
9.3
5.8
5.4
7.9 8.1
5.2
5.8
5.8
5.2
8.39.1
11.7
10.0
10.0
9.7
8.5
8.6
5.8
2
4
6
8
10
12
14
16
18
20
1Q
FY
14
2Q
FY
14
3Q
FY
14
4Q
FY
14
1Q
FY
15
2Q
FY
15
3Q
FY
15
4Q
FY
15
1Q
FY
16
2Q
FY
16
3Q
FY
16
4Q
FY
16
1Q
FY
17
2Q
FY
17
3Q
FY
17
4Q
FY
17
1Q
FY
18
2Q
FY
18
3Q
FY
18
4Q
FY
18
1Q
FY
19
2Q
FY
19
3Q
FY
19
4Q
FY
19
1Q
FY
20
2Q
FY
20
(%)
USD revenue growth (YoY)
4.1
5.4
3.0
1.9
5.5
6.4
0.1
(0.8)
3.5 3.0
(0.3)
1.5
3.7
0.3 0.3
1.5
3.1 3.2
1.0
3.9
1.6
3.2
0.7
2.8
1.6
0.6
(2)
(1)
0
1
2
3
4
5
6
7
8
1Q
FY
14
2Q
FY
14
3Q
FY
14
4Q
FY
14
1Q
FY
15
2Q
FY
15
3Q
FY
15
4Q
FY
15
1Q
FY
16
2Q
FY
16
3Q
FY
16
4Q
FY
16
1Q
FY
17
2Q
FY
17
3Q
FY
17
4Q
FY
17
1Q
FY
18
2Q
FY
18
3Q
FY
18
4Q
FY
18
1Q
FY
19
2Q
FY
19
3Q
FY
19
4Q
FY
19
1Q
FY
20
2Q
FY
20
(%)
1,390
7,664
5,463
9,751
4,967
8,326
4,868
1,031
5,279
10,685
9,071 9,152 8,236
9,440
6,978
8,726
(1,414)
3,404
1,667
4,118
5,877
10,227
6,827 6,356
12,356
14,097
(4,000)
(2,000)
0
2,000
4,000
6,000
8,000
10,000
12,000
14,000
16,000
1Q
FY
14
2Q
FY
14
3Q
FY
14
4Q
FY
14
1Q
FY
15
2Q
FY
15
3Q
FY
15
4Q
FY
15
1Q
FY
16
2Q
FY
16
3Q
FY
16
4Q
FY
16
1Q
FY
17
2Q
FY
17
3Q
FY
17
4Q
FY
17
1Q
FY
18
2Q
FY
18
3Q
FY
18
4Q
FY
18
1Q
FY
19
2Q
FY
19
3Q
FY
19
4Q
FY
19
1Q
FY
20
2Q
FY
20
Net employee addition
10.5
10.9
10.9
11.3
12.0
12.8
13.4
14.9
15.9
16.2
15.9
15.5
13.6
12.9
12.2
11.5
12.4
12.1
11.9
11.0
10.9
10.9
11.2
11.3
11.5
11.6
0
2
4
6
8
10
12
14
16
18
1Q
FY
14
2Q
FY
14
3Q
FY
14
4Q
FY
14
1Q
FY
15
2Q
FY
15
3Q
FY
15
4Q
FY
15
1Q
FY
16
2Q
FY
16
3Q
FY
16
4Q
FY
16
1Q
FY
17
2Q
FY
17
3Q
FY
17
4Q
FY
17
1Q
FY
18
2Q
FY
18
3Q
FY
18
4Q
FY
18
1Q
FY
19
2Q
FY
19
3Q
FY
19
4Q
FY
19
1Q
FY
20
2Q
FY
20
(%)
Attrition
15.8
12
9.910.4 10.1
7
8.67.5
6.37.1
6.27.2
9.3
11.512.1
12.7
10.6
8.4
0
2
4
6
8
10
12
14
16
18
1Q
FY
16
2Q
FY
16
3Q
FY
16
4Q
FY
16
1Q
FY
17
2Q
FY
17
3Q
FY
17
4Q
FY
17
1Q
FY
18
2Q
FY
18
3Q
FY
18
4Q
FY
18
1Q
FY
19
2Q
FY
19
3Q
FY
19
4Q
FY
19
1Q
FY
20
2Q
FY
20
(%)
6.7
7.4 7.3 7.4 7.3 7.47.1
6.5 6.66.9 6.7
7.1 7.0 7.0
7.6 7.6
8.2 8.1
3.0
4.0
5.0
6.0
7.0
8.0
9.0
1Q
FY
16
2Q
FY
16
3Q
FY
16
4Q
FY
16
1Q
FY
17
2Q
FY
17
3Q
FY
17
4Q
FY
17
1Q
FY
18
2Q
FY
18
3Q
FY
18
4Q
FY
18
1Q
FY
19
2Q
FY
19
3Q
FY
19
4Q
FY
19
1Q
FY
20
2Q
FY
20
Sub Contracting Expenses
(%)

Institutional Equities
7 Tata Consultancy Services
Exhibit 10: Quarterly snapshot
Year to 31 March 2QFY17 3QFY17 4QFY17 1QFY18 2QFY18 3QFY18 4QFY18 1QFY19 2QFY19 3QFY19 4QFY19 1QFY20 2QFY20
INR/USD 67.0 67.8 66.6 64.4 64.5 64.6 64.5 67.8 70.0 72.2 70.4 69.6 70.6
Reevenue (in USDmn) 4374 4387 4452 4591 4739 4787 4972 5051 5215 5250 5397 5485 5517
(Rsmn)
Revenue 292,840 297,350 296,420 295,840 305,410 309,040 320,750 342,610 368,540 373,380 380,100 381,720 389,770
Gross margin 127,500 128,570 129,690 122,930 129,300 130,420 135,510 141,780 156,540 156,030 158,700 154,510 159,140
EBIT 76,170 77,330 76,270 69,140 76,600 77,810 81,470 85,780 97,710 95,640 95,370 92,200 93,610
Other income 10,520 11,850 9,890 9,320 8,120 8,640 9,820 12,080 5,930 11,470 11,650 14,180 11,680
PBT 86,690 89,180 86,160 78,460 84,720 86,450 91,290 97,860 103,640 107,110 107,020 106,380 105,290
Tax 20,660 21,040 19,940 18,960 20,120 21,000 22,040 24,240 24,370 25,900 25,500 24,850 24,710
PAT 65,860 67,780 66,080 59,450 64,460 65,310 69,040 73,400 79,010 81,050 81,260 81,310 80,420
Number of shares 3,941 3,941 3,941 3,941 3,829 3,829 3,829 3,829 3,829 3,752 3,752 3,752 3,752
EPS 16.7 17.2 16.8 15.1 16.8 17.1 18.0 19.2 20.6 21.6 21.7 21.7 21.4
YoY Growth (%)
USD Revenue 5.2 5.8 5.8 5.2 8.3 9.1 11.7 10.0 10.0 9.7 8.5 8.6 5.8
INR Revenues 7.8 8.7 4.2 1.0 4.3 3.9 8.2 15.8 20.7 20.8 18.5 11.4 5.8
Gross profit 6.1 5.9 4.7 -1.7 1.4 1.4 4.5 15.3 21.1 19.6 17.1 9.0 1.7
EBIT 3.6 6.3 2.9 -5.9 0.6 0.6 6.8 24.1 27.6 22.9 17.1 7.5 -4.2
Net profit 8.8 10.9 4.2 -5.9 -2.1 -3.6 4.5 23.5 22.6 24.1 17.7 10.8 1.8
QoQ Growth (%)
USD Revenues 0.3 0.3 1.5 3.12 3.22 1.01 3.86 1.59 3.2 0.7 2.8 1.6 0.58
INR Revenues (0.1) 1.5 (0.3) (0.2) 3.2 1.2 3.8 6.8 7.6 1.3 1.8 0.4 2.1
EBIT 3.7 1.5 (1.4) (9.3) 10.8 1.6 4.7 5.3 13.9 (2.1) (0.3) (3.3) 1.5
Net profit 4.3 2.9 (2.5) (10.0) 8.4 1.3 5.7 6.3 7.6 2.6 0.3 0.1 (1.1)
Margins (%)
Gross margin 43.5 43.2 43.8 41.6 42.3 42.2 42.2 41.4 42.5 41.8 41.8 40.5 40.8
EBIT 26.0 26.0 25.7 23.4 25.1 25.2 25.4 25.0 26.5 25.6 25.1 24.2 24.0
PAT 22.5 22.8 22.3 20.1 21.1 21.1 21.5 21.4 21.4 21.7 21.4 21.3 20.6
SGA 17.5 17.2 18.0 18.2 17.3 17.0 16.8 16.3 16.0 16.2 16.7 16.3 16.8
Source: Company, Nirmal Bang Institutional Equities Research

Institutional Equities
8 Tata Consultancy Services
Exhibit 11: Key metrics
2QFY17 3QFY17 4QFY17 1QFY18 2QFY18 3QFY18 4QFY18 1QFY19 2QFY19 3QFY19 4QFY19 1QFY20 2QFY20
P and L (Rs mn)
Revenue 292,840 297,350 296,420 295,840 305,410 309,040 320,750 342,610 368,540 373,380 380,100 381,720 389,770
EBITDA 76,170 77,330 76,270 69,140 76,600 77,810 81,470 85,780 97,710 95,640 95,370 92,200 93,610
PAT 65,860 67,780 66,080 59,450 64,460 65,310 69,040 73,400 79,010 81,050 81,260 81,310 80,420
Vertical Mix (%)
BFSI 33.6 33.9 32.9 32.9 33.0 32.1 31.5 31.1 31.2 30.8 30.9 30.8 31.0
Manufacturing 7.3 7.4 7.4 7.5 7.5 7.6 7.4 10.2 9.8 9.8 9.6 9.8 9.8
Communication and Media 7.2 6.7 7.2 7.3 7.3 7.4 7.4 7.1 6.8 6.9 6.8 6.9 7.0
Life Sciences 7.0 6.9 6.9 7.1 7.2 7.3 7.2 7.3 7.5 7.6 7.7 7.9 8.1
Retail & Distribution 13.0 13.0 12.3 12.2 11.9 12.5 12.3 15.4 15.4 15.5 15.1 15.0 14.8
Hi-Tech 7.7 7.8 7.8 7.9 8.1 8.0 7.8 9.0 8.9 8.7 8.6 8.8 8.7
Travel and hospitality 3.3 3.2 3.4 3.5 3.8 3.8 4.0 - - - - - -
Transportation - - - - - - - - - - - - -
Energy And Utility 3.7 3.6 3.7 4.0 4.2 4.5 4.8 - - - - - -
Media & Entertainment - - - - - - - - - - - - -
Others 17.2 17.5 18.4 17.6 17.0 16.8 17.6 19.9 20.4 20.7 21.3 20.8 20.6
100.0 100.0 100.0 100.0 100.0 100.0 100.0 100.0 100.0 100.0 100.0 100.0 100.0
Horizontal Mix (%)
Application Development & Maintenance
38.4 37.2 37.7 T
he c
ompa
ny h
as s
topp
ed r
epor
ting
the
num
bers
- - - - -
Business Intelligence 0 0 0 - - - - -
Enterprise Solutions 17.8 17.5 17.3 - - - - -
Assurance Services 9 9 9 - - - - -
Product Engineering Services 4.8 4.9 5 - - - - -
Infrastructure Management 15.7 16.8 16.2 - - - - -
Global Consulting 0 0 0 - - - - -
Asset Leveraged solutions 2.6 3 2.9 - - - - -
Business Process Outsourcing 11.7 11.6 11.9 - - - - -
100.0 100.0 100.0 - - - - -
Geographic Mix (%)
North America 54.0 55.0 53.3 52.5 51.9 52.0 50.2 51.0 51.1 51.2 50.7 50.6 50.6
UK 13.8 13.3 13.7 13.9 14.0 14.1 15.2 15.5 15.6 15.5 15.9 15.8 15.6
Europe 11.8 11.1 11.8 12.5 13.4 13.5 14.2 14.0 14.0 14.1 14.1 14.3 14.6
India 5.8 6.3 6.8 7.0 6.3 6.3 6.2 5.8 5.6 5.7 5.8 6.0 5.7
APAC 10.2 9.6 9.7 9.5 9.8 9.5 9.7 9.6 9.6 9.4 9.5 9.4 9.4
Ibero America 2.0 2.2 2.1 2.1 2.2 2.2 2.0 1.9 2.1 2.0 2.0 1.8 1.9
MEA 2.4 2.5 2.6 2.5 2.4 2.4 2.5 2.2 2.1 2.1 2.0 2.1 2.2
100.0 100.0 100.0 100.0 100.0 100.0 100.0 100.0 100.1 100.0 100.0 100.0 100.0
Number of Client
$100mn + 36 34 35 36 37 37 38 40 44 45 44 44 47
$50mn + 78 80 84 85 91 94 97 97 98 99 99 100 101
Employee Number 371,519 378,497 387,223 385,809 389,213 390,880 394,998 400,875 411,102 417,929 424,285 436,641 450,738
Net Addition 9,440 6,978 8,726 (1,414) 3,404 1,667 4,118 5,877 10,227 6,827 6,356 12,356 14,097
Attrition (%) 12.9 12.2 11.5 12.4 12.1 11.9 11.0 10.9 10.9 11.2 11.3 11.5 11.6
Source: Company, Nirmal Bang Institutional Equities Research
Institutional Equities
9 Tata Consultancy Services
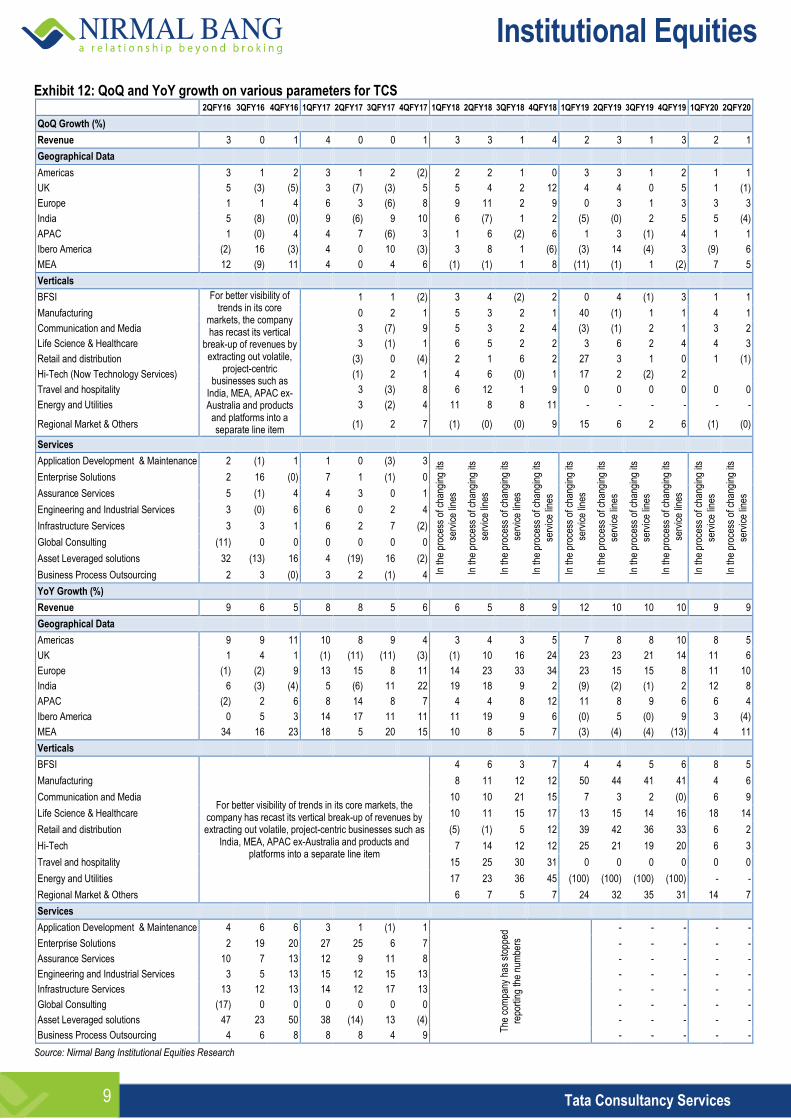
Exhibit 12: QoQ and YoY growth on various parameters for TCS 2QFY16 3QFY16 4QFY16 1QFY17 2QFY17 3QFY17 4QFY17 1QFY18 2QFY18 3QFY18 4QFY18 1QFY19 2QFY19 3QFY19 4QFY19 1QFY20 2QFY20
QoQ Growth (%)
Revenue 3 0 1 4 0 0 1 3 3 1 4 2 3 1 3 2 1
Geographical Data
Americas 3 1 2 3 1 2 (2) 2 2 1 0 3 3 1 2 1 1
UK 5 (3) (5) 3 (7) (3) 5 5 4 2 12 4 4 0 5 1 (1)
Europe 1 1 4 6 3 (6) 8 9 11 2 9 0 3 1 3 3 3
India 5 (8) (0) 9 (6) 9 10 6 (7) 1 2 (5) (0) 2 5 5 (4)
APAC 1 (0) 4 4 7 (6) 3 1 6 (2) 6 1 3 (1) 4 1 1
Ibero America (2) 16 (3) 4 0 10 (3) 3 8 1 (6) (3) 14 (4) 3 (9) 6
MEA 12 (9) 11 4 0 4 6 (1) (1) 1 8 (11) (1) 1 (2) 7 5
Verticals
BFSI For better visibility of trends in its core
markets, the company has recast its vertical
break-up of revenues by extracting out volatile,
project-centric businesses such as
India, MEA, APAC ex-Australia and products
and platforms into a separate line item
1 1 (2) 3 4 (2) 2 0 4 (1) 3 1 1
Manufacturing 0 2 1 5 3 2 1 40 (1) 1 1 4 1
Communication and Media 3 (7) 9 5 3 2 4 (3) (1) 2 1 3 2
Life Science & Healthcare 3 (1) 1 6 5 2 2 3 6 2 4 4 3
Retail and distribution (3) 0 (4) 2 1 6 2 27 3 1 0 1 (1)
Hi-Tech (Now Technology Services) (1) 2 1 4 6 (0) 1 17 2 (2) 2
Travel and hospitality 3 (3) 8 6 12 1 9 0 0 0 0 0 0
Energy and Utilities 3 (2) 4 11 8 8 11 - - - - - -
Regional Market & Others (1) 2 7 (1) (0) (0) 9 15 6 2 6 (1) (0)
Services
Application Development & Maintenance 2 (1) 1 1 0 (3) 3
In th
e pr
oces
s of
cha
ngin
g its
ser
vice
line
s
In th
e pr
oces
s of
cha
ngin
g its
ser
vice
line
s
In th
e pr
oces
s of
cha
ngin
g its
s
ervi
ce li
nes
In th
e pr
oces
s of
cha
ngin
g its
serv
ice
lines
In th
e pr
oces
s of
cha
ngin
g its
ser
vice
line
s
In th
e pr
oces
s of
cha
ngin
g its
serv
ice
lines
In th
e pr
oces
s of
cha
ngin
g its
se
rvic
e lin
es
In th
e pr
oces
s of
cha
ngin
g its
ser
vice
line
s
In th
e pr
oces
s of
cha
ngin
g its
serv
ice
lines
In th
e pr
oces
s of
cha
ngin
g its
serv
ice
lines
Enterprise Solutions 2 16 (0) 7 1 (1) 0
Assurance Services 5 (1) 4 4 3 0 1
Engineering and Industrial Services 3 (0) 6 6 0 2 4
Infrastructure Services 3 3 1 6 2 7 (2)
Global Consulting (11) 0 0 0 0 0 0
Asset Leveraged solutions 32 (13) 16 4 (19) 16 (2)
Business Process Outsourcing 2 3 (0) 3 2 (1) 4
YoY Growth (%)
Revenue 9 6 5 8 8 5 6 6 5 8 9 12 10 10 10 9 9
Geographical Data
Americas 9 9 11 10 8 9 4 3 4 3 5 7 8 8 10 8 5
UK 1 4 1 (1) (11) (11) (3) (1) 10 16 24 23 23 21 14 11 6
Europe (1) (2) 9 13 15 8 11 14 23 33 34 23 15 15 8 11 10
India 6 (3) (4) 5 (6) 11 22 19 18 9 2 (9) (2) (1) 2 12 8
APAC (2) 2 6 8 14 8 7 4 4 8 12 11 8 9 6 6 4
Ibero America 0 5 3 14 17 11 11 11 19 9 6 (0) 5 (0) 9 3 (4)
MEA 34 16 23 18 5 20 15 10 8 5 7 (3) (4) (4) (13) 4 11
Verticals
BFSI
For better visibility of trends in its core markets, the company has recast its vertical break-up of revenues by extracting out volatile, project-centric businesses such as
India, MEA, APAC ex-Australia and products and platforms into a separate line item
4 6 3 7 4 4 5 6 8 5
Manufacturing 8 11 12 12 50 44 41 41 4 6
Communication and Media 10 10 21 15 7 3 2 (0) 6 9
Life Science & Healthcare 10 11 15 17 13 15 14 16 18 14
Retail and distribution (5) (1) 5 12 39 42 36 33 6 2
Hi-Tech 7 14 12 12 25 21 19 20 6 3
Travel and hospitality 15 25 30 31 0 0 0 0 0 0
Energy and Utilities 17 23 36 45 (100) (100) (100) (100) - -
Regional Market & Others 6 7 5 7 24 32 35 31 14 7
Services
Application Development & Maintenance 4 6 6 3 1 (1) 1
The
com
pany
has
sto
pped
re
port
ing
the
num
bers
- - - - -
Enterprise Solutions 2 19 20 27 25 6 7 - - - - -
Assurance Services 10 7 13 12 9 11 8 - - - - -
Engineering and Industrial Services 3 5 13 15 12 15 13 - - - - -
Infrastructure Services 13 12 13 14 12 17 13 - - - - -
Global Consulting (17) 0 0 0 0 0 0 - - - - -
Asset Leveraged solutions 47 23 50 38 (14) 13 (4) - - - - -
Business Process Outsourcing 4 6 8 8 8 4 9 - - - - -
Source: Nirmal Bang Institutional Equities Research

Institutional Equities
10 Tata Consultancy Services
Exhibit 13: P/E multiple charts
Source: Bloomberg, Nirmal Bang Institutional Equities Research Source: Bloomberg, Nirmal Bang Institutional Equities Research
Exhibit 14: P/E premium/(discount) chart of TCS over Infosys
Source: Bloomberg, Nirmal Bang Institutional Equities Research
-
500
1,000
1,500
2,000
2,500
Jul-0
8
Fe
b-0
9
Se
p-0
9
Ap
r-1
0
No
v-1
0
Jun
-11
Jan
-12
Au
g-1
2
Ma
r-1
3
No
v-1
3
Jun
-14
Jan
-15
Au
g-1
5
Ma
r-1
6
Oct
-16
Ma
y-1
7
De
c-1
7
Jul-1
8
Fe
b-1
9
Oct
-19
Price 5 10 15 20
(Rs)
5
10
15
20
25
30
Jul-0
8
Fe
b-0
9
Se
p-0
9
Ap
r-1
0
No
v-1
0
Jun
-11
Jan
-12
Au
g-1
2
Ma
r-1
3
No
v-1
3
Jun
-14
Jan
-15
Au
g-1
5
Ma
r-1
6
Oct
-16
Ma
y-1
7
De
c-1
7
Jul-1
8
Fe
b-1
9
Oct
-19
P/E Mean +1 SD -1 SD
(x)
(10)
(5)
0
5
10
15
20
25
30
35
40
Ap
r-1
5
Jul-1
5
Oct
-15
Jan
-16
Ap
r-1
6
Jul-1
6
Oct
-16
Jan
-17
Ap
r-1
7
Jul-1
7
Oct
-17
Jan
-18
Ap
r-1
8
Jul-1
8
Oct
-18
Jan
-19
Ap
r-1
9
Jul-1
9
Oct
-19

Institutional Equities
11 Tata Consultancy Services
Exhibit 15: Comparative valuation
TCS Infosys Wipro HCL Tech TechMahindra Mindtree Persistent
Year Ending March March March March March March March
Prices as on 10-Oct-19 2,004 783 239 1,064 711 725 567
Currency INR INR INR INR INR INR INR
Market Value (Rs Bn) 7,674 3,404 1,181 1,442 627 120 45
(US$mn) 106,586 47,272 16,405 20,032 8,710 1,665 630
September 2021 Target Price 1,593 607 223 1,150 563 567 525
Upside/(downside) -20.5% -22.5% -7.0% 8.1% -20.8% -21.7% -7.5%
Recommendation Sell Sell Sell Accumulate Sell Sell Sell
FDEPS (Rs)
FY18 67.0 32.5 16.8 62.9 42.8 34.6 40.4
FY19 83.1 36.0 18.6 73.5 48.1 45.8 44.1
FY20E 89.5 39.1 17.9 78.8 49.2 46.2 49.9
FY21E 93.0 40.3 18.7 84.2 54.4 55.2 51.8
FY22E 100.1 41.5 19.8 90.0 59.4 59.5 54.2
PE (x)
FY18 29.9 24.1 14.2 16.9 16.6 20.9 14.0
FY19 24.1 21.7 12.9 14.5 14.8 15.8 12.9
FY20E 22.4 20.0 13.4 13.5 14.5 15.7 11.4
FY21E 21.6 19.4 12.8 12.6 13.1 13.1 10.9
FY22E 20.0 18.9 12.1 11.8 12.0 12.2 10.5
EV/EBITDA (x)
FY18 23.5 17.4 11.9 11.3 11.4 14.4 9.9
FY19 18.9 15.8 9.4 9.4 7.9 10.0 7.2
FY20E 18.5 15.1 8.0 8.1 7.8 9.1 6.5
FY21E 17.5 14.2 7.3 7.7 6.6 7.7 5.7
FY22E 16.2 13.7 6.7 7.1 5.8 7.0 5.0
EV/Sales (x)
FY18 6.2 4.7 2.2 2.6 1.7 2.0 1.5
FY19 5.2 4.0 1.8 2.2 1.4 1.5 1.2
FY20E 4.8 3.7 1.6 1.9 1.3 1.3 1.0
FY21E 4.6 3.5 1.4 1.8 1.1 1.2 0.9
FY22E 4.3 3.4 1.3 1.6 1.0 1.1 0.8
Pre Tax ROIC (%)
FY18 57.3 44.9 24.5 38.9 25.8 32.9 29.7
FY19 61.8 47.5 30.4 36.3 37.9 46.4 44.2
FY20E 55.3 46.7 35.8 34.1 35.7 43.2 44.7
FY21E 55.0 45.2 35.9 31.4 36.9 51.4 50.1
FY22E 57.6 44.3 37.2 31.0 40.2 56.1 58.8
Source: Bloomberg, Nirmal Bang Institutional Equities Research
Institutional Equities
12 Tata Consultancy Services
Financials
Exhibit 16: Income statement
Y/E March (Rsbn) FY18 FY19 FY20E FY21E FY22E
Average INR/USD 64.5 70.1 71.9 74.6 76.4
Net Sales (USD mn) 19,089 20,913 22,090 22,336 23,179
-Growth (%) 8.6 9.6 5.6 1.1 3.8
Net Sales 1,231 1,465 1,588 1,665 1,771
-Growth (%) 4.4 19.0 8.4 4.8 6.3
Cost of Sales & Services 713 852 935 972 1,029
Gross Margin 518 613 653 693 742
% of sales 42.1 41.9 41.1 41.6 41.9
SG& A 213 239 265 282 295
% of sales 17.3 16.3 16.7 16.9 16.7
EBIT 305 375 388 412 446
EBIT Margin (%) 24.8 25.6 24.4 24.7 25.2
Other income (net) 36 41 52 46 47
PBT 341 416 440 458 493
-PBT margin (%) 27.7 28.4 27.7 27.5 27.8
Provision for tax 82 100 104 109 117
Effective tax rate (%) 24.1 24.1 23.6 23.7 23.7
Minority Interest 1 1 1 1 1
Net profit 258 315 336 349 376
-Growth (%) (1.8) 21.9 6.7 3.9 7.6
-Net profit margin (%) 21.0 21.5 21.2 21.0 21.2
Average Shares outstanding- Basic
3,829 3,790 3,752 3,752 3,752
Source: Company, Nirmal Bang Institutional Equities Research
Exhibit 18: Balance sheet
Y/E March (Rsbn) FY18 FY19 FY20E FY21E FY22E
Equity capital 1.9 3.8 3.8 3.8 3.8
Reserves & surplus 875 916 1,039 1,053 1,067
Net worth 876 920 1,042 1,057 1,071
Minority Interest - - - - -
Other liabilities 29 29 29 29 32
Total loans 2 1 - - -
Lease Laibilities 11 11 11
Total liabilities 908 950 1,082 1,097 1,114
Goodwill 39 40 40 40 40
Net block (incl. CWIP) 116 117 114 115 116
Investments 3 2 2 2 2
Deferred tax asset - net 34 26 29 29 32
Other non-current assets 76 59 64 64 69
Right of use asset 64 64 64
Other current assets 427 470 478 478 487
Debtors 320 330 361 361 407
Cash & bank balance 49 72 51 51 51
Bank deposits 21 54 105 119 91
Total current assets 815 926 995 1,008 1,035
Total current liabilities 176 221 226 226 245
Net current assets 639 706 769 783 791
Total assets 908 950 1,082 1,097 1,114
Source: Company, Nirmal Bang Institutional Equities Research
Exhibit 17: Cash flow
Y/E March (Rsbn) FY18 FY19 FY20E FY21E FY22E
EBIT 305 375 388 412 446
(Inc.)/dec. in working capital (20) (50) (18) (0) (41)
Cash flow from operations 285 325 370 411 405
Other income 36 41 52 46 47
Depreciation & amortisation 20 27 25 24 24
Financial expenses - - - - -
Tax paid (82) (100) (104) (109) (117)
Dividends paid (116) (136) (335) (335) (362)
Net cash from operations 143 157 9 39 (2)
Capital expenditure (19) (28) (23) (25) (25)
Net cash after capex 124 129 (13) 14 (27)
Inc./(dec.) in debt (0) (2) (1) - -
(Inc.)/dec. in investments 60 67 (13) - -
Equity issue/(Share Buyback) (160) (160) - - -
Cash from financial activities (101) (95) (14) - -
Others 5 23 56 (1) (1)
Opening cash 40 69 127 156 169
Closing cash 69 126 156 169 141
Change in cash 29 57 29 13 (28)
Source: Company, Nirmal Bang Institutional Equities Research
Exhibit 19: Key ratios
Y/E March FY18 FY19 FY20E FY21E FY22E
Per Share (Rs)
EPS 67.0 83.1 89.5 93.0 100.1
FDEPS 67.0 83.1 89.5 93.0 100.1
Dividend Per Share 25.1 29.9 74.0 74.0 80.0
Dividend Yield (%) 1.3 1.5 3.7 3.7 4.0
Book Value 228.9 240.3 272.2 276.0 279.6
Dividend Payout Ratio (excl DT) 37.2 36.0 82.7 79.6 79.9
Return ratios (%)
RoE 29.3 35.0 34.2 33.2 35.3
RoCE 30.7 35.7 33.7 33.6 35.9
Pre Tax ROIC (%) 57.3 61.8 55.3 55.0 57.6
Tunover Ratios
Asset Turnover Ratio 1.1 1.3 1.2 1.3 1.3
Debtor Days (incl. unbilled Rev) 95 82 83 79 84
Working Capital Cycle Days 63 72 68 65 69
Valuation ratios (x)
PER 29.9 24.1 22.4 21.6 20.0
P/BV 8.8 8.3 7.4 7.3 7.2
EV/EBTDA 23.5 18.9 18.5 17.5 16.2
EV/Sales 6.2 5.2 4.8 4.6 4.3
M-cap/Sales 6.2 5.2 4.8 4.6 4.3
Source: Company, Nirmal Bang Institutional Equities Research

Institutional Equities
13 Tata Consultancy Services
Rating track
* Post 1:1 Bonus
Rating track graph
1,000
1,200
1,400
1,600
1,800
2,000
2,200
2,400
Apr
-15
May
-15
Jul-1
5
Sep
-15
Nov
-15
Jan-
16
Mar
-16
May
-16
Jul-1
6
Sep
-16
Nov
-16
Jan-
17
Mar
-17
May
-17
Jul-1
7
Sep
-17
Nov
-17
Jan-
18
Mar
-18
May
-18
Jul-1
8
Sep
-18
Nov
-18
Jan-
19
Mar
-19
May
-19
Jul-1
9
Sep
-19
Not Covered Covered
Date Rating Market price (Rs) Target price (Rs)
13 April 2015 Sell 2,619 2,314
17 April 2015 Sell 2,574 2,325
10 July 2015 Sell 2,529 2,173
9 September 2015 Sell 2,540 2,173
5 October 2015 Sell 2,641 2,217
14 October 2015 Sell 2,599 2,248
8 January 2016 Under Review 2,398 -
13 January 2016 Under Review 2,327 -
14 March 2016 Sell 2,360 2,055
20 April 2016 Sell 2,520 2,089
15 July 2016 Sell 2,521 2,075
14 September 2016 Sell 2,359 2,041
14 October 2016 Sell 2,329 2,073
10 January 2017 Sell 2,304 1,952
13 January 2017 Sell 2,344 1,956
14 February 2017 Sell 2,414 1,983
21 February 2017 Sell 2,502 1,983
2 March 2017 Sell 2,477 1,983
19 April 2017 Sell 2,309 1,996
21 June 2017 Sell 2,443 1,923
14 July 2017 Sell 2,446 1,930
28 September 2017 Sell 2,475 1,908
13 October 2017 Sell 2,548 1,913
26 December 2017 Under Review 2,647 -
12 January 2018 Under Review 2,792 -
17 March 2018 Accumulate 2,829 3,155
20 April 2018 Accumulate 3,191 3,176
26 June 2018* Accumulate 1,818 1,812
11 July 2018 Accumulate 1,876 1,862
05 October 2018 Accumulate 2,063 2,145
12 October 2018 Accumulate 1,980 2,120
27 December 2018 Sell 1,892 1,712
7 January 2019 Sell 1,877 1,533
11 January 2019 Sell 1,883 1,545
18 March 2019 Sell 2,040 1,607
19 March 2019 Sell 2,023 1,607
15 April 2019 Sell 2,015 1,614
10 July 2019 Sell 2,120 1,601
23 September 2019 Sell 2,020 1,615
10 October 2019 Sell 2,004 1,593
Institutional Equities
14 Tata Consultancy Services
DISCLOSURES
This Report is published by Nirmal Bang Equities Private Limited (hereinafter referred to as “NBEPL”) for private circulation. NBEPL is a registered Research Analyst under SEBI (Research Analyst) Regulations, 2014 having Registration no. INH000001436. NBEPL is also a registered Stock Broker with National Stock Exchange of India Limited and BSE Limited in cash and derivatives segments. NBEPL has other business divisions with independent research teams separated by Chinese walls, and therefore may, at times, have different or contrary views on stocks and markets. NBEPL or its associates have not been debarred / suspended by SEBI or any other regulatory authority for accessing / dealing in securities Market. NBEPL, its associates or analyst or his relatives do not hold any financial interest in the subject company. NBEPL or its associates or Analyst do not have any conflict or material conflict of interest at the time of publication of the research report with the subject company. NBEPL or its associates or Analyst or his relatives do not hold beneficial ownership of 1% or more in the subject company at the end of the month immediately preceding the date of publication of this research report. NBEPL or its associates / analyst has not received any compensation / managed or co-managed public offering of securities of the company covered by Analyst during the past twelve months. NBEPL or its associates have not received any compensation or other benefits from the company covered by Analyst or third party in connection with the research report. Analyst has not served as an officer, director or employee of Subject Company and NBEPL / analyst has not been engaged in market making activity of the subject company. Analyst Certification: I, Girish Pai, research analyst and Seema Nayak Research Associate the author of this report, hereby certify that the views expressed in this research report accurately reflects my personal views about the subject securities, issuers, products, sectors or industries. It is also certified that no part of the compensation of the analyst was, is, or will be directly or indirectly related to the inclusion of specific recommendations or views in this research. The analyst is principally responsible for the preparation of this research report and has taken reasonable care to achieve and maintain independence and objectivity in making any recommendations.
Institutional Equities
15 Tata Consultancy Services
Disclaimer
Stock Ratings Absolute Returns
BUY > 15%
ACCUMULATE -5% to15%
SELL < -5%
This report is for the personal information of the authorized recipient and does not construe to be any investment, legal or taxation advice to you. NBEPL is not soliciting any action based upon it. Nothing in this research shall be construed as a solicitation to buy or sell any security or product, or to engage in or refrain from engaging in any such transaction. In preparing this research, we did not take into account the investment objectives, financial situation and particular needs of the reader.
This research has been prepared for the general use of the clients of NBEPL and must not be copied, either in whole or in part, or distributed or redistributed to any other person in any form. If you are not the intended recipient you must not use or disclose the information in this research in any way. Though disseminated to all the customers simultaneously, not all customers may receive this report at the same time. NBEPL will not treat recipients as customers by virtue of their receiving this report. This report is not directed or intended for distribution to or use by any person or entity resident in a state, country or any jurisdiction, where such distribution, publication, availability or use would be contrary to law, regulation or which would subject NBEPL & its group companies to registration or licensing requirements within such jurisdictions.
The report is based on the information obtained from sources believed to be reliable, but we do not make any representation or warranty that it is accurate, complete or up-to-date and it should not be relied upon as such. We accept no obligation to correct or update the information or opinions in it. NBEPL or any of its affiliates or employees shall not be in any way responsible for any loss or damage that may arise to any person from any inadvertent error in the information contained in this report. NBEPL or any of its affiliates or employees do not provide, at any time, any express or implied warranty of any kind, regarding any matter pertaining to this report, including without limitation the implied warranties of merchantability, fitness for a particular purpose, and non-infringement. The recipients of this report should rely on their own investigations.
This information is subject to change without any prior notice. NBEPL reserves its absolute discretion and right to make or refrain from making modifications and alterations to this statement from time to time. Nevertheless, NBEPL is committed to providing independent and transparent recommendations to its clients, and would be happy to provide information in response to specific client queries.
Before making an investment decision on the basis of this research, the reader needs to consider, with or without the assistance of an adviser, whether the advice is appropriate in light of their particular investment needs, objectives and financial circumstances. There are risks involved in securities trading. The price of securities can and does fluctuate, and an individual security may even become valueless. International investors are reminded of the additional risks inherent in international investments, such as currency fluctuations and international stock market or economic conditions, which may adversely affect the value of the investment. Opinions expressed are subject to change without any notice. Neither the company nor the director or the employees of NBEPL accept any liability whatsoever for any direct, indirect, consequential or other loss arising from any use of this research and/or further communication in relation to this research. Here it may be noted that neither NBEPL, nor its directors, employees, agents or representatives shall be liable for any damages whether direct or indirect, incidental, special or consequential including lost revenue or lost profit that may arise from or in connection with the use of the information contained in this report.
Copyright of this document vests exclusively with NBEPL.
Our reports are also available on our website www.nirmalbang.com
Access all our reports on Bloomberg, Thomson Reuters and Factset.
Team Details:
Name Email Id Direct Line
Rahul Arora CEO [email protected] -
Girish Pai Head of Research [email protected] +91 22 6273 8017 / 18
Dealing
Ravi Jagtiani Dealing Desk [email protected] +91 22 6273 8230, +91 22 6636 8833
Pradeep Kasat Dealing Desk [email protected] +91 22 6273 8100/8101, +91 22 6636 8831
Michael Pillai Dealing Desk [email protected] +91 22 6273 8102/8103, +91 22 6636 8830
Nirmal Bang Equities Pvt. Ltd.
Correspondence Address
B-2, 301/302, Marathon Innova,
Nr. Peninsula Corporate Park,
Lower Parel (W), Mumbai-400013.
Board No. : 91 22 6273 8000/1; Fax. : 022 6273 8010