Institutional Change in Old Industrial Areas – Lessons … prof. Michael Steiner Joanneum Research...
54
1 prof. Michael Steiner Joanneum Research Institute for Technology and Regional Policy Institutional Change in Old Industrial Areas – Lessons for Industrial Policy in the Transformation Process 1- Old industrial areas - examples for reconversion Problems of structural-industrial adaptation are a common feature of changing economies (an expression which comes close to a pleonasm). They are nowadays a dominating problem in countries in transition in so-called eastern Europe, they are a pertinent problem in specific regions of the so-called western world. Old industrial areas (OIAs) – in the context of the United States also called "rust belt" - as a typical form of a combination of regional and sectoral decline in these postindustrial economies have been treated extensively in the literature of industrial organization, regional economics and technological and social change (see e.g. Tichy 1981, 1986, Steiner 1985, 1990, Prisching 1985, Markusen 1985, Geldner 1989). They are typically characterized by a large industrial base going back to the last century (or longer), an overrepresentation of a few sectors leading to a monostructure, a domination of large, often nationalized firms with a limited range of products, a low mobility (both of firms and workers), above average wage levels, a well organized labour force, strong hierarchical organizations within the firms. In eastern Europe the starting point of transformation was a overdimensioned industry, characterized by nationalized big firms with a soft budget constraint by means of generous credits of nationalized banks, a restricted market orientation and a limited degree of competition from the world market (see e.g. Döhrn/Heilemann 1992, Brenton et al. 1997, Welfens 1997) – problems that seem very similar to those the OIAs in the western countries have or at least have had one or two decades ago. This paper implies the hypothesis that OIAs and the attempts of reconversion in the last ten to twenty years can serve as an example for transformation processes; it can
Transcript of Institutional Change in Old Industrial Areas – Lessons … prof. Michael Steiner Joanneum Research...

1
prof. Michael SteinerJoanneum ResearchInstitute for Technology and Regional Policy
Institutional Change in Old Industrial Areas – Lessons forIndustrial Policy in the Transformation Process
1- Old industrial areas - examples for reconversion
Problems of structural-industrial adaptation are a common feature of changing
economies (an expression which comes close to a pleonasm). They are nowadays a
dominating problem in countries in transition in so-called eastern Europe, they are a
pertinent problem in specific regions of the so-called western world. Old industrial
areas (OIAs) – in the context of the United States also called "rust belt" - as a typical
form of a combination of regional and sectoral decline in these postindustrial
economies have been treated extensively in the literature of industrial organization,
regional economics and technological and social change (see e.g. Tichy 1981, 1986,
Steiner 1985, 1990, Prisching 1985, Markusen 1985, Geldner 1989). They are
typically characterized by a large industrial base going back to the last century (or
longer), an overrepresentation of a few sectors leading to a monostructure, a
domination of large, often nationalized firms with a limited range of products, a low
mobility (both of firms and workers), above average wage levels, a well organized
labour force, strong hierarchical organizations within the firms.
In eastern Europe the starting point of transformation was a overdimensioned
industry, characterized by nationalized big firms with a soft budget constraint by
means of generous credits of nationalized banks, a restricted market orientation and
a limited degree of competition from the world market (see e.g. Döhrn/Heilemann
1992, Brenton et al. 1997, Welfens 1997) – problems that seem very similar to those
the OIAs in the western countries have or at least have had one or two decades ago.
This paper implies the hypothesis that OIAs and the attempts of reconversion in the
last ten to twenty years can serve as an example for transformation processes; it can
2
also be regarded as an argument for countries in transition to strengthen their
regional dimension of economic policy by establishing new administrative entities
and to reinforce regional policy actions.
OIAs in the West suggest that the geographical concentration of industrial sectors (in
quite various sectors ranging from raw materials like coal and ore to textiles, car
production, watches and furniture - to name but a few) can grow old and petrify
under certain conditions: these areas tend to become inflexible, and in the worst
cases, unable to adapt to a new environment. Different theoretical answers (not quite
incompatible) have been given why this happens, why OIAs cannot adapt to new
conditions; why they cannot develop new products, why they cannot adapt their
skills; why their old specialisation cannot meet demand any more. In this sense they
can serve as examples why and how market processes under certain conditions are
not capable to prevent aging and petrification.
This calls for a design of policy strategies and instruments. Economists who strongly
believe in the allocative power of markets may object to this (in their view) misplaced
task of policy. Yet history has proven that rejuvenating OIAs is possible and that this
process of rejuvenation was definitely (and positively) influenced by policy. Economic
policy was necessary and in many cases successful - not in the form of subsidies
and public ownership, but by:
• improving infrastructure,
• creating access to various kinds of information,
• a differentiated form of social policy,
• the support of new firm creation,
• deregulation,
• an induced change of mentality.
All in all, it was a well designed change of an institutional framework with new
incentive structures. It is in this sense that OIAs and regional and
industrial/technology policy oriented towards them can serve as an example for
processes of transformation - this policy with ist strategies and instruments should be

3
interpreted as creating accommodating institutions for change in times of insufficient
incentives for endogenous improvement.
In the following theoretical interpretations for reasons of stagnation in OIAs in the
western economies will be given, then empirical assessments to characterize OIAs
will be made taken as an example the northern part of Styria/Austria, pointing to
indicators of stagnation but also to subsequent accommodated change, then policy
measures and instruments used for conversion will be listed and finally some
conclusions concerning the strategy of policy induced change and the
appropriateness of these experience for countries in transition will be drawn.
4
2- Theoretical foundations to explain the changing fortunes of OIAs
A first and necessary first step of theory based knowledge creation consisted in the
important insight that the problems of these areas were specific in kind and not just a
transient feature of general economic development accidentally scattered in space.
And for a while is was disputed that OIAs are a special type of problem regions.
Some of the presumed characteristics were to be seen in other regions too as single
factors: concentration of specific sectors (e.g. agriculture, tourism), a small number
of big firms (which sometimes also happens in urban agglomerations), a small
portion of a qualified service sector.
The fact that the term "OIA" was up to the mid80s disputed may be traced to the fact
that up to then it was a dominating concern of (regional) economists to explain
regional disparities and to recommend policy measures to prevent or at least to
attenuate them. Frequently, attention has been paid to parts of a national economy
which were considered as "structurally weak", "declining", "areas of economic stress"
without analysing in detail the specific form of disparity. Another reason for the
difficulty in defining the specific character of OIAs rested in the (up to then) inability
of growth theories to explain the "turning point" in the development of (regional)
economies: OIAs were formerly prosperous, rich economies the dynamics of which
have been lost and the income and standard of living of which are in decline. Growth
models usually only put forward one direction of development and put emphasis on
one element of stagnation (an early exception was Olson 1982 who put forward an
explanation for the rise and decline of nations).
Yet at the beginning of the 80s several explanations were put forward that focussed
on some of the specificities of these areas and tried to explain their changing (and
declining) fortunes.
a)The "structural" approach tried to explain the decline in terms of the composition of
its sectors. Indeed it was very tempting to explain the decline in terms of "structure"
particularly if the economy of the unit under scrutiny is characterized by
monostructure.

5
Yet this approach – beside the vagueness of the term (for an eloquent criticism see
already Machlup 1958) – suffered from two essential shortcomings: The first is the
rather weak theoretical content; in rudimentary structural theory the change in the
proportion of sectors and industries is regarded as a result of economic
development. If we consider the contribution of such theories to the study of growth,
they do not give any clear causal information but put forward an interdependent
process of structural change and economic growth. They also left open the question
of how to define a "desirable" structure. This was the core of the debate on balanced
or imbalanced growth were the one position – in the tradition of Hirschman (1958) –
regards imbalances and deviations of a balanced growth path as advantegeous, and
the other – following Chenery (1960, 1969) and Kuznets (1958) – arguing for the
necessary adjustment to a spatially and temporally invariant growth path (socalled
"normal patterns of growth").
These theories, especially the (various) versions of shift-share analysis, cannot be
regarded as a causal clarification of the connection between a given structure and
resulting growth – they are ex post rationalizations of deviations of regional growth
rates from national growth rates. The second shortcoming is that the countless
studies undertaken were unable to show the dominant influence of the structural
component1. This is not to suggest that the "structural" explanation must be
dismissed completely. After all, in most studies, approximately half of the growth
differential is explained by the structure. In addition, the attempt to define the
problems of OIAs in terms of the structural composition of their industry may be the
starting point for an analysis and may lead to further considerataions which go
beyond the purely compositional aspect of structure: Chinitz (1961) made the
important point that a particular structure can have a negative influence on important
characteristics of the supply side, such as entrepreneurial behaviour, accessibility to
capital, high waves, level of skill of the work force, environmental conditions etc. All
this means, however, is that the decline of OIAs cannot be explained exclusively in
terms of structure in the traditional sense of sectoral compositions.
1 The weak explanatory content of "structural" explanations is not only a result of the crude explanatoryapproach of shift-share analysis. The same picture emerges from a theoretically more sophisticatedmodel of normal growth pattern (Steiner, 1981).

6
b) A step further went the "sclerosis approaches", an expression going back to
Kindleberger (1978), sometimes also – more technically – called as "blockage of
endogenous renewability" (Geldner 1983). The basic assumption here is that
adaptive mechanisms do not work any more and that behavioural potentials have
been reduced: this leads to an overemphasis of distributional aspects instead of
efficiency, the existence of strong ties leading to collusion and reducing the necessity
to strong performance. The external conditions for "entrepreneurial alertness" (a
notion introduced by Kirzner (1980) in the tradition of Schumpeter) have deteriorated,
the subjective element of entrepreneurial behaviour has been negatively influenced
by objective preconditions ( the "entrepreneurial climate").
This raises the question why this happens especially in OIAs. One part of the answer
is given by theories of "bounded rationality" (Simon 1959, 1983, Cyert/March 1963)
assuming rigidities in the mechanisms of finding and processing information –
externalities are an important factor for these mechanisms leading to a diversion of
the logics of individual and collective action. These mechanisms have a clear
regional and sectorspecific dimension (Tichy 1979, Prisching 1985): Industries and
regions having a long success story are not any more able to take up the relevant
market signals, the petrification of structures and the routines of decision making
leads to misjudgements and misconceptions. The spatial dimension here includes
not only geographical distance, but informational aspects of lacking economies of
urbanization and agglomeration because of the similarity in behaviuor resulting in
locally bounded rationality.
This bounded rationality is also reinforced by strong distributional coalitions. Olson
(1982) emphasises the negative effects of collusions of social groups which are able
to influence political decisions in their own favour. They are the stronger the longer
societies and economies grow in a stable way – it takes a long time to build up such
coalitions but once they are installed they are able to exercise rent seeking
behaviour. OIAs with a long past of industrialization and wealth are strongly
influenced by such coalitions comprising managers, unions and politicians leading to
higher wages and prices and preventing mobility and flexibility.

7
The increasing age and rising wealth of these institutions also leads to different
behaviour and changes the mentality: less efficiency and motivation for work. This
"Buddenbrook-approach" (as it is called by Tichy (1987) because of the decline of
this family in later generations in Th. Mann's famous novel) symbolizes the
correspondence of age and welfare with changing values and diverting interests.
c ) These approaches have been taken up and integrated in a systematic way in a
cyclical-evolutionary interpretation of regional development and spatial concentration
of sectors and industries. It combines Vernon's (1966) and Hirsch's (1967)
contribution to a product cycle in international trade with evolutionary theories of
economic change (Nelson/Winter 1982) and "Austrian" interpretations of the creative
function of the market:
Besides the allocative function of the market - and this is usually less emphasized -
there is also a further function: the market is an instrument which transfers incentives
for economic change. This emphasis on the market's creative function started with
the Austrian school of economic thought. Hayek, especially, underlined the
explorative potential of the market - its capabilities do not rest so much in the
allocation, but in its flexibility in adjusting to new situations. The market is an optimal
process of exploration, it is a development process. In the same sense, Schumpeter
always regarded the market as a process and not as a state: economic competition
is not price-taking behaviour under conditions of perfect competition, but a process
with winners and losers.
The evolutionary aspect in this approach is the necessity for adjustment; economic
agents are in an interplay with their surroundings. The concept of selection means
that they either have to adjust or they perish: non-survival of the non-fit. Yet this
performance of adjustment has to be differentiated. It can mean adaptibility or
adaptation (Prisching, 1986): adaptation is a reaction to the surroundings, it is an
optimal use of the exterior facts; adaptability, in contrast, means keeping open
structures and resources which are not bound for specific purposes but which are
available for necessary reorganizations in times of new challenges - here, adaptable
behaviour is dominant. These contrasting forms of behaviour – the one creative, the
other allocative – may be regarded as being united in an evolutionary process with

8
spatial consequences (Ellinger 1977). This behaviour is dependent of the age of the
firms. In the early stage, firms are not limited in regard to their location decision. In
the early stages of growth, the combination of super profit and of imperfect
competition (because of existing limits to capital mobility and because of price
inelastic demand) allows for successful development without consideration of
regional differences in costs of location (Markusen, 1985). This is the consequence
of the specific decision-making behaviour of these firms: they are "adaptable", i.e.
they are either innovators themselves or quickly adopt innovations; they decide to
start production soon after a major innovation. In later stages this behaviour
changes: the firms become "adaptive" - they adjust to their economic and regional
environment. Their behaviour becomes "locationally decisive" in locational costs.
Both forms of entrepreneural behaviour - the adaptable and the adaptive - thus
follow a temporal sequence; the spatial consequences are part of an evolutionary
process. Yet the basic freedom of location in the early phase is restricted in real
space and in real time - the resources which are necessary for adaptable behaviour
cannot be attracted everywhere. From this there results an interrelationship between
the locational needs of innovative firms and the manifold factors of production which
are necessary for adaptable behaviour. On the other hand, the distribution of
regional supplies of such factors is not independent of the distribution of such firms -
the location and the situation of many factors can be influenced by the decisions of
firms in their innovative stage.
These different kinds of behaviour demand certain economic environments with
special resources. The difference in regional economic potential therefore resides in
these specific factors which are characteristic of each evolutionary stage. At the
same time, they correspond to the different behaviour and the adjustment
performances which these supplies of factors allow to be produced - the regional
distribution of factors of production depends in the long run on the behaviour of a
region's firms. Old industrial areas accordingly are regions with an insufficient
adjustment performance, deficient in adaptation, which results in negative selection
either because an "over adjustment" led to a dead end of the evolution or because a
too rapid change of the environment (to which there was no timely reaction)
exceeded the potential for adjustment; "non-adapted" regions stagnate, they have

9
lost their potential to survive, their dominating firms were too stable; "complete
stability results in stagnation" (Radnitzky, 1984). These old industrial areas are
neither "adaptable" nor "adapted". In this type of region the failure of the creative
function of the market is evident - no new opportunities are found, no hitherto
unknown combinations are taken up, no markets are created.
Attempts to get empirically testable results described each cyclical-evolutionary
stage and its dominating behaviour with concrete characteristics (Geldner 1989,
Steiner 1990). For OIAs the following variables proved to be decisive
(Steiner/Belschan 1991): In these regions a lack of entrepreunerial behaviour having
no discretionary power, only control over routine production is to be expected. This
kind of behaviour can be represented by variables such as large plants with strong
internal hierarchies, a strong dependence on external headquarters, and weak
(regional) competition through the entry of potential new producers (Chinitz, 1961).
Research and development expenditure is below average, marketing is not very
important, and the rate of innovation is low (both in respect to products and to
markets; if there are innovations at all they tend to be process innovations). The
attempt to preserve market power through a strategy of cartelization (Markusen,
1985) has also led to specific behaviour on the part of employees: strong
unionization with strong bargaining power leading to high wages (Steiner, 1985). We
also expect a sectorial concentration with a marked vertical integration and high
capital intensity. Oligopoly power and high wages create barriers for entry and exit of
new and old plants. The formation of new firms and the death of firms is low
(Steiner/Posch, 1985).
This life cycle interpretation cal also be extended to hypotheses concerning
performance indicators and labour market outcomes (Steiner 1990 a, Kubin/Steiner
1992). Different regional potentials have implications for the labour market outcome,
not only for the overall labour market result as measured by the traditional rate of
unemployment and rate of vacancies, but also with respect to the underlying labour
market dynamic. This last aspect is suggested by approaches to labour market
statistics splitting the stock figures into their two components, incidence and duration
(Sallant, 1977, Clark/Summers, 1979, Akerlof/Main, 1981), which have been
developed in connection with the rise of search models in labour market theory

10
(Phelps, 1970). It also conforms to the theoretic perspective of segmented labour
markets.
In contrast to neoclassical interpretations of labour markets as rather homogenous,
the theory of segmented labour markets stresses their differences. The main
difference lies in the two segments: a primary one with "good" jobs with high wages,
stable employment and the possibility of upward mobility, a secondary one with "bad"
jobs offering low pay, high fluctuation and little chance fo advancement. This
approach (Piore, 1975) relates labour market behaviour to certain characteristics of
product demand which we expect to differ regionally. It also relates to the theoretical
characteristics of the regions thus allowing differentiation of the labour market
structure of the regional types.
Relying on this approach we presume that global labour market performance differs
between regions, that labour market structure within a single regions tends to be
homogeneous, and that this structure should differ between regions: Firms in old
industrial areas have adjusted their production technology too much to their former
economic environment. This over-adaptation leads to insufficient results in the face
of changing circumstances preventing any creative strategy as well as any passive
reaction to these external changes. Their product demand used to be highly stable.
Under these conditions an inflexible technology is chosen, combining great amounts
of fixed capital and a primary labour force of the lower tier showing highly specific
productive traits. The traditional employment behaviour found in old industrial areas,
characterized primarily by a high portion of specifically skilled blue-collar workers and
a low female participation rate, on the one hand rendered this areas attractive for this
type of standardized production, while on the other hand is defined itself by the
employment structure offered by the big enterprises found in this regions. This
primary structure, that also results in comparatively high wages, was rendered
possible by a former monopolistic power in product markers (indicated by the size of
plants).

11
3- An empirical assessment - the case of Upper Styria
3. 1 Regional Characteristics of Upper Styria
The province of Styria is located in the south-east of Austria, bordered on Slovenia in
the south and close to Hungary. From the Austrian as well as the EU perspective, it
is in a peripheral and border location.
Within the Austrian federal constitution it has the status of a Bundesland with own
provincial government and parliament (Landtag). Despite a number of formal
competencies and economic development, the autonomous financial means of the
Länder to perform them are not too strong.
Styria’s population of 1.2 million - spread over 16,000 sq. km – contributes 12% to
the Austrian GDP. With its topography it has relatively strong populated planes and
valleys with urban-industrialised areas and low settled Alpine-dales with primary
industry.
As a region of basic industry its role was strong in the past but it has been declining
continuously since the 1960s.
Within the province, several subregions can be identified:
• Upper Styria, the case study region, consists of the 6 political districts Bruck an
der Mur, Leoben, Judenburg, Knittelfeld, Liezen and Mürzzuschlag. Austrian
industrial development originated in this region, based on the iron-ore from the
Erzberg as well as on natural resources like coal, timber and water power from
Alpine valleys. Since Alpine rivers were used for transportation as well, the iron-
and steel industry as well as forward linked metal based industries have
developed along the river valleys of Mur, Mürz and Enns.
The region, an old industrial area (OIA) is periphery located in a broader view.
Connections to Western- and Central European agglomeration are weak, even
transport towards Vienna and Graz is to improve. Inner-regional transportation
facilities along the Mur-/Mürz river valley has been improved whereas side-valleys
traffic facilities suffers from its topography.
• Graz, capital of Styria and own political district with a population of about 250,000
is the economic and political centre of Styria. It has a tradition and industrial base
in mechanical engineering, machinery industry and vehicles. International

12
established firms, research institutions, knowledge suppliers (incl. 3 Universities)
and special services are located in the urban area. Income levels are higher and
labour market indicators show a better performance than the average of Austria
and the EU.
• Rural periphery to the south, minor industrial structured until the 1970s, has
undergone industrialisation since then. Besides labour intensive industries such
as leather, textile and clothing there are modern sectors such as electrical
products, electronics and machinery present as well.
Styria, thus has a mix of traditional and modern industries, of types of subregions as
well as policies.
Styria’s regional economy is dominated by the manufacturing sector, which produces
21% of the GRP. The economically most important regions are Upper Styria and the
capital Graz (and surroundings), both with a long-lasting industrial tradition.
Upper Styria was heavily based in the manufacturing of iron ore and coal, leading to
the development of inflexible economic structures and the inability to adjust to
changing economic conditions. As a consequence, serious economic problems
indicated by low growth rates of industrial production, high unemployment and
migration rates which are jeopardising the economic competitiveness of the whole
region.

13
Fig. 3- Location of Austria/Styria
UdineLjubljana
Maribor
Budapest
Bratislava
Prag
Sopron
Wien
Graz
Linz
Salzburg
AUSTRIA
Innsbruck
München
Zagreb
Dresden
St. Gallen
Nürnberg
Stuttgart

14
Facts & Figures: (census 1991)
Inhabitants: 355,858Persons employed: 189,554Dominating industries:- mechanical engineering and steel
construction, environ-mental technology: 6,262 empl.
- automotive engineering: 4,749 empl.- electrical and electronic
engineering: 1,774 empl.- food industry: 1,732 empl.
3.1.1 Characteristics “Old Industrial Area”: Upper Styria, late 1970s:
Table 3.1(USt = Upper
Styria
St = Styria A = Austria)
Monostructure: Share of Employees in first- and second largest industry
USt 60% St 38% A 24%
Large-scale Enterprises: Average Employees / enterprise
USt 180 St 121 A 94
Low productivity: Output / Employee
USt 100 St 108 A 129
High wages & low qualification: Average wage / Employee
USt 100 St 97 A 101
Low productivity-growth: 1972-78
USt +30% St +40% A +60%
Low newly founded enterprises: Workplaces in new / shut-down enterprises
Between 1976 – 80 in % of total industrial employment 1978
Foundation-rate USt 1.1 St 3.4 A 4.0
Shut-down rate USt 1.5 St 2.9 A 4.1
Source: Tichy (1994b), p. 351.
R e g i o nG r a z
S T Y R IA

15
3.2 Upper Styria in Transition – Descriptive Indicators
3.2.1 Demographic Figures
According to Table 3.2, the total population in Styria was slightly decreasing by -0,2%
between 1981 and 1991. In Upper Styria, the reduction was stronger (-3,7%). On
political district level, a especially strong decrease could be observed in Leoben (-
8,9%) and Bruck/Mur (-5%).
Table 3.2 Age Groups
�������������������������������������������������������������������������������������������������������������������������������������������������������������������������������������������������������������������������������������������������������������������������������������������������������������������������������������������������������������������������������������������������������������������������������������������������������������������������������������������������������������������������������������������������������������������������������������������������������������������������������������������������������������������������������������������������������������������������������������������������������������������������������������������������������������������������������������������������������������������������������������������������������������������������������������������������������������������������������������������������������������������������������������������������������������������������������������������������������������������������������������������������������������������������������������������������������������������������������������������������������������������������������������������������������������������������������������������������������������������������������������������������������������������������������������������������������������������������������������������������������������������������������������������������������������������������������������������������������������������������������������������������������������������������������������������������������������������������������������������������������������������������������������������������������������������������������������������������������������������������������������������������������������������������������������������������������������������������������������������������������������������������������������������������������������������������������������������������������������������������������������������������������������������������������������������������������������������������������������������������������������������������������������������������������������������������������������������������������������������������������������������������������������������������������������������������������������������������������������������������������������������������������������������������������������������������������������������������������������������������������������������������������������������������������������������������������������������������������������������������������������������������������������������������������������������������������������������������������������������������������������������������������������������������������������������������������������������������������������������������������������������������������������������������������������������������������������������������������������������������������������������������������������������������������������������������������������������������������������������������������������������������������������������������������������������������������������������������������������������������������������������������������������������������������������������������������������������������������������������������������������������������������������������������������������������������������������������������������������������������������������������������������������������������������������������������������������������������������������������������������������������������������������������������������������������������������������������������������������������������������������������������������������������������������������������������������������������������������������������������������������������������������������������������������������������������������������������������������������������������������������������������������������������������������������������������������������������������������������������������������������������������������������������������������������������������������������
Structure of Agegroups 1971-2011
Political District< 15 years 15 - 60 y. > 60 years < 15 years 15 - 60 y. > 60 years
Bruck / Mur 13.497 44.765 13.068 10.744 41.831 15.199Judenburg 11.097 32.342 9.201 8.779 30.864 10.469Knittelfeld 6.557 17.969 5.582 5.343 17.850 6.333Leoben 14.610 49.592 16.316 10.608 44.894 17.870Liezen 17.953 48.791 13.578 15.265 49.671 16.416Mürzzuschlag 9.112 28.476 8.752 7.515 26.760 10.487
Upper Styria 72.826 221.935 66.497 58.254 211.870 76.774Styria 248.949 719.058 218.518 207.739 732.989 243.992Austria 1.510.564 4.591.116 1.453.658 1.356.806 4.874.252 1.564.728Source: AK (1998), ÖROK-Bevölkerungsprogrnose II, ÖROK-Schriftenreihe, Nr. 79 (1990).ÖSTAT, VZ 1971, VZ 1981, VZ 1991
1981 1991
Focusing on the age groups, especially the working-group (15-50 years), an increase
of +1,9% can be observed.
For Upper Styria, a contrary result is true: a decrease by –4,5% could be observed
between 1981 and 1991, mainly due to outward migration of –12.603 (absolute).
Comparing the working agegroup with employment figures (see 3.2.2.1), a difference
between those two numbers becomes obvious. Reasons for this gap could include
either an increasing employment rate, an early entry into active/professional life, a
retarded leave or inbound commuting.

16
In Upper Styria, 9.000 jobs were cut in the nationalised industry, further 4.000 in the
service sector due to shrinking tourism (see Tichy, 1994c, p.29).
Private industry created 1.000 additional jobs. Population in employment age
decreased by –10.000 due to outward migration by more than 12.600 mainly from
the political districts Leoben, Bruck/Mur and Judenburg.
A dominant question is where all unemployed had remained. According to
Steiner/Wendner (1993) the answer is outward migration – not of unemployed who
retired early – but of their children who had left the region. Therefore the share of 15-
60 years of age in total population declined in all Upper Styrian districts, while it rose
in all other Styrian districts. A significant drain from the district capitals Leoben (-
6,5%) and Bruck/Mur (-6%) could be noted only within a decade. This drain of
initiative population reflects a relatively pessimistic attitude under the OIA’s
population (see Tichy, 1994c, p. 28ff.).2
3.2.2 Labour Market
Comparing stagnant regions with innovative regions, they have a higher duration of
unemployment, accompanied by a higher share of long-term unemployment. Due to
a low flow of new vacancies, the rate of job-vacancies is lower as well. When people
become unemployed in stagnant regions, they usually remain unemployed for a
longer period due to lower vacancies (see Kubin/Steiner, 1992).
Kubin/Steiner point out that – in the regional context – labour market problems were
not one-dimensional phenomena. Therefore an analysis of several available labour
market indicators at the same time is required and their specific pattern noted.
Concentrating only on one single indicator, e.g. the most common unemployment
rate, would be misleading in this view. Analysing Upper Styria’s labour market will
therefore include the following relevant indicators:
2 The forecast for 2011 predicts a further –5,7% population decrease. However this forecast is underdiscussion by Tichy (1998) and Münz (1999). An analysis of registration data for the period of 1991-96refuted the ÖROK’s quinquennial forecasts. Specially the newly introduced regional in- and outwardmigration is under heavy dispute. While the forecast predicted an absolute change of –917, i.e. 917persons leaving Upper Styria, the analysed registration data returned an inward migration of +60persons. Tichy therefore questions the forecast figures till 2011. He argues that the reason for outwardmigration – structural changes and declining industry during the 1980s – had ceased and thataccordingly the forecast is based on a false trend (see Tichy, 1998). A disputes' settlement - whetherincrease or decrease - will only occur with new census data expected in 2003.
17
• Employment numbers; change between 1981/91; per sector employment;
employment in service/ technological sector,
• Education and qualification of the population and its distribution among
employees,
• Unemployment figures analysing trends in the unemployment rate between
1981/98; focus on young/ elderly unemployed; long-term unemployment.
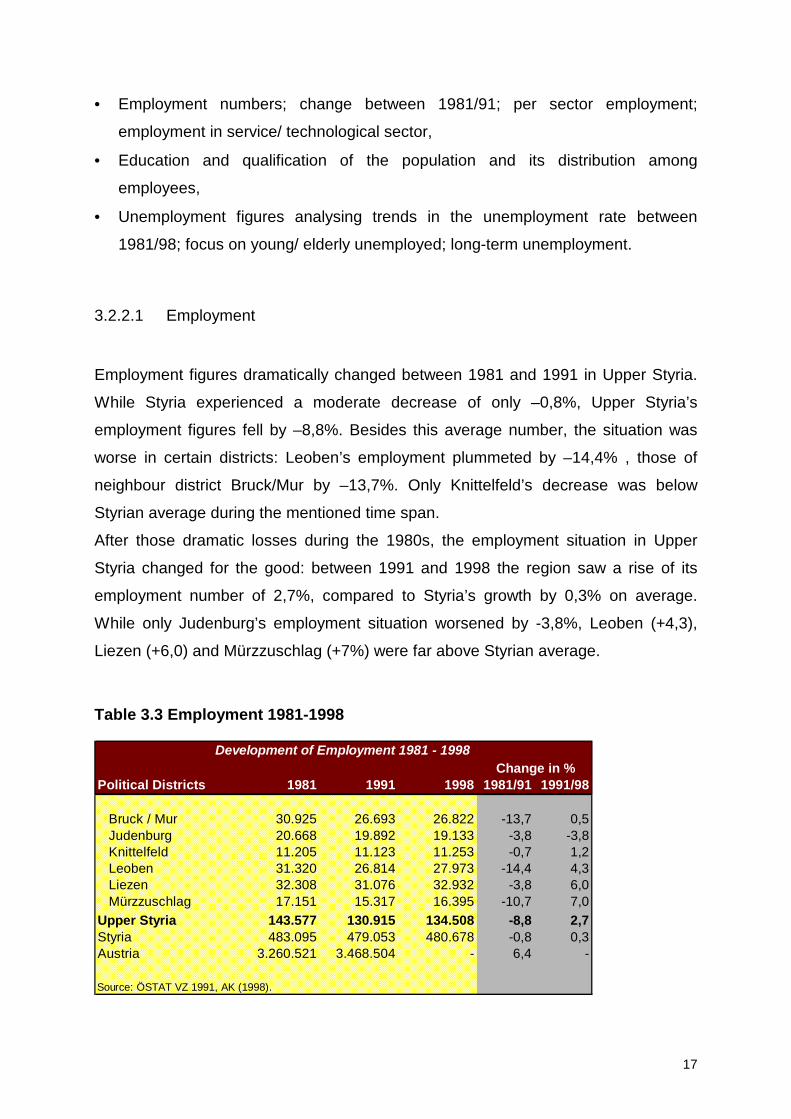
3.2.2.1 Employment
Employment figures dramatically changed between 1981 and 1991 in Upper Styria.
While Styria experienced a moderate decrease of only –0,8%, Upper Styria’s
employment figures fell by –8,8%. Besides this average number, the situation was
worse in certain districts: Leoben’s employment plummeted by –14,4% , those of
neighbour district Bruck/Mur by –13,7%. Only Knittelfeld’s decrease was below
Styrian average during the mentioned time span.
After those dramatic losses during the 1980s, the employment situation in Upper
Styria changed for the good: between 1991 and 1998 the region saw a rise of its
employment number of 2,7%, compared to Styria’s growth by 0,3% on average.
While only Judenburg’s employment situation worsened by -3,8%, Leoben (+4,3),
Liezen (+6,0) and Mürzzuschlag (+7%) were far above Styrian average.
Table 3.3 Employment 1981-1998
��������������������������������������������������������������������������������������������������������������������������������������������������������������������������������������������������������������������������������������������������������������������������������������������������������������������������������������������������������������������������������������������������������������������������������������������������������������������������������������������������������������������������������������������������������������������������������������������������������������������������������������������������������������������������������������������������������������������������������������������������������������������������������������������������������������������������������������������������������������������������������������������������������������������������������������������������������������������������������������������������������������������������������������������������������������������������������������������������������������������������������������������������������������������������������������������������������������������������������������������������������������������������������������������������������������������������������������������������������������������������������������������������������������������������������������������������������������������������������������������������������������������������������������������������������������������������������������������������������������������������������������������������������������������������������������������������������������������������������������������������������������������������������������������������������������������������������������������������������������������������������������������������������������������������������������������������������������������������������������������������������������������������������������������������������������������������������������������������������������������������������������������������������������������������������������������������
Development of Employment 1981 - 1998 Political Districts 1981 1991 1998 1981/91 1991/98
Bruck / Mur 30.925 26.693 26.822 -13,7 0,5Judenburg 20.668 19.892 19.133 -3,8 -3,8Knittelfeld 11.205 11.123 11.253 -0,7 1,2Leoben 31.320 26.814 27.973 -14,4 4,3Liezen 32.308 31.076 32.932 -3,8 6,0Mürzzuschlag 17.151 15.317 16.395 -10,7 7,0
Upper Styria 143.577 130.915 134.508 -8,8 2,7Styria 483.095 479.053 480.678 -0,8 0,3Austria 3.260.521 3.468.504 - 6,4 -
Source: ÖSTAT VZ 1991, AK (1998).
Change in %

18
Employment in Sectors
Analysing the census data, employment’s participation in the three different
economic sectors changed remarkably between 1981 and 1991.
The primary sector’s overall share decreased by 1,8 percentage-point (pp) in Upper
Styria and 3,8pp on Styrian average. The decrease was therefore not as strong as
on provincial average. Only Liezen and Judenburg had to face over-proportional
decreases in the primary sector’s employment among the districts in the case study
region.
Within the secondary sector, regional changes become more significant.
Styria’s share in the secondary sector fell by 4,5pp from 42,2% to 37,7%. The overall
development in Upper Styria was more dramatic: the share fell by 7,4pp to 41,8% in
1991, compared with 49,2% in 1981.
The strongest decrease occurred in Leoben with a reduction of –9,1pp from 49,9% to
40,8%. Neighbour district Bruck/Mur figures were down from 53,5% (1981) to 45,0%
in 1991. Both districts had above-average changes with a gap of 1,7pp and 0,9pp
respectively to the regional average.
Analysing the service or tertiary sector, Upper Styria performed well: with a rise of
the share from 42,6% to 51,8% in overall tertiary sector employment, the gain of
9,2pp is clearly above Styrian average of 8,2%. Liezen (+9,6), Leoben &
Mürzzuschlag (+9,5%) and Bruck/Mur (+9,4%) where above inner regional average.
Especially Leoben and Bruck/Mur could compensate lost shares within the
secondary sector with strong growth in the service-sector industry.

19
Table 3.4 Sectional Employment
������������������������������������������������������������������������������������������������������������������������������������������������������������������������������������������������������������������������������������������������������������������������������������������������������������������������������������������������������������������������������������������������������������������������������������������������������������������������������������������������������������������������������������������������������������������������������������������������������������������������������������������������������������������������������������������������������������������������������������������������������������������������������������������������������������������������������������������������������������������������������������������������������������������������������������������������������������������������������������������������������������������������������������������������������������������������������������������������������������������������������������������������������������������������������������������������������������������������������������������������
��������������������������������������������������������������������������������������������������������������������������������������������������������������������������������������������������������������������������������������������������������������������������������������������������������������������������������������������������������������������������������������������
����������������������������������������������������������������������������������������������������������������������������������������������������������������������������������������������������������������������������������������������������������������������������������������������������������������������������������������������������������������������������������������������������������������������������������������������������������������������������������������������������������������������������������������������������������������������������������������������������������������������������������������������������������
������������������������������������������������������������������������������������������������������������������������������������������������������������������������������������������������������������������������������������������
Employment per Sector in %
Political District1981 1991 1981 1991 1981 1991
Bruck / Mur 5,3 4,4 -0,9 53,5 45,0 -8,5 41,2 50,6 9,4Judenburg 9,0 6,9 -2,1 52,6 46,1 -6,5 38,5 47,0 8,5Knittelfeld 10,1 8,6 -1,5 45,4 38,2 -7,2 44,4 53,2 8,8Leoben 4,4 4,1 -0,3 49,9 40,8 -9,1 45,6 55,1 9,5Liezen 12,2 8,5 -3,7 39,9 34,0 -5,9 47,9 57,5 9,6Mürzzuschlag 8,2 6,1 -2,1 54,0 46,6 -7,4 37,8 47,3 9,5
Upper Styria 8,2 6,4 -1,8 49,2 41,8 -7,4 42,6 51,8 9,2Styria 12,4 8,6 -3,8 42,2 37,7 -4,5 45,5 53,7 8,2
Source: ÖSTAT, LASTAT, VZ 1991, Ergebnisse III, Heft 1/96, Graz.
SectorPrimary Secondary Tertiary
At present (1998), service sector and technological sector are expanding in Upper
Styria, partly with above average figures.
Analysing the service sector between 1996 and 1998, Upper Styria saw constant
above-average growth during the recent two years. A +7,2% gain for 1995/96
followed an outstanding increase in 1996/97 by +10,9%. In 1998, growth rates were
even triple higher than Austrian- and 2 ½ times higher than Styrian average.
Within the technological sector, the OIA’s growth rates were in any year above
Austrian average but slightly lower than provincial average. This may result from the
relatively strong position of the Styrian Automobile Cluster, where spill-over effects to
Upper Styria seem to be effective: while Austria’s employment within the
technological sector decreased since three years, Upper Styria’s grew constantly
between 2,5 and 3%.
20
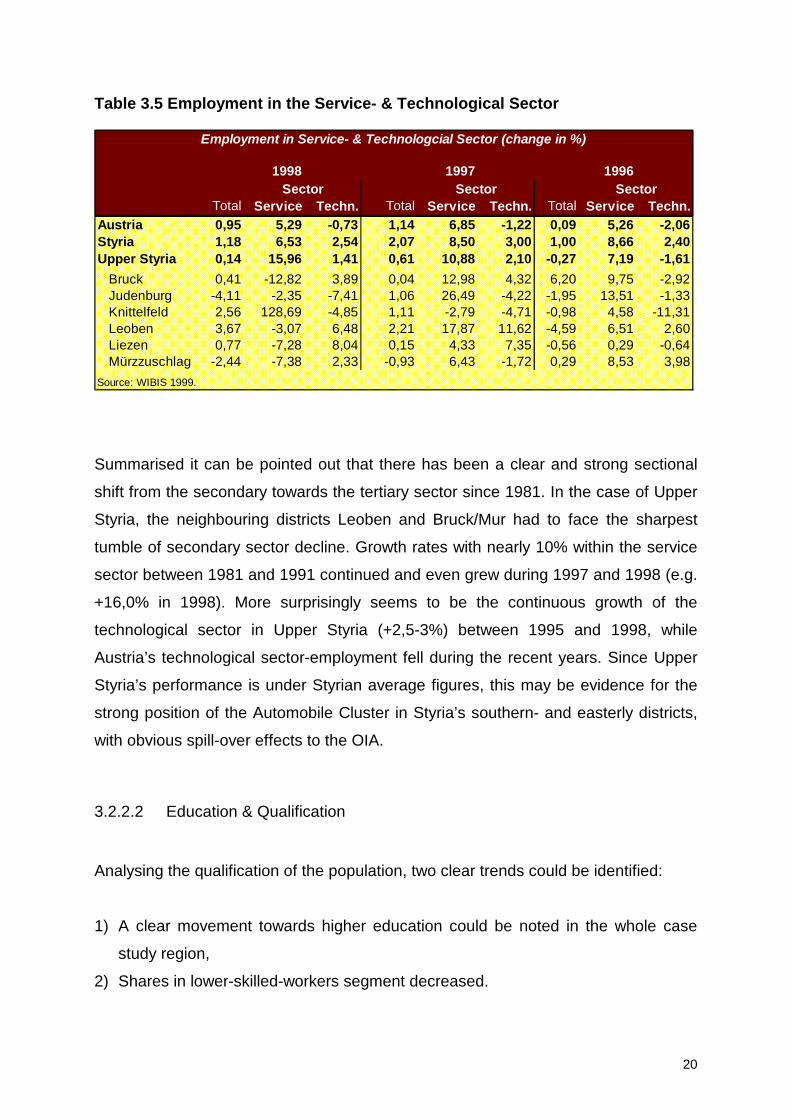
Table 3.5 Employment in the Service- & Technological Sector
������������������������������������������������������������������������������������������������������������������������������������������������������������������������������������������������������������������������������������������������������������������������������������������������������������������������������������������������������������������������������������������������������������������������������������������������������������������������������������������������������������������������������������������������������������������������������������������������������������������������������������������������������������������������������������������������������������������������������������������������������������������������������������������������������������������������������������������������������������������������������������������������������������������������������������������������������������������������������������������������������������������������������������������������������������������������������������������������������������������������������������������������������������������������������������������������������������������������������������������������������������������������������������������������������������������������������������������������������������������������������������������������������������������������������������������������������������������������������������������������������������������������������������������������������������������������������������������������������������������������������������������������������������������������������������������������������������������������������������������������������������������������������������������������������������������������������������������������������������������������������������������������������������������������������������������������������������������������������������������������������������������������������������������������������������������������������������������������������������������������������������������������������������������������������������������������������������������������������������������������������������������������������������������������������������������������������������������������������������������������������������������������������������������������������������������������������������������������������������������������������������������������������������������������������������������������������������������������������������������������������������������������������������������������������������������������������������������������������������������������������������������������������������������������������������������������������������������������������������������������������������������������������������������������������������������������
Employment in Service- & Technologcial Sector (change in %)
Total Service Techn. Total Service Techn. Total Service Techn.Austria 0,95 5,29 -0,73 1,14 6,85 -1,22 0,09 5,26 -2,06Styria 1,18 6,53 2,54 2,07 8,50 3,00 1,00 8,66 2,40Upper Styria 0,14 15,96 1,41 0,61 10,88 2,10 -0,27 7,19 -1,61
Bruck 0,41 -12,82 3,89 0,04 12,98 4,32 6,20 9,75 -2,92Judenburg -4,11 -2,35 -7,41 1,06 26,49 -4,22 -1,95 13,51 -1,33Knittelfeld 2,56 128,69 -4,85 1,11 -2,79 -4,71 -0,98 4,58 -11,31Leoben 3,67 -3,07 6,48 2,21 17,87 11,62 -4,59 6,51 2,60Liezen 0,77 -7,28 8,04 0,15 4,33 7,35 -0,56 0,29 -0,64Mürzzuschlag -2,44 -7,38 2,33 -0,93 6,43 -1,72 0,29 8,53 3,98
Source: WIBIS 1999.
1998 1997 1996Sector Sector Sector
Summarised it can be pointed out that there has been a clear and strong sectional
shift from the secondary towards the tertiary sector since 1981. In the case of Upper
Styria, the neighbouring districts Leoben and Bruck/Mur had to face the sharpest
tumble of secondary sector decline. Growth rates with nearly 10% within the service
sector between 1981 and 1991 continued and even grew during 1997 and 1998 (e.g.
+16,0% in 1998). More surprisingly seems to be the continuous growth of the
technological sector in Upper Styria (+2,5-3%) between 1995 and 1998, while
Austria’s technological sector-employment fell during the recent years. Since Upper
Styria’s performance is under Styrian average figures, this may be evidence for the
strong position of the Automobile Cluster in Styria’s southern- and easterly districts,
with obvious spill-over effects to the OIA.
3.2.2.2 Education & Qualification
Analysing the qualification of the population, two clear trends could be identified:
1) A clear movement towards higher education could be noted in the whole case
study region,
2) Shares in lower-skilled-workers segment decreased.

21
Focusing on the specific education & qualification groups, the group of High School
leavers increased by +47,5% between 1981 and 1991. Not only was this the highest
increase but also the only constantly above Styrian average (+43,9%).
The second group – University Graduates – also experienced growth rates of
+45,1% in the OIA but clearly under Styria’s overall increase of 58,9%. Two districts,
Knittelfeld and Liezen were even above provincial average with increases of 61,9%
and 65,6% respectively.
Technical Colleges boomed between 1981 and 1991: while the overall regional
figures (+12,5%) were below Styrian average (+15,5%), again the districts Knittelfeld
(+23,4%) and Liezen (+21,4%) shadowed the provincial numbers.

22
Table 3.6 Qualification in Upper Styria
�����������������������������������������������������������������������������������������������������������������������������������������������������������������������������������������������������������������������������������������������������������������������������������������������������������������������������������������������������������������������������������������������������������������������������������������������������������������������������������������������������������������������������������������������������������������������������������������������������������������������������������������������������������������������������������������������������������������������������������������������������������������������������������������������������������������������������������������������������������������������������������������������������������������������������������������������������������������������������������������������������������������������������������������������������������������������������������������������������������������������������������������������������������������������������������������������������������������������������������������������������������������������������������������������������������������������������������������������������������������������������������������������������������������������������������������������������������������������������������������������������������������������������������������������������������������������������������������������������������������������������������������������������������������������������������������������������������������������������������������������������������������������������������������������������������������������������������������������������������������������������������������������������������������������������������������������������������������������������������������������������������������������������������������������������������������������������������������������������������������������������������������������������������������������������������������������������������������������������������������������������������������������������������������������������������������������������������������������������������������������������������������������������������������������������������������������������������������������������������������������������������������������������������������������������������������������������������������������������������������������������������������������������������������������������������������������������������������������������������������������������������������������������������������������������������������������������������������������������������������������������������������������������������������������������������������������������������������������������������������������������������������������������������������������������������������������������������������������������������������������������������������������������������������������������������������������������������������������������������������������������������������������������������������������������������������������������������������������������������������������������������������������������������������������������������������������������������������������������������������������������������������������������������������������������������������������������������������������������������������������������������������������������������������������������������������������������������������������������������������������������������������������������������������������������������������������������������������������������������������������������������������������������������������������������������������������������������������������������������������������������������������������������������������������������������������������������������������������������������������������������������������������������������������������������������������������������������������������������������������������������������������������������������������������������������������������������������������������������������������������������������������������������������������������������������������������������������������������������������������������������������������������������������������������������������������������������������������������������������������������������������������������������������������������������������������������������������������������������������������������������������������������������������������������������������������������������������������������������������������������������������������������������������������������������������������������������������������������������������������������������������������������������������������������������������������������������������������������������������������������������������������������������������������������������������������������������������������������������������������������������������������������������������������������������������������������������������������������������������������������������������������������������������������������������������������������������������������������������������������������������������������������������������������������������������������������������������������������������������������������������������������������������������������������������������������������������������������������������������������������������������������������������������������������������������������������������������������������������������������������������������������������������������������������������������������������������������������������������������������������������������������������������������������������������������������������������������������������������������������������������������������������������������������������������������������������������������������������������������������������������������������������������������������������������������������������������������������������������������������������������������������������������������������������������������������������������������������������������������������������������������������������������������������������������������������������������������������������������������������������������������������������������������������������������������������������������������������������������������������������������������������������������������������������������������������������������������������������������������������������������������������������������������������������������������������������������������������������������������������������������������������������������������������������������������������������������������������������������������������������������������������������������������������������������������������������������������������������������������������������������������������������������������������������������������������������������������������������������������������������������������������������������������������������������������������������������������������������������������������������������������������������������������������������������������������������������������������������������������������������������������������������������������������������������������������������������������������������������������������������������������������������������������������������������������������������������������������������������������������������������������������������������������������������������������������������������������������������������������������������������������������������������������������������������������������������������������������������������������������������������������������������������������������������������������������������������������������������������������������������������������������������������������������������������������������������������������������������������������������������������������������������������������������������������������������������������������������������������������������������������������������������������������������������������������������������������������������������������������������������������������������������������������������������������������������������������������������������������������������������������������������������������������������������������������������������������������������������������������������������������������������������������������������������������������������������������������������������������������������������������������������������������������������������������������������������������������������������������������������������������������������������������������������������������������������������������������������������������������������������������������������������������������������������������������������������������������������������������������������������������������������������������������������������������������������������������������������������������������������������������������������������������������������������������������������������������������������������������������������������������������������������������������������������������������������������������������������������������������������������������������������������������������������������������������������������������������������������������������������������������������������������������������������������������������������������������������������������������������������������������������������������������������������������������������������������������������������������������������������������������������������������������������������������������������������������������������������������������������������������������������������������������������������������������������������������������������������������������������������������������������������������������������������������������������������������������������������������������������������������������������������������������������������������������������������������������������������������������������������������������������������������������������������������������������������������������������������������������������������������������������������������������������������������������������������������������������������������������������������������������������������������������������������������������������������������������������������������������������������������������������������������������������������������������������������������������������������������������������������������������������������������������������������������������������������������������������������������������������������������������������������������������������������������������������������������������������������������������������������������������������������������������������������������������������������������������������������������������������������������������������������������������������������������������������������������������������������������������������������������������������������������������������������������������������������������������������������������������������������������������������������������������������������������������������������������������������������������������������������������������������������������������������������������������������������������������������������������������������������������������������������������������������������������������������������������������������������������������������������������������������������������������������������������������������������������������������������������������������������������������������������������������������������������������������������������������������������������������������������������������������������������������������������������������������������������������������������������������������������������������������������������������������������������������������������������������������������������������������������������������������������������������������������������������������������������������������������������������������������������������������������������������������������������������������������������������������������������������������������������������������������������������������������������������������������������������������������������������������������������������������������������������������������������������������������������������������������������������������������������������������������������������������������������������������������������������������������������������������������������������������������������������������������������������������������������������������������������
Qualification
EmployeesChange ( ∆ ∆ ∆ ∆ ) 1981-1991 in %
1971 1981 1991 ∆∆∆∆ 1971 1981 1991 ∆∆∆∆
Bruck / Mur 11.433 12.393 (+8,4) 605 962 1.318 (+37,0)Judenburg 7.372 8.297 (+12,5) 319 637 917 (+44,0)Knittelfeld 4.946 5.867 (+18,6) 196 357 578 (+61,9)Leoben 12.590 13.668 (+8,6) 783 1.145 1.533 (+33,9)Liezen 12.942 15.184 (+17,3) 529 951 1.565 (+64,6)Mürzzuschlag 6.206 6.974 (+12,4) 235 488 676 (+38,5)
Styria 196.174 229.191 (+16,8) 12.468 19.851 31.544 (+58,9)
1971 1981 1991 ∆∆∆∆ 1971 1981 1991 ∆∆∆∆
Bruck / Mur 1.171 1.500 2.028 (+35,2) 2.214 2.365 2.529 (+6,9)Judenburg 751 759 1.234 (+62,6) 1.301 1.464 1.615 (+10,3)Knittelfeld 425 422 715 (+69,4) 852 877 1.082 (+23,4)Leoben 1.290 1.347 1.934 (+43,6) 2.531 2.781 2.979 (+7,1)Liezen 1.118 1.344 1.947 (+44,9) 2.198 2.382 2.891 (+21,4)Mürzzuschlag 582 753 1.174 (+55,9) 1.347 1.384 1.567 (+13,2)
Styria 22.834 25.624 36.606 (+42,9) 31.584 37.199 42.980 (+15,5)
1971 1981 1991 ∆∆∆∆ 1971 1981 1991 ∆∆∆∆
Bruck / Mur 10.715 4.579 5.084 (+11,0) 13.985 2.027 1.434 (-29,3)Judenburg 6.648 2.989 3.447 (+15,3) 10.597 1.523 1.084 (-28,8)Knittelfeld 3.791 2.330 2.749 (+18,0) 5.622 960 743 (-22,6)Leoben 12.247 4.938 5.573 (+12,9) 14.989 2.379 1.649 (-30,7)Liezen 10.205 5.350 6.820 (+27,5) 16.502 2.915 1.961 (-32,7)Mürzzuschlag 6.434 2.319 2.698 (+16,3) 9.226 1.262 850 (-32,6)
Styria 140.761 69.669 86.733 (+24,5) 270.905 43.831 31.328 (-28,5)
1971 1981 1991 ∆∆∆∆
Bruck / Mur 16.964 14.754 (-13,0)Judenburg 11.864 10.842 (-8,6)Knittelfeld 5.680 5.331 (-6,1)Leoben 17.843 14.790 (-17,1)Liezen 16.527 16.617 (+0,5)Mürzzuschlag 10.838 9.495 (-12,4)
Styria 238.913 236.204 (-1,1)
Source: ÖSTAT, VZ 1971, 1981, 1991.
Labour
UniversityTotal
High School Technical College
Apprentice Secondary School

23
Apprenticeships, first essential for highly skilled labour in a region, grew by +17,2%
in the case study region. Despite this extensive gain, the regional increase was +7,3
pp below Styrian average (+24,5%). Only Liezen (+27,5%) experienced above
average growth.
Focusing on lower-skilled education, figures with only secondary school degree and
low-skilled labour were down in all case study districts. With a reduction of –30,2% in
secondary school leavers, all but one districts were above Styrian average decrease
(-28,5%). In the group of low-skilled-labour, Upper Styria’s changes (-9,9%) were
clearly above the overall Styrian changes (-1,1%). Especially Leoben and Bruck/Mur
(-17,1% and –13,0%) had significantly high drops of low-skilled-labour.
Fig. 3-2 Education/Qualification in Upper Styria, 1991
High School7%
Technical College
9%
Apprentice20%
Secondary School
6%
Lower-Skilled-Labour
53%
University5%
Summarised, a clear movement towards higher education and more qualification in
the case study region could be observed between 1981 and 1991. Some districts
even shadowed the growth rates of provincial average.

24
3.2.2.3 Unemployment
Unemployment analysis of Upper Styria will include three main parts: the overall
unemployment development during the 1980s and 1990s, unemployment of young
people (15-25 years of age) and elderly unemployed (> 50 years of age).
To begin, Table 3.7 summarises the development of the overall unemployment rate
in Austria, Styria and Upper Styria. The unemployment rate represents the share of
unemployed in the total number of employees plus the no. of unemployed.
The unemployment rate rose in Upper Styria from 2,8% in 1981 to 8,1% in 1991. In
1998, the rate settled at 8,5% after an all year high of 10,2% in 1993. Within the
same period, the unemployment rate at Styrian level was 2,9% (1981) and rose to
7,1% (1991). After an all time high of 8,1 % in 1993 and repeatedly in 1996, the rate
slightly improved to 8,1% in 1998.
Table 3.7 Unemployment Rate 1981-1998
������������������������������������������������������������������������������������������������������������������������������������������������������������������������������������������������������������������������������������������������������������������������������������������������������������������������������������������������������������������������������������������������������������������������������������������������������������������������������������������������������������������������������������������������������������������������������������������������������������������������������������������������������������������������������������������������������������������������������������������������������������������������������������������������������������������������������������������������������������������������������������������������������������������������������������������������������������������������������������������������������������������������������������������������������������������������������������������������������������������������������������������������������������������������������������������������������������������������������������������������������������������������������������������������������������������������������������������������������������������������������������������������������������������������������������������������������������������������������������������������������������������������������������������������������������������������������������������������������������������������������������������������������������������������������������������������������������������������������������������������������������������������������������������������������������������������������������������������������������������������������������������������������������������������������������������������������������������������������������������������������������������������������������������������������������������������������������������������������������������������������������������������������������������������������������������������������������������������������������������������������������������������������������������������������������������������������������������������������������������������������������������������������������������������������������������������������������������������������������������������������������������������������������������������������������������������������������������������������������������������������������������������������������������������������������������������������������������������������������������������������������������������������������������������������������������������������������������������������������������������������������������������������������������������
Unemployment Rate in % (1981-1998)
1981 1986 1987 1988 1989 1990 1991 1992 1993 1994 1995 1996 1997 1998Austria 2,4 5,2 5,6 5,3 4,6 4,9 5,3 5,9 6,8 6,5 6,4 7,0 7,1 7,2Styria 2,9 6,0 6,5 6,5 6,1 6,4 7,1 7,4 8,4 8,1 8,2 8,4 8,1 8,1Upp. Styria 3,2 5,5 6,0 5,9 5,7 6,7 8,1 9,0 10,2 9,8 9,5 9,3 8,7 8,5
Bruck 3,0 6,1 6,7 6,5 6,0 7,9 9,7 10,7 12,0 11,5 11,1 10,3 9,5 8,8Judenbg. 3,0 5,2 5,3 5,4 5,1 5,8 6,6 7,5 9,0 8,8 8,7 9,0 8,6 8,7Knittelfd. 3,0 5,4 5,9 5,5 6,1 5,7 6,5 8,0 9,5 9,0 8,9 8,5 8,6 8,4
Leoben 5,2 5,4 6,1 6,6 7,0 8,9 10,7 11,2 11,5 10,0 9,4 8,8 7,3 7,0Liezen 3,0 6,3 6,8 6,6 5,9 6,3 8,0 8,9 10,1 10,1 10,7 10,8 10,3 10,3Mürzz. 2,1 4,4 4,9 4,5 4,1 5,8 7,2 7,6 9,0 9,1 8,3 8,1 8,0 7,9
Source: Haller et al (1994), AMS Stmk, AK Stmk.
Due to its structural problems, the unemployment rate of the case study region is
higher than the provincial average. More surprisingly it was below Styrian average till
1989. After 1989, growth rates of the unemployment rates of Styria and Upper Styria
respectively drifted apart. According to Steiner/Wendner (1993) structural problems –
dating back to the 1970s – were invisible within the unemployment rate till 1989.
Since 1989 a sharp rise could be observed.

25
The situation for women on the labour market is different than the one for men.
Female unemployment sharply rose in Upper Styria from 4,0% in 1981 to 11,5% in
1991. Compared to the provincial level, female unemployment rose from 3,2% to
8,6% during the same time span. The rate as well as the growth path of
unemployment in Upper Styria was constantly higher than in Styria during the
examined period. In contradiction to the male reaction pattern, no sudden change
occurred in 1989 (see Steiner/Wendner, 1993, p.15).
Summarised, the problems of OIA‘s are expressed earlier in employment figures
rather than in unemployment rates. While the unemployment-rate overrode Styrian
levels only in 1989, employment-figures decreased already above-average during
the early 1980s.
Table 3.8 summarises the situation during the 1990s: it presents the percentile
change of employment, unemployment and unemployment-rate between 1991 and
1998 (in column 1 & 2). The third column presents the quotient (Upper Styria/Styria)
for the three assessed indicators. A value of 1 signals a same percentile change in
Upper Styria and Styria respectively. In the case of employment, a value greater than
1 signals a stronger - positive - reaction (percentile change) in the OIA. In the case of
the unemployment data, the opposite is true: a value below 1 signals a weaker
reaction, i.e. a positive development of unemployment in Upper Styria:
Table 3.8 Employment – Unemployment 1991/1998
����������������������������������������������������������������������������������������������������������������������������������������������������������������������������������������������������������������������������������������������������������������������������������������������������������������������������������������������������������������������������������������������������������������������������������������������������������������������������������������������������������������������������������������������������������������������������������������������������������������������������������������������������������������������������������������������������������������������������������������������������������������������������������������������������������������������������������������������������������������������������������������������������������������������������������������������������������������������������������������������������������������������������������������������������������������������������������������������������������������������������������������������������������������������������������������������������������������������������������������������������������������������������������������������������������������������������������������������������������������������������������������������������������������������������������������������������������������������������������������������������������������������������������������������������������������������������������������������������������������������������������������������������������������������������������������������������������������
Change in % Upper Styria Upper Styria/between 1991-1998 Styria Styria
Employment 2,7 0,3 9Unemployment (absolute) 104,7 119,7 0,9Unemployment rate 104,9 114,1 0,9
Source: Haller et al. (1994), AK Stmk. (1998) and WIBIS.
Employment in Upper Styria performed well between 1991 and 1998. With a quotient
of 9, i.e. employment grew 9 times higher in Upper Styria than in Styria, it was far
above Styrian average. Unemployment in absolute numbers changed stronger on

26
Styrian rather than case study regional level. Even the unemployment rate (+4,9
percentile change) in Upper Styria developed better than it did in the whole province.
Age structure of unemployment
Taking a closer look on the specific age structure of unemployment, the number of
age groups has been summarised to three main groups:
1. Youth 15-25 years of age
2. Middle-Aged 25 and 50 years of age (summed up from AMS data)
3. Elderly over 50 years of age
The situation of young people on the labour market results from a data-combination
of youth (under 25 years) and apprenticeship-data.
Since unemployed over 50 years of age increasingly have to face problems of
reintegration, data of elderly unemployed (over 50 years of age) will be analysed as
well.
Table 3.9 Youth Unemployment
1991 1992 1993 1994 1995 1996 1997 1998
Upper Styria 23,4 20,0 18,9 17,9 17,0 17,7 17,5 16,8Styria 24,7 22,0 20,9 19,3 18,7 18,6 18,1 17,5Austria 21,6 19,5 18,7 17,2 16,9 16,9 16,3 15,3Source: AMS Austria.
Share of Young Unemployed (15-25 years of age) in Total Unemployment in %
The present situation (1998) consists of a relatively low share of youth
unemployment in Upper Styria (16,8%). In contradiction to Styria (17,5%), it is 0,7
percentage-points below the provincial average share. If the case study region-level
is compared with the federal average (15,3%) its relatively higher share of youth-
unemployment becomes visible.
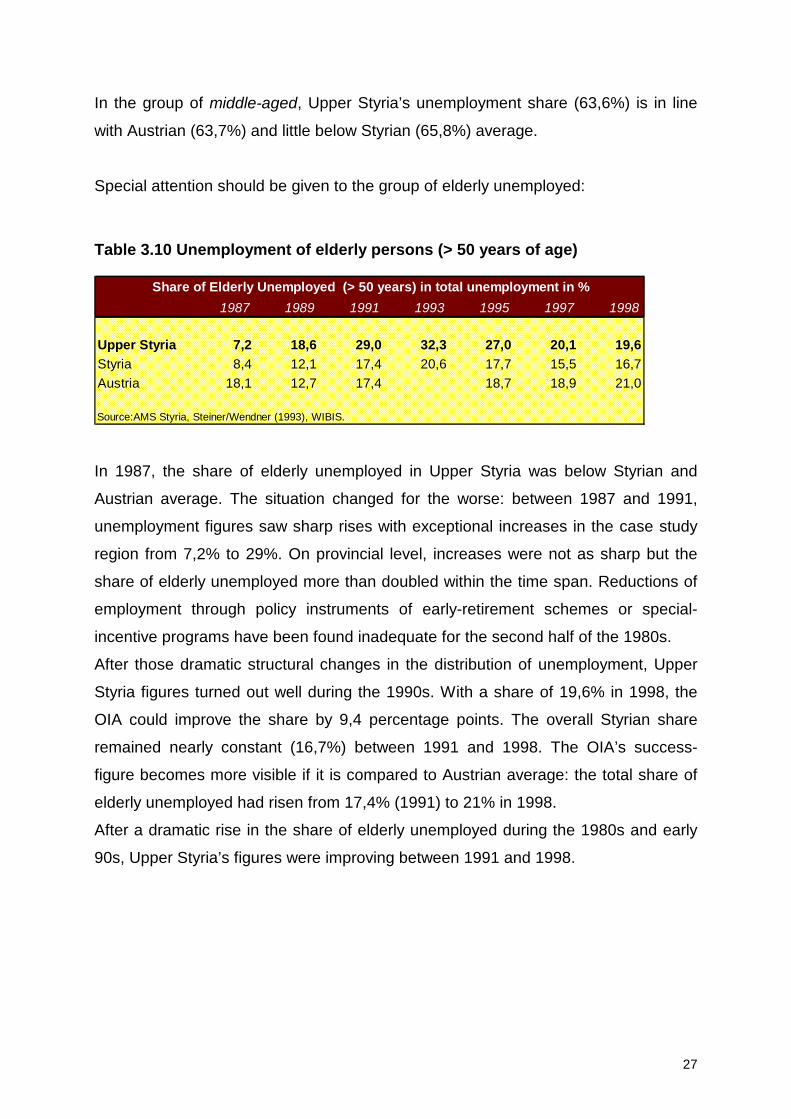
27
In the group of middle-aged, Upper Styria’s unemployment share (63,6%) is in line
with Austrian (63,7%) and little below Styrian (65,8%) average.
Special attention should be given to the group of elderly unemployed:
Table 3.10 Unemployment of elderly persons (> 50 years of age)
��������������������������������������������������������������������������������������������������������������������������������������������������������������������������������������������������������������������������������������������������������������������������������������������������������������������������������������������������������������������������������������������������������������������������������������������������������������������������������������������������������������������������������������������������������������������������������������������������������������������������������������������������������������������������������������������������������������������������������������������������������������������������������������������������������������������������������������������������������������������������������������������������������������������������������������������������������������������������������������������������������������������������������������������������������������������������������������������������������������������������������������������������������������������������������������������������������������������������������������������������������������������������������������������������������������������������������������������������������������������������������������������������������������������������������������������������������������������������������������������������������������������������������������������������������������������������������������������������������������������������������������������������������������������������������������������������������������������������������������������������������������������������������������������������������
1987 1989 1991 1993 1995 1997 1998
Upper Styria 7,2 18,6 29,0 32,3 27,0 20,1 19,6Styria 8,4 12,1 17,4 20,6 17,7 15,5 16,7Austria 18,1 12,7 17,4 18,7 18,9 21,0
Source:AMS Styria, Steiner/Wendner (1993), WIBIS.
Share of Elderly Unemployed (> 50 years) in total unemployment in %
In 1987, the share of elderly unemployed in Upper Styria was below Styrian and
Austrian average. The situation changed for the worse: between 1987 and 1991,
unemployment figures saw sharp rises with exceptional increases in the case study
region from 7,2% to 29%. On provincial level, increases were not as sharp but the
share of elderly unemployed more than doubled within the time span. Reductions of
employment through policy instruments of early-retirement schemes or special-
incentive programs have been found inadequate for the second half of the 1980s.
After those dramatic structural changes in the distribution of unemployment, Upper
Styria figures turned out well during the 1990s. With a share of 19,6% in 1998, the
OIA could improve the share by 9,4 percentage points. The overall Styrian share
remained nearly constant (16,7%) between 1991 and 1998. The OIA’s success-
figure becomes more visible if it is compared to Austrian average: the total share of
elderly unemployed had risen from 17,4% (1991) to 21% in 1998.
After a dramatic rise in the share of elderly unemployed during the 1980s and early
90s, Upper Styria’s figures were improving between 1991 and 1998.

28
Table 3.11 Long Term Unemployment
������������������������������������������������������������������������������������������������������������������������������������������������������������������������������������������������������������������������������������������������������������������������������������������������������������������������������������������������������������������������������������������������������������������������������������������������������������������������������������������������������������������������������������������������������������������������������������������������������������������������������������������������������������������������������������������������������������������������������������������������������������������������������������������������������������������������������������������������������������������������������������������������������������������������������������������������������������������������������������������������������������������������������������������������������������������������������������������������������������������������������������������������������������������������������������������������������������������������������������������������������������������������������������������������������������������������������������������������������������������������������������������������������������������������������������������������������������������������������������������������������������������������������������������������������������������������������������������������������������������������������������������������������������������������������������������������������������������������������������������������������������������������������������������������������������������������������������������������������������������������������������������������������������������������������������������������������������������������������������������������������������������������������������������������������������������������������������������������������������������������������������������������������������������������������������������������������������������������������������������������������������������������
Long Term Unemployed (> 12 months)
1993 1994 1995 1996 1997 1998Styria 7.393 7.977 7.929 7.367 6.947 6.368Upper Styria 4.001 4.305 4.075 3.414 2.964 2.515
Bruck/Mur 1.142 1.229 1.177 963 867 694Judenburg 447 498 436 368 356 385Knittelfeld 303 316 297 260 248 202Leoben 1.011 968 815 650 449 196Liezen 697 801 828 761 717 767Mürzzuschlag 401 493 522 412 327 271
Source: AK, WIBIS.
Analysing long-term unemployment, i.e. persons remaining unemployed over a
period of at least 12 months, the total number decreased by -1.025 or –13,9% in
Styria between the examination period 1993 and 1998. Focusing on the single case
study districts, a significant regional variation in long-term unemployment figures
becomes obvious. An outstanding decrease of its long term unemployment could be
noted in Leoben (-80%). Bruck/Mur (-39,2%) and Mürzzuschlag (-32,4%) also
performed well. In relation to provincial changes, Upper Styria saw a reduction of –
37,1% between 1993 and 1998.
Fig. 3-3 Average Duration of Unemployment in weeks
18,820,3
22,023,8
19,120,6
19,0 19,9 20,319,0
20,619,121,0
19,8
0,0
5,0
10,0
15,0
20,0
25,0
1991 1992 1993 1994 1995 1996 1997
Upper StyriaStyria

29
The average duration of unemployment saw constant increases between 1991 and
1994 in Styria and Upper Styria. In 1994, the gap between Upper Styria and Styria
had increased to 3 ½ weeks, i.e. unemployed remained on average 3 ½ weeks
longer unemployed in Upper Styria than on Styrian average. In 1995, the average
unemployment duration decreased significantly by -4,7 week on average in Upper
Styria.
3.2.3 Economic and Industrial Structure
3.2.3.1 Productivity
Due to changes in the sectional employment during the 1980s – with strong set offs
in the metal industry (-12.000) (Tichy, 1994, p.26) – productivity could be raised.
Were all case study region districts but Liezen below Styrian and Austrian average in
1983, figures had changed by 1990 when three districts’ Net Product Value
(NPV)/Employee lay over Styrian and Austrian figures. The rise followed a fallback in
1994, putting Upper Styria below Austrian and leaving only two districts above
provincial average.
Tichy (1994) analysing Styrian census data, assumes a passive reorganisation due
to a negative correlation between productivity and employment (p.26f.).

30
Table 3.12 Industrial Productivity
��������������������������������������������������������������������������������������������������������������������������������������������������������������������������������������������������������������������������������������������������������������������������������������������������������������������������������������������������������������������������������������������������������������������������������������������������������������������������������������������������������������������������������������������������������������������������������������������������������������������������������������������������������������������������������������������������������������������������������������������������������������������������������������������������������������������������������������������������������������������������������������������������������������������������������������������������������������������������������������������������������������������������������������������������������������������������������������������������������������������������������������������������������������������������������������������������������������������������������������������������������������������������������������������������������������������������������������������������������������������������������������������������������������������������������������������������������������������������������������������������������������������������������������������������������������������������������������������������������������������������������������������������������������������������������������������������������������������������������������������������������������������������������������������������������������������������������������������������������������������������������������������������������������������������������������������������������������������������������������������������������������������������������������������������������������������������������������������������������������������������������������������������������������������������������������������������������������������������������������������������������������������������������������������������������������������������������������������������������������������������������
Productivity
in 1.000 ATS 1983 1990 1994
Bruck/Mur 330,5 514,8 702,6Judenberg 298,5 644,8 631,8Knittelfeld 272,5 494,5 493,0Leoben 409,2 607,1 863,9Liezen 435,0 491,5 536,1Mürzzuschlag 285,6 703,5 676,2
Upper Styria 338,6 576,0 650,6Styria 343,3 528,3 665,5Austria 397,8 588,0 725,6Source: ÖSTAT; WIFO.
IndustryNPV / Employee
3.2.3.2 Firm Formation
A valuable indicator for a region’s economic progress is the intensity of firm
foundations in the region. Since newly issued trade licences are not necessarily
newly founded enterprises, these granted licences have been analysed in more
detail by the Austrian Chamber of Commerce for the first time in 1999. Since every
single enterprise has to be an obligatory member of the Chamber of Commerce, the
latter disposes of a wide pool of data. According to the Chamber, enterprises are
regarded as newly founded, if two of three firm’s characteristic changes:
• Title of firm,
• Location,
• Branch or industry.
New membership data was also analysed according to the declaration of business,
i.e. if the new firm was declared as main business rather than branch or subsidiary.
Only main businesses were regarded as newly founded enterprise and included in
the statistics. The data available includes the period between 1993 and 1998 for
each political district.

31
Table 3-13 Firm Foundation Intensity (in %) in Upper Styria 1993-1998.
������������������������������������������������������������������������������������������������������������������������������������������������������������������������������������������������������������������������������������������������������������������������������������������������������������������������������������������������������������������������������������������������������������������������������������������������������������������������������������������������������������������������������������������������������������������������������������������������������������������������������������������������������������������������������������������������������������������������������������������������������������������������������������������������������������������������������������������������������������������������������������������������������������������������������������������������������������������������������������������������������������������������������������������������������������������������������������������������������������������������������������������������������������������������������������������������������������������������������������������������������������������������������������������������������������������������������������������������������������������������������������������������������������������������������������������������������������������������������������������������������������������������������������������������������������������������������������������������������������������������������������������������������������������������������������������������������������������������������������������������������������������������������������������������������������������������������������������������������������������������������������������������������������������������������������������������������������������������������������������������������������������������������������������������������������������������������������������������������������������������������������������������������������������������������������������������������������������������������������������������������������������������������������������������������������������������������������������������������������������������������������������������������������������������������������������������������������������������������������������������������������������������������������������������������������������������������������������������������������������������������������������������������������������������������������������������������������������������������������������������������������������������������������������������������������������������������������������������������������������������������������������������������������������������������������������������������������������������������������������������������������������������������������������������������������������������������������������������������������������������������������������������������������������������������������������������������������������������������������������������������������������������������������������������������������������������������������������������������������������������������������������������������������������������������������������������������������������������������������������������������������������������������������������������������������������������������������������������������������������������������������������������������������������������������������������������������������������������������������������������������������������������������������������������������������������������������������������������������������������������������������������������������������������
Firm Foundation Intensity
1993 1994 1995 1996 1997 1998 1993-1998
Styria 5,5 5,1 5,0 7,0 7,4 6,9 6,2Graz&Umgebung 7,2 5,9 5,4 7,9 9,0 7,8 7,3Upper Styria 5,1 4,6 4,8 6,2 6,6 6,5 5,7
Bruck/Mur 5,9 4,0 4,8 6,8 7,1 6,9 5,9Judenburg 4,7 4,9 4,8 6,8 7,2 6,4 5,8Knittelfeld 5,4 5,0 5,8 6,2 6,7 7,2 6,1Leoben 5,0 4,3 4,0 5,8 7,1 5,8 5,4Liezen 4,9 4,4 4,6 5,5 5,3 4,8 4,9Mürzzuschlag 4,4 5,2 5,0 6,3 6,4 7,8 5,9
Source: WK 1999.
Focusing on the intensity of foundations, i.e. the percentage-share of newly founded
enterprises in established businesses, the districts Mürzzuschlag and Knittelfeld saw
constant increases since 1995. In 1998, those two districts experienced the highest
intensity of newly founded enterprises (7,8% and 7,2% respectively). Both districts,
as well as Bruck/Mur (6,9%) performed better than Styrian average (6,5%) in 1998.
The overall development of the foundation intensity in Upper Styria was slightly
below provincial average but clearly below the agglomeration Graz & Environs
between 1993 and 1998. In 1995, when Styria and Graz & Env. saw a low in their
relative foundation numbers, Upper Styria’s foundation intensity grew constantly
between 1994 and 1997, with only a slight decrease in 1998 (-0,1 percentage-point).
Fig. 3-4 Development of Foundation Intensity 1993-1998.
Development - Foundation Intensity
0,01,02,03,04,05,06,07,08,09,0
10,0
1993 1994 1995 1996 1997 1998
StyriaGraz&UmgebungUpper Styria

32
Fig. 3-5 Foundation Intensity in Upper Styria between 1993 and 1998
Foundation Intensity - Political Districts (1993-1998)
7,3
6,15,4
4,9
5,7
5,9
5,95,8
0,0 2,0 4,0 6,0 8,0
Graz&Umgebung
Upper Styria
Bruck/Mur
Judenburg
Knittelfeld
Leoben
Liezen
MürzzuschlagStyrianAverage 6,2
3.3 Summary
The applied indicators in this section deliver in many cases the structural changes in
Upper Styria that occurred during the last 20 years. Demographic and labour market
indicators proofed a strong decline in employment numbers not only due to early
retirement programs but to brain drain from the case study region between 1981 and
1991, i.e. outward migration of young people. However, latest data predict a
turnaround of this trend.
Focusing on sectional employment, shifts from the primary and secondary- towards
the tertiary sector could be observed, which almost compensated set-offs from the
first two sectors. The trend towards the service sector was backed on a general
movement towards higher education. Within the case study region, some political
districts even shadowed the average growth rates of higher education on provincial
level, although there are clear signs of uneven distribution of regional change in
qualification within the case study region.
Analysing the unemployment rate surprisingly a lower rate in the case study region
compared to Styrian average till 1989 resulted – a relatively late reaction of the
indicator to the structural crises. Between 1991 and 1998, Upper Styria saw rises in
33
its unemployment data but its relative change was well below Styrian increases. The
age group of young unemployed (15-25 years of age) experienced less
unemployment than on Styrian average but is still slightly higher than Austrian
average. The opposite is true for elderly unemployed: their share of total
unemployment is lower than Austrian average but higher than provincial average.
All in all, the case study region (and its population) performed well during recent
years. Facing a tremendous economic crisis with only a few dominant,
monostructured enterprises, labour market data improved within the last decade.
Through higher qualification, a base for a structural change was given and service
industry could compensate for lost jobs in the primary and secondary sector.
Considering the demographic outlook for the next 20 years, which recently came
under dispute and positive numbers were presented, there seems to be a possible
compensation for the brain drain in Upper Styria during the 1980s and therefore a
basis for an optimistic sustained development within the life cycle of the region.
34
4- Strategies and instruments in support of reconversion
4.1 Mergers and Concentration
Mergers and concentration processes, especially during the late 1970s and 1980s,
have historically always been regarded as a solution to deal with crises and to
overcome structural problems.
Tichy (1994c) argues that the ability for structural change decreases since nearly
every merger is accompanied by a reduction of independent suppliers.
Historically, the most important steps within the concentration process in the Styrian
iron industry can be dated over four centuries:
1625 Creation of Innerberger Hauptgewerkschaft
1829 Merger of Erzberg-ownerships into public property
1868 Concentration of Innerberger Hauptgewerkschaft towards a Public Limited
Company (PLC)
1881 Merger towards Alpine-Montan-Company
1973 Merger of Alpine-Montan PLC and VÖEST PLC to VÖEST-Alpine PLC
1975 Merger of Schoeller-Bleckmann (see Tichy, 1994c, p. 18f.).
The dominant strategy during the 1960s, 70s and early 80s was the search for
economies of scale through vertical and horizontal integration. This centralisation
process was accompanied by a concentration of headquater functions in Vienna.
Plants in Upper Styria came under “external” control. In most cases, planning,
R&D and marketing/distribution functions, i.e. those responsible for the monitoring
of markets and technology were lost (see Tödtling/Sedlacek, 1997, p. 50).
More recently, not only steel-producing industry but also steel trade became subject
of mergers. In 1976, four large and independent steel traders were merged and
taken over by the VÖEST-Alpine Steel Trade.
This merger processes have been criticised in the literature. Aiginger (1986) argues
that one reason for the steel crisis in Upper Styria were those excessive mergers
within the industry. All preconditions for success, e.g. impartiality, independence etc.,
have been disregarded. He further points out the uncritical belief in advantages of

35
large-scale enterprises and – technology (economies of scale). Aiginger also notes
the decision-making process in conjunction with mergers. After management had left
the region and be centralised in Vienna and ownership had changed to “permissive”
public ownership, no emphasis was put on productivity, salaries raised to above-
average levels in relation to other regions and the easier (political) governing of a
centralised group (Aiginger, 1986, p. 498ff; cited in Hwaletz et al., 1991, p. 47).
4.2 Decentralisation
The strategies of mergers, vertical and horizontal integration to deal with crises were
abandoned during the second half of the 1980s.
In 1986, a new executive board in the VÖEST-Alpine plc - the nationalised steel
group comprising the largest steel manufactures in Austria – launched an extensive
analysis of the organisational and operative structures of the group. This analysis
resulted in the “VAN”-concept (VÖEST-Alpine-New) and affected Upper Styria with
its large steel industry as well. Only one year later, in 1987, four spin-offs of large
VÖEST-companies followed, three of them located in the case study region: The
VÖEST Alpine Stahl Donawitz Ltd. (LD-semifinished material for the Group
companies) , Stahlrohr Kindberg Ltd. (ready-to-install oil and gas field pipes) and
Judenburg Ltd. became independent legal corporations with management that was
shifted back into the region.
After “experiments” regarding product range during the concentration phase in the
1970s and 1980s, the focus was put back on the group’s core-competencies rather
than a wide product range with low competitive advantages.
In 1993, the VÖEST-Alpine Stahl Plc II – the parent company of the main and
dominant steel enterprises in Upper Styria – focused on 3 main divisions:
- Flat Product Division
- Long Product Division
- Sales Division
Organisationally, the Flat Product Division was located and concentrated in Upper
Austria, focusing on rolled steel products and surface treated flat steel products with

36
several patented applications (e.g. electrolytically coated, organically coated or hot
dip metal coated).
The Long Product Division comprises Upper Styrian enterprises’, all grouped and
embedded in geographical proximity to each other. The Division includes the
VÖEST-Alpine-Schienen Ltd. (rail), Stahl Donawitz Ltd. (see above), Austria Draht
Bruck/Mur (wires) and Stahlrohr Kindberg (steel-pipes). The Alpine-Schienen Ltd. for
example early recognised the high demand of western European railroads for high-
speed rails. It now sets standards e.g. with the manufacture of ultra-long, weld free
railroad rails at lengths of up to 120 metres or head special hardened qualities (see
Annual Report VÖEST-Alpine Stahl AG, 1998/99).
Those partly privatised and reorganised enterprises regained some decision-making
functions in the process of decentralisation within the group. In Upper Styria,
restructuring resulted in substantial unemployment and some plant closures (see
Tödtling/Sedlacek, 1997, p.50).
4.3 Improvement of Infrastructure
4.3.1 Enterprise Support Institutions
Based on the Obersteiermarkstudie (a broad an innovative economic analysis of the
problems of Upper Styria, commissioned by the province of Styria and the Federal
Chancellery, ÖIR et al. 1982), a broad net of research- and technological
infrastructure was installed in the late 1980s. Although the success of these
institutions could not always be judged, successful institutions could be identified
when their activities were oriented towards regional enterprises with their specific
demand and capacities. Further success indicators are present qualification- and
vocational training institutions (Niklasdorf) as well as motivated key actors.
The great number of facilities calls for a more co-ordinated division of labour. Steiner
et al. (1993) propose a stronger co-operation and networking of these institutions.
They point out present co-operations, e.g. the relocation of established enterprises
from one enterprise support institution to the other (in this case Niklasdorf, a
Technology Centre to Kapfenberg, a Business Incubator) or supportive technology

37
transfer between Joanneum Research, TTZ Leoben (see below) and the
Montanuniversity Leoben, as well as lacking co-operation between Niklasdorf and
the Montanuniversity (Steiner et al., 1993, p.51).
Among these enterprise support institutions, the first have already been installed
during the second half of the 1980s.
The Technology-Transfer-Centre Leoben (TTZ) was founded in 1986 with the
intention to implement environmental-techniques as promising regional sustainment
for endogenous foundations of SMEs. Early they experienced that the proposed
technology was part of large enterprises and only useful in parts for SMEs. On the
other side, innovative foundations of SMEs in the metal-, electronic-, mechanical
engineering- and plastics industry had strong demand for technological- and
management consultation. The TTZ reacted and reoriented itself based on the SMEs
demand and focused on an advisory board for technology and management for
present and newly founded enterprises with the goal of modernising economic
structures in Upper Styria.
The TTZ consists of several institutions:
• Office for external affairs of the Montanuniversity Leoben,
• Branch office of the Science Centre Seibersdorf,
• Branch office of the Styrian Technology Consultancy Technova and the
• ÖAR – Regional Advice Upper Styria.
The concrete work focuses on technology transfer and management advice for
SMEs. TTZ also initiates project coordination between enterprises and research
institutions. After the fifth year of its foundation, the TTZ had conducted 75 R&D
projects for product- and process improvement and 80 projects regarding foundation-
counselling, management consulting and project clearing (See Steiner et al., 1993, p.
45f.).
The Business Incubator Kapfenberg was founded in 1989. By 1993, a total of 9
companies with 160 highly-skilled employees were present. Since its successive
foundation in 1989, two or three enterprises joint every year. Enterprises do not get
special consultation, a few are served by technology centre Niklasdorf.

38
Foundations were partly endogenous, i.e. the share of founders from the region was
25%, partly only extensions (branches of existing firms with another location, 15%) or
relocations (40%).
Focusing on business park estate, the Technology Centre Kapfenberg was
established in 1993 with production halls for qualified young enterprises. Focal points
are new materials, laser technology and industrial installation to continue with the
tradition of metal processing and mechanical engineering in Kapfenberg. Future
projects include customised industrial installations for automation- and control
systems. Every located enterprise has already invented new technology or product
innovation and devotes to continuous R&D (see Hartmann et al., 1997, p.28 and
Steiner et al., 1993, p. 46ff.).
The Technology Centre Niklasdorf, founded in 1989 consists of a technology park,
the WIFI Schulungszentrum Upper Styria (vocational institution of the Chamber of
Commerce) and the Laser-Centre Upper Styria. Today it includes 12 enterprises plus
further 5 which are externally located. Focal points are new materials and electronic
data-processing, which were extended with laser technology. Key characteristics of
the centre are service-, consultation- and assistance services as well as modern
didactics in conjunction with the WIFI. Besides knowledge transfer, the centre
emphasis on motivation and contacts (see Hartmann et al, 1997, p.24 and Steiner et
al, 1993, p. 48f.).
The Unternehmerzentrum A.i.Z. Aichfeldzentrum (AIZ), an entrepreneurial centre and
founded in 1989 consists of 16 enterprises with over 90 employees. It offers
management- and finance consulting and focuses on environmental technology and
production-oriented services. Plans for further technological orientation and the
development towards a technology- and innovation centre are present.
The Joanneum Research Laser Centre Leoben, already founded in 1988, emphasis
the industrial application of the laser technology. Process – and production systems
are adopted in co-operation with the customers (Hartmann et al, 1997, p.32).
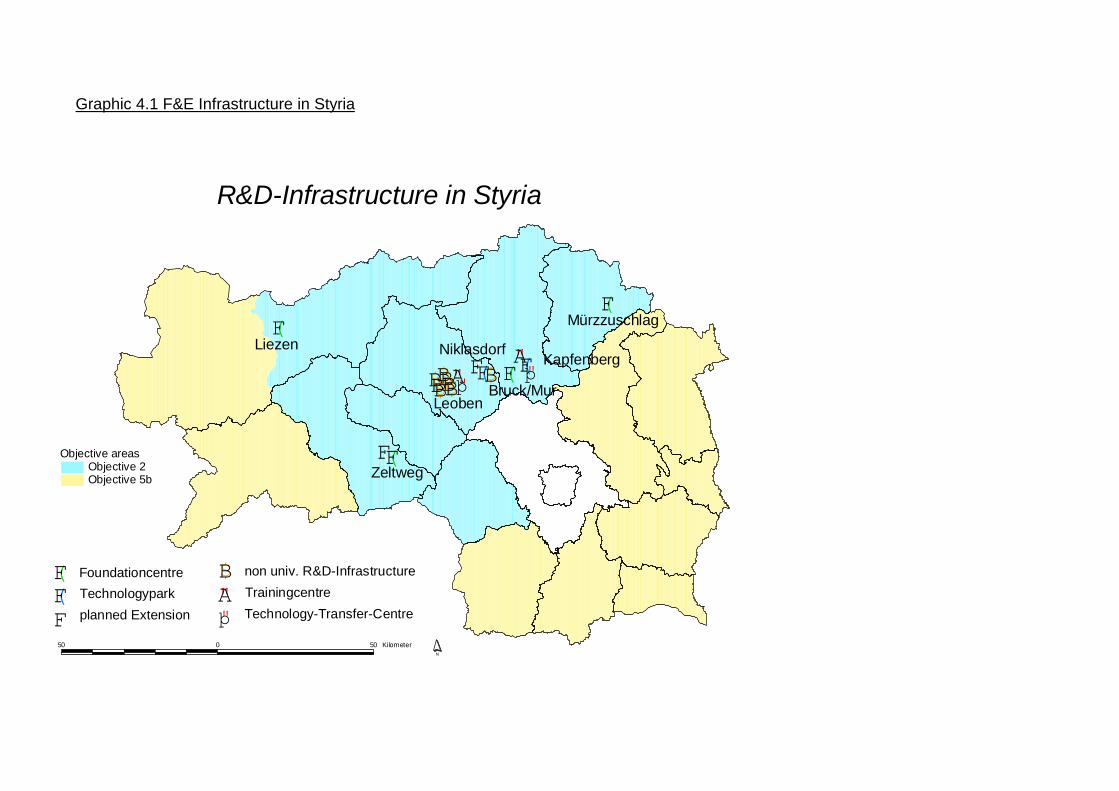
Graphic 4.1 F&E Infrastructure in Styria
R&D-Infrastructure in Styria
$B$B$B"A$B"þ$B$B(F(F$B
(F
(F
(F
"A(F
Leoben
Kapfenberg
MürzzuschlagLiezen
Zeltweg
Niklasdorf
(F
(F
FoundationcentreTechnologyparkplanned Extension
(F "A$B non univ. R&D-Infrastructure
TrainingcentreTechnology-Transfer-Centre"þ
"þ(FBruck/Mur
(F
$B
N
50 0 50 Kilometer
Objective areasObjective 2Objective 5b
40
4.3.2 Traffic Infrastructure
Regarding traffic infrastructure, road and rail projects have been speeded up during
the 1980s.
For better regional “incoming” and “outgoing”, the accelerated construction of the A9
Phyrn motorway brought lasting improvement for Upper Styria.
In the north-western direction an important connection to agglomeration in Upper
Austria and Southern Germany was installed, where only a little gap is still under
construction.
In the south-eastern direction, the centre of Graz and the state of Slovenia were
connected through the A9 Phyrn motorway.
Installed speedways mainly along the river valleys Mur and Mürz brought an
important North-South connection between the metal-processing centres in Upper
Styria. Northerly, the speedway S6 Semmering towards the agglomeration of Vienna
brought access to the A1 West- and A2 South motorway. Heading South, the
speedway S36 Murtal connects Knittelfeld and Zeltweg with the main traffic routes.
Rail infrastructure projects included the “Junction Upper Styria” for higher speed and
capacities and a double-tracked extension of the “Schoberpass”, a mountain pass
connecting Upper Styria with Upper- and West Austria and South Germany. A further
project, the “Semmering Tunnel”, connecting Upper Styria with Lower Austria for
higher speed and freight capacity, is under preparation.
4.4 Improved Information Flow
To describe the information flow between regional actors and relevant institutions, it
must be noted that the provincial industrial policy is only partly “bottom up” and
dependent on national policy as well. Despite political tensions, the federal and
provincial levels have to cooperate and following “division of labour” can be seen:
• Research and most of the technology policy is mainly federal policy,
• Firm related support (e.g. investment subsidies, training etc.) is mostly provincial
regional policy,

41
• Special programs for lagging regions, labour market policy as well as larger
infrastructure and transport projects are common policy.
Regional economic development in Styrian regions is carried out by
1) Provincial government
2) Styrian Industrial Promotion Agency (Steirische Wirtschaftsförderungs GesmbH -
SFG)
3) Intermediary organisations such as WIFI (industrial promotion institute of the
Chamber of Commerce), BFI (training institute of the Chamber of Labour), ÖAR
(organisation for endogenous regional development) and others (see
Tödtling/Sedlacek, p. 56).
Besides those institutions, further enterprise support institutions were needed to
improve the information flow. The Technology Transfer Centre (TTZ) Leoben for
example was among the first created institutions in 1986 (see 4.3.1).
Through the reorganisation of the economic development policy in the early 1990s,
the Styrian Industrial Promotion Agency (Steirische
Wirtschaftsförderungsgesellschaft - SFG) was founded in 1991. It acts as an
independent, semi-public regional development agency, owned, controlled and
financed by the provincial government. It has the goal to improve the conditions for
economic development in Styria and to support disadvantaged areas.
Together with its subsidiary Innofinanz, it not only plans, builds and supports
technology and entrepreneur centres in Styria, but also acts as a service agency,
supporting innovative activities, providing direct financial incentives incl. seed capital,
subsidies for project costs, new start-up premiums and consultancy.
Further tasks are in the area of regional development, start-up of new firms, firms in
the phase of growth, technology transfer, attraction of investment and training (see
Tödtling/Sedlacek, p. 57 and SFG).
Geldner (1995) evaluating the SFG’s support activities of “enterprises in growth” in
1993/94 identified following strategy of the SFG: backing the strong with emphasis
on innovations in technical and organisational fields (Geldner 1995, cited in: Geldner
1998, p. 171).

42
Besides the SFG and earlier mentioned institutions, further various kinds of
intermediary organisations exist. There are federal policies agencies such as the
WIFI (see above) and the AMS (Labour Market Service), both having establishments
directly in the case study region.
Besides those two, there are federal public, semi-public and private intermediary
organisations active such as the ÖAR (organisation for endogenous regional
development), BFI (training institute of the Chamber of Labour, operating several
branches in Upper Styria) or the ITF (Innovation & Technology Fund).
In order to enhance cooperation, including information, education and consulting
activities, institutions such as the Austrian Information Centre for Cooperation, the
BIT (International research and technology cooperations) or the APS (Cooperation
between Universities and Enterprises) are present (see Tödtling/Sedlacek, 1995,
p.57.).
4.5 Support and creation of cooperation and networks
A further step to improve the situation in Upper Styria was to create "territorial
networks" and "competence clusters" as a tool to improve locational quality. Styria as
the region with the most urgent problems of Old Industrial Areas was the first region
to pursue deliberately such a cluster strategy. It was partly a strategy to create and
support a new, albeit in some respects complementary, automobile cluster in the
southern part of the region in addition to the old declining concentration of steel
manufacturing in the northern part of the country. This action was appropriate as
some firms, a few of them even in dominant niches, already existed, but there was
no network linking them and an auto cluster is a good customer of steel and steel
products. The promotion was quite successful. A network was formed between
previously unconnected firms, partly situated in the old industrial area. The existing
firms expanded, cooperation and specialization increased, and foreign investment
was attracted. To form a cluster of previously unconnected firms and to upgrade the
product was certainly good regional policy, particularly as a part of the cluster is
based on top know-how in the construction of diesel engines and four-wheel-drive
equipment (Tichy 1998).

43
Yet the explicit aim of this cluster philosophy was more than a replacement and
support of the old cluster: It was meant to "aim at empowering entrepreneurs. By that
we mean their ability to use global competition as an opportunity. To put it even more
clearly: We would like to see ineffective mechanisms of protection replaced by
'upgrading' and entrepreunerial fitness. In achieving this goal, we regard the cluster
philosophy, already a fixed element of the Styrian subsidy policy, to be a most
appropriate instrument" (original quotation by H.Paierl, regional minister for
Economic Policy of Styria, 1997, p.7).
In doing so this philosophy relies on the discrete charm of clusters, on the well-
founded assumption that regional specialization on interlinked activities of
complementary firms (in production and service sectors) and their cooperation with
public, semipublic and private research and development institutions creates
synergies, increases productivity, and leads to economic advantages. In line with
Jacobs and de Man (1996) this is the third phase of industrial regional policy – after a
first phase of "backing losers" and a second of "picking winners" this is the next
stage - "backing the winner" - with a more modest ambition of combining the strong
aspects of the previous phases (for an evaluation of the risks of such a strategy see
Steiner 1998).
This "cluster philosophy" especially pronounced in Styria is gaining an impetus of its
own. Different forms of cooperation and networks are emerging also in other sectors.
Steiner/Hartmann (1998) analysed links and cooperations between SMEs in the
material- and metal-processing sector in Upper Styria. Through intensive field
research, close networks and value-chain relations among 38 firms embedded in
regional networks and interfirms links (“mapping” of the cluster) could be identified.
Since SMEs were either integrated or strongly dependent on large enterprises, no
predefined cluster existed.
Of special interest were projects relating to learning activities in the cluster and
networks and interfirm links reacting through the cluster. Two network structures and
13 links between the 38 firms were identified with strong elements of interfirm
learning. This is the more important because the decline of Upper Styria was to a
large degree caused by an inability to learn new forms of behaviour and a
preservation of old ones. The reported attempts to develop a culture of learning
among SMEs may be also interpreted as a regional process of "unlearning" old

44
habits (something that is harder than learning new ones). Therefore, SME cluster
creates for the region as a whole positive spill-over and demonstration effects as to
the importance of joint learning.
These cluster firms are embedded in a rich environment These cluster firms are
embedded in a rich environment of enterprise supporting institutions. Examples of
research, technology and development institutions are the Montanuniversity Leoben,
Christian Doppler Laboratories, Joanneum Research and the Technology Transfer
Centre in Leoben. In addition, several training institutions ensure transfer of new
knowledge to the firms.
4.6 Towards a regional Innovation system in Styria
A so far last step in the process of reconversion of this old industrial area is the
attempt to integrate it in the combined strategies and instruments of a national and
regional innovation system. Innovation is now understood to be an iterative
interaction between a wide range of actors including research organisations, firms,
policy providers and the market. This is a very different understanding to the former
linear model which supposed a series of clear phases from concept development to
product launch. The new model of innovation is considerably more complex involving
a greater number of actors and focusing as much on relationships and the operation
of systems and networks as on the individual actors themselves. Further, research
into the process of learning and knowledge transfer also identifies much knowledge
as tacit and collective and therefore linked it to its human and social context. Taken
together, these concepts bring into sharper focus the role of the social environment
within which innovation actors operate.
This approach puts more emphasis on activities on a regional and local level. The
exceptional feature of the regional level of policy making is the fact that the region
can provide a more appropriate spatial dimension for the design and implementation
of elements of technology and/or innovation policy. The potential benefits of regional
policy derive either from a greater knowledge of the relevant characteristics of the
local economy or from the establishment of a local network and institutions which

45
have a direct interest in the success of programmes and policies. (Joanneum
Research/European Policies Research Centre, 1998).
The activities for Upper Styria are now strongly embedded in a general strategy to
"upgrade" Styria's economy by means of an explicit Technology and innovation
oriented policy. The "Styrian Technology Policy Concept", elaborated by Joanneum
Research (see Steiner et al. 1996) proposes three main strategies:
(1) cooperation,
(2) absorption and diffusion,
(3) quality and qualification
Regarding cooperation, the intention is to reduce barriers by focusing on industrial
clusters, creating synergy effects for the firms and providing a common
infrastructure. In addition to the strengthening of traditional clusters (materials &
metals, wood & papers, vehicles), new environment activities (an “eco-cluster”)
should be built up and supported.
The strategy of absorption and diffusion of new technologies intends to enforce
regional competitiveness, especially the quality of goods and services and
productivity. Information deficits about new technology or the lack of technical and
managerial qualifications for adaptation should be lowered for SMEs.
The quality and qualification goal focuses in a continuous adaptation of production
technologies and an innovation oriented qualification of staff members. A better
integration of learning is intended but also cluster specific qualification strategies
have to be developed.
In this context Upper Styria has - with its innovative firms, potential clusters and
proximity to varied knowledge suppliers in form of three Universities, various
Technology Centres and Research Institutions - strong elements for a dynamic
“regional innovation system”. Only the degree of systemness needs to be clarified
and further explored.

46
5- Lessons to be drawn?(still to be completed)
The history, the empirical analysis, theoretical foundations and policy strategies of
OIAs - in the specific case of Styria, but in other cases as well (for a recent overview
of comparable regions and analyses see e.g. Boschma/Lambooy 1999) - may they
serve for an interpretation for processes of change in the countries in transition?
Let us first summarize what lessons are drawn from the experience and attempts of
reconversion of OIAs per se:
1) Structural change is unavoidable, also (and especially) in a growing economy.
OIAs were for a long time prosperous regions with a growing output; yet this
growth destroyed the conditions for survival - the successful products stayed too
long within the region. If the ageing product cannot leave the region, it changes
the region for worse - it binds its resources which usually are used to find new
products and processes. Monostructure is then a result - not a cause - of its
behaviour.
2) The incomplete adjustment process is mainly a problem of information and
negligence of relevant signals. Structural change therefore hardly comes from
within (from the "market"), but is forced from outside (from "policy").
3) Decision makers inside the region (management, unions, politicians) therefore do
not act, but react - mostly by further concentration and fusion, by closing in, with
strong elements of rent seeking nurtured by fear leading to collusive behaviour.
4) The process of reconversion is a time consuming process including several steps
and a sequence of different instruments used. It is not done by means of a "big
bang" leading to sudden closures and redundancies. Even from an economic
point of view this would be counterproductive leading to discouragement. A
change in mentality - learning and rebuilding - needs long phases of life. So
institutions have to be found which are able to give time (it took Upper Styria
about 20-30 years to manage the process of reconversion).
5) The market is not capable of delivering this process.
47
Are these lessons applicable to structural problems of countries in transition? The
main arguments against the transferability of policies and strategies may be the
following:
1) The countries in transition are faced with a completely different situation - they (or
parts of them) are not old industrial areas but they suffer from an economy not
yet adjusted to normal market situations.
2) If there are comparable problems they are rather sectorspecific than regional - as
a consequence strategies should be aimed at specific sectors and industries not
at regions.
3) There is no specific need for a targeted policy, neither to sectors nor to regions, a
general strategy to support the transition to a market economy will suffice.
Yet there are several strong arguments in favour of lessons to be draw from this
"western" experience:
1) The so-called countries in transition are not countries in transition any more.
2) Problems of a lacking adaptability are not problems of sectors and of
monostructure.
3) A specific policy focussed on the regionally concentrated structural problems
remains necessary and calls for a well designed mixture of institutions giving the
right incentives, passing on the relevant information and allowing for the
necessary time.

48
Acknowledgements: This paper is partly supported by research connected with the
"Inco-Copernicus" joint research project "Modernization of Traditional Industries in
Countries in Transition on the Basis of the Knowledge from the Restructuring of Old
Industrial Areas in Austria and Germany" cofinanced by the European Commission. I
would like to thank Christian Hartmann and Roland Hammer for assistance in the
preparation and compilation of the empirical material.

49
References
Aiginger, K. (1986), Ursachen und Perspektiven der Stahlkrise, in:
Wirtschaftspolitische Blätter 5/86, Vienna, pp. 493-515.
AK Steiermark (1998), Regionalstatistik Steiermark, Kammer für Arbeiter und
Angestellte für Steiermark (ed.), Graz.
Akerlof, G. A., Main, G. M. (1981), An Experience-weighted Measure of Employment
and Unemployment Durations, American Economic Review, pp. 1003-1011.
Boschma, R., Lambooy, J. (1999), Why Do Old Industrial Regions Decline? An
Exploration of Potential adjustment Strategies, Paper presented at the 39th
Congress of the European Regional Science Association, Dublin, Ireland.
Brenton, P., Gros, D., Vandille, G. (1997), Output Decline and Recovery in the
Transition Economies: Causes and Social Consequences, Vol. 5, pp. 113-130.
Chenery, H. (1960), Patterns of Industrial Growth, American Economic Review, Vol.
50, pp. 624-654.
Chenery, H. (1969), The Process of Industrialization, Harvard University Center for
International Affairs, Economic Development Report, No. 146, Harvard
University, Cambridge.
Chinitz, B. (1961), Contrasts in Agglomeration: New York and Pittsburgh, American
Economic Review, Vol. 51, pp. 279-289.
Clark, K. B., Summers, L. H. (1979), Labour Market Dynamics and Unemployment: a
Reconsideration, Brookings Papers on Economic Activity, pp. 13-72.
Cyert, R. M., March, J. G. (1963), A Behavioral Theory of the Firm, Englewood Cliffs,
Prentice Hall, New York.
Döhrn, R., Heilemann, U. (1992), Zur allokativen Dimension: Sektorale
Entwicklungsperspektiven für Ungarn, Polen und die CSFR, in:
Wirtschaftsreformen in Mittel- und Osteuropa, Beiheft zur Konjunkturpolitik, Heft
40, Berlin, pp. 51-69.
Ellinger, R. (1977), Industrial Location Behavior and Spatial Evolution, Journal of
Industrial Economics, 25, pp. 295-312.

50
Geldner, N. (1983), Der Problemfall alter Industriegebiete, in: Realisierung des
österreichischen Raumordnungskonzeptes, Schriftenreihe Raumplanung für
Österreich.
Geldner, N. (1989), Das Altern von Wirtschaftsregionen, in: WIFO Monatsberichte,
Vol. 5/1989, Vienna, pp. 346-356.
Geldner, N. (1995), Evaluierung der steirischen Wirtschaftsförderung, WIFO, Vienna.
Geldner, N. (1998), Erfolgreicher Strukturwandel in der Steiermark, in: WIFO
Monatsberichte, Vol. 3/1998, Vienna, pp. 167-172.
Haller, M., Höllinger, F. (1994), Sozialstruktur Steiermark - Basisdaten zur
Bevölkerungs- und Sozialstruktur der Steiermark und ihrer Entwicklung von 1961
bis 2031, ARGE für Sozialforschung und Sozialplanung Steiermark (ed.), Graz.
Hartmann, C., Habsburg-Lothringen, C., Kremshofer, A., Mörtlbauer, U., Pieber, E.
(1998), F&E-Infrastruktur in den Zielgebieten der Steiermark, Joanneum
Research, Graz.
Hirsch, S. (1967), Location of Industry and International Competitiveness, Clarendon,
Oxford.
Hirschman, A. (1958), The Strategy of Economic Development, Yale University
Press, New Haven.
Jacobs, D., de Man, A.-P. 1996, Clusters, Industrial Policy and Firm Strategy: a
Menu Approach, Technology Analysis and Strategic Management 8, pp. 425-
437.
Joanneum Research, European Policies Research Centre (1998), (Jud, T., Sturn, d.,
Downes, R., Rooney, M.-L.), The Regionalisation of RTD Policy - International
Experience and Lessons for Austria, mimeo, Wien, Glasgow.
Kindleberger, Ch. P. (1978), The Aging Economy, WA 114(3), pp. 407-421.
Kirzner, J. M. (1980), The Primacy of Entrepreneurial Discovery, in: Institute of
Economic Affairs (ed.), The Prime Mover of Process, London.
Kubin, I., Steiner, M. (1992), Labour Market Performance and Regional Types: A
Conceptual Framework with Empirical Analysis of Austria, in: International
Regional Science Review, Vol. 14, No. 3, pp. 275-298.

51
Kuznets, S. (1958), Quantitative Aspects of the Economic Growth of Nations, Part 3,
Industrial Distribution of Income and Labor Force by States, United States, 1919-
1921 to 1955, Economic Development and Cultural Change 6, pp. 1-124.
Machlup, F. (1958), Structure and Structural Change: Weaselwords and Jargon,
Zeitschrift für Nationalökonomie, Vol. XVIII, pp. 280-298.
Markusen, A. R. (1985), Profit Cycles, Oligopoly and Regional Development,
Cambridge Mass./ London (MIT Press).
Münz, R. (1999), Obersteiermark: Noch ist die Abwanderung nicht gestoppt, in:
Kleine Zeitung on January 28 1999, Graz.
Nelson, R. / Winter, S. (1982), An Evolutionary Theory of Economic Change,
Harvard University Press, Cambridge, MA.
Olson, M. (1982), The Rise and Decline of Nations, Economic Growth, Stagflation
and Social Rigidities, Yale University Press, New Haven.
Paierl, H. (1997), Competence Clusters, Leykam, Graz.
Phelps, E. et al. (1970), Microeconomic Foundations of Employment and Inflation
Theory, Macmillan, New York.
Piore, M. (1975), Notes for a Theory of Market Stratification, in: Edwards, E. et al.
(eds.), Labour Market Segmentation, Lexington.
Prisching, M. (1985), Die Stagnation von Regionen und Branchen, Eine Theorie
sozioökonomischer Anpassungsprozesse, Wirtschaft und Gesellschaft 11 (2),
pp. 175-194.
Prisching, M. (1986), Krisen: Eine soziologische Untersuchung, Böhlau, Wien.
Radnitzky, G. (1984), Die ungeplante Gesellschaft, Hamburger Jahrbuch für
Wirtschafts- und Gesellschaftspolitik, 29, pp. 9-33.
Sallant, S. (1977), Search Theory and Duration Data: a Theory of Sorts, Quarterly
Journal of Economics, pp. 39-57.
Simon, H. A. (1959), Theories of Decision Making in Economics. American Economic
Review 49(3), pp. 253-283.
Simon, H. A. (1983), Reason in Human Affairs, Stanford University Press, Stanford.
52
Steiner, M. (1981), Zur Aussagekraft von Normalstrukturmodellen, Empirica, Vol. 1,
pp. 110-121.
Steiner, M. (1985), Old Industrial Areas: A Theoretical Approach, in: Urban Studies,
Vol. 22, pp. 387-398.
Steiner, M. (1990), Good and Bad Regions?, in: Built Environment, Vol. 11, No. 8,
pp. 483-498.
Steiner, M. (1990a), Regionale Ungleichheit, Böhlau, Wien/Köln.
Steiner, M. (1998b), The Discreet Charm of Clusters: An Introduction, in: Steiner, M.
(ed.), Clusters and Regional Specialisation, pp. 1-17, Pion, London.
Steiner, M., Belschan, A. (1991), Technology Life Cycles and Regional Types: An
Evolutionary Interpretation and Some Stylized Facts, in: Technovation, Vol. 11,
No. 8, pp. 483-498.
Steiner, M., Hartmann, C. (1998), Learning with Clusters: A Case Study from Upper
Styria, in: Steiner, M. (ed., 1998), Clusters and Regional Specialisation, Pion,
London, pp. 211-225.
Steiner, M., Jud, T., Pöschl, A., Sturn, D. (1996), Technologiepolitisches Konzept
Steiermark, Leykam, Graz.
Steiner, M., Posch, U. (1985), Problems of Structural Adaptions in Old Industrial
Areas: A factor-analytic Approach, Environment and Planning A 17, pp. 1127-
1139.
Steiner, M., Sturn, d., Wendner, R. (1993), Wirtschaftspark Obersteiermark, Studie
im Auftrag der Wirtschaftspark-Entwicklungs-GmbH, Graz
Steiner, M., Wendner, R. (1993), Alte Industriegebiete: Wo bleiben die Arbeitslosen?
Untersuchung am Beispiel der Obersteiermark, in: Wirtschaft und Gesellschaft,
vol. 19, No. 1, pp. 11-27.
Tichy, G. (1979), Zahlungsbilanz- und beschäftigungsrelevante Strukturprobleme von
Industrie und Gewerbe und Ansatzpunkte zu ihrer Überwindung, Quartalshefte der
Girozentrale 14(S1), pp. 77-131.
Tichy, G. (1981), Alte Industriegebiete in der Steiermark – Ein weltweites Problem
ohne Lösungsansätze, Berichte zur Raumforschung und Raumplanung 25(3), pp.
18-26.

53
Tichy, G. (1986), Neue Anforderungen an die Industrie- und Innovationspolitik in
Österreich, in: K. Aiginger (ed.) Weltwirtschaft und unternehmerische Strategien,
Fischer/WIFO, Stuttgart/Wien, pp. 65-90.
Tichy, G. (1987), Entwicklungstendenzen und Strukturprobleme der Steirischen
Wirtschaft, Research Memorandum 8701 der Nationalökonomischen Institute der
Karl Franzens-Universität Graz.
Tichy, G. (1994a), Überlegungen zum Leben nach dem Stahl, in: ÖIR (ed.), Raum,
Vol. 13, Vienna, pp. 19-21.
Tichy, G. (1994b), Schlagende Risiken. Die Sanierung der Obersteiermark - Eine
Zwischenbilanz, in: Was - Zeitschrift für Kultur und Politik, Vol. 74, Mürzzuschlag,
pp. 25-36.
Tichy, G. (1994c), Vom vergangenen, laufenden und künftigen Strukturwandel: Zur
Dynamik der steirischen Wirtschaft, in: Steirische Statistiken - 100 Jahre
Landesstatistik, Amt der Steiermärkischen Landesregierung - Präsidialabteilung,
Referat Statistik (ed.), Jg. 38, Graz, pp. 13-36.
Tichy, G. (1998), Clusters: Less Dispensable and More Risky than Ever, in: Steiner,
M. (ed.), Clusters and Specialisation, pp. 226-237, Pion, London.
Tödtling, F., Sedlacek, S. (1997), Regional Economic Transformation and the
Innovation System of Styria, in: European Planning Studies, vol. 5, No. 1, 1997,
Arlington, Oxfordshire, pp. 43-63.
Vernon, R. (1966), International Investment and International Trade in the Product
Cycle, QJE 80(2), pp. 190-207.
Welfens, P.J.J. (1997), Osteuropäische Transformation, EU-Integrationsdynamik und
Perspektiven der Osterweiterung, in: Cassel, D. (ed.), Europäische Integration als
ordnungspolitische Gestaltungsaufgabe, Schriften des Vereines für Socialpolitik,
Band 260, Duncker&Humblot, Berlin.

54
Source
AK Steiermark, Regionalstatistik Steiermark 1998, Graz, 1998.
LASTAT, Volkszählung 1991 - Ergebnisse III, vol. 1/96, Graz, 1996.
ÖSTAT, Volkszählung 1971 - Ergebnisse Steiermark, Vienna, 1985.
ÖSTAT, Volkszählung 1981 - Hauptergebnisse II Steiermark, Vienna, 1985.
ÖSTAT, Volkszählung 1991 - Hauptergebnisse II Steiermark, Vienna, 1995.
VOEST-Alpine, under: www.voest.co.at. on July 29th, 1999.
Wirtschaftskammer Steiermark, 1999, Unternehmensneugründungen in der
Steiermark 1993-1998, Graz.