Institute of Science & Technology for Advanced Studies ...istar.edu.in/doc/2018/newsltr/2.pdf ·...
31
Institute of Science & Technology for Advanced Studies & Research (ISTAR) Accredited with ‘A’ Grade by NAAC & KCG FLIPSIDE Institute 1 Departments 7 Articles 17 Media 23 Contact 30 DECEMBER (2018) VOLUME 1, ISSUE 1I Patron Er. Bhikhubhai B. Patel Chairman, CVM Co-Patron Chief Editor Shri Manishbhai S. Patel Vice-President, CVM Prof. Nirmal Kumar, J.I. Principal, ISTAR Executive Editor Dr. Hiren B. Soni (EST) Associate Editors Er. Rupesh T. Shah (MVAL) Dr. Himanshu Kapse (INC) Section Editors Dr. Niraj H. Patel (OC) Dr. Nirmal Patel (IC) VISION To add significantly to our enduring civilizational tradition of pioneering excellence in learning, knowledge, enlightenment and self-realization, in a universally relevant context. OBJECTIVES 01. To create and nourish a stimulating learning environment that ensures a globally relevant Education based on Eternal human valuers; 02. To forge and reward excellence in the curricu- lar as well as the non-curricular sectors so as to ensure the scholars' global competitiveness; 03. To tap, nurture and unleash the innovative entrepreneurial abilities of scholars and thereby ensure lifelong socioeconomic, value addition; 04. To evoke and embellish the finest traits of human excellence that go on to dovetail into a sustainable career growth curve; 05. To affiliate, associate, liaise or otherwise synergize with any institution, body, entity, ethno cultural diaspora and the overall global fraternity in any form whatsoever, in support of the above; 06. To initiate, consolidate and extrapolate any objectives, functions and activities in support of MISSION We dedicate ourselves to the perpetuation of our Founders' Vision of providing the infrastructure, facilities, operating conditions and overall environment conducive to the Education of young scholars, along with the desired physical, mental and character building inputs; we firmly renew our commitment to providing value added, globally relevant Education with an emphasis on the Techno Management domain, to ensure that our scholars fruitfully exercise their knowledge, skills and values in the global economy. Editorial Team Dr. Hiren B. Soni Er. Rupesh T. Shah Dr. Himanshu Kapse Dr. Niraj H. Patel Dr. Nirmal Patel Chairman’s Message I am glad to know that ISTAR is bringing out Second Issue of College Magazine INSPIRE at the end of this year. This is yet another milestone embodies curricular and co-curricular activities and praiseworthy achievements of the institute. I hope that 2 nd issue will surely inculcate creative and hidden talents of students and faculty of the institute. I convey Happy New Year Wishes to students and staff of ISTAR for prosperous coming year (2019). Er. Bhikhubhai B. Patel Chairman, CVM
Transcript of Institute of Science & Technology for Advanced Studies ...istar.edu.in/doc/2018/newsltr/2.pdf ·...

Institute of Science & Technology for Advanced Studies & Research (ISTAR) Accredited with ‘A’ Grade by NAAC & KCG
F L I P S I D E
Institute 1
Departments 7
Articles 17
Media 23
Contact 30
D E C E M B E R ( 2 0 1 8 ) V O L U M E 1 , I S S U E 1 I
Patron
Er. Bhikhubhai B. Patel
Chairman, CVM
Co-Patron
Chief Editor
Shri Manishbhai S. Patel
Vice-President, CVM
Prof. Nirmal Kumar, J.I.
Principal, ISTAR
Executive Editor
Dr. Hiren B. Soni (EST)
Associate Editors
Er. Rupesh T. Shah (MVAL)
Dr. Himanshu Kapse (INC)
Section Editors
Dr. Niraj H. Patel (OC)
Dr. Nirmal Patel (IC)
VISION
To add significantly to our enduring civilizational
tradition of pioneering excellence in learning,
knowledge, enlightenment and self-realization, in
a universally relevant context.
OBJECTIVES
01. To create and nourish a stimulating learning
environment that ensures a globally relevant
Education based on Eternal human valuers;
02. To forge and reward excellence in the curricu-
lar as well as the non-curricular sectors so as to
ensure the scholars' global competitiveness;
03. To tap, nurture and unleash the innovative
entrepreneurial abilities of scholars and thereby
ensure lifelong socioeconomic, value addition;
04. To evoke and embellish the finest traits of
human excellence that go on to dovetail into a
sustainable career growth curve;
05. To affiliate, associate, liaise or otherwise
synergize with any institution, body, entity, ethno
cultural diaspora and the overall global fraternity
in any form whatsoever, in support of the above;
06. To initiate, consolidate and extrapolate any
objectives, functions and activities in support of
MISSION
We dedicate ourselves to the perpetuation of our Founders' Vision of providing
the infrastructure, facilities, operating conditions and overall environment
conducive to the Education of young scholars, along with the desired physical,
mental and character building inputs; we firmly renew our commitment to
providing value added, globally relevant Education with an emphasis on the
Techno Management domain, to ensure that our scholars fruitfully exercise
their knowledge, skills and values in the global economy.
Editorial Team
Dr. Hiren B. Soni Er. Rupesh T. Shah Dr. Himanshu Kapse
Dr. Niraj H. Patel Dr. Nirmal Patel
Chairman’s Message
I am glad to know that ISTAR is bringing out Second Issue of
College Magazine INSPIRE at the end of this year. This is yet
another milestone embodies curricular and co-curricular
activities and praiseworthy achievements of the institute. I
hope that 2nd issue will surely inculcate creative and hidden
talents of students and faculty of the institute. I convey
Happy New Year Wishes to students and staff of
ISTAR for prosperous coming year (2019).
Er. Bhikhubhai B. Patel
Chairman, CVM

Inspire 1 (2): 1
ACTIVITIES & ACHIEVEMENTS OF ISTAR
19th Annual Day of ISTAR was celebrated on 5th March, 2018 and Dr. Rathnam,
Managing Director, AMUL Dairy, Anand, was invited as a Chief Guest.
Annual Alumni Meet & Alumni Felicitation Program was organized on the Annual
day.
5th June was celebrated as “World Environmental Day” by conducting Tree
Plantation Program by Respected Manish S. Patel Sir, Vice-President, CVM, and
Shri Vishal Patel, Hon. Jt. Secretary, CVM.
Independence Day was jointly celebrated on 15th August, 2018 with SICART and
RN Patel Ipcowala School of Law and Justice.
“Janmashthami” and “Teachers Day” were celebrated on 5th September, 2018.
WDC (Women Development Cell) Committee celebrated “Women's Day” on 17/9/2018.
“Ratri Before Navratri” was celebrated on 8th October, 2018.
All Departments arranged Open House, Student Counseling, and Industrial Visits.
CVM IAS Academy conducted an interactive Session on UPSC and GPSC Civil Services
Examination Awareness at ISTAR on 5.7.18
Yoga Training Program in association with Art of Living Organization, Anand Chapter,
on 19-21.6.18
Inspire 1 (2): 2
Celebration of World Environment Day & Distribution of Eco-friendly Bags @
ISTAR on 5.6.18
Aarti on Ratri Before Navratri Dahi Handi (Matki Fod) on 5.9.18
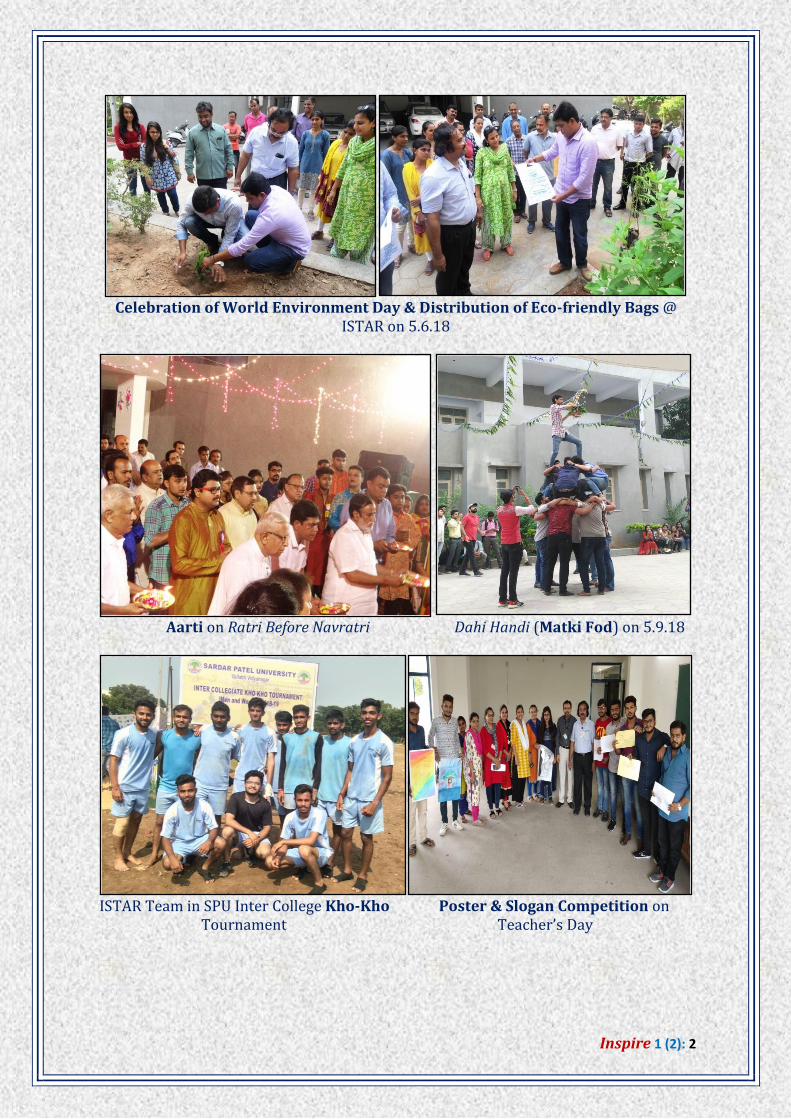
ISTAR Team in SPU Inter College Kho-Kho Poster & Slogan Competition on
Tournament Teacher’s Day

Inspire 1 (2): 3
Rangoli Competition on Women’s Day Patriotic Song Competition
STUDENTS CENTRIC PROGRAMS
Conferences/Seminars/Workshops 11
Expert Lectures 24
Training Programs 02
Short Term / Certificate Courses 07
Skill Development Program 01
Entrepreneurship 01
Industrial / Field Visits 21
Guest Faculty Members Support 43 hrs./Week
No. of Students Graduated 335/343
INSTITUTIONAL ACHIEVEMENTS
High Record of Placements in almost all subjects through On-Campus and Off-
Campus interviews.
Nine Students received Gold Medals during S.P. University Convocation held on 17th
December, 2018.
Dr. Suchita Patel, Dr. Niky Jain. Er. Rupesh Shah, Dr. Himanshu Kapse, Mr. Baiju
Verghese, and Dr. Hiren B. Soni attended Indo-UK Program “IFDP – International
Faculty Development Program” (Phase-I & II) at MHRD-SPU, in the month of August
& September, 2018.
All ISTAR faculty members attended KIA (Kaizen Initiative for Academics)
Workshop – School Parenting & Teaching Methods in the month of September &
October, 2018.
Three Faculty Members (Dr. Niky Jain, - IT; Dr. Dhruti S. Patel – EST; and Dr.
Suchita Patel - IT) received Ph.D. Degree.
Prof. Nirmal Kumar J.I. received Gold Medal Award of “Bharat Ratna Dr. Sarvepalli Radhakrishnan” on 22nd September, 2018 in the field of Education and Research by
Global Education Progress and Research Association (GEPRA), Chennai.
Two Ph.D. Students (Ms. Dipa Lalwani & Ms. Pooja Thaker) under Prof. Nirmal
Kumar, J.I, pursuing research work at free of cost (worth Rs. 6,00,000/-) in AIST,

Inspire 1 (2): 4
Japan for Three years. Both students visited Japan from May to November, 2018, and
will visit AIST from May, 2019 again to pursue further research.
International Seminar of Hygiene and Safety was organized in Hotel Novatel,
Pune, from 22nd to 24th January, 2018 funded by CIHA, USA.
National Seminar was conducted on “Advancements in Chemical Technology - A
Green Perspective”, by IC Department, on 20th January, 2018, funded by Transpek
Industries, Vadodara, Aether Industries, Sachin.
National Seminar was held on 30th January, 2018, on “Environment, Pollution
and Climate Change”, jointly organized by P.G. Department of Environmental
Science & Technology and Department of Biological and Environmental Science, NV
Patel College, funded by Gujarat Ecology Commission (GEC), Gandhinagar.
National Conference was held on 17th February, 2018 on “Paradigm Shift in
Valuation Profession”, funded by CVSRTA – Alumni Association of Valuation
Department of ISTAR & BVM.
Bagged 1st Prize in ‘Women and Environment’ Symposium, Organized by
Vidyanagar Nature Club (VNC) and CVM Women Development Cell on 5th October,
2018.
Won SP University Championship in the Table Tennis Tournament for the year
2018.
STUDENTS SCHOLARSHIPS
Sr.
No. Department Amount
1. Industrial
Chemistry
Rs. 30,000/-
(Lupin Ltd. For Topper)
Rs. 20,000/-
(MISA for 2 students)
2.
Surface
Coating
Technology
Rs. 2,59,000/-
(Asian Paints Charitable Trust
for 5 students)
3.
Environmental
Science and
Technology
Rs. 1,00,000/- towards Ph.D. Term fees, and Free-
ship worth Rs. 6,00,000/- for stay, food, etc. to Two
Ph.D. Students by Dr. Nobuyoshi Yamashita, Chief
Senior Research Scientist, AIST, Tsukuba, Japan
NSS ACTIVITIES @ ISTAR
NSS Unit has been officially approved by SP University at ISTAR.
NSS Unit of ISTAR adopted Lambhvel Village on 3rd December, 2018 for next Three
(3) Years.
Conducted “Yoga Training Program” from 19th to 21st June, 2018, associated with
Art of Living Organization, Anand Chapter, to all Staff Members.
“NSS Orientation Program” for First Year Students was conducted on 2nd August,
2018, by Dr. Jagruti Suvera (SPU), and Dr. Yogesh Patel (In-Charge, Non-Academic
Forum, CVM).

Inspire 1 (2): 5
Thalassemia Check-up & Blood Donation Awareness Sessions were conducted by
Dr. Isha Desai, NVPAS, on 6th September, 2018.
‘Blood Donation Camp & Thalassamia Check-up’ was organized in association with Indian Red Cross Society & Lioness Club of Anand on 7th September 2018.
‘Swachta Abhiyan Pakhvadiu’ was celebrated from 15th September to 2nd
September 2018.
Banner Making Competition was held on the theme of ‘Swachchhta Abhiyan’ on NSS Day (24th September, 2018).
Expert Talk on ‘Swachchhta Abhiyan’ on NSS Day (24th September, 2018) was
delivered by Dr. M.G. Mansoori, Head, Psychology Department, Nalini Arvind & T.V.
Patel Arts College, Vallabh Vidyanagar.
Thalassemia Check-up Camp at ISTAR, One Day NSS Camp at Amod Village, Medical
Check-up Camp at Amod Village by NSS Unit of ISTAR
SPORTS ACTIVITIES @ ISTAR
Achievements in Sports Competitions
1. Kashyap Goswami secured 1st Position in Judo (90 kg Category): in the Inter-
Collegiate SPU Tournament.
2. Sweta Chauhan & Team won Championship in Kabaddi in Khel Mahakumbh -
2018 from Anand District and at State Level against Tapi District.

Inspire 1 (2): 6
3. Satpal Baria (C), Lalu Sharma, Maulikkumar Patel, Satyajeetsinh Raj, Karankumar
Solanki, Shivrajsinh Solanki won Championship in Kho-Kho in Khel Mahakumbh -
2018 from Lunawada at Taluka Level and secured 2nd Position at District Level.
Selection of ISTAR Students in SPU Team for Inter University
Tournament
Sr.
No. Name of Player Event Remarks
1. Kashyap
Goswami Judo Selected for National Events
2. Rushabh Shah Table
Tennis Selected for Sardar Patel University team
3. Satpal Baria,
Lalu Sharma Kho-Kho
Primary Selection for Sardar Patel
University Team
NEW INITIATIVES OF ISTAR
o Green Audit Cell, CVM, has been initiated, and audited 34 Institutions of CVM.
o My Campus – Clean Campus Drive by NSS Wing.
o Institutional Data was uploaded to KCG and NIRF to MHRD, New Delhi, on 30th
November, 2018, by Dr. Hiren B. Soni (EST).
o Institutional E-Magazine “INSPIRE” started, and edited by Dr. Hiren B. Soni, Dr. Niraj
Patel, Mr. Rupesh Shah, Dr. Himanshu Kapse, and Dr. Nirmal Patel.
Inspire 1 (2): 7
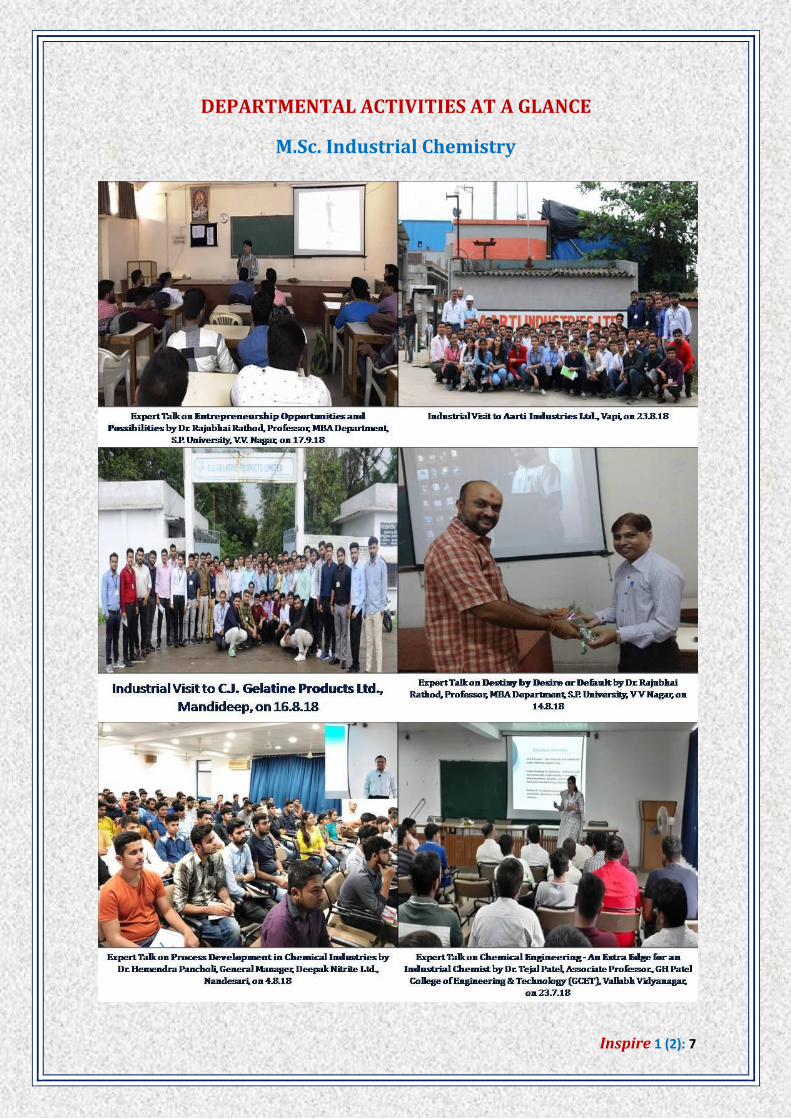
DEPARTMENTAL ACTIVITIES AT A GLANCE
M.Sc. Industrial Chemistry

Inspire 1 (2): 8
M.Sc. Surface Coating Technology
Activities with MoU Partners
Dr. Kalpesh Patel contributed an Article on Resins & Binders for ABCD Paint News
(Magazine by Indian Small Scale Paint Association (ISSPA - Gujarat Region)
Dr. Tejas Shah (Visiting Faculty), contributed an Article on Pigments & Extender
for ABCD Paint News
Scholarships
Asian Paints Charitable Trust Scholarship was received by Five Students of 1st
Semester, worth Rs. 51,800/- each.
1. Homi Sachivekumar Mody
2. Vaibhav Bharatbhai Rabadiya
3. Rameshchandra M Purohit
4. Anand Mineshbhai Adeshara
5. Tusharkumar Pravinbhai Patel

Inspire 1 (2): 9
M.Sc. Organic Chemistry
M.Sc. Polymer Science & Technology

Inspire 1 (2): 10
M.Sc. Environmental Science & Technology

Inspire 1 (2): 11
Activities with MoU Partners

Inspire 1 (2): 12
M.Sc. Industrial Hygiene & Safety
M.Sc. (Real Estate Valuation) & (Plant & Machinery Valuation)
Rushabh R. Shah was selected in Sardar Patel University Team of Table Tennis, and
played Inter University Tournament at Nanded (Maharashtra)

Inspire 1 (2): 13
Best Out of Waste Competition by M.Sc. Valuation Students
M.Sc. Instrumentation & Control
Seminars / Workshops Attended 1. Dr. H.N. Kapse attended Online Workshop on Geospatial Technologies and Sendai
Framework for Disaster Risk Reduction on 10.7.18, and KIA Workshops of CVM,
on 31.8.18 & 26.9.18
2. Ms. Radhika Shah attended Workshop on Woman Empowerment on 23.6.18

Inspire 1 (2): 14
M.Sc. Geoinformatics
Inspire 1 (2): 15
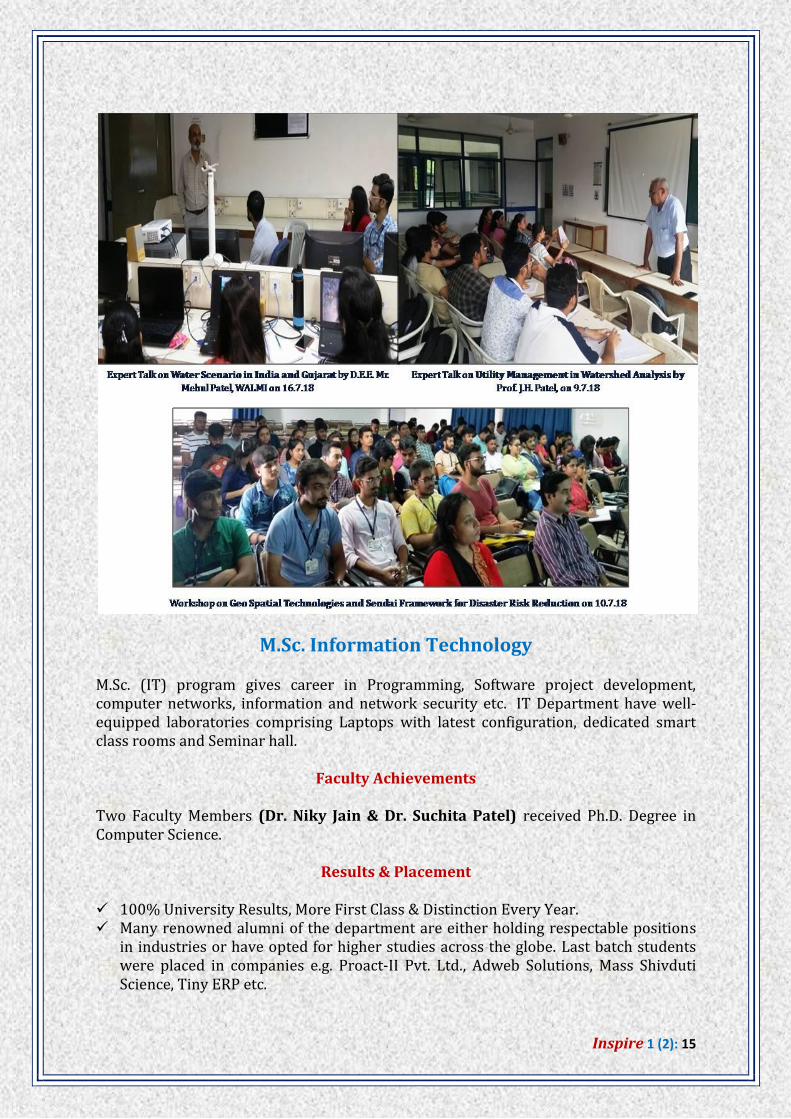
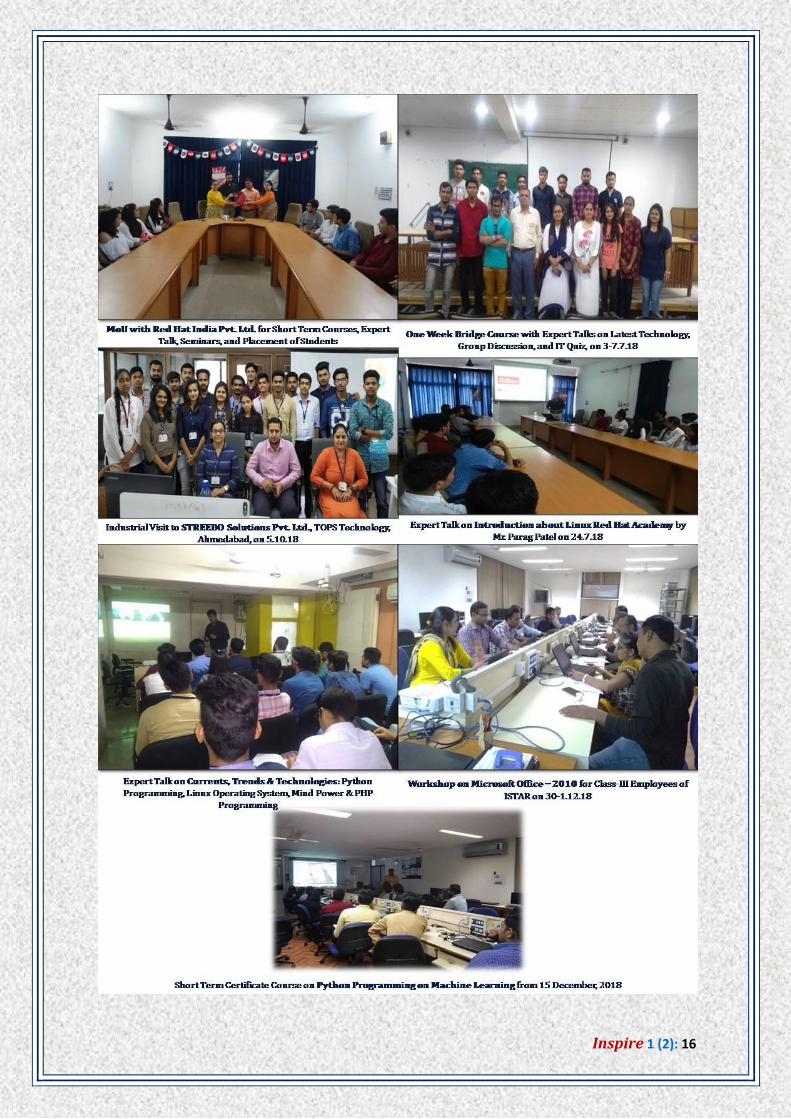
M.Sc. Information Technology
M.Sc. (IT) program gives career in Programming, Software project development,
computer networks, information and network security etc. IT Department have well-
equipped laboratories comprising Laptops with latest configuration, dedicated smart
class rooms and Seminar hall.
Faculty Achievements
Two Faculty Members (Dr. Niky Jain & Dr. Suchita Patel) received Ph.D. Degree in
Computer Science.
Results & Placement
100% University Results, More First Class & Distinction Every Year.
Many renowned alumni of the department are either holding respectable positions
in industries or have opted for higher studies across the globe. Last batch students
were placed in companies e.g. Proact-II Pvt. Ltd., Adweb Solutions, Mass Shivduti
Science, Tiny ERP etc.
Inspire 1 (2): 16
Inspire 1 (2): 17
PEN-DOWNS FROM FACULTY MEMBERS
OLED Displays
Himanhu N. Kapse
Assistant Professor, Department of Instrumentation & Control
Institute of Science & Technology for Advanced Studies & Research (ISTAR)
Vallabh Vidyanagar – 388 120
E-Mail: [email protected]
We are very much familiar with LED. It stands for Light emitting diode and has
applications in varied fields such as traffic signals, automotive headlamps, advertising,
general lighting, aviation lighting, camera flashes, lighted wallpaper, and medical
devices etc. The technological advancement in this device is Organic Light Emitting
Diode, in short known as OLED. It is a flat light emitting technology, made by placing a
series of organic thin films between two conductors. When electrical current is applied,
a bright light is emitted. OLEDs do not require a backlight and are thinner and more
efficient than LCD displays. OLEDs are organic because they are made from carbon and
hydrogen and do not contain any bad metals - so it's a real green technology. OLEDS are an emerging technology in today’s electronic display industry.
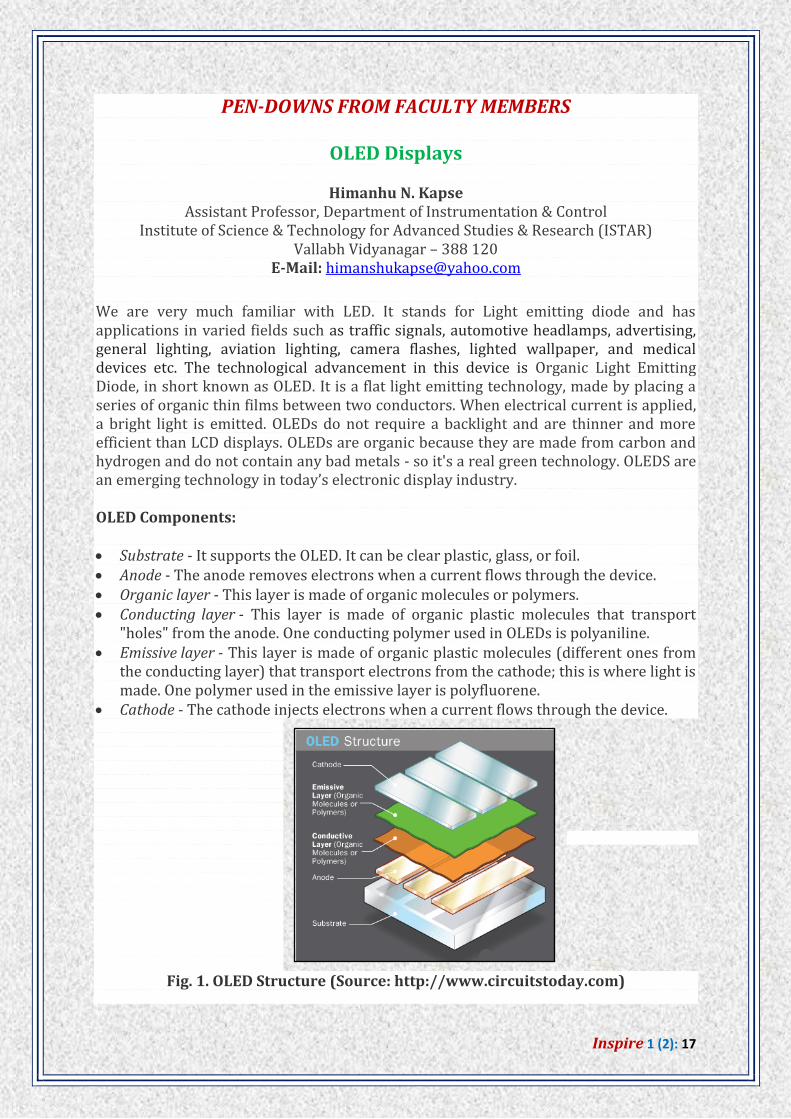
OLED Components:
Substrate - It supports the OLED. It can be clear plastic, glass, or foil.
Anode - The anode removes electrons when a current flows through the device.
Organic layer - This layer is made of organic molecules or polymers.
Conducting layer - This layer is made of organic plastic molecules that transport
"holes" from the anode. One conducting polymer used in OLEDs is polyaniline.
Emissive layer - This layer is made of organic plastic molecules (different ones from
the conducting layer) that transport electrons from the cathode; this is where light is
made. One polymer used in the emissive layer is polyfluorene.
Cathode - The cathode injects electrons when a current flows through the device.
Fig. 1. OLED Structure (Source: http://www.circuitstoday.com)

Inspire 1 (2): 18
How OLED is fabricated?
The important part of manufacturing OLEDs is applying the organic layers to the
substrate. This can be done in three ways:
Vacuum thermal evaporation (VTE) - In a vacuum chamber, the organic molecules
are gently evaporated and allowed to condense as thin films onto cooled substrates.
Organic vapor phase deposition (OVPD) - In a low-pressure, hot-walled reactor
chamber, a carrier gas transports evaporated organic molecules onto cooled
substrates, where they condense into thin films. Using a carrier gas increases the
efficiency and reduces the cost of making OLEDs.
Inkjet printing – With inkjet technology, OLEDs are sprayed onto substrates just like
inks are sprayed onto paper during printing. Inkjet technology greatly reduces the
cost of OLED manufacturing and allows OLEDs to be printed onto very large film for
large displays like 80-inch TV screens or electronic billboards.
How OLED Works?
The battery or power supply of the device containing the OLED applies a voltage across
the OLED. An electrical current flows from the cathode to the anode through the organic
layers. The cathode gives electrons to the emissive layer of organic molecules. The
anode removes electrons from the conductive layer of organic molecules. At the
boundary between the emissive and the conductive layers, electrons find electron holes.
When an electron finds an electron hole, the electron fills the hole. When this happens,
the electron gives up energy in the form of a photon of light. OLED emits light. The color
of the light depends on the type of organic molecule in the emissive layer.
Manufacturers place several types of organic films on the same OLED to make color
displays. The intensity or brightness of the light depends on the amount of electrical
current applied: the more current, the brighter the light.
Advantages of OLED Displays:
Improved image quality - better contrast, higher brightness, fuller viewing angle, a
wider color range and much faster refresh rates.
Lower power consumption.
Simpler design that enables ultra-thin, flexible, foldable and transparent displays
Better durability - OLEDs are very durable and can operate in a broader
temperature range.
Disadvantages of OLED Displays:
At present it costs more to produce an OLED than it does to produce an LCD.
OLEDs can also be problematic in direct sunlight, because of their emissive nature.
The red and green OLED films have longer lifetimes compared to blue organics.
Water can easily damage OLEDs.
OLED displays are not just thin and efficient - they provide the best image quality ever
and they can also be made transparent, flexible, foldable and even roll able and
stretchable in the future. OLEDs represent the future of display technology!

Inspire 1 (2): 19
References
1. https://electronics.howstuffworks.com
2. https://www.oled-info.com
Environmental Statistics: An Exploratory Avenue
Hiren B. Soni
Assistant Professor, Department of Environmental Science & Technology (EST)
Institute of Science & Technology for Advanced Studies & Research (ISTAR)
Vallabh Vidyanagar – 388 120
E-Mail: [email protected]
Background
Environment statistics is the application of statistical methods to environmental
science. It covers procedures for dealing with questions concerning both the natural
environment in its undisturbed state and the interaction of humanity with the
environment. Thus weather, climate, air and water quality are included, as are studies of
plant and animal populations.
Environmental statistics covers a number of types of study such as (i) Baseline
studies to document the present state of an environment to provide background in case
of unknown changes in the future; (ii) Targeted studies to describe the likely impact of
changes being planned or of accidental occurrences; and (iii) Regular monitoring to
attempt to detect changes in the environment.
Need of Environmental Statistics
The environment statistics framework (i) marks out the scope of Environment
Statistics; (ii) facilitates a synthesized presentation of data from various subject areas
and sources; (iii) simplifies the complexity of the environment appropriately so that it
can be measured more easily; (iv) helps to identify the range of statistics relevant to
societal decision-making regarding the environment; (v) is consistent with statistical
frameworks already used in other domains to facilitate the integration of Environment
Statistics; and (vi) is conceptually based.
Objective of Environment Statistics
The objective of Environment Statistics is to provide information about the
environment, its most important changes over time and across locations and the main
factors that influence them. Environment statistics seek to provide high-quality
statistical information to improve knowledge of the environment, support evidence-
based policy and decision-making, and provide information for the general public and
specific user groups.
Scope of Environment Statistics
The scope of environment statistics covers biophysical aspects of the environment and
those aspects of the socioeconomic system that directly influence and interact with the
environment. The scope of environment, social and economic statistics overlap. It is not
easy—or necessary— to draw a clear line dividing these areas. Social and economic
statistics that describe processes or activities with a direct impact on or direct
interaction with, the environment are used widely in environment statistics. They are
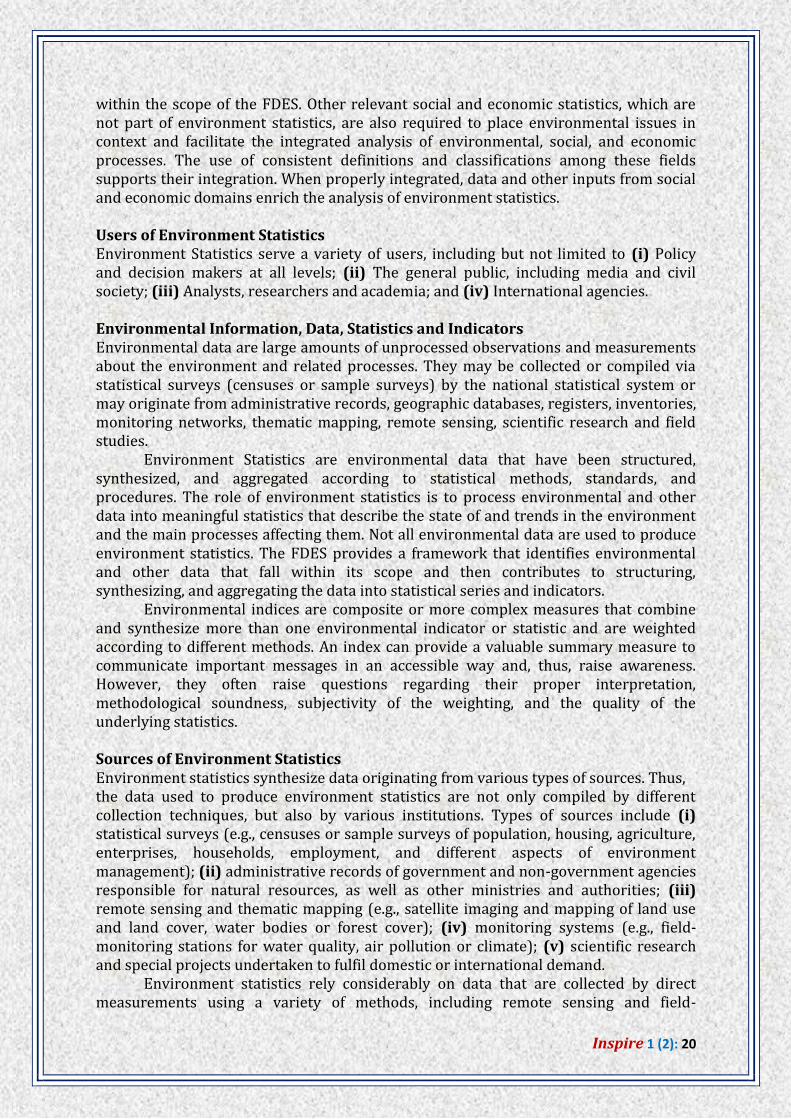
Inspire 1 (2): 20
within the scope of the FDES. Other relevant social and economic statistics, which are
not part of environment statistics, are also required to place environmental issues in
context and facilitate the integrated analysis of environmental, social, and economic
processes. The use of consistent definitions and classifications among these fields
supports their integration. When properly integrated, data and other inputs from social
and economic domains enrich the analysis of environment statistics.
Users of Environment Statistics
Environment Statistics serve a variety of users, including but not limited to (i) Policy
and decision makers at all levels; (ii) The general public, including media and civil
society; (iii) Analysts, researchers and academia; and (iv) International agencies.
Environmental Information, Data, Statistics and Indicators
Environmental data are large amounts of unprocessed observations and measurements
about the environment and related processes. They may be collected or compiled via
statistical surveys (censuses or sample surveys) by the national statistical system or
may originate from administrative records, geographic databases, registers, inventories,
monitoring networks, thematic mapping, remote sensing, scientific research and field
studies.
Environment Statistics are environmental data that have been structured,
synthesized, and aggregated according to statistical methods, standards, and
procedures. The role of environment statistics is to process environmental and other
data into meaningful statistics that describe the state of and trends in the environment
and the main processes affecting them. Not all environmental data are used to produce
environment statistics. The FDES provides a framework that identifies environmental
and other data that fall within its scope and then contributes to structuring,
synthesizing, and aggregating the data into statistical series and indicators.
Environmental indices are composite or more complex measures that combine
and synthesize more than one environmental indicator or statistic and are weighted
according to different methods. An index can provide a valuable summary measure to
communicate important messages in an accessible way and, thus, raise awareness.
However, they often raise questions regarding their proper interpretation,
methodological soundness, subjectivity of the weighting, and the quality of the
underlying statistics.
Sources of Environment Statistics
Environment statistics synthesize data originating from various types of sources. Thus,
the data used to produce environment statistics are not only compiled by different
collection techniques, but also by various institutions. Types of sources include (i)
statistical surveys (e.g., censuses or sample surveys of population, housing, agriculture,
enterprises, households, employment, and different aspects of environment
management); (ii) administrative records of government and non-government agencies
responsible for natural resources, as well as other ministries and authorities; (iii)
remote sensing and thematic mapping (e.g., satellite imaging and mapping of land use
and land cover, water bodies or forest cover); (iv) monitoring systems (e.g., field-
monitoring stations for water quality, air pollution or climate); (v) scientific research
and special projects undertaken to fulfil domestic or international demand.
Environment statistics rely considerably on data that are collected by direct
measurements using a variety of methods, including remote sensing and field-
Inspire 1 (2): 21
monitoring stations. Most countries have agencies that are primarily responsible for
monitoring environmental resources and conditions. They may be entities in their own
right or government agencies with other primary functions that also have departments
concerned with environmental matters. These agencies typically produce two main
types of data: (i) measured data (obtained by direct observation, field measurements
and remote sensing); and (ii) calculated data (derived using estimates and modelling).
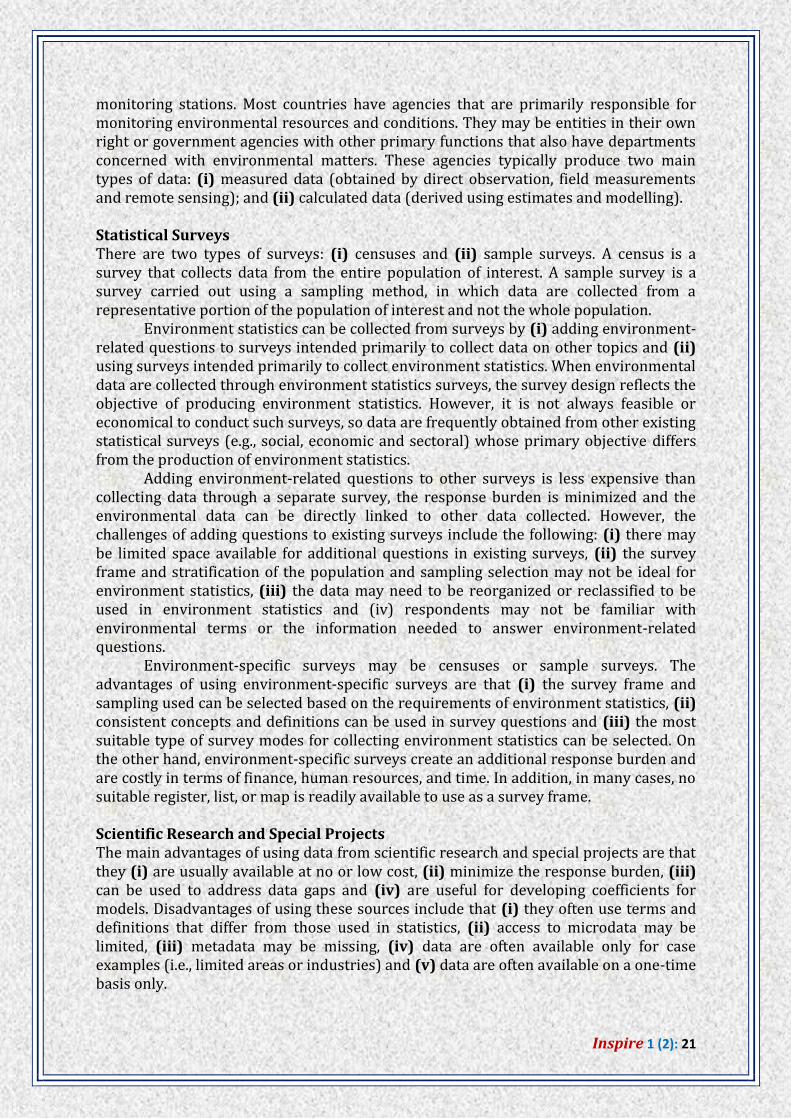
Statistical Surveys
There are two types of surveys: (i) censuses and (ii) sample surveys. A census is a
survey that collects data from the entire population of interest. A sample survey is a
survey carried out using a sampling method, in which data are collected from a
representative portion of the population of interest and not the whole population.
Environment statistics can be collected from surveys by (i) adding environment-
related questions to surveys intended primarily to collect data on other topics and (ii)
using surveys intended primarily to collect environment statistics. When environmental
data are collected through environment statistics surveys, the survey design reflects the
objective of producing environment statistics. However, it is not always feasible or
economical to conduct such surveys, so data are frequently obtained from other existing
statistical surveys (e.g., social, economic and sectoral) whose primary objective differs
from the production of environment statistics.
Adding environment-related questions to other surveys is less expensive than
collecting data through a separate survey, the response burden is minimized and the
environmental data can be directly linked to other data collected. However, the
challenges of adding questions to existing surveys include the following: (i) there may
be limited space available for additional questions in existing surveys, (ii) the survey
frame and stratification of the population and sampling selection may not be ideal for
environment statistics, (iii) the data may need to be reorganized or reclassified to be
used in environment statistics and (iv) respondents may not be familiar with
environmental terms or the information needed to answer environment-related
questions.
Environment-specific surveys may be censuses or sample surveys. The
advantages of using environment-specific surveys are that (i) the survey frame and
sampling used can be selected based on the requirements of environment statistics, (ii)
consistent concepts and definitions can be used in survey questions and (iii) the most
suitable type of survey modes for collecting environment statistics can be selected. On
the other hand, environment-specific surveys create an additional response burden and
are costly in terms of finance, human resources, and time. In addition, in many cases, no
suitable register, list, or map is readily available to use as a survey frame.
Scientific Research and Special Projects
The main advantages of using data from scientific research and special projects are that
they (i) are usually available at no or low cost, (ii) minimize the response burden, (iii)
can be used to address data gaps and (iv) are useful for developing coefficients for
models. Disadvantages of using these sources include that (i) they often use terms and
definitions that differ from those used in statistics, (ii) access to microdata may be
limited, (iii) metadata may be missing, (iv) data are often available only for case
examples (i.e., limited areas or industries) and (v) data are often available on a one-time
basis only.

Inspire 1 (2): 22
Environmental Statistician
Environmental statisticians are responsible for the analysis and interpretation of
environmental data, for the design of environmental studies, and for the dissemination
of statistical methods and concepts to staff working within the environmental sector.
The role of an environmental statistician is typically highly interdisciplinary, and will
often involve working with scientists or technical staff from a wide range of different
backgrounds (environmental scientists, ecologists, chemists, physicists). It may also
involve working with policy makers, managers or other decision makers. Key areas of
expertise that the environmental statistician contributes are (i) an ability to synthesize
and analyze data in appropriate ways, and to effectively and accurately communicate
the results of these analyses to non-specialists; and (ii) an understanding of the
importance of variability and uncertainty, and of the way in which these may be
quantified? Environmental statisticians will typically use a wide spectrum of statistical
techniques, since standard statistical methods are often inappropriate for
environmental data. One of the most important roles of the job is to give a clear and
defensible description of the level of uncertainty that is associated with the results of an
analysis.
Role of Environmental Statistician
Environmental statisticians are often involved in supporting scientific research
programs within research organization or university departments. This may involve
contributing to a single research project or providing support to a range of projects. In
the latter case, work may involve short-term consultancy, giving advice to scientists on
the design, analysis, interpretation, or presentation of studies. Other work may be more
long-term and may lead to joint publication of research findings in the form of academic
papers or technical reports. Environmental problems may require the development of
innovative statistical methodology, which is suitable for publication in statistics
journals, and may also lead to publications in the appropriate environmental journals.
There will be opportunities for attending national and international conferences to
present your work and to learn from the work of fellow statisticians.
Statisticians working in this sector may tackle problems in areas such as (i)
Climatology, for example assessing changes in climate patterns Oceanography, for
example assessing temperature patterns in ocean currents and their effects on the
weather (ii) Extreme event risk assessment, for example looking at the probabilities of
floods in an area or of increasing wave heights, which may damage offshore structures
(iii) Fisheries statistics such as assessing the population size and the development stage
of fish stocks from landings and sparse sample measurements (iv) Environmental
model assessment such as using sensitivity and uncertainty analyses on models to
determine the accuracy of predicted future carbon budgets (v) Impact assessment, for
instance assessing the effects of a new factory on the local environment (vi)
Environmental epidemiology, for instance assessing the effects of air pollution on
asthma occurrence (vii) Ecology such as modelling population changes of upland red
deer (viii) Compliance issues such as framing sampling schemes to ensure that
legislation protecting rivers from excessive pollution is observed (ix) Risk assessment
such as assessing the risk of contamination and the likely environmental recovery from
a nuclear accident.

Inspire 1 (2): 23
Selected Bibliography
FDES (2017) Framework for The Development of Environment Statistics – 2013.
Department of Economic and Social Affairs, Statistics Division, Studies in
Methods, Series M No. 92, United Nations Publication. ISBN: 978-92-1-161582-1.
International Statistical Institute (2003). The Oxford Dictionary of Statistical Terms.
Yadolah Dodge (Ed.) Oxford University Press.
Manly, B.F.J. (2001) Statistics for Environmental Science and Management. Chapman &
Hall, CRC. ISBN 1-58488-029-5. United Nations Statistical Commission (2012). “Report on the Forty-third Session,
Economic and Social Council, Official Records 2012, Supplement No. 4”. United Nations Statistics Division (1984). A Framework for the Development of
Environment Statistics.
United Nations Statistics Division (1988). Concepts and Methods of Environment
Statistics: Human Settlements Statistics—A Technical Report.
United Nations Statistics Division (1991). Concepts and Methods of Environment
Statistics: Statistics of the Natural Environment—A Technical Report.
United Nations Statistics Division (1999). Standard Statistical Classifications: Basic
Principles.
United Nations Statistics Division (2000). Integrated Environmental and Economic
Accounting—An Operational Manual.
United Nations Statistics Division, Expert Group Meeting on the Revision of the FDES (2010). “Criteria for a Conceptual Framework for Developing Environment Statistics”, Robert Smith and Michael Bordt, Statistics Canada.
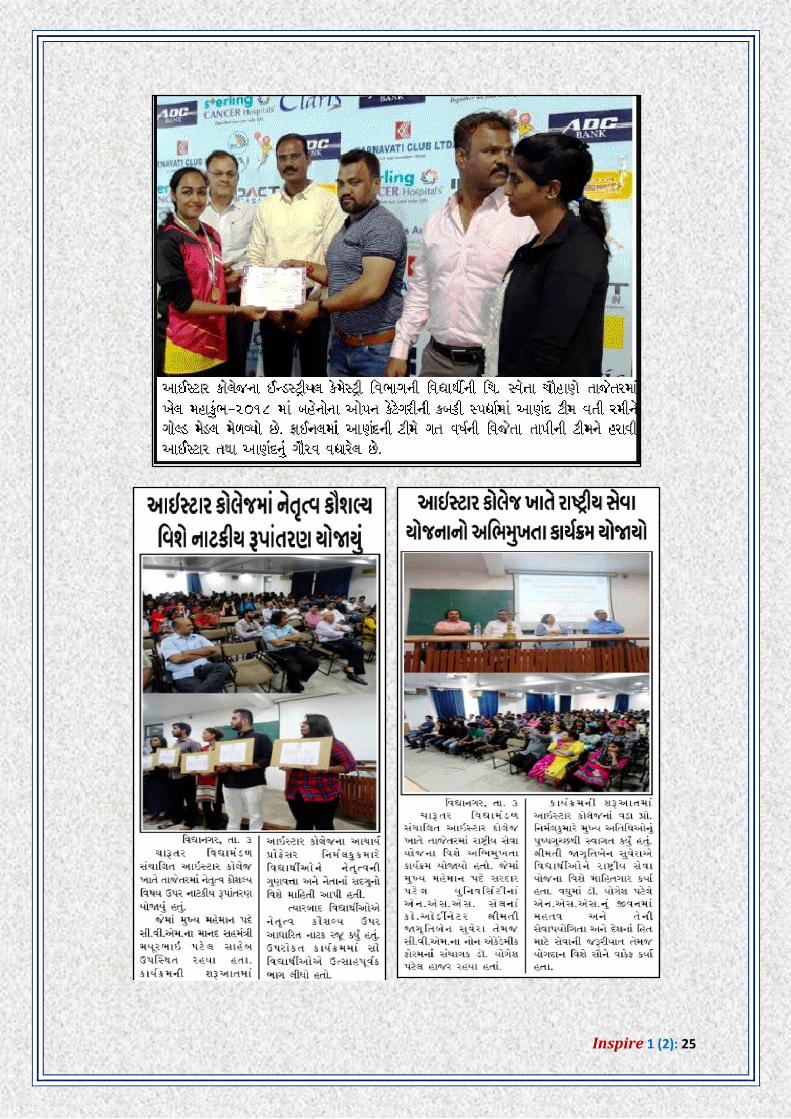
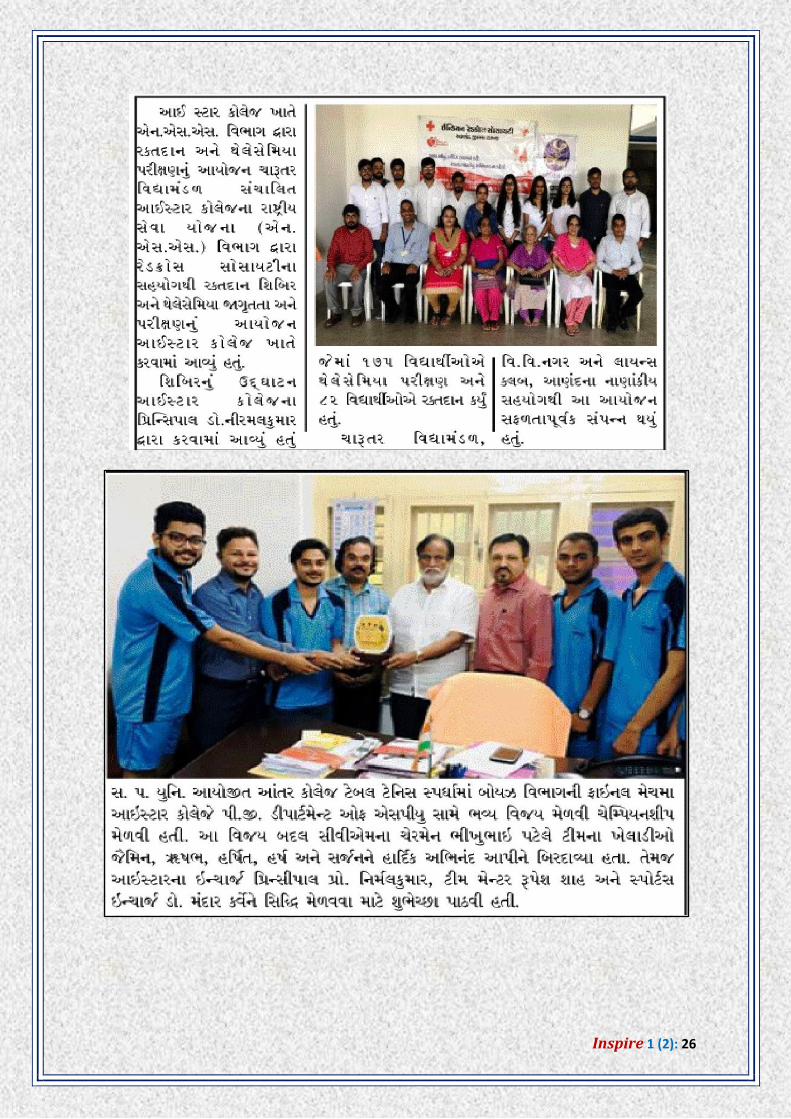
ISTAR @ MEDIA CORNER

Inspire 1 (2): 24
Inspire 1 (2): 25
Inspire 1 (2): 26

Inspire 1 (2): 27

Inspire 1 (2): 28

Inspire 1 (2): 29

Inspire 1 (2): 30
Contact us.....
CHARUTAR VIDYA MANDAL'S
INSTITUTE OF SCIENCE & TECHNOLOGY FOR ADVANCED STUDIES & RESEARCH (ISTAR)
Accredited with “A” Grade by NAAC & KCG
Sardar Patel Center for Science & Technology Post Box No. 13,
Vallabh Vidyanagar – 388 120 Dist. Anand (Gujarat)
Phone: (02692) 234955 Email: [email protected]
Website: www.istar.edu.in