
Institute of Meteorology and Water Management „Satellite Remote Sensing as a tool for monitoring...
34
-
date post
21-Dec-2015 -
Category
Documents
-
view
217 -
download
2
Transcript of Institute of Meteorology and Water Management „Satellite Remote Sensing as a tool for monitoring...
Institute of Meteorology and Water Management
„Satellite Remote Sensing as a tool for monitoring of climate and environment
Piotr StruzikSatellite Research Department, IMWM Kraków
• Evolution of meteorological satellite system
• Parameters related to climate derived from satellite informatiom
• Benefits and limitation of satellite data for climatology.
• Conclusions
Presentation outline
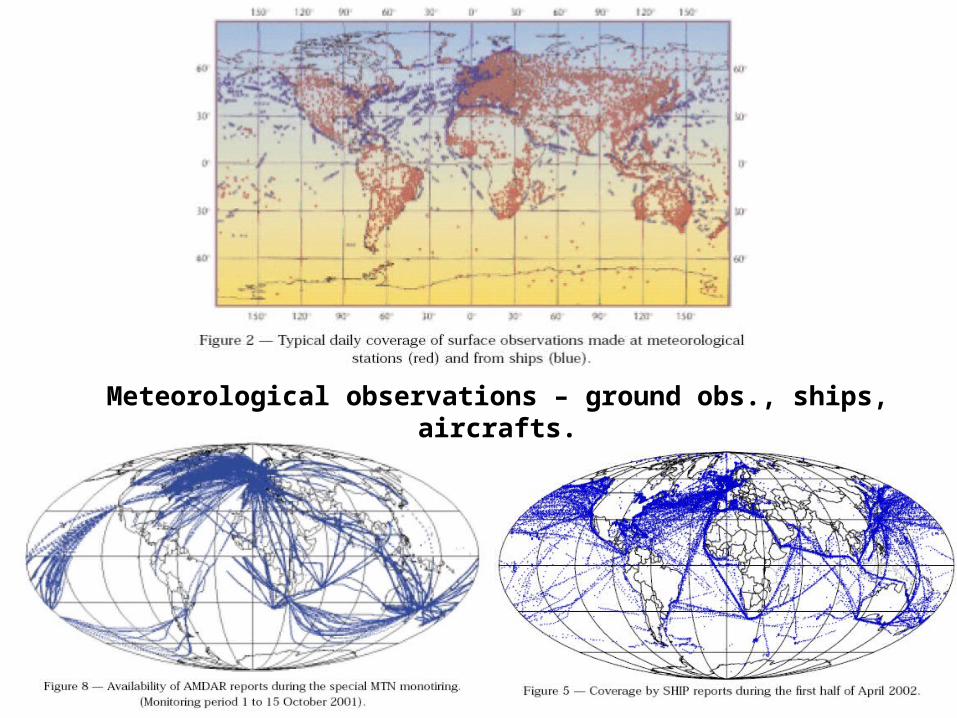
Meteorological observations – ground obs., ships, aircrafts.

Development of meteorological satellite system

1960 1978
1990
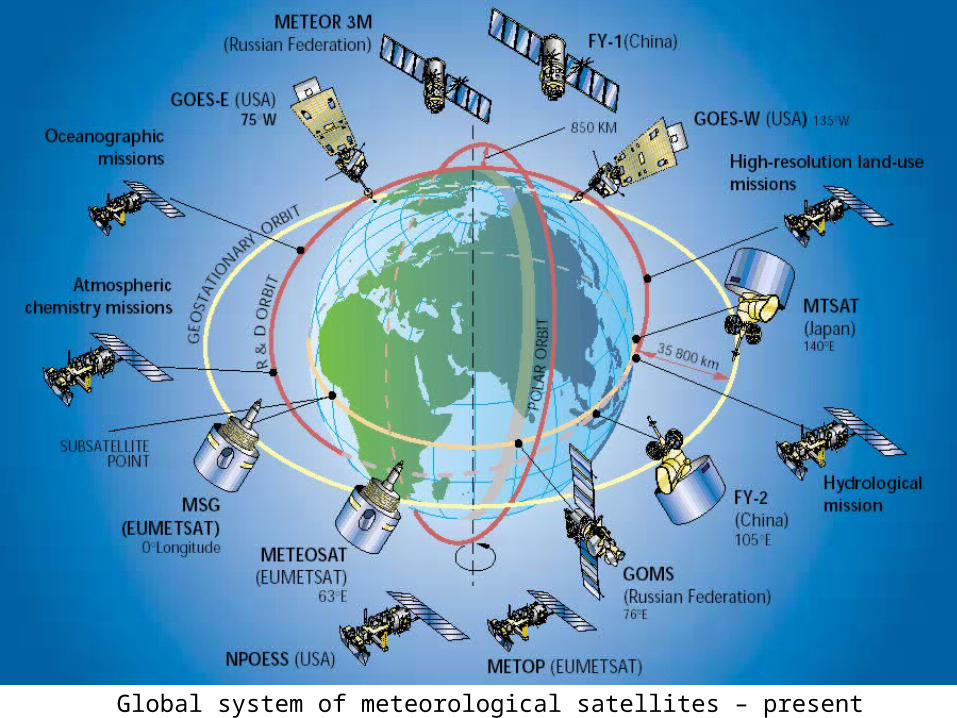
Global system of meteorological satellites – present
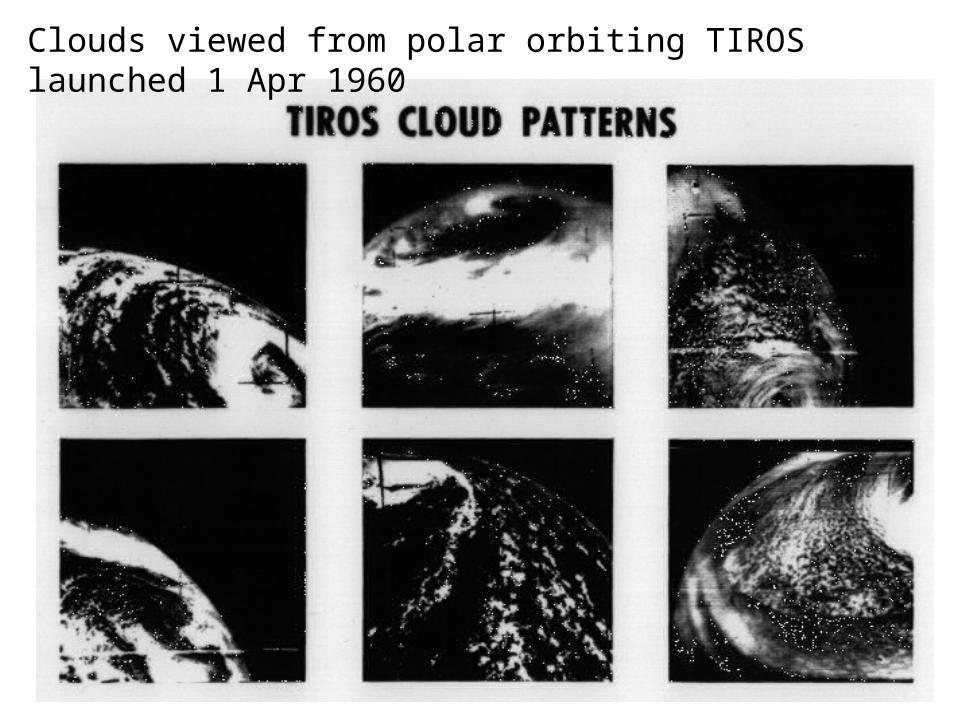
Clouds viewed from polar orbiting TIROS launched 1 Apr 1960
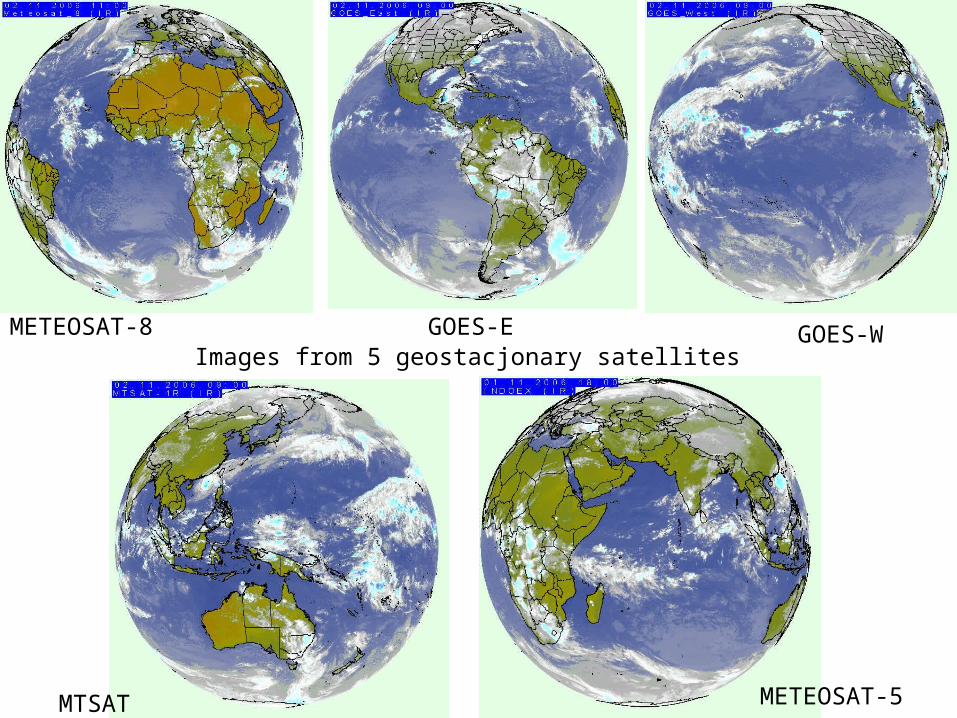
Images from 5 geostacjonary satellitesMETEOSAT-8 GOES-E GOES-W
MTSAT METEOSAT-5
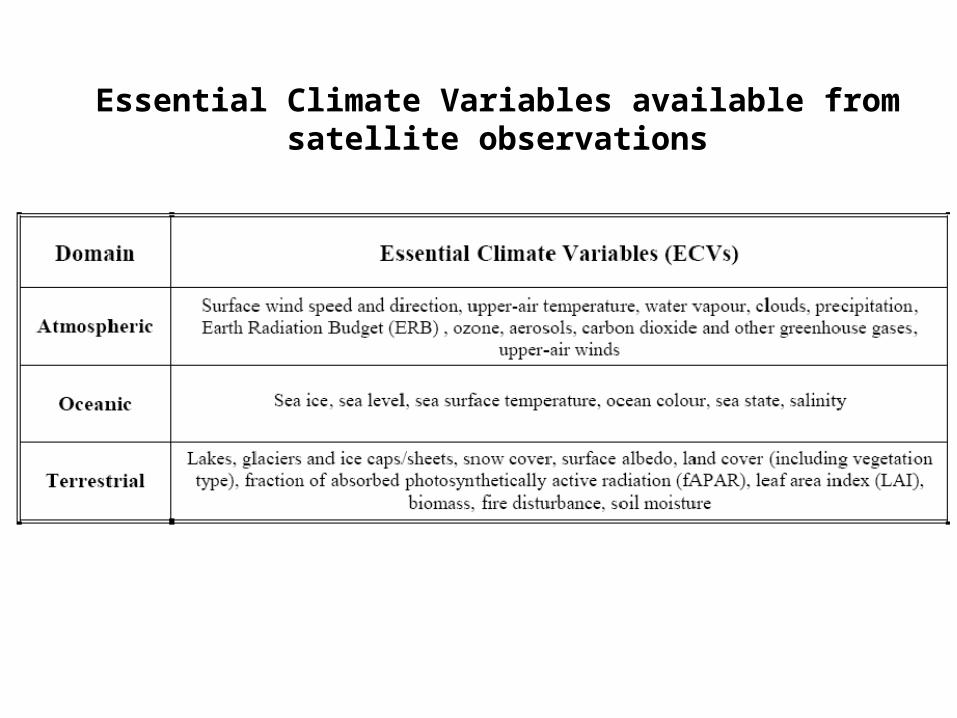
Essential Climate Variables available from satellite observations

Key Areas of Uncertainty in Understanding Climate & Global Change
* Earth’s radiation balance and the influence of clouds on radiation and the hydrologic cycle
* Oceanic productivity, circulation and air-sea exchange
* Transformation of greenhouse gases in the lower atmosphere, with emphasis on the carbon cycle
* Changes in land use, land cover and primary productivity, including deforestation
* Sea level variability and impacts of ice sheet volume
* Chemistry of the middle and upper stratosphere, including sources and sinks of stratospheric ozone
* Volcanic eruptions and their role in climate change

Satellite based Climate Data Records
unique challenges:
• the need to manage extremely large volumes of data;
• restrictions of spatial sampling and resolution;
• accounting for orbit drift and sensor degradation over time;
• temporal sampling;
• difficulty of calibrating after launch (e.g., vicarious or onboard calibration);
• the need for significant computational resources for reprocessing.
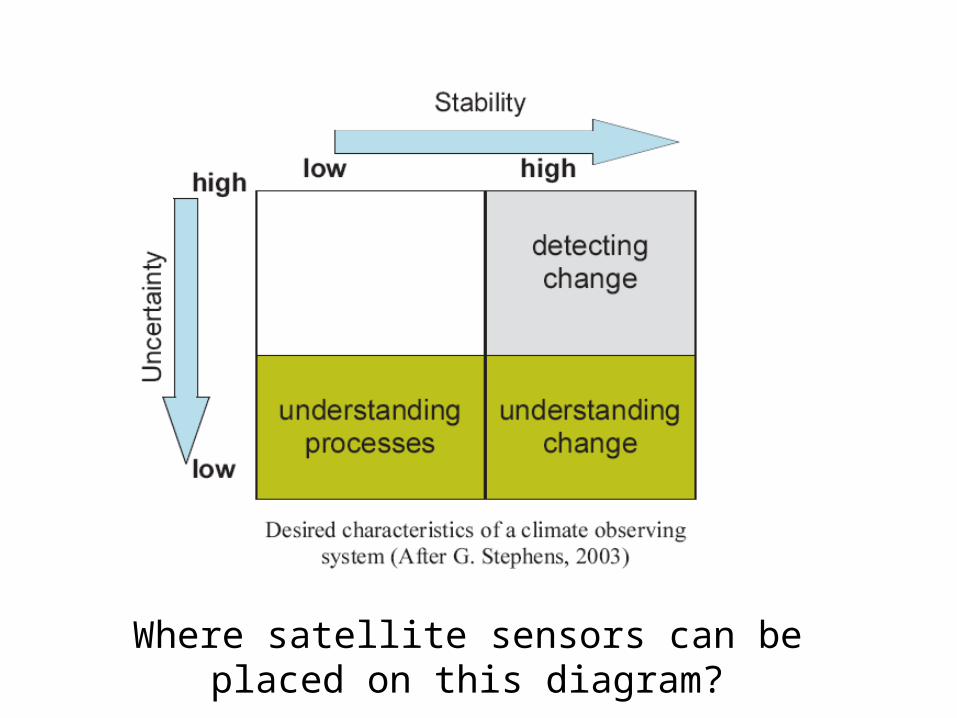
Where satellite sensors can be placed on this diagram?

ATMOSPHERE TEMPERATURE SOUNDING
•In 1969 Nimbus 3 carried the first of a new class of remote-sounding sensors,
the Space Infra-Red Sounder (SIRS A),
•First operational sounder system in 1972, the Vertical Temperature Profile
Radiometer (VTPR), aboard the NOAA 2 In 1978,
•Next generation (TIROS N) was launched with an improved 20-channel High
Infrared Sounder (HIRS) accompanied by the Microwave Sounder Unit (MSU) and
Stratospheric
•Sounder Unit (SSU) forming the TIROS Operation Vertical Sounder (TOVS)
•In 2002 NASA launched Aqua carrying the first hyperspectral Atmospheric
Infrared Sounder (AIRS)/AMSU/Humidity Sounder for Brazil (HSB)
•2006 – first METOP satellite with IASI (8500 channels)
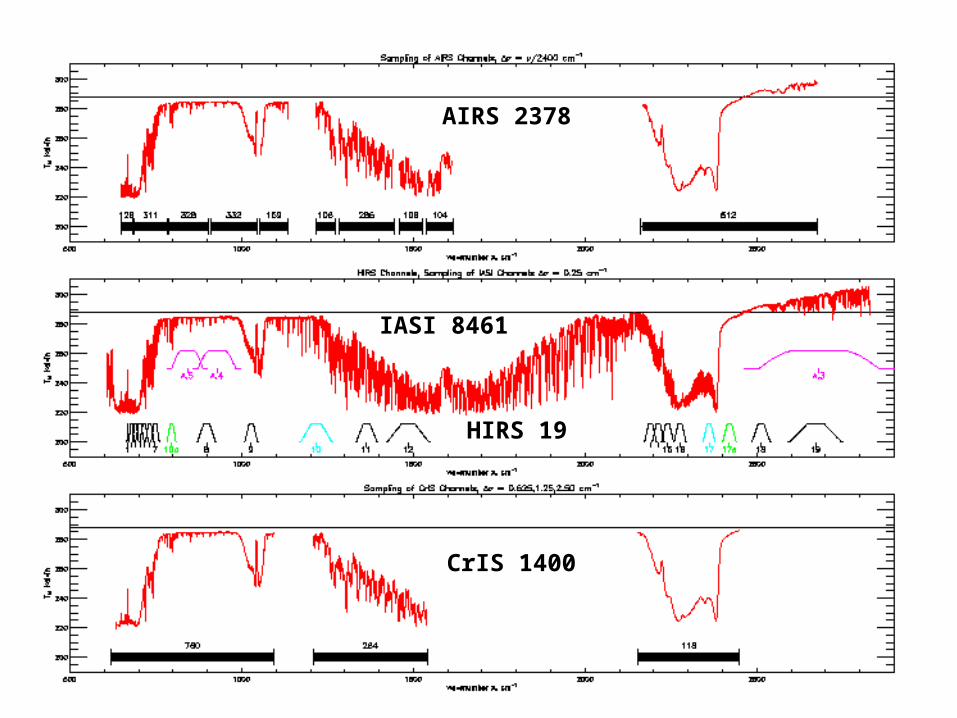
AIRS 2378
IASI 8461
CrIS 1400
HIRS 19

AIRS radiance changes (in deg K) to atm & sfc changes

SATELLITE PRECIPITATION
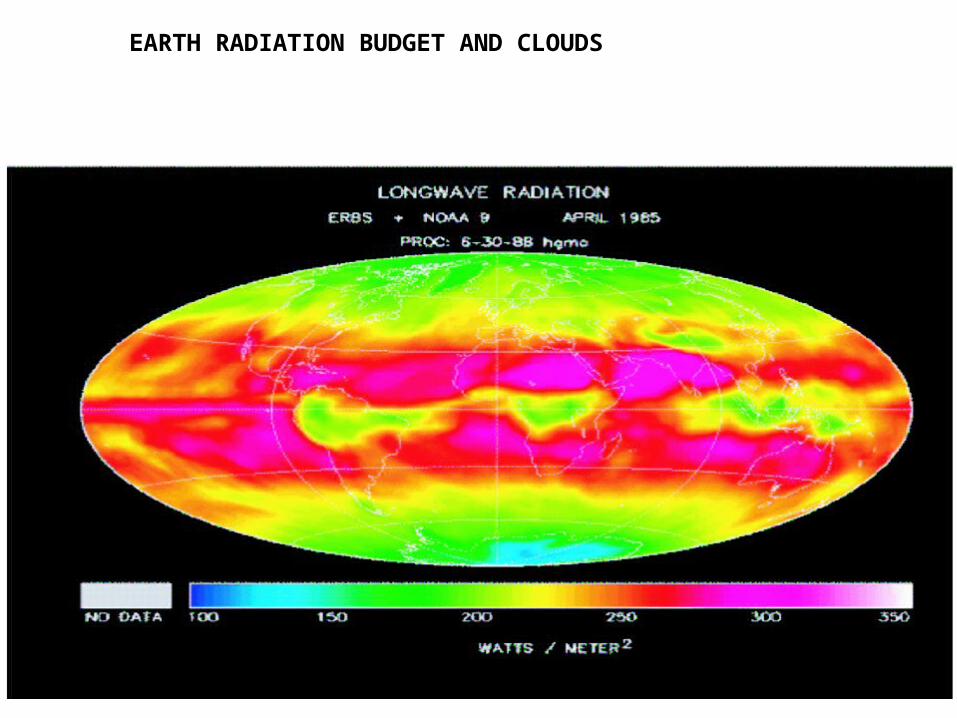
EARTH RADIATION BUDGET AND CLOUDS
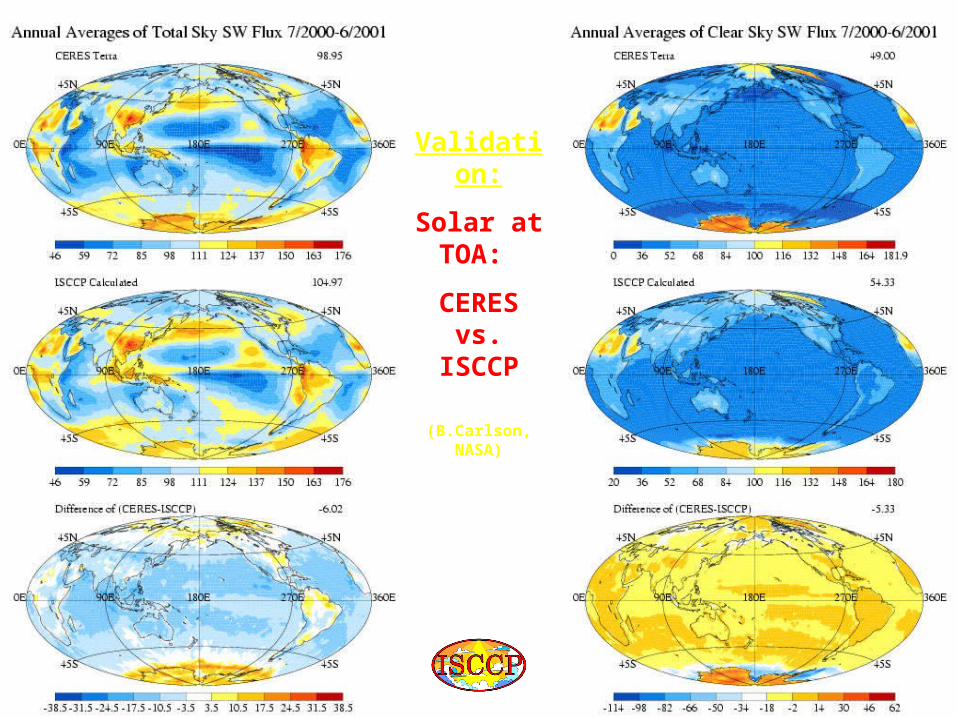
Validation:
Solar at TOA:
CERES vs. ISCCP
(B.Carlson, NASA)
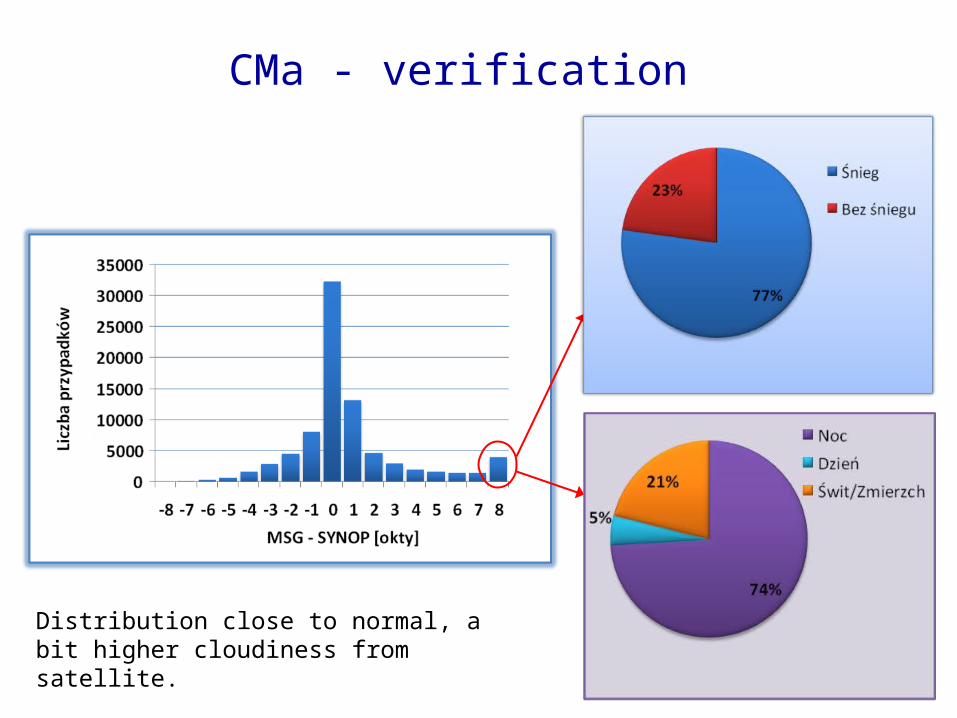
CMa - verification
Distribution close to normal, a bit higher cloudiness from satellite.
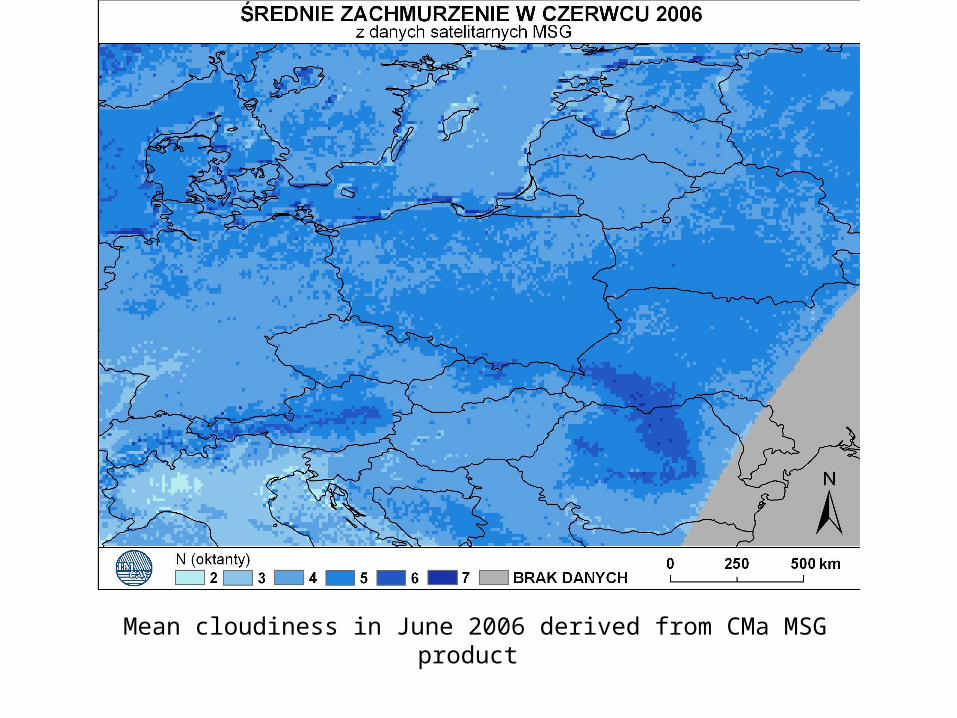
Mean cloudiness in June 2006 derived from CMa MSG product
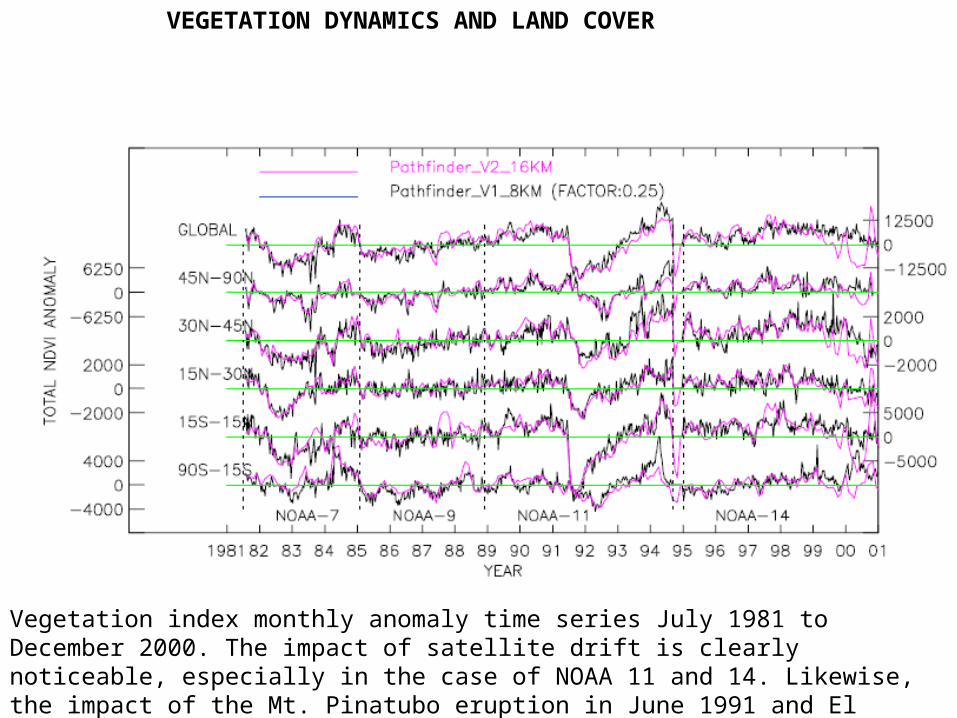
VEGETATION DYNAMICS AND LAND COVER
Vegetation index monthly anomaly time series July 1981 to December 2000. The impact of satellite drift is clearly noticeable, especially in the case of NOAA 11 and 14. Likewise,the impact of the Mt. Pinatubo eruption in June 1991 and El Chichon in March 1982 is also discernable.

Greening trend?Orbital drift?Inter-sensor variation?Noise in the channel data?
AVHRR observations suggest that the growing season increased between 1981 and 1994 (10%),but questions remain, mainly with respect to calibration and inter-calibration of sequentialsatellite instruments (Knyazikhin, Myneni, and Shabanov)
Northern Latitude Greening Trends
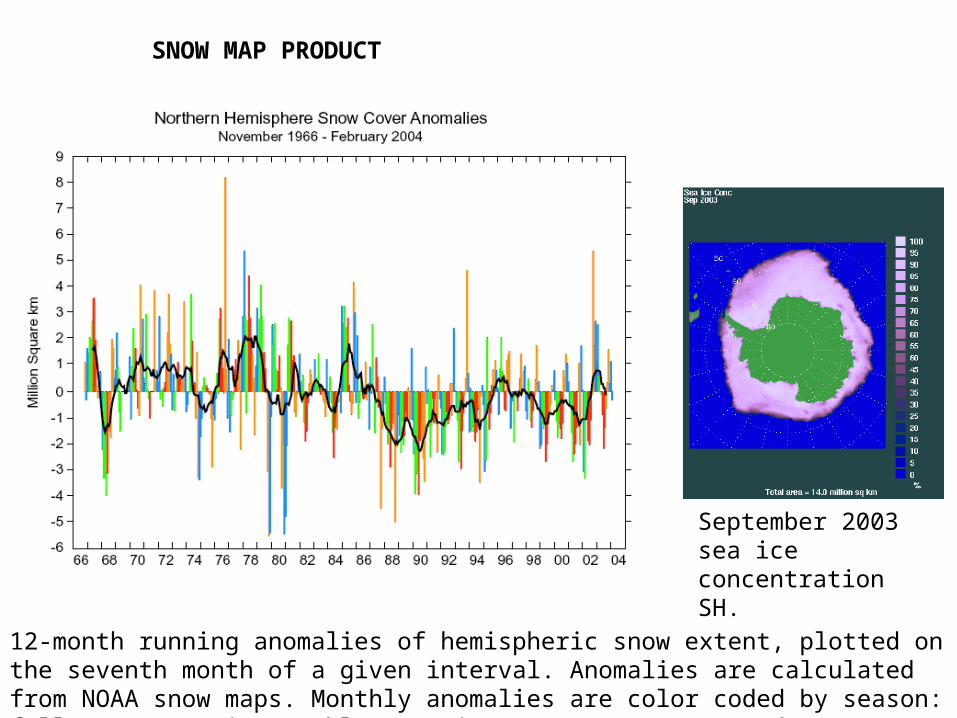
SNOW MAP PRODUCT
12-month running anomalies of hemispheric snow extent, plotted on the seventh month of a given interval. Anomalies are calculated from NOAA snow maps. Monthly anomalies are color coded by season: fall: orange; winter: blue; spring: green; summer: red.
September 2003 sea ice concentration SH.
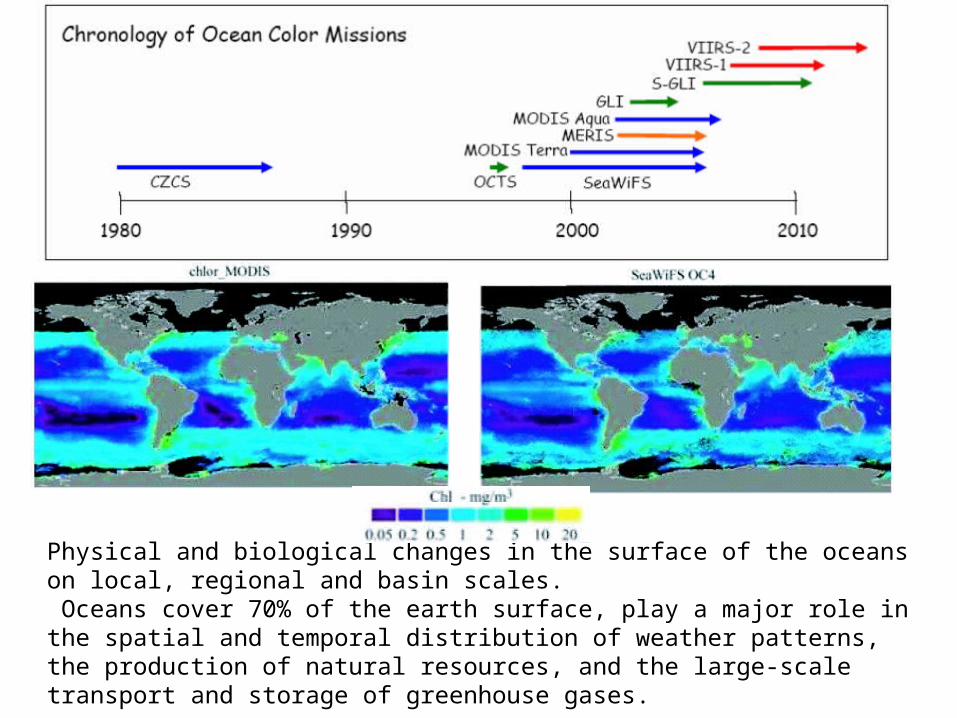
Physical and biological changes in the surface of the oceans on local, regional and basin scales. Oceans cover 70% of the earth surface, play a major role in the spatial and temporal distribution of weather patterns, the production of natural resources, and the large-scale transport and storage of greenhouse gases.
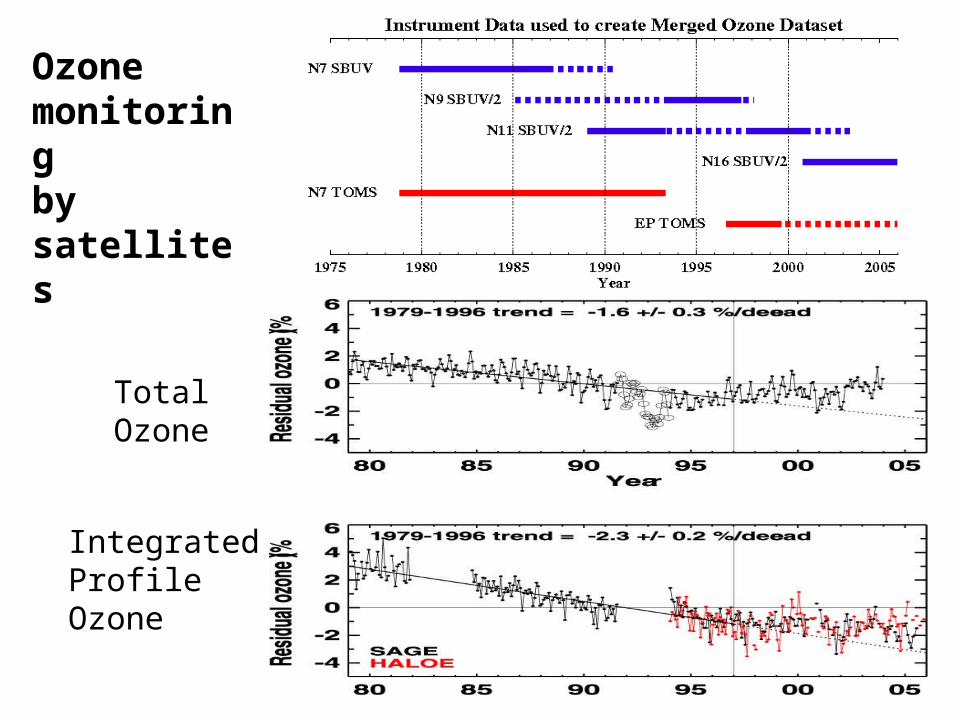
TotalOzone
IntegratedProfileOzone
Ozone monitoringby satellites

Difficulties in use of satellite data for climate observations

A chronic difficulty in creating a continuous, consistent climate record from satellite observations alone is that satellites and instruments have a finite lifetime of a few years and have to be replaced, and their orbits are not stable.
Pre-launch calibrationPost-launch vicarious calibrationIntercalibration
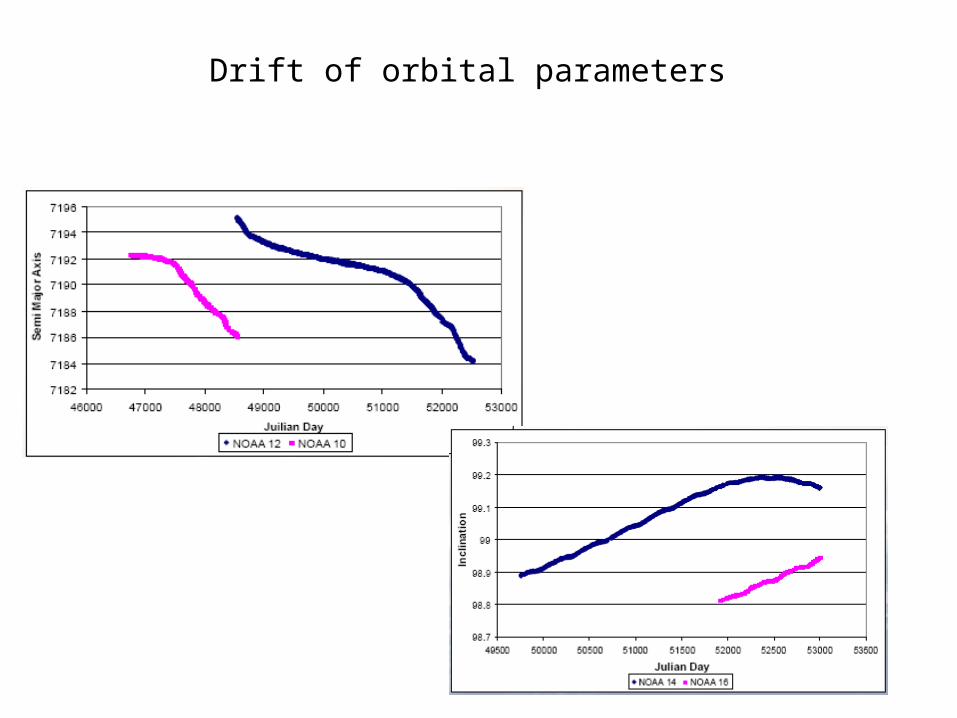
Drift of orbital parameters
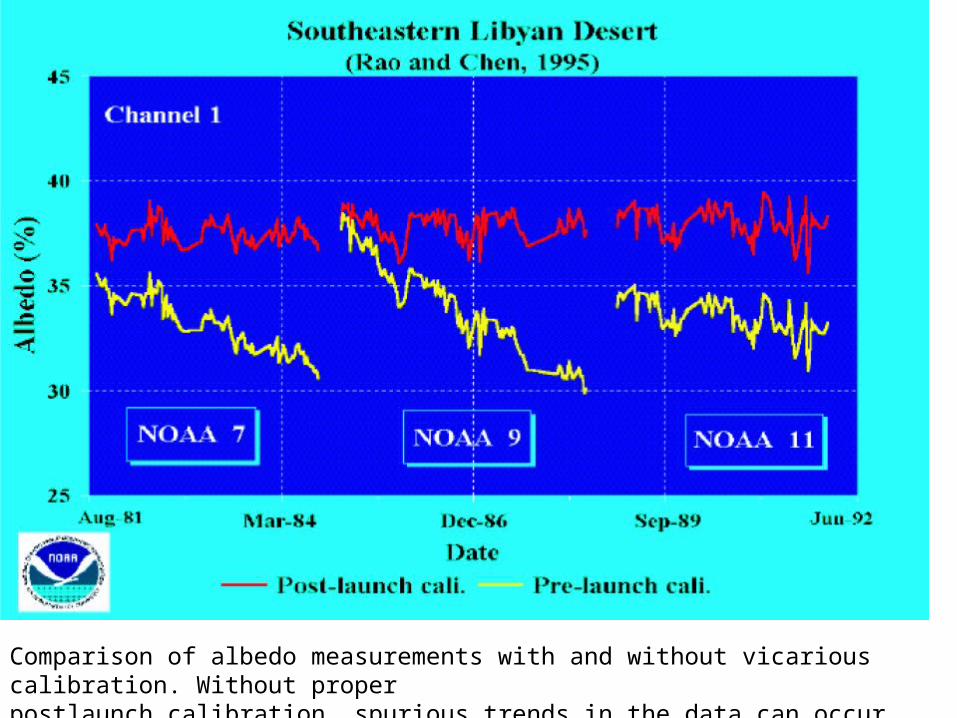
Comparison of albedo measurements with and without vicarious calibration. Without properpostlaunch calibration, spurious trends in the data can occur. SOURCE: Rao and Chen, 1995.

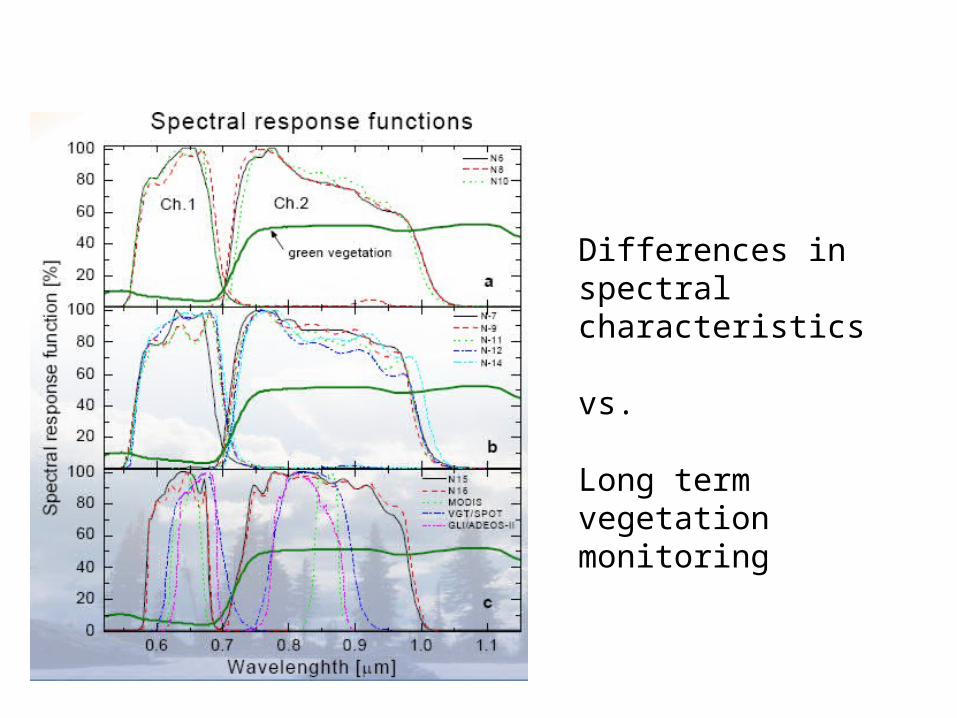
Differences in spectral characteristics
vs.
Long term vegetation monitoring
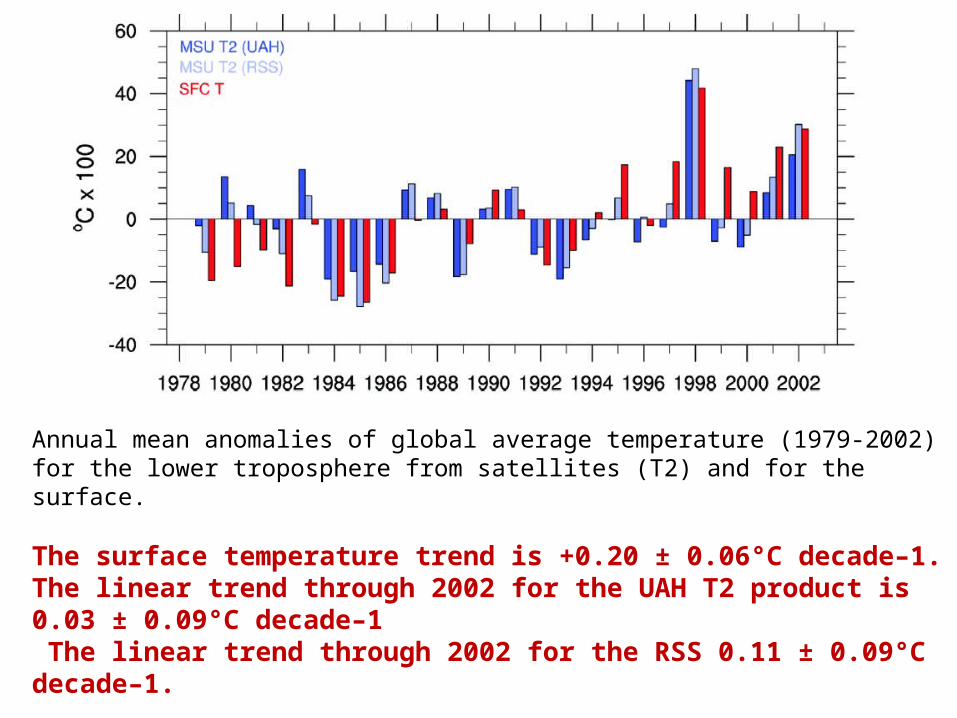
Annual mean anomalies of global average temperature (1979-2002) for the lower troposphere from satellites (T2) and for the surface.
The surface temperature trend is +0.20 ± 0.06°C decade–1.The linear trend through 2002 for the UAH T2 product is 0.03 ± 0.09°C decade–1 The linear trend through 2002 for the RSS 0.11 ± 0.09°C decade–1.
University of Alabama Huntsville (UAH) 5.1 (Christy et al., 2003)Remote Sensing System (RSS) (Mears et al., 2003).
ConclusionsSatellite data offer an unprecedented potential for climate research provided that separate sensor/satellite data are integrated into high-quality, globally-integrated climate products.
Main issues are accuracy and stability of satellite measurements.
Requirement for much improved calibration of satellite instruments, and intercalibration of similar instruments flying on different satellites.
Data management – huge volume of satellite data.
Future missions – new sensors / continuity of observations.


