INSTITUTE OF COMPUTING TECHNOLOGY BigDataBench: a Big Data Benchmark Suite from Internet Services...
38
INSTITUTE OF COMPUTING TECHNOLOGY BigDataBench: a Big Data Benchmark Suite from Internet Services Lei Wang, Jianfeng Zhan, Chunjie Luo, Yuqing Zhu, Qiang Yang, Yongqiang He, Wanling Gao, Zhen Jia, Yingjie Shi, Shujie Zhang, Gang Lu, Kent Zhang, Xiaona Li, and Bizhu Qiu HPCA 2014 1
-
Upload
nickolas-wiggins -
Category
Documents
-
view
224 -
download
0
Transcript of INSTITUTE OF COMPUTING TECHNOLOGY BigDataBench: a Big Data Benchmark Suite from Internet Services...

INS
TIT
UTE O
F C
OM
PU
TIN
G
TEC
HN
OLO
GY
BigDataBench: a Big Data Benchmark Suite from Internet Services
Lei Wang, Jianfeng Zhan, Chunjie Luo, Yuqing Zhu, Qiang Yang, Yongqiang He, Wanling Gao,
Zhen Jia, Yingjie Shi, Shujie Zhang, Gang Lu, Kent Zhang, Xiaona Li, and Bizhu Qiu
HPCA 2014
1

Orlando, 2014.2.18 HPCA 2014
Why Big Data Benchmarking?
Measuring big data systems and architectures quantitatively
Orlando, 2014.2.18 HPCA 2014
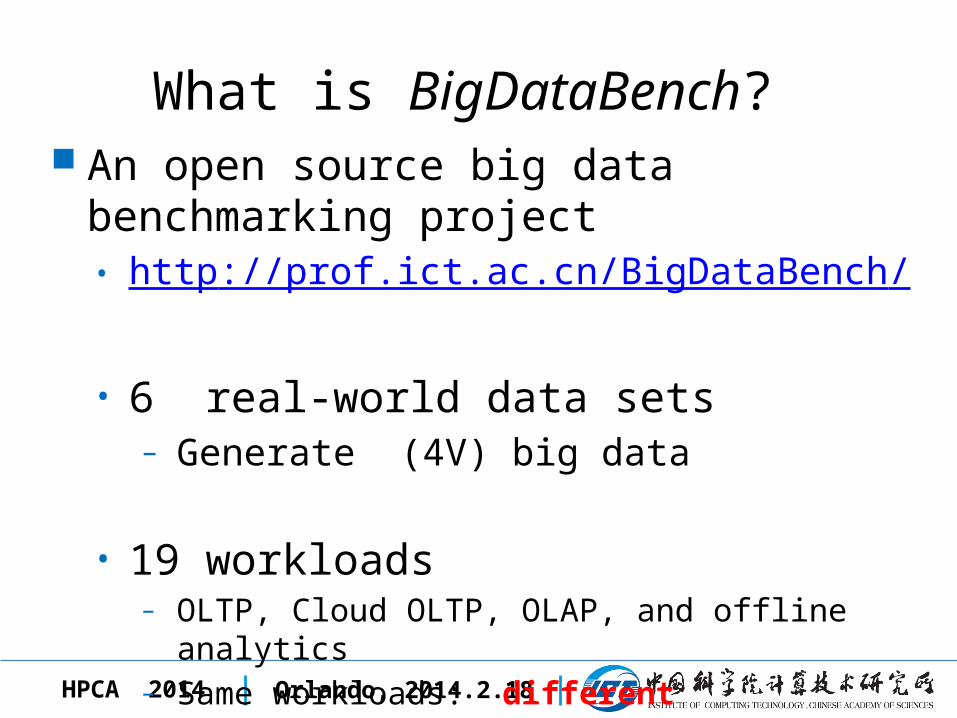
What is BigDataBench? An open source big data benchmarking project
• http://prof.ict.ac.cn/BigDataBench/
• 6 real-world data sets– Generate (4V) big data
• 19 workloads– OLTP, Cloud OLTP, OLAP, and offline analytics – Same workloads: different implementations
Orlando, 2014.2.18 HPCA 2014
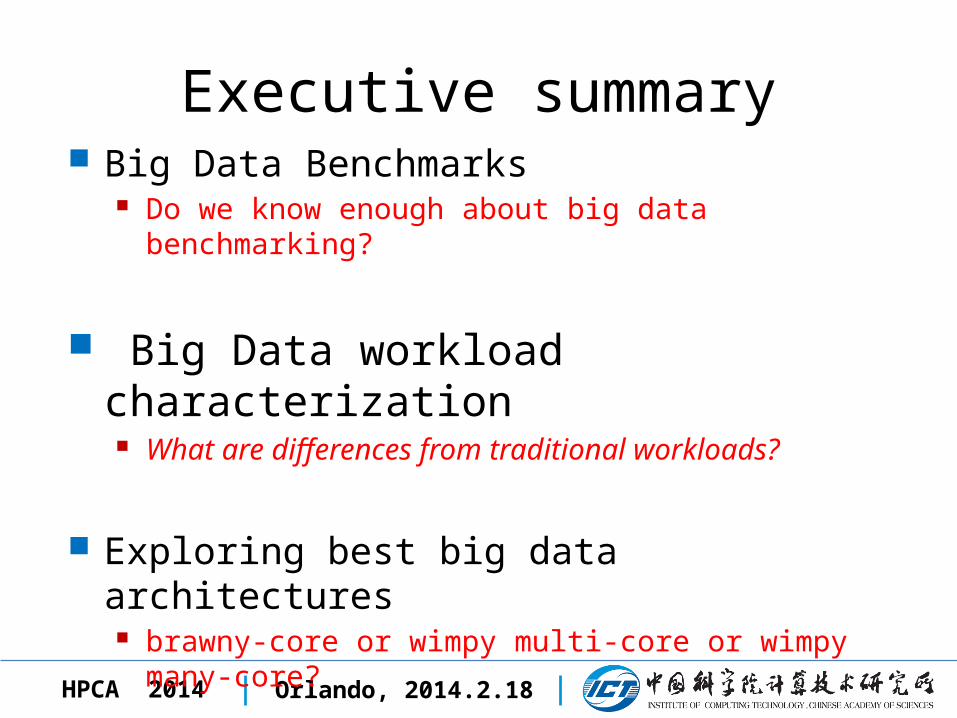
Executive summary Big Data Benchmarks
Do we know enough about big data benchmarking?
Big Data workload characterization What are differences from traditional workloads?
Exploring best big data architectures brawny-core or wimpy multi-core or wimpy many-core?
Orlando, 2014.2.18 HPCA 2014
Outline
Benchmarking Methodology and Decision
Big Data Workload Characterization
Evaluating Hardware Systems with Big Data
Conclusion
3
3
2
Orlando, 2014.2.18 HPCA 2014
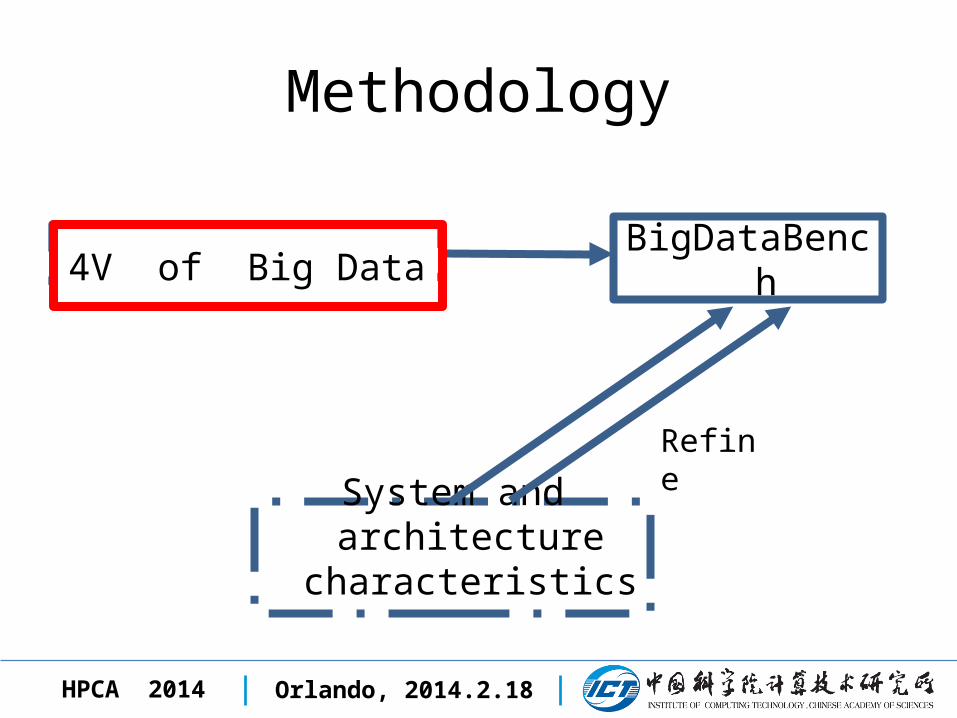
Methodology
4V of Big Data
System and architecture characteristics
BigDataBench
Refine

Orlando, 2014.2.18 HPCA 2014
Methodology (Cont’)
Diverse Data Sets
Diverse Worklo
ads
Data Sources Text data Graph data Table data Extended …
Data Types Structured Semi-structured Unstructured
Big Data Sets Preserving 4V
BigDataBench
Investigate Typical
Application Domains
BDGS: big data generation tools
Application Types OLTP Cloud OLTP OLAP Offline
analytics
Basic & Important Operations and Algorithms Extended…
Represent Software Stack Extended…
Big Data Workloads
Orlando, 2014.2.18 HPCA 2014
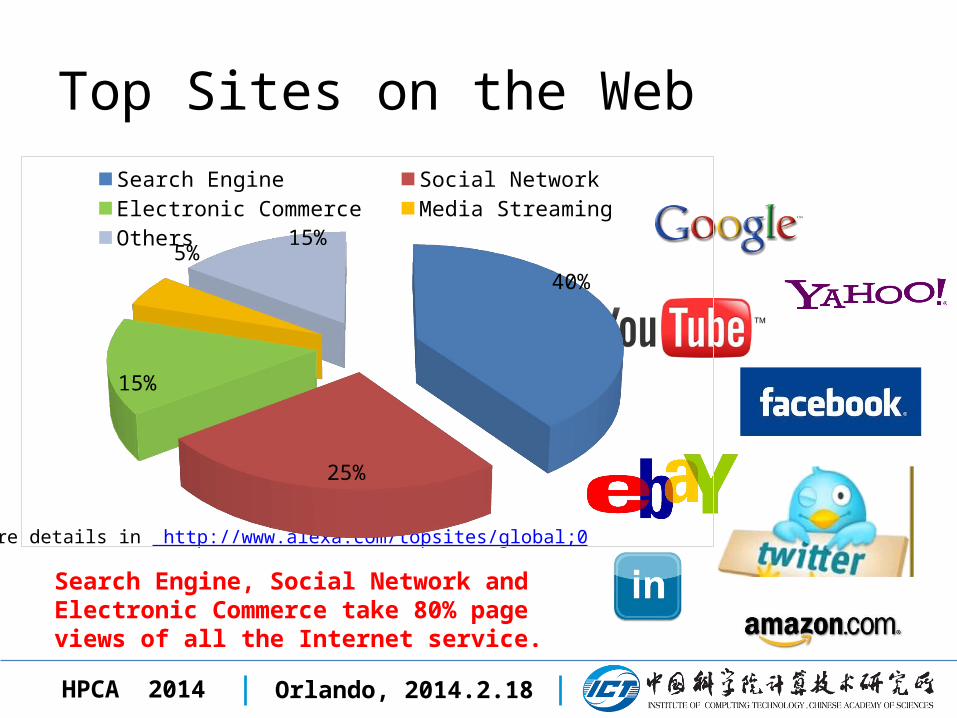
Top Sites on the Web
More details in http://www.alexa.com/topsites/global;0
40%
25%
15%
5%15%
Search Engine Social Network Electronic Commerce
Media Streaming Others
Search Engine, Social Network and Electronic Commerce take 80% page views of all the Internet service.

Orlando, 2014.2.18 HPCA 2014
MPI
SharkImpala
NoSql
Software Stacks
BigDataBench Summary
19 Workloads
(Cloud)
OLTPOLAP Offline Analytics
Search Engine
Social Network E-commerce
Six Real-world Data Sets
Google Web Graph
E-commerce Transaction
Wikipedia Entries
BDGS(Big Data Generator Suite) for scalable data
Facebook Social Network
ProfSearch Person resumes
Amazon Movie Reviews

Orlando, 2014.2.18 HPCA 2014
Outline
Benchmarking Methodology and Decision
Big Data Workload Characterization
Evaluating Hardware Systems with Big Data
Conclusion
3
5
3
2
Orlando, 2014.2.18 HPCA 2014
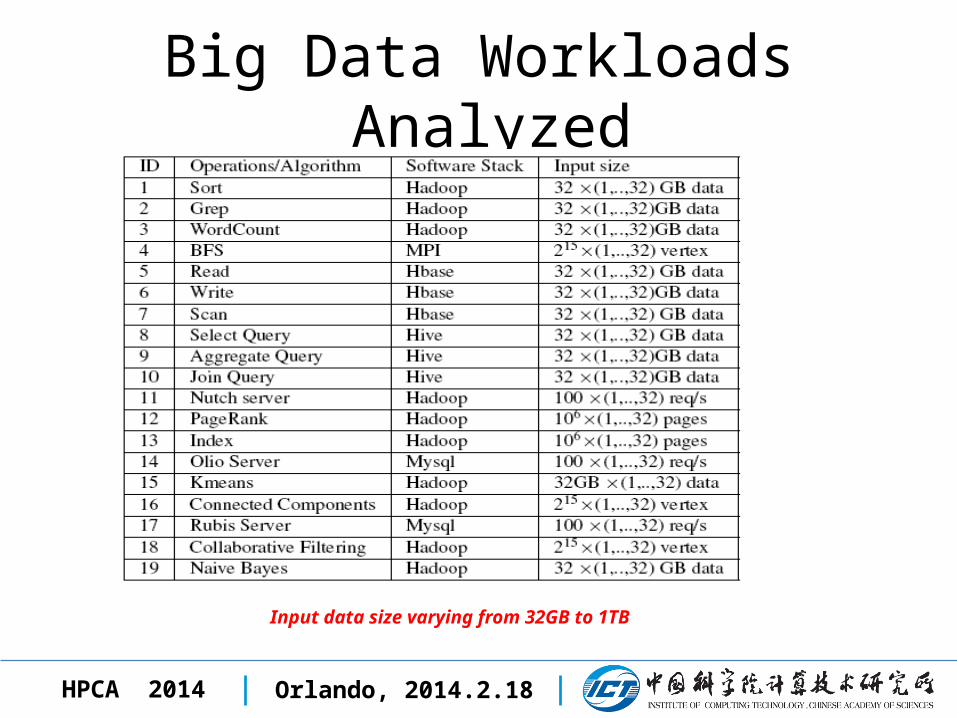
Big Data Workloads Analyzed
Input data size varying from 32GB to 1TB

Orlando, 2014.2.18 HPCA 2014
Other Benchmarks Compared HPCC
Representative HPC benchmark suite• 7 benchmarks
PARSEC CMP (Multi-threaded) benchmark suite
• 12 benchmarks SPECCPU
SPECCFP SPECINT
Orlando, 2014.2.18 HPCA 2014
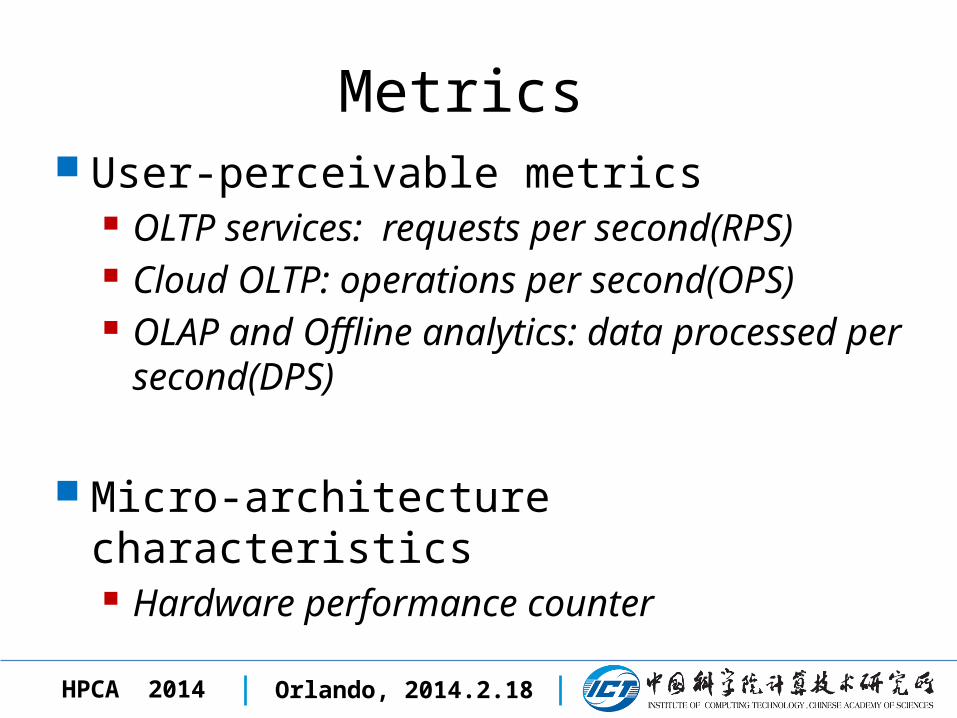
Metrics User-perceivable metrics
OLTP services: requests per second(RPS) Cloud OLTP: operations per second(OPS) OLAP and Offline analytics: data processed per
second(DPS)
Micro-architecture characteristics Hardware performance counter
Orlando, 2014.2.18 HPCA 2014
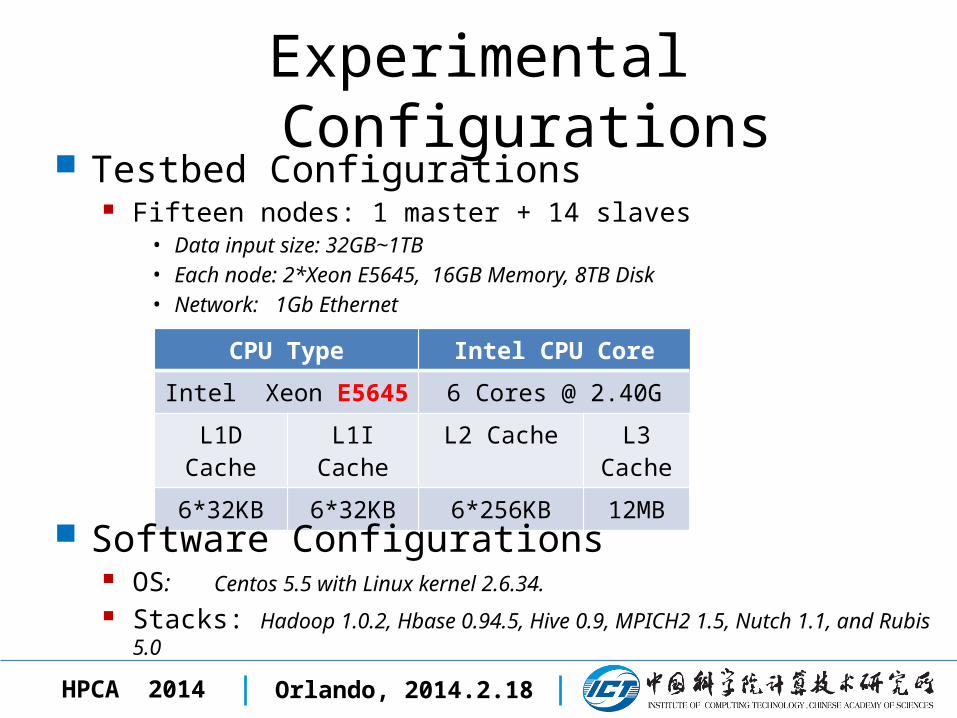
Experimental Configurations Testbed Configurations
Fifteen nodes: 1 master + 14 slaves • Data input size: 32GB~1TB • Each node: 2*Xeon E5645, 16GB Memory, 8TB Disk• Network: 1Gb Ethernet
CPU Type Intel CPU Core
Intel Xeon E5645 6 Cores @ 2.40G
L1D Cache L1I Cache L2 Cache L3 Cache
6*32KB 6*32KB 6*256KB 12MB
Software Configurations OS: Centos 5.5 with Linux kernel 2.6.34. Stacks: Hadoop 1.0.2, Hbase 0.94.5, Hive 0.9, MPICH2 1.5, Nutch 1.1, and Rubis 5.0

Orlando, 2014.2.18 HPCA 2014
0%10%20%30%40%50%60%70%80%90%
100%
Integer
FP
Branch
Store
Load
Instruction BreakdownData Analytics Services
• More integer instructions (Less floating point instructions)• The average ratio of integer to floating point instructions is 75
FP instruction: X87+SSE FP (X87, SSE_Pack_Float, SSE_Pack_Double, SSE_Scalar_Float and SSE_Scalar_Double) Integer instruction: Total _Ins - FP_Ins - Branch_Ins - Store_Ins - Load_Ins

Orlando, 2014.2.18 HPCA 2014
0.001
0.01
0.1
1
10
Floa
ting
Poi
nt O
pera
tion
s pe
r B
yte
E5310
Floating Point Operation Intensity (E5310)Total number of floating point instructions divided by total number of memory access bytes in a run of workload.
Very low floating point operation intensity : two orders of magnitude lower than in the traditional workloads
Data Analytics Services
CPU Type Intel CPU Core
Intel Xeon E5310 4 Cores @ 1.6G
L1 Cache L1 Cache L2 Cache L3 Cache
4*32KB 4*32KB 2*4MB None
Orlando, 2014.2.18 HPCA 2014
Sort
Grep
Wordcount
BFS
PageRankIndex
Kmeans
Connected Components
Collaborative
Filterin
g
Naive Baye
s
Select
Query
Join Query
Aggregate Query
Nutch Se
rver
Olio Se
rver
Rubis Serve
rRead
Write
Scan
Avg_BigData
Avg_HPCC
Avg_Parse
c
SPECFP
SPECIN
T0.001
0.01
0.1
1
10E5310
E5645
Floa
ting
Poin
t Ope
ratio
ns p
er B
yte
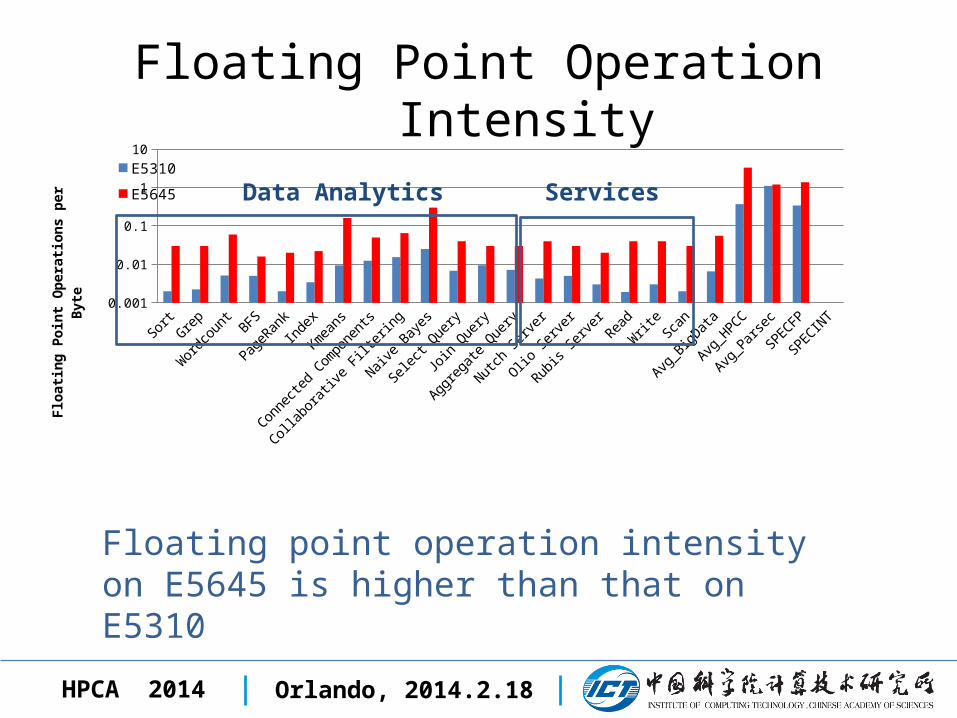
Floating Point Operation Intensity
Data Analytics Services
Floating point operation intensity on E5645 is higher than that on E5310

Orlando, 2014.2.18 HPCA 2014
Sort
Grep
Word
count
BFS
PageR
ank
Index
Kmeans
Connected
Components
Collaborati
ve Fi
lterin
g
Naive B
ayes
Selec
t Query
Join Query
Aggreg
ate Q
uery
Nutch Se
rver
Olio Se
rver
Rubis Serv
erRea
dW
rite
Scan
Avg_B
igData
Avg_H
PCC
Avg_P
arsec
SPEC
FP
SPEC
INT0
0.5
1
1.5
2
2.5
3
3.5
E5310
E5645
Inte
ger O
pera
tion
s pe
r Byt
e
Integer Operation IntensityData Analytics Services
• Integer operation intensity is in the same order like the traditional workloads
Integer operation intensity on E5645 is higher than that on E5310• L3 Cache is effective & Bandwidth improvement
Orlando, 2014.2.18 HPCA 2014
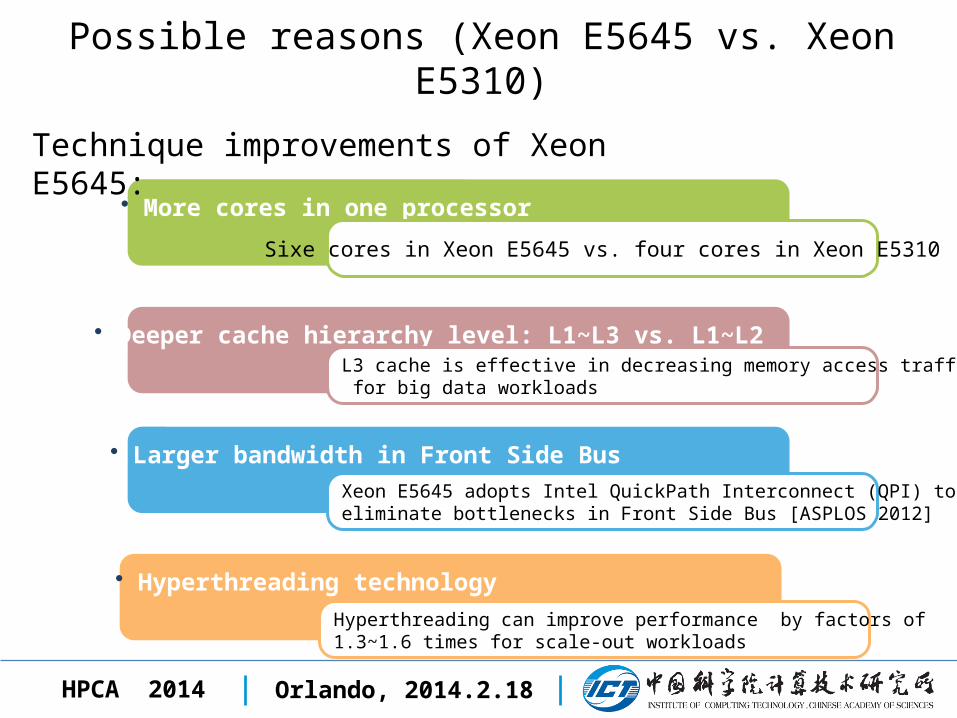
Possible reasons (Xeon E5645 vs. Xeon E5310)
• More cores in one processor
• Deeper cache hierarchy level: L1~L3 vs. L1~L2
• Larger bandwidth in Front Side Bus
Sixe cores in Xeon E5645 vs. four cores in Xeon E5310
L3 cache is effective in decreasing memory access traffic for big data workloads
Xeon E5645 adopts Intel QuickPath Interconnect (QPI) to eliminate bottlenecks in Front Side Bus [ASPLOS 2012]
• Hyperthreading technology
Hyperthreading can improve performance by factors of 1.3~1.6 times for scale-out workloads
Technique improvements of Xeon E5645:

Orlando, 2014.2.18 HPCA 2014
Sort
Grep
Word
count
BFS
PageR
ank
Index
Kmeans
Connected
Collaborati
ve Fi
lterin
g
Naïve b
ayes
Selec
t Query
Aggreg
ate Q
uery
Join Query
Nutch Se
rver
Olio Se
rver
Rubis Serv
erRea
dW
rite
Scan
Avg_B
igData
Avg_H
PCC
Avg_P
arsec
SPEC
FP
SPEC
INT0
5
10
15
20
25
30
35
40
L1I Misses L2 Misses L3 Misses
Miss
es P
KICache Behaviors
Higher L1I Cache misses than the traditional workloads Data analytic workloads have better L2 Cache behaviors than service
workloads with the exception of BFS Good L3 Cache behaviors
Data Analytics Services56 74 83

Orlando, 2014.2.18 HPCA 2014
TLB Behaviors
data analysis service
14 5
Higher ITBL misses than the traditional workloads
Orlando, 2014.2.18 HPCA 2014
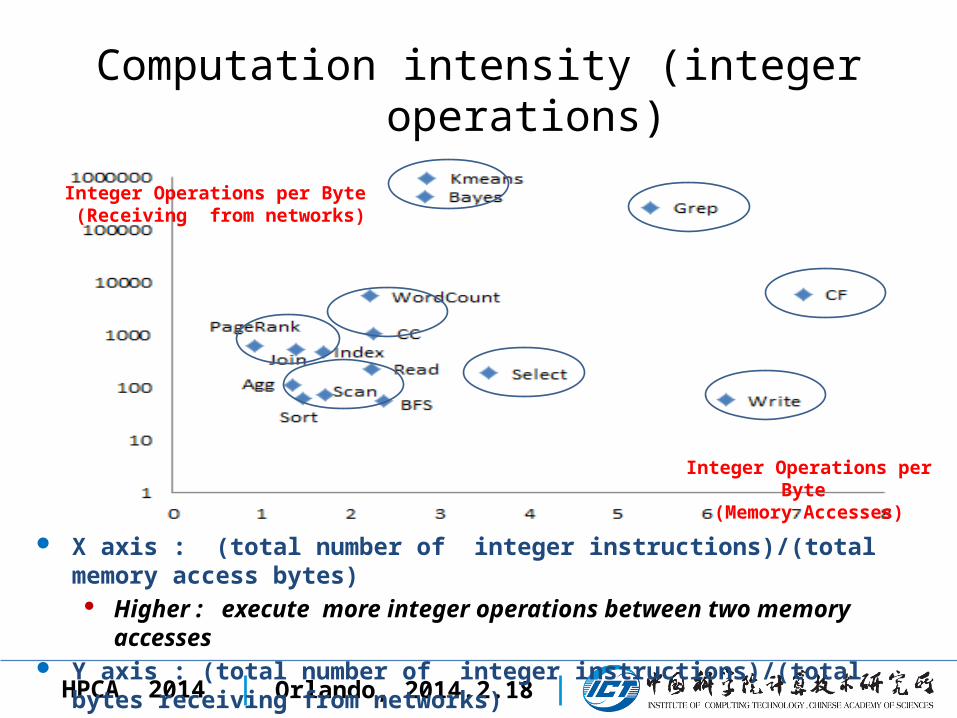
Computation intensity (integer operations)
Integer Operations per Byte (Receiving from networks)
Integer Operations per Byte (Memory Accesses)
X axis : (total number of integer instructions)/(total memory access bytes) Higher : execute more integer operations between two memory accesses
Y axis : (total number of integer instructions)/(total bytes receiving from networks) Higher : execute more integer operations on the same receiving bytes

Orlando, 2014.2.18 HPCA 2014
Big Workloads Characterization Summary Data movement dominated computing
Low computation intensity
Cache Behaviors (Xeon E5645) Very high L1I MPKI L3 Cache is effective
Diverse workload behaviors Computation/communication vs. computation/memory
accesses

Orlando, 2014.2.18 HPCA 2014
Outline
Benchmarking Methodology and Decision
Big Data Workload Characterization
Evaluating Hardware Systems with Big Data Y. Shi, S. A. McKee et al. Performance and Energy Efficiency
Implications from Evaluating Four Big Data Systems, Submitted to IEEE Micro.
Conclusion
3
3
Orlando, 2014.2.18 HPCA 2014
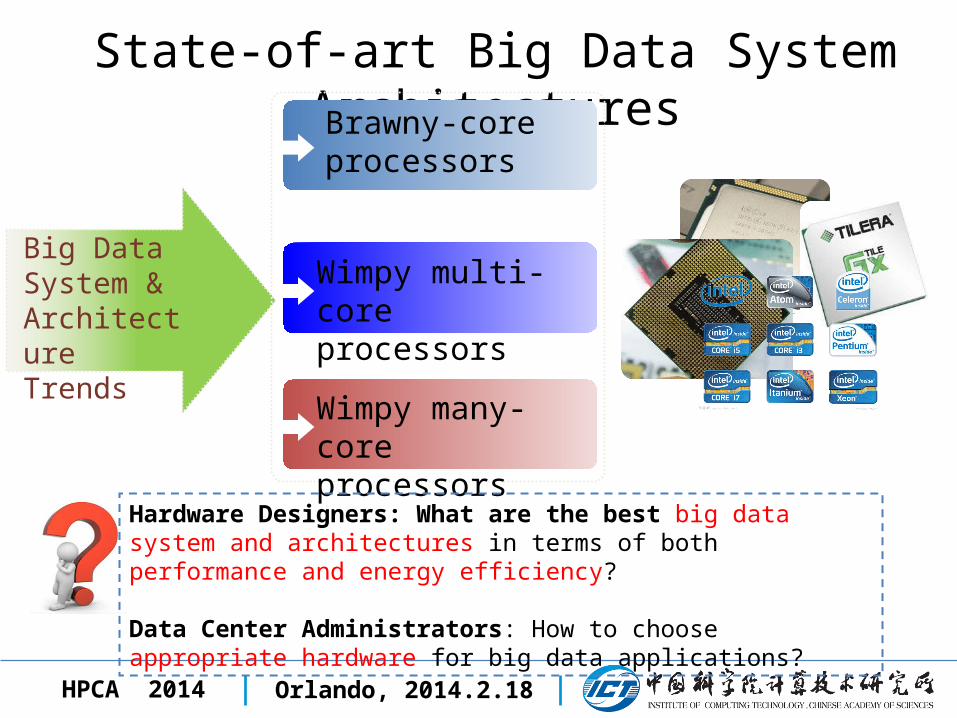
State-of-art Big Data System Architectures
Wimpy many-core processors
Wimpy multi-core processors
Brawny-core processors
Big Data System & Architecture Trends
Hardware Designers: What are the best big data system and architectures in terms of both performance and energy efficiency?
Data Center Administrators: How to choose appropriate hardware for big data applications?

Orlando, 2014.2.18 HPCA 2014
Evaluated Platforms Xeon E5310 (Brawny-core) scale-up Xeon E5645 (Brawny-
core) Atom D510 (Wimpy multi-core) scale-out TileGx 36
(Wimpy many-core)
Model Xeon E5645 Xeon E5310 Atom D510 TileGx36
No. of Processors 2 1 1 1
No. of Cores/CPU 6 4 2 36
Frequency 2.4GHz 1.6GHz 1.66GHz 1.2GHz
L1 Cache (I/D) 32KB/32KB 32KB/32KB 32KB/24KB 32KB/32KB
L2 Cache 256KB*6 4096KB*2 512KB*2 256KB*36
L3 Cache 12MB NONE NONE NONE
TDP 80W 80W 13W 45W
Basic InformationModel Xeon E5645 Xeon E5310 Atom D510 TileGx36
Pipeline Depth 16 14 16 5
Superscalar Widths 4 4 2 3
Instruction Set Architecture
X86 X86 X86 MIPS
Hyper-threading Yes No Yes No
Out-of-Order Execution Yes Yes No No
Specified Floating Point Unit
Yes Yes Yes No
Architectural Characteristics

Orlando, 2014.2.18 HPCA 2014
Chosen Workloads from BigDataBenchApplication Type
Offline analytics
Realtime analytics
Workload
Sort
Wordcount
Grep
Naïve Bayes
K-means
Select Query
Aggregation Query
Join Query
Time Complexity
O(n*logn)
O(n)
O(n)
O(m*n)
O(m*n)
O(n)
O(n)
1
( * )N
ri sii
O n n
Map Operation
Quicksort
String comparison & integer calculation
String comparison & integer calculation
Statistics computation
Distance computation
String comparison
String comparison & integer calculation
String comparison
Reduce Operation
Merge sort
Combination
Combination
Merge
Merge
None
Combination
Cross product
Reduce Input/Map Input
1
0.067
1.85e-6
1.98e-5
2.64e-5
N/A
0.20
0.19
Orlando, 2014.2.18 HPCA 2014
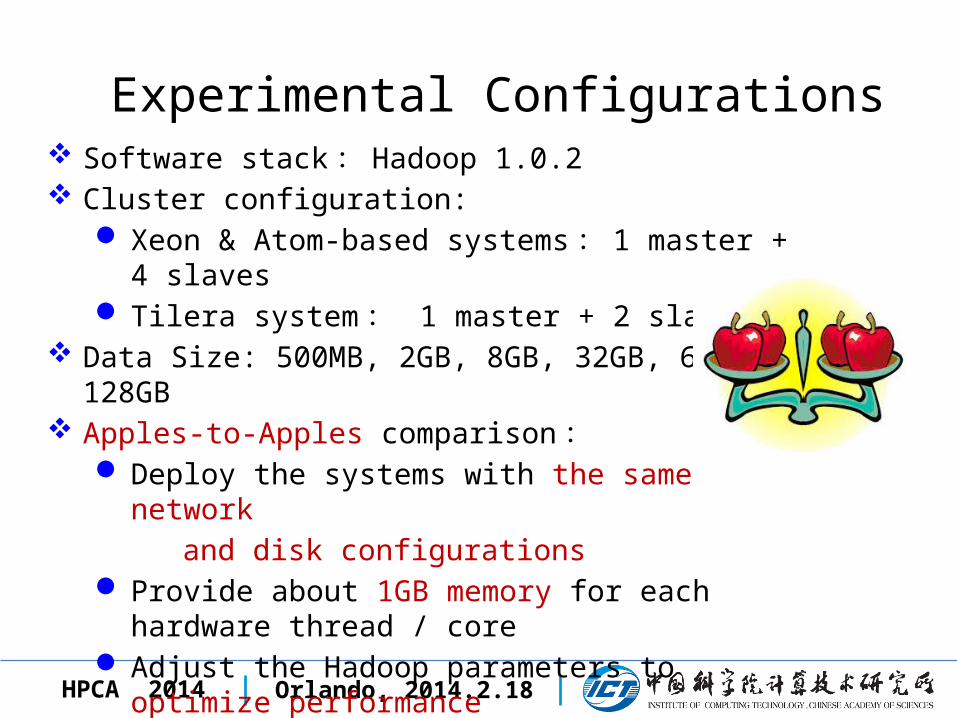
Experimental Configurations Software stack : Hadoop 1.0.2 Cluster configuration:
Xeon & Atom-based systems : 1 master + 4 slaves Tilera system : 1 master + 2 slaves
Data Size: 500MB, 2GB, 8GB, 32GB, 64GB, 128GB Apples-to-Apples comparison :
Deploy the systems with the same network and disk configurations Provide about 1GB memory for each hardware thread /
core Adjust the Hadoop parameters to optimize performance

Orlando, 2014.2.18 HPCA 2014
Metrics
Performance : Data processed per second (DPS) Energy Efficiency : Data processed per joule(DPJ)
Report DPS and DPJ per processor

Orlando, 2014.2.18 HPCA 2014
General Observations
The Average DPS Comparison The Average DPJ Comparison
I/O intensive workload (Sort):many-core TileGx36 achieves the best performance and energy efficiency, The brawny-core processors do not provide performance advantages.
CPU-intensive and floating point operation dominated workloads (Bayes & K-means) : brawny-core processors show obvious performance advantages with close energy efficiency to wimpy-core processors.
Other workloads: no platform consistently wins in terms of both performance and energy efficiency.
Report the average number only when the data sizes bigger than 8GB (not fully utilized on small data sizes).

Orlando, 2014.2.18 HPCA 2014
Improvements from Scaling-out the Wimpy Core (TileGx36 vs. Atom D510)
• The core of TileGx36 is more wimpy than Atom D510
• TileGx36 integrates more cores on the NOC(Network on Chip)
Adopts MIPS-derived VLIW instruction set.Does not support hyperthreading. Less stages in the pipeline depth.Does not have dedicated floating point units.
36 cores in TileGx36 vs. 4 cores Atom D510
Orlando, 2014.2.18 HPCA 2014
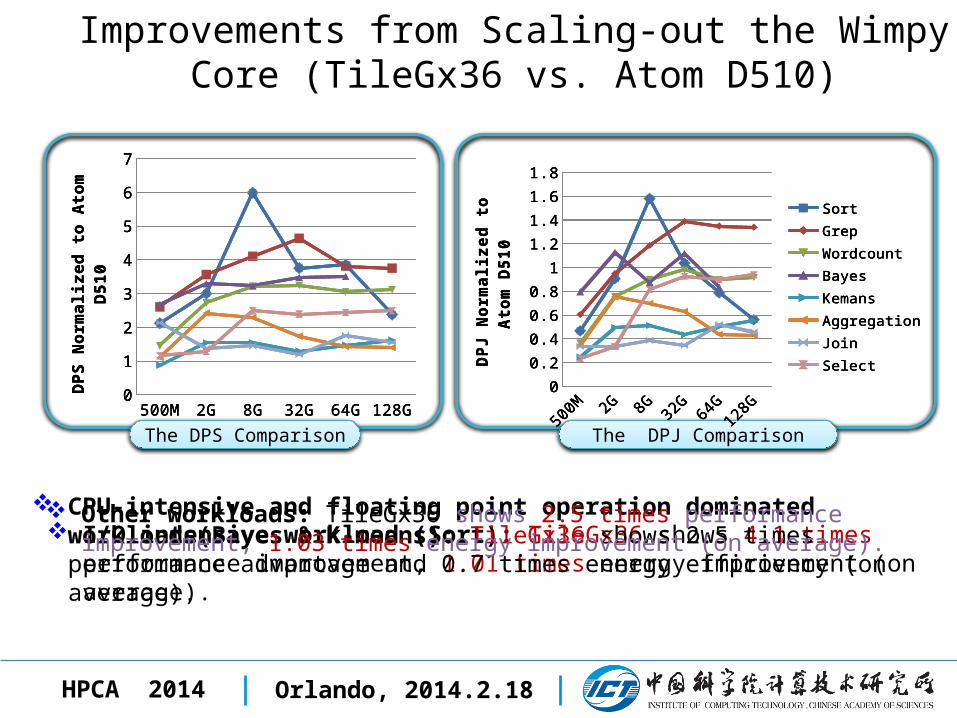
Improvements from Scaling-out the Wimpy Core (TileGx36 vs. Atom D510)
The DPS Comparison The DPJ Comparison
I/O intensive workload (Sort): TileGx36 shows 4.1 times performance improvement, 1.01 times energy improvement (on average).
500M 2G 8G 32G 64G 128G0
0.2
0.4
0.6
0.8
1
1.2
1.4
1.6
1.8
SortGrepWordcountBayesKemansAggregationJoinSelect
DPJ
Nor
mal
ized
to
Ato
m D
510
CPU-intensive and floating point operation dominated workloads(Bayes & K-means): TileGx36 shows 2.5 times performance advantage and 0.7 times energy efficiency (on average).
Other workloads: TileGx36 shows 2.5 times performance improvement, 1.03 times energy improvement (on average).
500M 2G 8G 32G 64G 128G0
1
2
3
4
5
6
7
DPS
Nor
mal
ized
to
Ato
m D
510
500M 2G 8G 32G 64G 128G0
1
2
3
4
5
6
7
DPS
Nor
mal
ized
to
Ato
m D
510
500M 2G 8G 32G 64G 128G0
0.2
0.4
0.6
0.8
1
1.2
1.4
1.6
1.8
SortGrepWordcountBayesKemansAggregationJoinSelect
DPJ
Nor
mal
ized
to
Ato
m D
510
500M 2G 8G 32G 64G 128G0
1
2
3
4
5
6
7
DPS
Nor
mal
ized
to
Ato
m D
510
500M 2G 8G 32G 64G 128G0
0.2
0.4
0.6
0.8
1
1.2
1.4
1.6
1.8
SortGrepWordcountBayesKemansAggregationJoinSelect
DPJ
Nor
mal
ized
to
Ato
m D
510

Orlando, 2014.2.18 HPCA 2014
Improvements from Scaling-out the Wimpy Core (TileGx36 vs. Atom D510)
• The core of TileGx36 is more wimpy than Atom D510
• TileGx36 integrates more cores on the NOC(Network on Chip)
Adopts MIPS-derived VLIW instruction set.Does not support hyperthreading. Less stages in the pipeline depth.Does not have dedicated floating point units.
36 cores in TileGx36 vs. 4 cores Atom D510
Scaling out the wimpy core can bring performance advantage by improving execution parallelism.
Simplifying the wimpy cores and integrating more cores on the NOC is an option for Big Data workloads.

Orlando, 2014.2.18 HPCA 2014
Scale-up the Brawny Core(Xeon E5645) vs. Scale-out the Wimpy Core (TileGx36)
The DPS Comparison The DPJ Comparison
I/O intensive workload (Sort): TileGx36 shows 1.2 times performance improvement, 1.9 times energy improvement (on average).
500M 2G 8G 32G 64G 128G0
1
2
3
4
5
6
7
DPS
Nor
mal
ized
to
Tile
Gx3
6
500M 2G 8G 32G 64G 128G0
0.5
1
1.5
2
2.5
3
3.5
4
SortGrepWordcountBayesKemansAggregationJoinSelect
DPJ
Nor
mal
ized
to
Tile
Gx3
6
CPU-intensive and floating point operation dominated workloads (Bayes & K-means): E5645 shows 4.2 times performance improvement, 2.0 times energy improvement (on average).
Other workloads: E5645 shows performance advantage, but with no consistent energy improvement.
500M 2G 8G 32G 64G 128G0
1
2
3
4
5
6
7
DPS
Nor
mal
ized
to
Tile
Gx3
6
500M 2G 8G 32G 64G 128G0
0.5
1
1.5
2
2.5
3
3.5
4
SortGrepWordcountBayesKemansAggregationJoinSelect
DPJ
Nor
mal
ized
to
Tile
Gx3
6
500M 2G 8G 32G 64G 128G0
1
2
3
4
5
6
7
DPS
Nor
mal
ized
to
Tile
Gx3
6
500M 2G 8G 32G 64G 128G0
0.5
1
1.5
2
2.5
3
3.5
4
SortGrepWordcountBayesKemansAggregationJoinSelect
DPJ
Nor
mal
ized
to
Tile
Gx3
6

Orlando, 2014.2.18 HPCA 2014
Hardware Evaluation SummaryNo one-size-fits-all solution
None of the microprocessors consistently wins in terms of both performance and energy efficiency for all of our Big Data workloads
One-size-fits-a-bunch solution There are different classes of Big Data workloads, and each
class of workload realizes better performance and energy efficiency on different architectures.
Orlando, 2014.2.18 HPCA 2014
Outline
Benchmarking Methodology and Decision
Big Data Workload Characterization
Evaluating hardware systems With Big Data
Conclusion
3
3

Orlando, 2014.2.18 HPCA 2014
Conclusion
An open source big data benchmark suite Data-centric benchmarking methodology http://prof.ict.ac.cn/BigDataBench
Big Data workload characterization Data movement dominated computing Diverse behaviors
• Must including diversity of data and workloads
Eschew one-size-fits-all solution Tailor system designs to specific workload requirements.
Orlando, 2014.2.18 HPCA 2014
THANKs