Institute for Transport Studies FACULTY OF ENVIRONMENT Thursday 7 th October 2010 Leeds Low Emission...
25
Institute for Transport Studies FACULTY OF ENVIRONMENT Thursday 7 th October 2010 Leeds Low Emission Vehicle Exhibition and Conference VEHICLE EMISSION MONITORING AND MODELLING Dr James Tate Lecturer (50% Research) [email protected]
-
Upload
ophelia-gaines -
Category
Documents
-
view
214 -
download
0
Transcript of Institute for Transport Studies FACULTY OF ENVIRONMENT Thursday 7 th October 2010 Leeds Low Emission...
Institute for Transport StudiesFACULTY OF ENVIRONMENT
Thursday 7th October 2010Leeds Low Emission Vehicle Exhibition and Conference
VEHICLE EMISSION MONITORING AND MODELLING
Dr James Tate
Lecturer (50% Research)
Institute for Transport StudiesFACULTY OF ENVIRONMENT
Thursday 7th October 2010Leeds Low Emission Vehicle Exhibition and Conference
BETTER UNDERSTANDING VEHICLE EMISSIONS ON THE ROAD:- Why local air pollution is still a concern- The benefits of hybrid cars
Dr James Tate
Lecturer (50% Research)
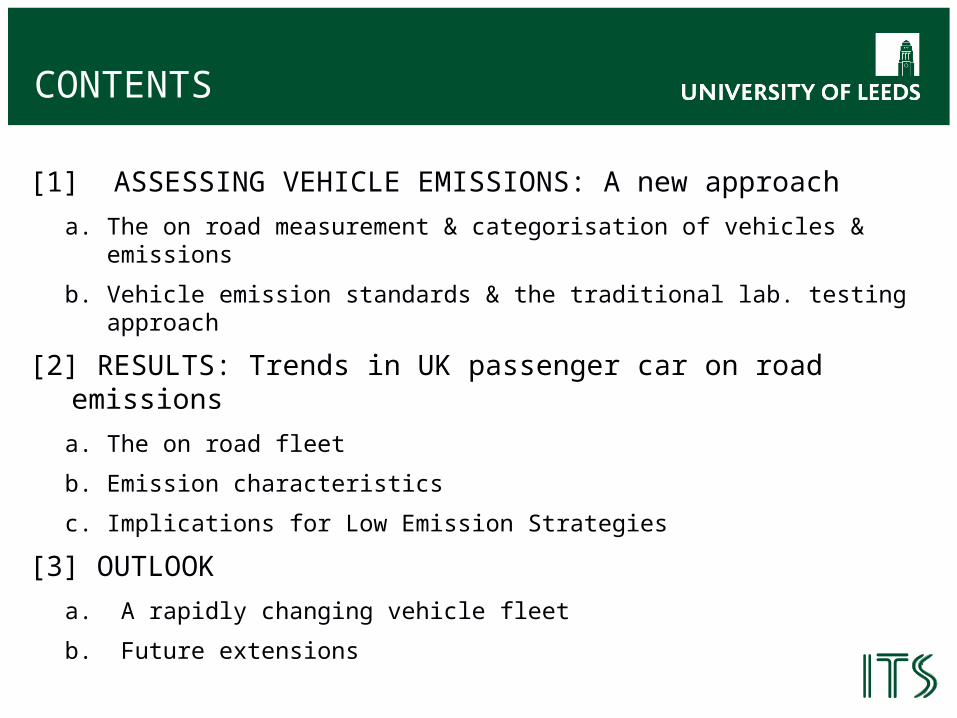
CONTENTS
[1] ASSESSING VEHICLE EMISSIONS: A new approach
a. The on road measurement & categorisation of vehicles & emissions
b. Vehicle emission standards & the traditional lab. testing approach
[2] RESULTS: Trends in UK passenger car on road emissions
a. The on road fleet
b. Emission characteristics
c. Implications for Low Emission Strategies
[3] OUTLOOK
a. A rapidly changing vehicle fleet
b. Future extensions
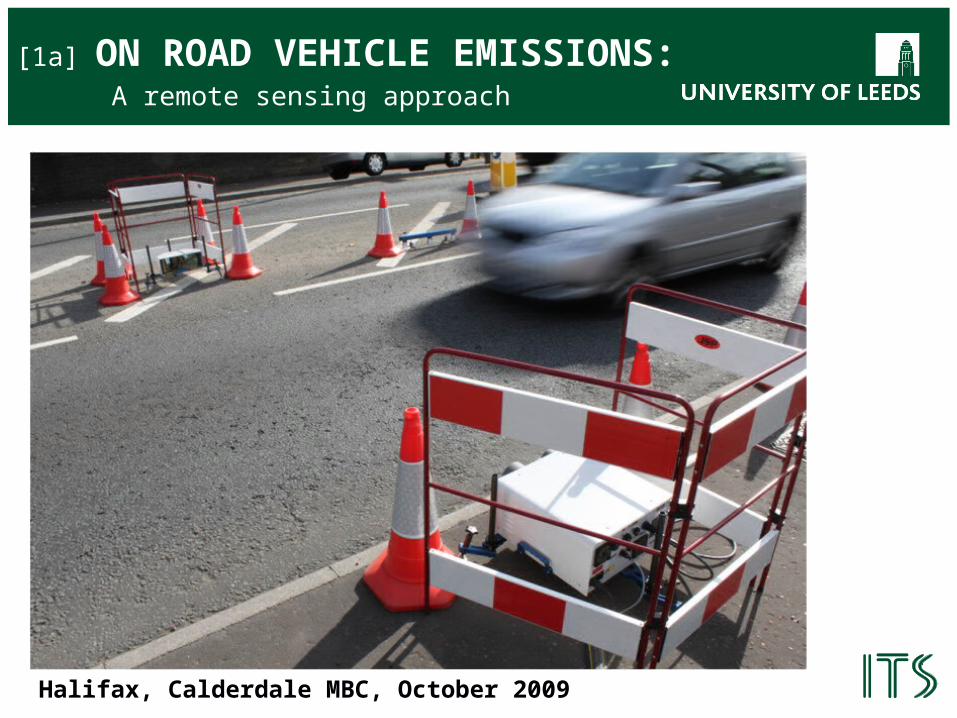
Halifax, Calderdale MBC, October 2009
[1a] ON ROAD VEHICLE EMISSIONS: A remote sensing approach
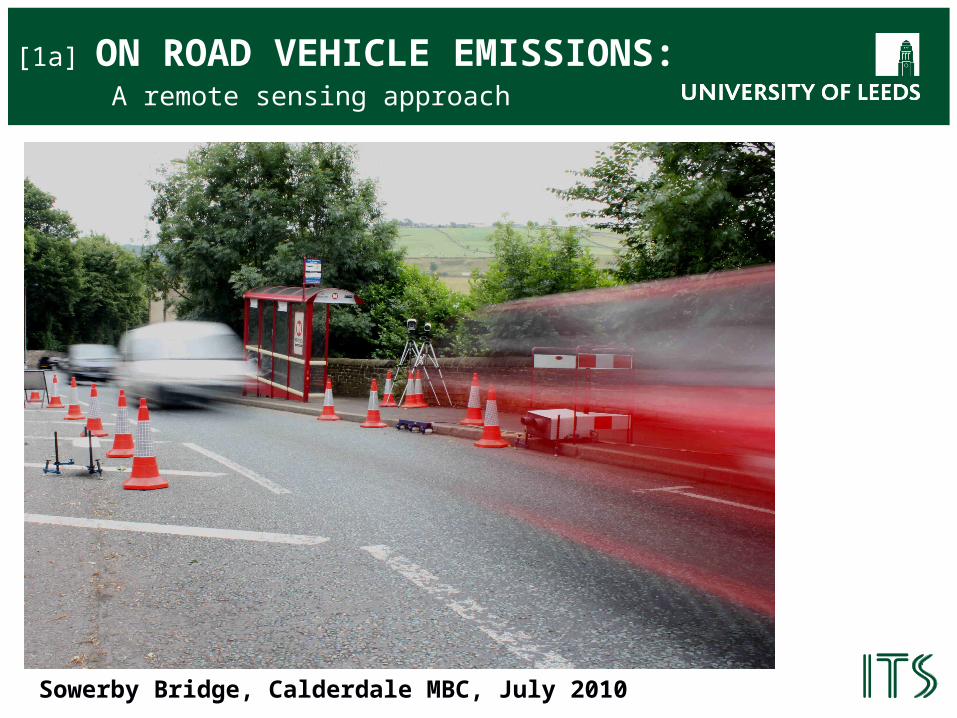
Sowerby Bridge, Calderdale MBC, July 2010
[1a] ON ROAD VEHICLE EMISSIONS: A remote sensing approach
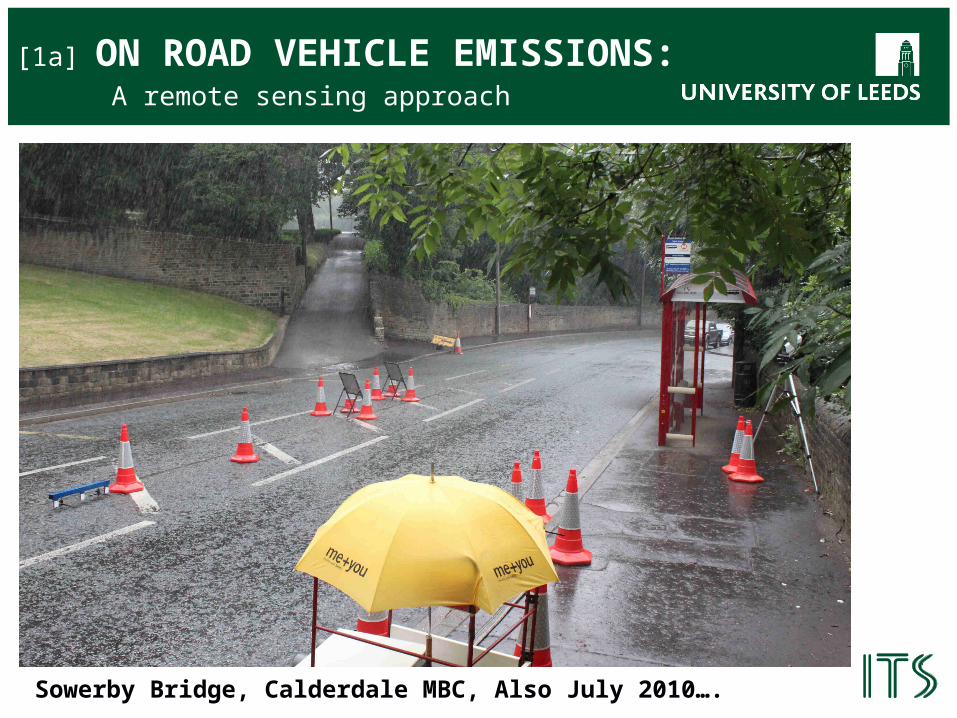
Sowerby Bridge, Calderdale MBC, Also July 2010….
[1a] ON ROAD VEHICLE EMISSIONS: A remote sensing approach
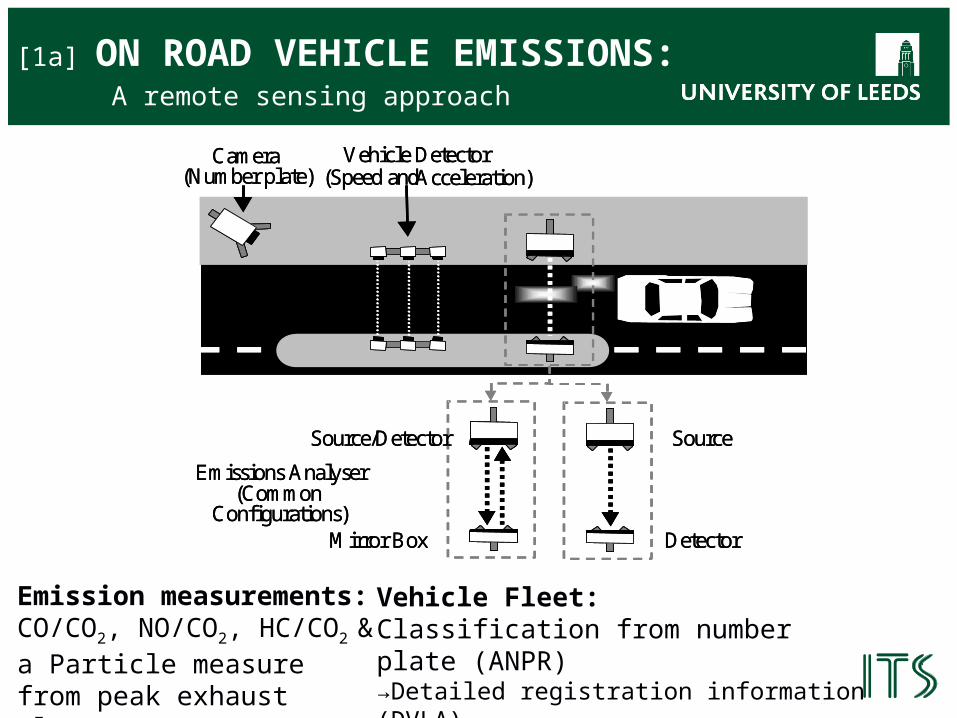
Camera(Number plate)
Vehicle Detector(Speed andAcceleration)
Source/Detector
Mirror Box
Source
Detector
Emissions Analyser(Common
Configurations)
Camera(Number plate)
Vehicle Detector(Speed andAcceleration)
Source/Detector
Mirror Box
Source
Detector
Emissions Analyser(Common
Configurations)
Emission measurements:CO/CO2, NO/CO2, HC/CO2 &a Particle measure from peak exhaust plume conc.
Vehicle Fleet:Classification from number plate (ANPR)→Detailed registration information (DVLA)→Collaboration with www.smmt.co.uk
[1a] ON ROAD VEHICLE EMISSIONS: A remote sensing approach
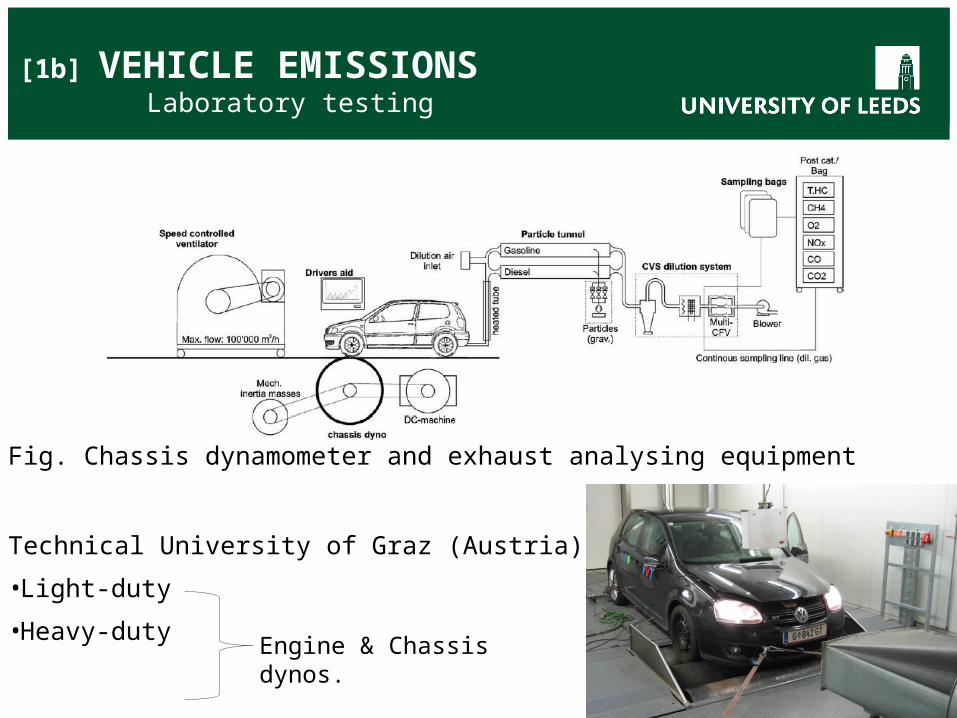
Fig. Chassis dynamometer and exhaust analysing equipment
Technical University of Graz (Austria):
•Light-duty
•Heavy-duty
[1b] VEHICLE EMISSIONS Laboratory testing
Engine & Chassis dynos.
0 200 400 600 800 1000 1200 1400
02
04
06
08
01
20
NEDC - Speed Profile
Time (seconds)
Spe
ed (
kmh1
)
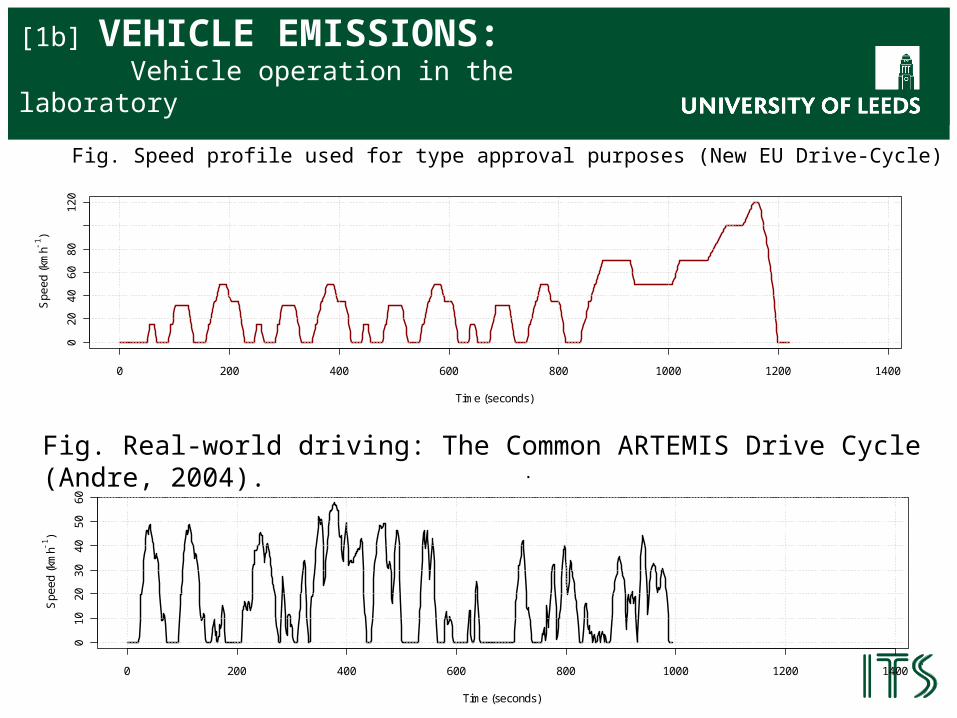
Fig. Speed profile used for type approval purposes (New EU Drive-Cycle)
[1b] VEHICLE EMISSIONS: Vehicle operation in the laboratory
0 200 400 600 800 1000 1200 1400
01
02
03
04
05
06
0
ARTEMIS Urban - Speed Profile
Time (seconds)
Sp
ee
d (
kmh1
)
Fig. Real-world driving: The Common ARTEMIS Drive Cycle (Andre, 2004).
Latest EU directive for Euro 5 and 6 - 2007/715/EC
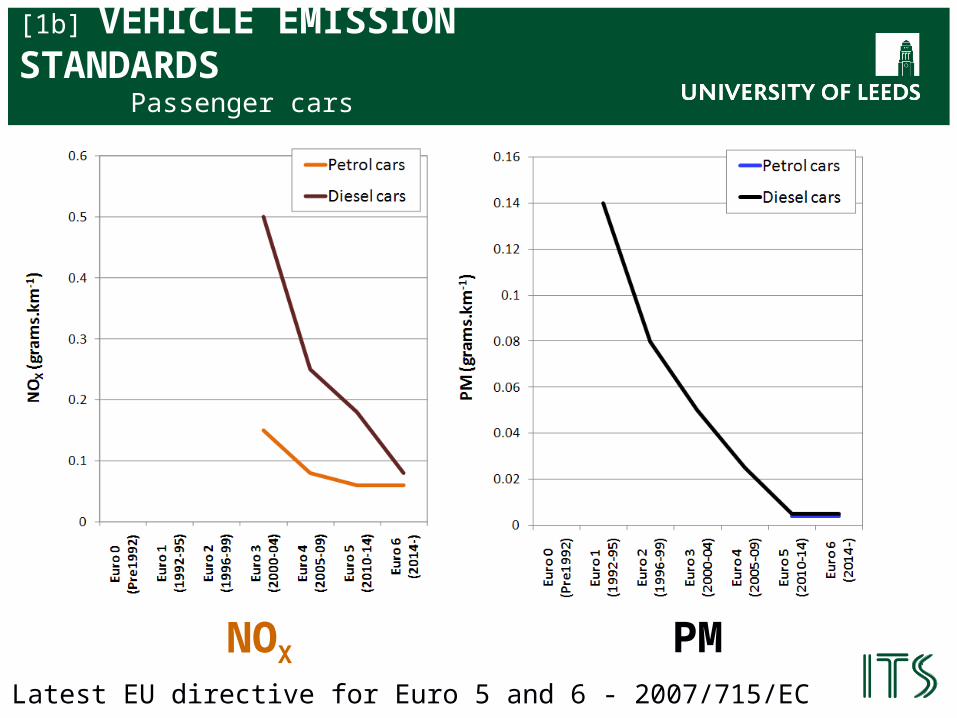
[1b] VEHICLE EMISSION STANDARDS Passenger cars
NOX PM
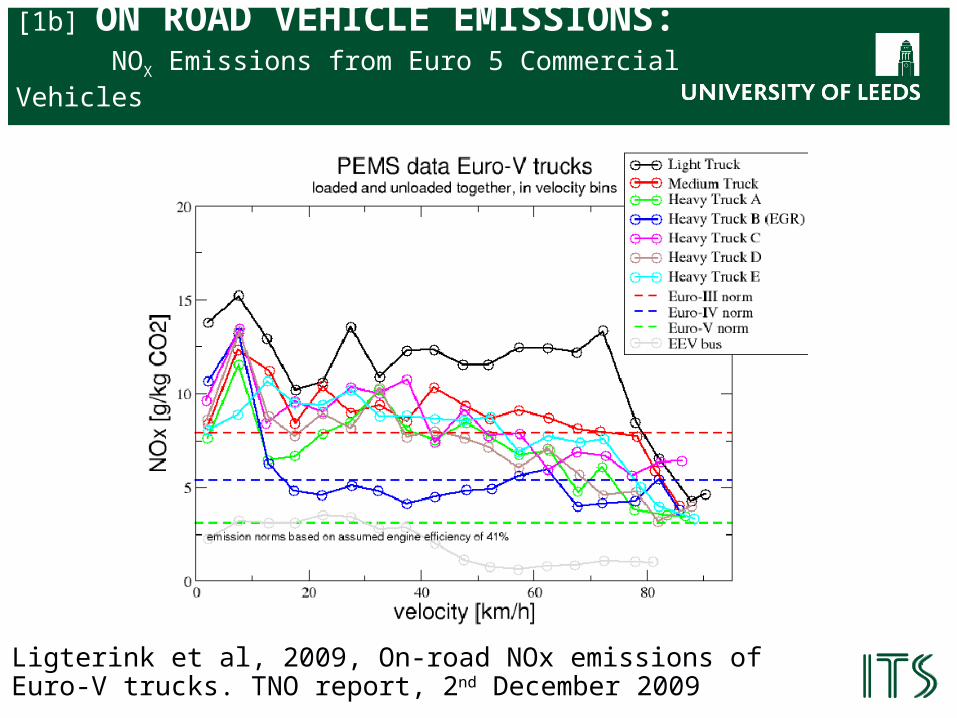
Ligterink et al, 2009, On-road NOx emissions of Euro-V trucks. TNO report, 2nd December 2009
[1b] ON ROAD VEHICLE EMISSIONS: NOX Emissions from Euro 5 Commercial Vehicles
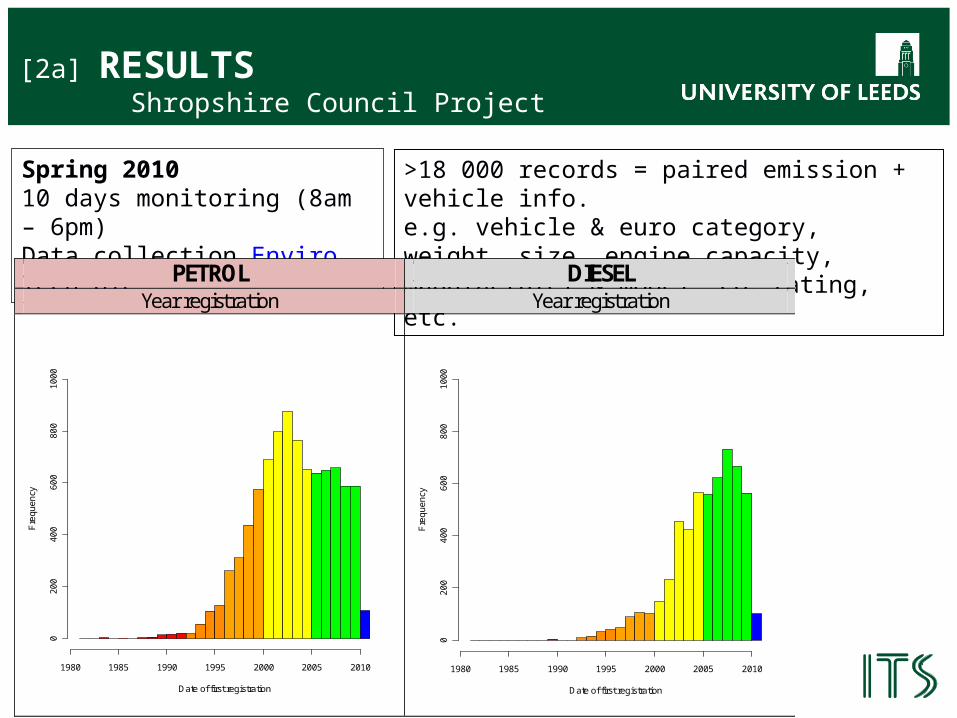
Spring 201010 days monitoring (8am – 6pm)Data collection Enviro Tech plc.
[2a] RESULTS Shropshire Council Project
>18 000 records = paired emission + vehicle info.e.g. vehicle & euro category, weight, size, engine capacity, manufacturer & model, CO2 rating, etc.
PETROL DIESEL Year registration Year registration
Date of first registration
Fre
qu
en
cy
1980 1985 1990 1995 2000 2005 2010
02
00
40
06
00
80
01
00
0
Date of first registration
Fre
qu
en
cy
1980 1985 1990 1995 2000 2005 2010
02
00
40
06
00
80
01
00
0
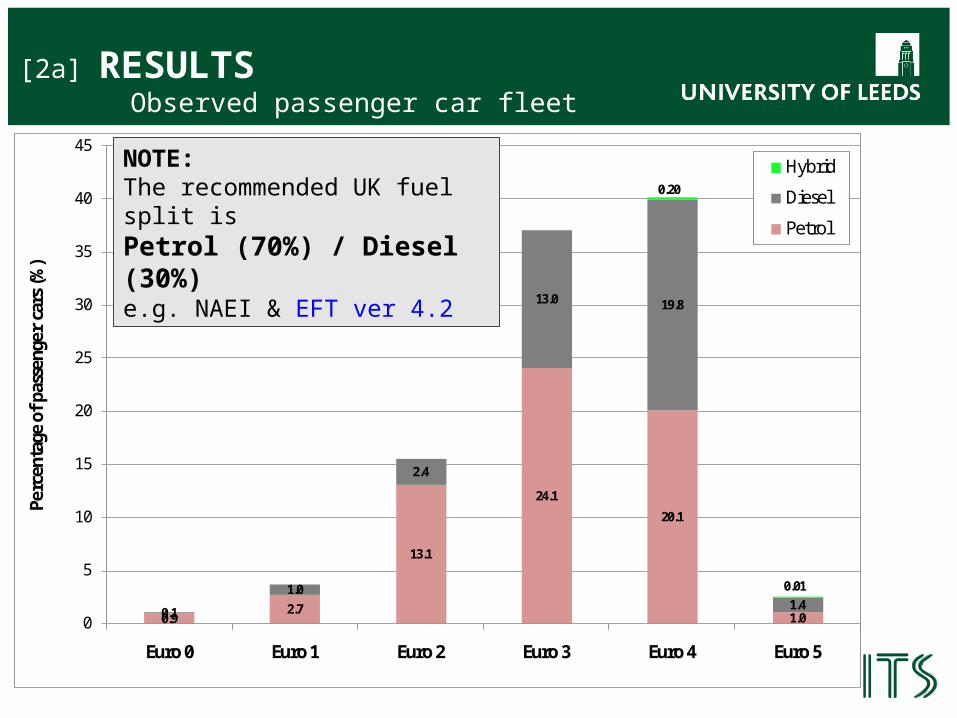
[2a] RESULTS Observed passenger car fleet
0.92.7
13.1
24.1
20.1
1.00.1
1.0
2.4
13.0 19.8
1.40
5
10
15
20
25
30
35
40
45
Euro 0 Euro 1 Euro 2 Euro 3 Euro 4 Euro 5
Perc
enta
ge o
f pas
seng
er c
ars
(%)
Hybrid
Diesel
Petrol
0.20
0.01
NOTE:The recommended UK fuel split isPetrol (70%) / Diesel (30%)e.g. NAEI & EFT ver 4.2
PETROL DIESEL
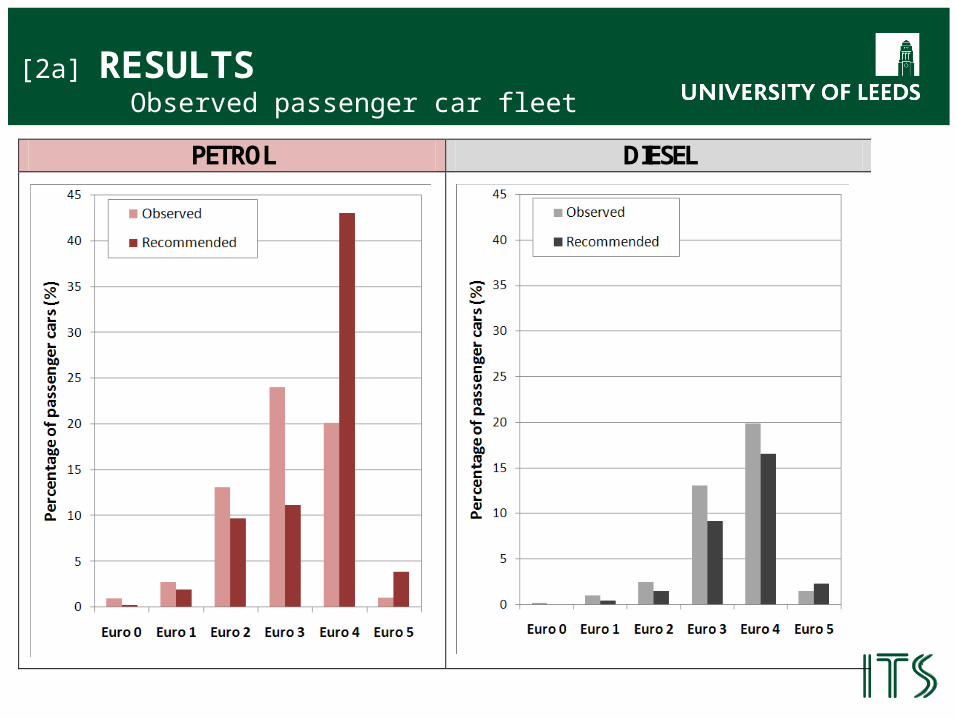
[2a] RESULTS Observed passenger car fleet
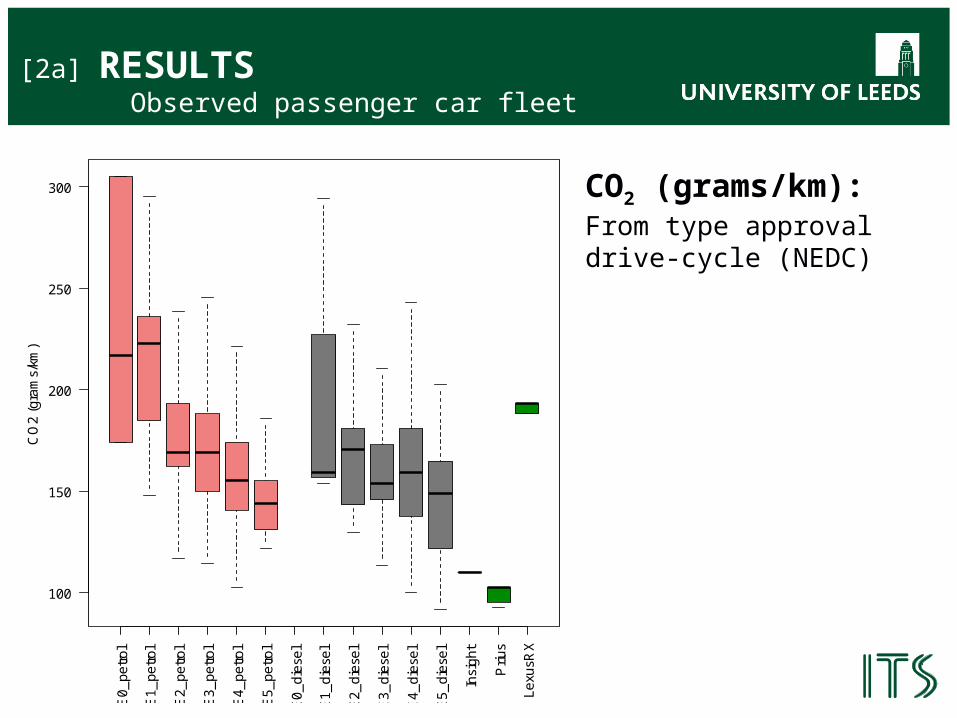
[2a] RESULTS Observed passenger car fleet
CO2 (grams/km):From type approvaldrive-cycle (NEDC)
a E
0_
pe
tro
l
b E
1_
pe
tro
l
c E
2_
pe
tro
l
d E
3_
pe
tro
l
e E
4_
pe
tro
l
f E5
_p
etr
ol
i E0
_d
iese
l
j E1
_d
iese
l
k E
2_
die
sel
l E3
_d
iese
l
m E
4_
die
sel
n E
5_
die
sel
o
In
sig
ht
p
Pri
us
q L
exu
sRX
100
150
200
250
300
CO
2 (
gra
ms/
km)

[2a] RESULTS Observed passenger car fleet
Kerb Weight (kg) Engine capacity (cc)
a E
0_
pe
tro
l
b E
1_
pe
tro
l
c E
2_
pe
tro
l
d E
3_
pe
tro
l
e E
4_
pe
tro
l
f E5
_p
etr
ol
i E0
_d
iese
l
j E1
_d
iese
l
k E
2_
die
sel
l E3
_d
iese
l
m E
4_
die
sel
n E
5_
die
sel
o
In
sig
ht
p
Pri
us
q L
exu
sRX
1000
1500
2000
Ve
hic
le k
erb
we
igh
t (kg
)
a E
0_
pe
tro
l
b E
1_
pe
tro
l
c E
2_
pe
tro
l
d E
3_
pe
tro
l
e E
4_
pe
tro
l
f E5
_p
etr
ol
i E0
_d
iese
l
j E1
_d
iese
l
k E
2_
die
sel
l E3
_d
iese
l
m E
4_
die
sel
n E
5_
die
sel
o
In
sig
ht
p
Pri
us
q L
exu
sRX
500
1000
1500
2000
2500
3000
3500
En
gin
e c
ap
aci
ty (
cc)
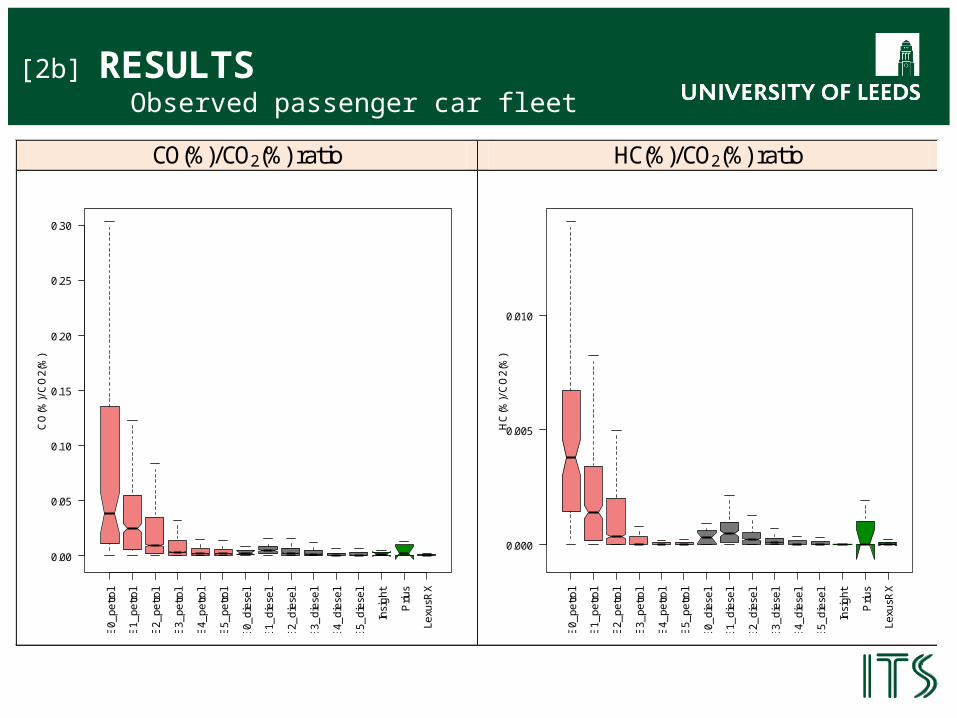
[2b] RESULTS Observed passenger car fleet
CO(%)/CO2(%) ratio HC(%)/CO2(%) ratio
a E
0_p
etr
ol
b E
1_p
etr
ol
c E
2_p
etr
ol
d E
3_p
etr
ol
e E
4_p
etr
ol
f E5_
pe
tro
l
i E0_
die
sel
j E1_
die
sel
k E
2_d
iese
l
l E3_
die
sel
m E
4_
die
sel
n E
5_d
iese
l
o
In
sig
ht
p
Pri
us
q L
exu
sRX
0.00
0.05
0.10
0.15
0.20
0.25
0.30
CO
(%)/
CO
2(%
)
a E
0_p
etr
ol
b E
1_p
etr
ol
c E
2_p
etr
ol
d E
3_p
etr
ol
e E
4_p
etr
ol
f E5_
pe
tro
l
i E0_
die
sel
j E1_
die
sel
k E
2_d
iese
l
l E3_
die
sel
m E
4_
die
sel
n E
5_d
iese
l
o
In
sig
ht
p
Pri
us
q L
exu
sRX
0.000
0.005
0.010
HC
(%)/
CO
2(%
)

[2a] RESULTS Observed passenger car fleet
NO(%)/CO2(%) ratio PM10 Index
a E
0_
petr
ol
b E
1_
petr
ol
c E
2_p
etr
ol
d E
3_
petr
ol
e E
4_
petr
ol
f E5
_p
etro
l
i E0
_d
iese
l
j E1
_d
iese
l
k E
2_d
iese
l
l E3
_d
iese
l
m E
4_
die
sel
n E
5_
die
sel
o
In
sig
ht
p
Pri
us
q L
exus
RX
0.000
0.005
0.010
0.015
0.020
0.025
NO
(%)/
CO
2(%
)
a E
0_
petr
ol
b E
1_
petr
ol
c E
2_p
etr
ol
d E
3_
petr
ol
e E
4_
petr
ol
f E5
_p
etro
l
i E0
_d
iese
l
j E1
_d
iese
l
k E
2_d
iese
l
l E3
_d
iese
l
m E
4_
die
sel
n E
5_
die
sel
o
In
sig
ht
p
Pri
us
q L
exus
RX
0.0
0.1
0.2
0.3
0.4
0.5
0.6
PM
10
Ind
ex

•Nitrogen dioxide emitted directly from vehicle exhausts is termed primary NO2 (p-NO2)
•The proportion of NOX emitted directly as NO2 is the primary NO2 fraction (f-NO2)
•f-NO2 is usually expressed as a percentage (p-NO2/ NOX)
•f-NO2 is rising as a result of:
Modern diesel exhaust after-treatment systems (particulate traps and diesel oxidation catalysts) lead to substantial increases in f-NO2
The ‘dieselisation’ of vehicle fleets across the EU
•PETROL passenger cars: f-NO2 ~ 3% (All Euro categories)
•DIESEL passenger cars f-NO2 ~
►Euro 2 and earlier 11%
►Euro 3 30%
►Euro 4 55%
►Euro 5 55%
►Euro 6 55%
TERMINOLOGYOxides of Nitrogen
Grice et al, 2009. Recent trends and projections of primary NO2 emissions in Europe. Atmospheric Env. 43, pp. 2154 - 2167.&HBEFA, 2010. Swiss/ German HandBook of Emission Factors (HBEFA)
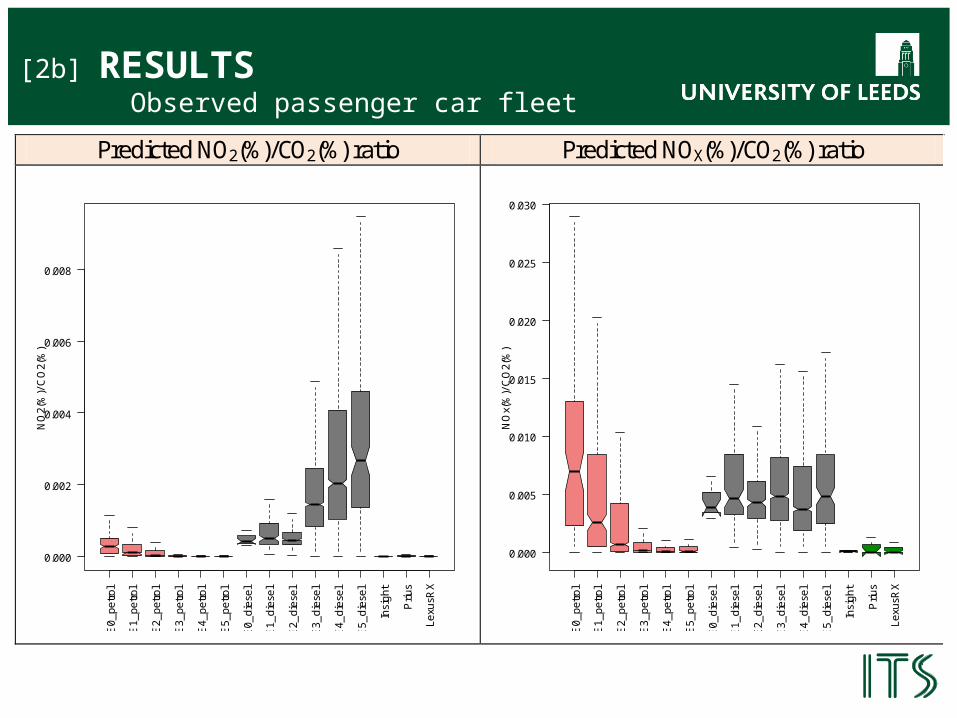
[2b] RESULTS Observed passenger car fleet
Predicted NO2(%)/CO2(%) ratio Predicted NOX(%)/CO2(%) ratio
a E
0_
pe
tro
l
b E
1_
pe
tro
l
c E
2_
pe
tro
l
d E
3_
pe
tro
l
e E
4_
pe
tro
l
f E5
_p
etr
ol
i E0
_d
iese
l
j E1
_d
iese
l
k E
2_
die
sel
l E3
_d
iese
l
m E
4_
die
sel
n E
5_
die
sel
o
In
sig
ht
p
Pri
us
q L
exu
sRX
0.000
0.002
0.004
0.006
0.008
NO
2(%
)/ C
O2
(%)
a E
0_
pe
tro
l
b E
1_
pe
tro
l
c E
2_
pe
tro
l
d E
3_
pe
tro
l
e E
4_
pe
tro
l
f E5
_p
etr
ol
i E0
_d
iese
l
j E1
_d
iese
l
k E
2_
die
sel
l E3
_d
iese
l
m E
4_
die
sel
n E
5_
die
sel
o
In
sig
ht
p
Pri
us
q L
exu
sRX
0.000
0.005
0.010
0.015
0.020
0.025
0.030
NO
x(%
)/ C
O2
(%)
[2b] SUMMARY RESULTS p-NO2 Trends
0
0.00025
0.0005
0.00075
0.001
0.00125
0
5
10
15
20
25
1995
1996
1997
1998
1999
2000
2001
2002
2003
2004
2005
2006
2007
2008
2009
2010
2011
2012
2013
2014
Ave
rage
NO
2(%
)/CO
2(%
) Rati
o (P
asse
nger
cars
)
Ave
rage
f-N
O2
(Pas
seng
er c
ars)
Scenario Year
f-NO2
Forecast
NO2(%)/CO2(%)
Forecast
ASSUMPTIONS:
•The 2010 passenger car fleet petrol/ diesel split and average NO2 figures, projected to new vehicles 2011-
•The number of new vehicles, assumed to be equivalent to 2009
•Scrappage of older vehicles not currently considered
Note: Euro 6 Sept 2014-

• Policies to encourage the replacement of older passenger cars with “potentially more environmentally friendly models” (www.berr.gov.uk) may exacerbate the NO2 problem
E.g. The UK Car Scrappage Scheme
• Boost to the car industry
• Voluntary discount scheme under which motor dealers gave motorists £2,000 or more towards a new vehicle if they traded in a car or van over 10 years old for scrap between the 21st October 2009 and the 28th of February
• Number of vehicles scrapped = 400 000
•The scheme has supported replacing older passenger cars (typically petrol engines) with modern diesel passenger cars that emit more p-NO2
• For all other legislated emissions, the scheme is considered to have been beneficial
[2c] IMPLICATIONS Low Emission Strategies

[2c] IMPLICATIONS E.g. The UK Car Scrappage Scheme
-100
0
100
200
300
400
500
600CO
2 (g
ram
s/km
)
WEI
GH
T (k
g)
Engi
ne ca
paci
ty (c
c)
Prop
orti
on D
IESE
L
PM10
CO/C
O2
HC/
CO2
NO
/CO
2
NO
X/CO
2
f-N
O2
NO
2/CO
2
Perc
enta
ge ch
ange
(%
)(E
uro
2 +o
lder
VS
Euro
4 +
new
er)
• The UK and EU vehicle fleets are in a period of transition:
– Increasing fleet share of DIESEL passenger cars
– DIESEL passenger cars emit more NO2 directly
– Little expected reduction in the NO2 emissions from Euro 6 DIESELS (2014-)
√ Initial stages of growth for HYBRID and ELECTRIC vehicles
√ Unlike diesels vehicles, HYBRID and ELECTRIC vehicles potentially benefit the both the GLOBAL and LOCAL environment
• Vehicle emission models and management policies need to better consider the composition of the on road vehicle fleet
• NO2 air pollution standards are likely to continue to be exceeded 2015-
• Emission standards and Legislation should be extended to:
► Better represent “real-world” driving conditions
► Include standards for NO2
[3a] OUTLOOK Summary
Regional Group initiative:
• West Yorkshire Transport Emissions Group
• DEFRA funding 2010 - 2011
• Surveys completed in Calderdale MBC July 2010
• Surveys planned in Bradford, Kirklees, Leeds and York: 2010 – 2011
• >25 000 valid records from each Local Authority
• Rich resource to better understand vehicle emissions & inform Low Emission Strategies
Future Research Priorities:
• Inform the development and calibration of emission models
e.g. study the % of failed catalysts in vehicle type sub-categories
• With a larger dataset, study the important Heavy-duty vehicle sub-categories
[3b] OUTLOOK Research extensions