Institute for Research on Poverty Discussion Paper no ... · Institute for Research on Poverty ......
46
Institute for Research on Poverty Discussion Paper no. 1183-98 The State of the Economy and the Problem of Poverty: Implications for the Success or Failure of Welfare Reform Glen G. Cain Department of Economics University of Wisconsin–Madison E-mail: [email protected] December 1998 I am grateful to Robert Haveman, Jan Blakeslee, and Betty Evanson for comments and to Heidi Hartmann and Stephen Yeaple for research assistance. IRP publications (discussion papers, special reports, and the newsletter Focus) are now available on the Internet. The IRP Web site can be accessed at the following address: http://www.ssc.wisc.edu/irp/
Transcript of Institute for Research on Poverty Discussion Paper no ... · Institute for Research on Poverty ......

Institute for Research on PovertyDiscussion Paper no. 1183-98
The State of the Economy and the Problem of Poverty:Implications for the Success or Failure of Welfare Reform
Glen G. CainDepartment of Economics
University of Wisconsin–MadisonE-mail: [email protected]
December 1998
I am grateful to Robert Haveman, Jan Blakeslee, and Betty Evanson for comments and to HeidiHartmann and Stephen Yeaple for research assistance.
IRP publications (discussion papers, special reports, and the newsletter Focus) are now available on theInternet. The IRP Web site can be accessed at the following address: http://www.ssc.wisc.edu/irp/

Abstract
This paper uses an historical perspective to examine the labor market prospects and the
macroeconomic setting facing mothers with dependent children who were (or would have been) enrolled
in the old AFDC program, now that their welfare status will be handled by the new state programs in the
wake of the Personal Responsibility and Work Opportunity Reconciliation Act, passed by Congress in
1996. The new law mandates the end to entitlements to cash payments for these women and their families
and requires that they become self-supporting after the time limits for the cash payments are reached—a
maximum of five years. Effectively, job holding is to replace welfare assistance as the main means of
self-support. This paper documents the historical record of three trends that, given the new welfare laws,
will largely determine the future poverty status of the affected women: wage growth, women’s labor
force participation, and single-parent families (which reflect trends in marital breakups and in out-of-
wedlock births). Since 1959, the first year for the modern series of poverty statistics, both women’s labor
force participation and female headship of families have increased, the latter increasing poverty rates and
the former, by itself, reducing poverty rates. The paper argues that wage growth is central to reducing
poverty, especially now that government income support programs have been drastically reduced. The
favorable economic record in the United States from 1959 to 1973, when wages and family incomes
grew, is contrasted with the period from 1973 to 1997, when wages stopped growing and the growth in
family incomes was slow. Given the difficulty in reversing demographic trends, macroeconomic
economic growth appears necessary and effective to reduce poverty.

1In recent years, 90 percent of the single parents in these families have been mothers. In 1991, for example,91 percent of single-parent families with incomes below $15,000, and 89 percent with incomes below $20,000, werefemale-headed families. The median income in 1991 of all single-parent families was $13,012, which compares witha median income of $42,515 for all two-parent families (Census, P60-180, 1992, pp. 68–69). In this paper, single-parent families will be understood to be families with the mother as family head, unless otherwise noted.
2An extensive discussion of the new law is given in the 1998 Green Book, pp. 494–531. (See references forthe full citation.)
3Burtless (1995) gives convincing evidence for his claim that “The earnings capacity of most women whocollect welfare is extremely low.... [This capacity] rises only slowly with age [and] recent labor marketdevelopments have depressed the potential earnings.... Most assistance recipients, if forced to rely on their ownwage earnings, would almost certainly remain poor even if they worked full-time on a year-round basis” (p. 101).
The State of the Economy and the Problem of Poverty:Implications for the Success or Failure of Welfare Reform
I. INTRODUCTION
The welfare reform law of 1996, the Personal Responsibility and Work Opportunity
Reconciliation Act, has been summarized by the slogan, “work, not welfare.” The law abolished the
program of Aid to Families with Dependent Children (AFDC), the largest component of the old system
of public assistance, and ended the federally based entitlements of cash transfer payments to this low-
income group of families headed by single parents (mostly mothers).1 States are now responsible for
administering their own programs and will implement the law’s five-year (maximum) entitlement to cash
payments. To receive welfare assistance, recipients are required to work (as defined by the state) after a
minimum of two years, and some states have imposed shorter time limits.2 With few exceptions, current
and future poor families with dependent children will have to become economically self-supporting.
The immediate burden of achieving self-support falls on the mothers in these low-income
families. However, if the objective is to allow these families to work their way out of poverty, there is an
impersonal burden on, or challenge to, the labor market to offer jobs at above-poverty wages to the
anticipated entry in the next several years of approximately three million mothers who were, or would
have been, in AFDC (see Burtless, 1998). Pessimism about this challenge appears well founded, on the
available evidence about the earnings capacities of these women.3 Achieving self-support by other

2
The reference to recent labor market developments is to the stagnation and fall of wage rates during the last 20 or soyears, a topic that will be discussed below. See also Burtless (1998).
4As of October 1998 there were no systematic research studies that show how welfare families that haveexited the rolls, either voluntarily or involuntarily, have fared. For example, a New York Times article reports, basedon admittedly spotty evidence, that “of the legions of people who came off the welfare rolls in New York City fromJuly 1996 through March 1997, only 29 percent found full-time or part-time jobs in the first several months afterthey were no longer on public assistance” (Hernandez, 1998). During the period from July 1996 through March1997, New York was operating a “work, not welfare” program that is similar to the state welfare programs under thenew federal welfare law. Also, in a four-part series on New York City’s workfare program (“by far the largestworkfare program in the nation”), the New York Times reports “scant evidence that workfare has accomplished oneof its central goals—moving a significant number of people from welfare to full-time work.” Those quotations arefrom the first in this series of four articles (Finder, 1998, p. 1).
methods, such as doubling up in housing or marrying to form a nonpoor family, may offer an alternative
path out of poverty for some of these single-parent families. Perhaps a combination of employment and
these domestic arrangements will become frequent. In truth, there is great uncertainty about how these
families will cope with the new system.4
This paper examines the historical and current economic setting of the new welfare regime,
concentrating on the relation between the economy’s macroeconomic performance and the incidence of
poverty. Macroeconomic performance refers to such indicators as gross domestic product (GDP), per
capita GDP, median family income, median wages, the distribution of incomes and wages, and
employment and unemployment statistics. The incidence of poverty, also called the poverty rate, is
defined as the proportion of families that are poor by official measures of family incomes for families of
varying size.
Of course, many forces other than the state of the economy will determine how this new way of
dealing with the poverty problem fares. Attitudes of the poor toward employment and toward their family
arrangements may change. Private philanthropy may play a larger, or perhaps just a different, role. Ways
may be found to improve the system of child support from absent fathers. New institutions at the local
level, such as public employment, may arise to change the old relationships between macroeconomic
performance and the poverty rate. States may offer permanent programs of subsidized health insurance

3
5The poverty statistics are from Census, P60-201, 1998, pp. C9–C13. The comparison between the numberof female-headed families with dependent children and the number of AFDC families is from the Green Book(1993, p. 685), which reports that between 1970 and 1992, the ratio of poor female-headed families with dependentchildren to the monthly average AFDC caseload of families ranged from a low of .64 in 1973 to a high of .88 in1970 and 1988. The AFDC family caseload includes some families with two parents and foster parents, but thesegroups are too few to explain the excess of AFDC families relative to poor female-headed families. The percentageof two-parent AFDC families ranged from 4 percent in 1970 to 7 percent in 1992. The maximum percentage offoster-care families among AFDC families is an estimated 2.4, attained in 1993 (ibid., p. 880). A reasonableinterpretation of these and related data is that almost all poor female-headed families with dependent childrenreceived AFDC, but that a range of 10–30 percent of AFDC families between 1970 and 1992 were not poor in theyear they received AFDC. The fact that some AFDC families completed a spell “on welfare” of less than a yearprobably explains why some of these families were not poor in that year. In one study, 29 percent of AFDC spellswere less than one year, averaging 5.3 months (ibid., p. 716).
and child care for the working poor—with emphasis on the term “permanent,” given that many states
may offer such subsidies only during a transition period from welfare to self-support. Federal government
expenditures on the continuing Food Stamp program will expand if the incomes of the welfare (or ex-
welfare) families decline. But even with these types of adaptations, few will doubt that the success or
failure of the new welfare reforms depends in large part on the labor market.
The plan of this paper is guided by Figure 1, which emphasizes the importance of labor earnings
in determining poverty. Another important point, implicit in Figure 1, is that we need to understand how
the economy affects family poverty generally to understand its impact on single-parent families and the
ex-AFDC families. From 1959, when the official time-series of poverty began, to 1971, more than half of
poor families with dependent children were married-couple families, but by 1997 the proportion had
declined to 32 percent. Interestingly, poor female-headed families with dependent children have been
outnumbered by AFDC families.5
Section II advances and quantifies the argument that rising real wages were the main reason that
poverty was reduced from 1900 (and earlier) up to the 1970s. Also discussed in this section are the roles
of the rise in women’s employment and the decline in fertility in reducing poverty.
Section III discusses recent problems in the labor market that have made poverty reduction more
difficult—most important, the 23-year period of almost zero growth in average wages from 1973 to

Figure 1. Guide to the Main Points of the Paper
Chart 1. Proximate determinants of poverty in families with dependent childrenAll determinants may be viewed as primarily definitional. Emphasized linkages are solid lines andunemphasized linkages are dotted lines. Other possible linkages among the variables below, includingmany mutually causal linkages, were omitted for simplicity.
Chart 2. Selected earlier-stage determinants of key variables: wage rates and labor earnings
Chart 3. Selected auxiliary relationsA. Microeconomic
1. Demographic: marriage and fertility Û wage rates, especially women’s
2. Employment rates of women � women’s market (exogenous) wage rates
3. Transfer payments � government policy, which is itself affected by marketwide levels ofwages and incomes, plus intrafamily transfer payments (e.g., child support)
B. Macroeconomic
1. Aggregate (average) levels of wages and unemployment rates � structural causes ofproductivity and macroeconomic fiscal and monetary policies
2. Distribution of family incomes and personal wages � all of the above

5
6In constant 1996 dollars, the male and female median earnings for full-time, year-round workers were,respectively, $37,159 and $21,045 in 1973; $33,538 and $24,935 in 1996 (Census, P60-184, 1993, p. B-35 and P60-197, 1997, pp. 30–33). Earnings for full-time, year-round workers can measure wages if we divide them by thenumber of hours worked per year, usually specified as 2,000 (40 hours per week and 50 weeks per year). Section IIIoffers further discussion of trends in wages and incomes.
1996.6 Thus, wage growth, historically the dominant economic source for reducing poverty, seems stalled
at a time when it is intended to replace the safety net of government income-maintenance programs for
single-parent families with children. Currently, low unemployment and the crest of the business cycle
may be bringing optimism to both the old “war on poverty” and the new regime of welfare reform, but
the economic record over the last two decades has been unfavorable.
In Section IV, the economic record of the last 20 years, as measured by GDP and other
indicators, is examined to determine whether economic growth remains an effective force to reduce
poverty. Several scholars have expressed their doubts. In the words of one expert on poverty research,
“the historical relationship between macroeconomic growth and changes in poverty has fundamentally
deteriorated” (Blank, 1997, p. 29). The disturbing implication of this finding, if true, is that even if the
slow economic growth from 1973 to 1996 were reversed, little reduction in poverty can be expected. I
argue against this view in this last section.
II. THE LONG-RUN REDUCTION OF POVERTY IN THE UNITED STATES
Wage Growth
Rising wages and full employment, particularly the former, have been the dominant historical
forces that have reduced poverty in the United States. The current retrenchment of government
assistance, mainly aimed at families that are not headed by aged or disabled adults, may be viewed
simply as a return to reliance on these traditional labor-market sources. For both economic and political
analysis, it is important to recognize that these sources have been highly successful over the long run of

6
7Lebergott (1964, pp. 523–4) implies a 2.6 percent annual rate of growth in wage rates of “full-year”workers from 1900 to 1960. I calculate the average wage by dividing the 1900 average earnings by 3,000 hours andthe 1960 earnings by 2,000 hours. The hours figures are based on the approximations of 60-hour and 40-hour workweeks in 1900 and 1960, respectively, along with a constant 50-week year. The wage measure for full-time, year-round workers avoids the distortion that results when the proportion of part-time and/or part-year workers in thelabor force increases, as it has in recent decades. The 1960 median earnings of full-time, year-round workers(Census, P60-180, 1992, p. B-32) is .84 of Lebergott’s 1960 figure for average earnings. Conservatively, I use thesmaller Census figure for 1960 (divided by 2,000) and Lebergott’s 1900 annual earnings figure (divided by 3,000)to calculate a 2.3 percent annual growth rate in wages over this 60-year period.
100 (or more) years; successful, that is, in comparison with most other nations and previous human
history (Kuznets, 1971; Rosenberg and Birdzell, 1986). The argument and evidence for the centrality of
wage growth are given in this section.
Let us focus on long-run trends in order to abstract from periods of cyclical downturns, when
unemployment is important in determining labor earnings. Consider the period from 1860 to 1960, when
a family’s income was mainly determined by labor earnings. Exceptions were the rich, who constituted a
small proportion of the population occupying one end of the income spectrum, and another small
proportion of persons at the other end of the spectrum who were wards of orphanages, insane asylums,
and old folks’ homes. The income support from government or private charity received by these wards
never did and was never intended to lift them above poverty. The incomes of the vast majority of
families, therefore, were determined by wages or, in the case of self-employed farmers, returns to their
labor and land. Self-employed farmers became an increasingly small proportion of the labor force—only
9.7 percent by 1940 and 4.6 percent by 1960 (Lebergott, 1964, p. 511). (Farm workers who work for
wages are not included in these percentages.)
The increase in wages from 1900 to 1960, estimated by dividing average annual earnings in year-
round jobs by the estimated average annual hours of work, was 2.3 percent per year.7 In 1996 dollars,
full-time, year-round median earnings were approximately $23,000 in 1960 (Census, P60-180, 1992, p.
B-32; see reference list for explanation of these shortened forms), and $6,000 in 1900, estimating the

7
8The 1900 figure is a back-projection based on the trend line of wages (strictly speaking, a log-lineartrend), and it will differ from the actual earnings in 1900 depending on whether earnings in that year were above orbelow the trend line.
9Poverty statistics also apply to the household unit, which could consist of one person living alone or twoor more persons living together who are unrelated by blood, marriage, or adoption. This paper concentrates on thefamily unit, especially families with dependent children present.
10See Census, Historical Statistics, 1975, p. 133 for labor force participation rates of married women; pp.49 and 53 for fertility statistics; pp. 15 and 134 for statistics on child labor.
latter by a back-projection of the 2.3 percent growth factor.8 The latter figure would not be considered a
“living wage” today. Poverty, however, is a concept that applies to the family unit rather than to an
individual person or worker.9 Although the huge increase in the average annual earnings of a family’s
full-time, year-round worker in 1960 compared to 1900 implies a large decrease in family poverty,
quantifying this decrease is difficult.
Measuring family poverty rates requires information on family size and the income of all family
members. Unfortunately, the first national survey to obtain family income statistics was the 1940
decennial census. The following facts about families in 1900 compared to 1960 are, however, revealing.
In 1900 a larger proportion of families were two-parent families, but a far smaller proportion of mothers
worked in the market and fertility rates and family sizes were larger. Child labor was much more
extensive, but this made only modest contributions to family income, except on farms.10 Indeed, the use
of child labor, especially in urban settings, was an indicator of family poverty.
Per capita income, which requires only population and national income statistics, has been
estimated for as far back as 1840, and I will assume that its growth rate approximates the growth rate of
family income. Per capita income grew at an annual rate of 1.6 percent from 1840 to 1960 (Kuznets,
1971, p. 18), 1.9 percent from 1900 to 1960 (U.S. Department of Commerce, 1966, pp. 166–167), and 1.8
percent from 1920 to 1990 (Economic Report of the President, 1993, p. 74). The 1900–1960 figures
illustrate the lower growth rate for per capita income (1.9 percent) than for wages (2.3 percent). This
reflects mainly the long-run decline in a worker’s average hours worked per year, from roughly 3,000

8
hours (a 60-hour work week for 50 weeks) in 1900 to 2,000 hours in 1990 (Census, Historical Statistics,
1975, p. 168). Wages per hour had to rise at a faster rate than family income to achieve a specified
growth rate in income, given that almost all family income consists of labor earnings and that the total
hours of market work by the family declined (Cain, 1984). The growth in leisure implied by the decline
in time spent at work is itself important in measuring the improvement in the overall standard of living,
even though leisure consumption does not directly affect the current measure of poverty.
By assuming that the growth rate for family income is the same as that for per capita income, we
can estimate the family poverty rate for the earlier years mentioned above. For example, to compare 1920
with 1990, we can use the median family income of $42,440 in 1990 and calculate that $12,000 was the
back-projected median family income in 1920, based on the 1.8 percent growth rate. (All figures will be
expressed in 1996 dollars.) Since the poverty line in 1996 was roughly $16,000 for a family of four (and
$18,200 and $12,500 for families with five and three persons), well over 50 percent of families in 1920
would be classified as poor, using the current criterion.
Similar calculations (and estimation of the relation between the 50th, 75th, and 90th percentiles)
indicate that over 90 percent of American families would be classified as poor in 1840 and over 75
percent in 1900—perhaps bizarre statistics that show how the concept and measure of poverty have
changed over time to reflect some degree of relativity to prevailing income levels. When the current
definition of poverty was first applied in 1959, a rule of thumb was that the poverty level of income for a
family of four persons was equal to about half the median family income. Although this ratio declined to
.38 (= $16,000/$42,000) in 1996, these relative definitions of poverty would not produce the shockingly
large percentages of poor families just calculated for 1840, 1900, and 1920.
Comparisons of the poverty rate between 1960 and earlier years are especially interesting,
because only after 1960 did government transfer programs become an important factor in bolstering the
incomes of low-income families with dependent children. The family poverty rate in 1960 was 18 percent

9
11Tobin (1994, p. 148) suggests that two-thirds of Americans were poor by the current definition in the1930s. Lebergott (1964, p. 189) estimates that the average annual unemployment rate between 1930 and 1939 was18 percent, and it was 15 percent in 1940. His estimates for the average annual unemployment rates for the threedecades from 1900 to 1929 are 4, 5, and 5 percent, respectively. In the four years after World War II, from 1946through 1949, the average annual unemployment rate was 4 percent, and it was 5 percent from 1950 to 1959(USDL, Handbook, 1989, p. 129).
12From 1959 to 1997 the poverty rate for persons 65 and older decreased from 35.2 percent to 10.5 percent(Census, P60-201, 1998, p. C6). Government transfer payments, primarily Old Age, Survivors, and DisabilityInsurance and secondarily the means-tested Supplemental Security Income program, contributed mightily to thisachievement (Danziger and Weinberg, 1994). This record is all the more notable because life expectancy among theaged increased. A 65-year-old in 1960 could expect to live 14 more years; in 1991, 17 more years (Census, P23-190,p. 3-1, 1996).
overall and 20 percent for families with children under 18. In that year families with dependent children
were 60 percent of all families (Census, P60-189, 1995, p. B-22). Clearly, the decline in family poverty
to 18 percent in 1960 from those high levels in 1840, 1900, and 1920 is almost entirely attributable to the
rise in wage rates and reasonably steady employment, rather than to the increases in such other sources of
income as rents, dividends, interest, capital gains, and even income transfers. The reference to “steady
employment” calls attention to pervasive poverty between 1930 and 1940, when much of the extent of
poverty was attributable to high levels of unemployment instead of to low wages of those who worked.11
Since 1960, government transfer payments, both cash and in kind, have become an important
policy instrument in antipoverty programs. (Their role in reducing poverty among families with
dependent children is discussed in Section III.) These programs, in particular Social Security retirement
benefits, have been especially successful in reducing poverty among the aged and (to a lesser extent) the
disabled (Green Book, 1993, p. 71).12

10
13The use of the term fundamental cause is always sensitive to the problem at hand and subject to dispute.In this paper I refer to the rise in wages as “causal” in the following sense. The combination of capital accumulationand improvements in technology, health, and education are the predominant antecedent causes of the growth inwages and they are mainly exogenous with respect to increasing both the demand for labor and the quality of laborsupply. Education is probably the most endogenous of these forces with respect to the long-run rise in wages, butaggregative expenditures on education have increased in part as an effect of rising family incomes and of thetechnologically driven increased demand for higher labor skills. These arguments do not imply that wages at theaggregative level cannot be directly affected by explicit policies such as minimum wage laws, subsidies to educationand training, and expansionary monetary and fiscal policies in cyclical downturns. Again, the determination ofcausality depends on the problem at hand.
14Indeed, the apprehension of the current generation of younger workers regarding their expected lowreturns from Social Security retirement and health benefits stems from the stagnation of wages during the past 24years, along with the fact that when they reach retirement age this cohort will become a larger proportion in thepopulation, relative to the working-age population.
15Econometric evidence for the powerful role of rising wage rates as a cause of the increase in women’semployment has been abundant since the publication of Jacob Mincer’s classic article (1962). See Heckman andKillingsworth (1986) for a survey of research that supports Mincer’s basic points.
A strong case can be made that growth in wages is the fundamental cause13 for the generosity of
the Social Security program, which is financed by payroll taxes and operates as a pay-as-you-go system.
Without wage growth and, at least as important, the expectation of wage growth for succeeding
generations, I doubt if recent generations of workers would have been willing to transfer as much of their
earnings to the cohort of older retired and disabled persons. These intergenerational transfers permitted
the Social Security payments to far exceed the value of the original contributions of the recipient older
group.14 Wage growth and various tax subsidies have also been fundamental causes of the increases in
private pensions, payments from private insurance, and personal savings, which are other sources of the
rise in incomes of the aged and the disabled.
The Rise in Women’s Employment
In addition to the direct relation between a worker’s wage and the family income of the worker,
the marketwide increase in wages has reduced poverty indirectly by increasing women’s labor force
participation rate (LFPR).15 The positive effect on family income of the increase in employment by
women is unambiguous in two-parent families, where two adult earners are now the norm. For families

11
16The cohort of women born in 1895 to 1899, who reached the age of 30 between 1925 and 1929, onaverage had 2.7 children during their lifetime. This was substantially less than that for women born between1855–1859, 1860–1864, and 1865–1869, who reached age 30 between 1885 and 1899 and who had completedcohort fertility rates of 5.0, 4.7, and 3.9, respectively. Women born between 1900 and 1919, who became 30between 1930 and 1949 had on average from 2.4 to 2.7 children during their lifetimes. Women who reached age 30between 1955 and 1969—a period that reflected the post-war baby boom—had completed cohort fertility rates ofjust under 3.5 children. Fertility rates dropped sharply in the 1970s and after. (Sources: Census, HistoricalStatistics, 1975, p. 53; and recent issues of the annual Statistical Abstract.)
with dependent children in which the mother is family head, the combination of rising wages and
employment opportunities for women is, at a minimum, important in reducing poverty, and it is essential
in the common case where these families receive little or no alimony, child support, or other income from
non-labor sources. As noted earlier, women’s earnings in the labor market will be critical under the new
welfare regime. One uncertainty about the effect on poverty of the increased employment of women is
how this increase affects the rise in the proportion of single-parent families. This will be discussed
below.
Attributing the long-run rise in women’s employment mainly to the increase in wages can be
contested by the hypothesis that the decline in women’s fertility was the principal cause. Although
peripheral to this paper, these competing hypotheses were informally tested during the baby-boom period
after World War II. Women’s wages rose and so did their LFPR, even though birth rates increased
sharply. A related point is that although poverty is defined by family size as well as family income (as
shown in Figure 1), fertility declines have not been a major source of poverty reduction since the 1920s,
because low birth rates have prevailed during the last 70 years, excepting only the baby-boom period
after World War II from, say, 1947 to 1962.16 Indeed, this baby-boom experience serves to downgrade the
role of fertility in its effect on poverty, because the 45 percent rise in median family income between
1947 and 1962 (Census, P60-180, 1992, p. B-22), which was mainly due to higher wages, brought about
lower poverty rates despite the increase in average family size. Furthermore, the increase in family
poverty rates after 1974 occurred when birth rates among American women were at historic lows,

12
17This estimate is based on a 14 percent LFPR of all wives (husband present) in 1940 (Census, HistoricalStatistics, 1975, p. 133), along with an estimated lower LFPR in the depression year of 1935 and the fact that theLFPR of mothers is less than for all wives.
dropping below the replacement rate of 2.1 children ever born per woman from 1972 on (Statistical
Abstract, 1997, p. 77).
The decades-long increase in market work by women is, in fact, mainly by mothers in married-
couple families, which is why two-earner families have become the norm among husband-wife families.
(See Table 1.) In 1996, 70 percent of all families with dependent children were married-couple families.
Their poverty rate was 7.5 percent. In the 60 percent of these families where both husband and wife were
employed during the year the poverty rate was 2.6 percent—only 0.9 percent where both worked full-
time, year-round. The contrast with female-headed families with dependent children (24 percent of all
families with dependent children) is striking: 42 percent were poor, and in the 20 percent of these
families that had no workers the poverty rate was 89 percent. However, in 44 percent of these families
the mother worked full-time, year-round, and the poverty rate was only 10 percent (Census website,
1997, Table 17).
In 1935, when federal legislation established the AFDC program (then called Aid to Dependent
Children), less than 10 percent of mothers in husband-wife families were employed; perhaps 8 percent
were employed if a child in these families was under six years of age.17 Mothers who received AFDC
transfer payments were not required to seek or hold jobs. One reason was the scarcity of jobs during that
depression period. Another reason that was longer lasting was the traditional and approving view of a
mother’s stay-at-home work in child care. We may, therefore, better understand (without necessarily
approving) the 180-degree change in current welfare policy, by recognizing that, today, almost two-thirds
of mothers in married-couple families with children under six years of age are either employed or
actively looking for employment.

TABLE 1Labor Force Participation Ratesa of Women in Families
with and without Children under Age 18, by Marital Status (Selected Years)
Women with Children All Womenb Youngest, 6–17 Youngest, under Age 6 Married, Divorced, Married, Divorced, Married, Divorced,Husband Separated, Never Husband Separated, Never Husband Separated, Never
Year Present Widowed Married Present Widowed Marriedc Present Widowed Marriedc
1960d 30.5 40.0 44.1 39.0 65.9 NA 18.6 40.5 NA
1970 40.8 39.1 53.0 49.2 66.9 NA 30.3 52.2 NA
1980 50.1 44.0 61.5 61.7 74.6 67.6 45.0 60.3 44.1
1990 58.2 46.8 66.4 73.6 79.7 69.7 58.9 63.6 48.7
1996 61.1 48.2 65.2 76.7 80.6 71.8 62.7 69.2 55.1
Source: 1960, 1970, 1980, USDL, Handbook, pp. 235–237; 1990, 1996, Statistical Abstract, 1997, p. 404.
aEmployed + unemployed (actively seeking work) as a proportion of all women in the demographic category eligible to be in the labor force,which is the noninstitutionalized civilian population 16 years of age and over.
bNote that “all women” includes women over the age of 55, whose labor force participation rates are relatively low. The fact that women’s laborforce participation rates are often higher for those with young children present that those for “all women” is mainly attributable to the largerproportion of older women in the latter group. Widows also have relatively low labor force participation rates because they tend to be older.
cNever married with children are disproportionately represented in AFDC, where there are severe disincentives to employment.
dThe labor force statistics for 1960 include 14- to 15-year-old women, whereas in the other years the official definition of the labor force isrestricted to persons 16 years of age and older. The LFPR of 44.1 for never married-women in 1960 is especially biased down in comparison withthe figures for later years, because 14- to 15-year-olds are almost exclusively in this demographic category, and the labor force participation ratesof this age group were much lower than the average for all ages.

14
18The median incomes of husbands were approximately $17,000 in 1950 and $32,000 in 1990 (in 1996dollars). U.S. Bureau of the Census, 1950 Census of the Population, Population Report P-E No. 2A, “GeneralCharacteristics of Families,” pp. 49–50, and Census, P60-174, 1991, p. 124.
19In 1997 the median earnings of women were 74 percent of men’s earnings among full-time, year-roundworkers. However, 72 percent of male workers worked full-time, year-round, compared to 56 percent of femaleworkers. The median earnings of all female workers were 62 percent of the median for all male workers. Census,P60-200, 1998, pp. 38–40.
20The Green Book (1998, p. 408) gives the following illustration, using Pennsylvania as an example. Theannual dollar benefits in 1997 for an AFDC mother of two children with no other income is shown to be $7,798,which is the sum of the cash payments ($5,052) and food stamps ($2,746). If she were to earn $12,000 during theyear, her disposable family income would be $13,231, after allowing for earned income tax credits ($3,641),reductions in benefits, and payments of Social Security taxes ($912) and work expenses ($3,600)—primarily daycare expenses. Thus, her disposable income rises by only $5,433, implying an implicit “tax” on her $12,000 of
The LFPR of wives, husband present, with a youngest child under six years of age, has steadily
risen from 12 percent in 1950 to 63 percent in 1996 (USDL, Handbook, 1989, pp. 235–237; Statistical
Abstract, 1997, p. 404). This occurred despite the fact that average earnings of husbands nearly doubled
from 1950 to 1996, which implies that mothers in 1950 were less able to “afford” to stay at home than
mothers in the 1990s.18 An important reason for the low LFPR of wives in the earlier period, despite the
lower incomes of their husbands, is that market wages for women were so much lower then than now and
that the positive “wage effect” on the labor supply decision of wives dominates the negative “income
effect” (see footnote 15).
A mother in a single-parent family has, generally speaking, more difficulty holding a full-time
job than a mother in a married-couple family, assuming the numbers and ages of their children are the
same, because the married couple can share in the tasks of housework, child care, and market work. A
single mother is further constrained in attaining earnings above the poverty level because women’s wages
are, on average, about 70 percent of men’s wages, reflecting less employment experience, less
employment training or other market skills, and gender discrimination in the labor market.19 On top of all
this, AFDC mothers faced severe disincentives to work for pay, because their AFDC benefits were
drastically reduced as their earnings rose, perhaps leaving them worse off if they held a job, particularly
if the Medicaid benefits accompanying AFDC receipt are factored in.20 Supporters of the work

15
earnings of 55 percent. Because the family loses eligibility for Medicaid health insurance beyond a transitional one-year’s coverage after the family income exceeds $9,000 a year, the family may be worse off with the mother’searnings of $12,000 that with no earnings. The zero-earnings benefit level of $7,798 paid by Pennsylvania is similarto the median maximum benefit amount of $8,304 among all 50 states and the District of Columbia (p. 418).
21U.S. General Accounting Office (1995). This report also cited other studies which found that 38 percentof mothers on AFDC worked at some time during the year, but pointed out that these mothers may not have beenenrolled in AFDC all year.
requirement of the new welfare system, however, can point to the LFPR of mothers in single-parent
families, which tend to be higher than that of mothers in families with a husband present (see Table 1),
despite the fact that mothers in single-parent families receiving AFDC assistance have a very low
LFPR—only 6 percent in 1992, according to a report by the General Accounting Office.21
Two inferences from these statistics are warranted. First, the levels of the mothers’ LFPR in 1996
for all three marital classifications reinforce the apparent public approval of the new law’s requirement
that welfare mothers be employed in order to receive benefits within their five-year maximum period of
eligibility and to be self-supporting after that five-year period. Second, the slower increase since 1960 in
the LFPR of the two groups of father-absent families, with dependent children present, is often
interpreted as an effect of the rapid expansion of the old welfare system from the mid-1960s to 1980.
Charles Murray (1984) is a prominent proponent of this view.
Summary. Long-run trends in the employment of women and the gradual increase in women’s
wages relative to men’s wages (discussed below) are trends that are favorable to achieving the goal of
substituting “work for welfare” in the new welfare system. Unfortunately, there are several shorter-run
trends that are unfavorable to the ultimate goal of reducing poverty among families with dependent
children. For men, particularly unskilled male workers, wages have been stagnant or declining for over
20 years, and the better record of wages of women workers has amounted to a very small increase over
this period (see footnote 6). Also, the upward trend in the employment of mothers should be tempered by
the finding from economic research that employed mothers tend to be those who can earn relatively high
wages. Most welfare mothers appear to have low earnings capacities, based on their education, training,

16
and experience (Burtless, 1995). In 1996, only 21 percent of poor families with dependent children had a
worker with a full-time, year-round job, and only 12 percent among poor families with a female head
(Census, website, 1997, Table 17). Whether the labor market can overcome these various barriers to
reducing the poverty rate among the predominantly feminized poverty families is the major question
facing the new welfare regime.
III. THE DECLINE IN POVERTY FROM 1959 TO 1974 AND ITS RISE AND PERSISTENCESINCE 1974
The Roles of Government Expenditures and of the State of the Labor Marketin Reducing Poverty from 1959 to 1974
In 1965 the Office of Economic Opportunity was established by legislation to begin what was
widely called a “war on poverty.” Between 1965 and 1975 public means-tested transfer payments,
including in-kind assistance, increased threefold, from $42 billion (1997 dollars) to $133 billion.
Including the social insurance programs, dominated by Old Age and Survivors benefits, the increase is
from $145 billion to $424 billion (Burtless, 1994, p. 57). Family poverty rates declined from 13.9 percent
in 1965 to 8.8 percent in both 1973 and 1974 (see Table 2). Was the decline of 5.1 percentage points over
this eight-year period, an annual rate of decline of 5.6 percent, attributable to the large increase in social
and welfare expenditures?
Before reaching this conclusion, consider the fact that the family poverty rate declined by 4.6
percentage points (or 4.7 percent per year), from 18.5 in 1959 to 13.9 in 1965—a six-year period before
the Office of Economic Opportunity and the officially proclaimed war on poverty began. The annual rate
of poverty decline is higher for the period 1965–1973, but it is also true that the economy was more
prosperous and the labor market tighter in this period. The average annual unemployment rate from 1965
to 1973 was 4.1 percent, substantially lower than the average of 5.5 percent from 1959 to 1965
(Economic Report of the President, 1996, p. 316). Also, the annual growth rate in the median earnings of

TABLE 2Poverty Status of Families, Selected Statistics for Selected Years, 1959–1997
Poverty Rates (Percent) % of Poor Families with Female Head% of all Familieswith Dependent
Children that Havea Female Head
(7)YearAll Families
(1)
All Families withDependentChildren
(2)
Married Coupleswith Dependent
Children(3)
Female Head withDependentChildren
(4)All(5)
With DependentChildren
(6)
1959 18.5 20.3 (16.0)a 59.9 23.0 28.0 9.4
1965 13.9 15.6 (11.4)a 52.2 28.5 34.2 10.2
1970 10.1 11.6 (6.9)a 43.8 37.1 48.1 12.8
1973 8.8 11.4 (5.8)a 43.2 45.4 56.4 14.8
1974 8.8 12.1 6.0 (6.2)a 43.7 47.2 56.7 15.7
1980 10.3 14.7 7.7 42.9 47.8 56.0 19.2
1983 12.3 17.9 10.3 47.1 46.6 53.2 20.2
1990 10.7 16.4 7.8 44.5 53.1 60.4 22.3
1993 12.3 18.5 9.0 46.1 52.7 60.0 24.0
1996 11.0 16.5 7.5 41.9 54.1 61.2 24.1
1997 10.3 15.7 7.1 41.0 54.5 61.4 23.6
Source: U.S. Bureau of the Census, P60-201, 1998, pp. C9–C14.
aPoverty rate for married couples plus families with a male head (and no wife present). Male-head families were 1.4 percent of married-couple families in1959, 1.7 percent in 1970, 1.5 percent in 1973, and 2.1 percent in 1974.

18
male full-time, year-round workers was 2.0 percent from 1960 to 1965 and 3.0 percent from 1965 to
1973. For women, the corresponding growth rates were 2.0 percent from 1960 to 1965 and 2.3 percent
from 1965 to 1973, and, as noted above, the proportions of employed women and multiple-earner
families were higher in 1965–1973 (Census, P60-180, 1992, pp. B-32 to B-33; Economic Report of the
President, 1996, p. 321). Finally, median family income, the macroeconomic indicator that is most
closely linked to the poverty rate, grew at annual rates of 2.9 percent from 1959 to 1965 and 3.2 percent
from 1965 to 1973 (Census, P60-180, 1992, p. B-22). An important methodological point here (to be
discussed below) is that changes in family incomes, earnings, and unemployment rates of the poor have
little effect on the nationwide median values of these variables, because the poor constitute only the
lowest 9–19 percent of the population of families during 1959 to 1974.
Thus, both (1) government expenditures that provide cash payments, in-kind income, and
services to the poor, and (2) a prosperous economy that provides better earnings opportunities to all
families, including low-income families, are logical explanations for the reductions in the poverty rate
from the mid-1960s to the mid-1970s. The relative importance of the economy is supported by the fact,
noted earlier, that government transfer programs to aid the poor were relatively limited before 1960,
when wages rose and poverty fell over a period of decades. Indeed, those who emphasize the disincentive
to work from government transfer payments would predict that the poor would respond by working less
and earning less after the war on poverty began.
The Rise and Persistence of Poverty from 1973–1974 to 1997
During the period from 1973–1974 to 1997 the family poverty rate rose from 8.8 percent in
1973–1974 to a high of 12.3 percent in 1983 and 1993. It was 10.3 percent in 1997 (see Table 2). Thus,
the new regime of welfare reform begins at a time when the steady decline in poverty rates of the earlier
postwar years were reversed over the 23-year period following 1974. The increase in poverty was greater
for families with dependent children, rising from 11.4 percent in 1973 to 15.7 percent in 1997.

19
22For those who opposed the 1996 welfare reform law and the end of entitlement to income support, it mustseem a bitter irony that, although the stagnation in wages and earnings can explain much of the reason that povertystopped declining in recent years, the very persistence of poverty and the accompanying rise in welfare rolls led tothe political support for the legislative shift from welfare to workfare.
Associated with this was an increase in the proportion of children under 18 in poor families (not on
table), from 14.4 percent in 1973 to 19.9 percent in 1997. Note that the poverty rate for children was 27.3
percent in 1959. (See Census, P60-189, 1996, p. B-19; P60-201, 1998, p. C2.)
To explain the overall increase in poverty, especially among families with dependent children, let
us examine three major interrelated developments during the post-1973 period: (1) the decline in
government expenditures aimed at reducing poverty, (2) the slowdown in the economy, and (3) the
continued increase in the proportion of single-parent families. Keep in mind that these and other factors
that explain the increase in poverty had to offset two other ongoing trends, the rise in educational
attainment and the decline in fertility, which operated to decrease family poverty rates.
Government Expenditures to Reduce Poverty. Danziger and Weinberg (1994, p. 48) state that
“Between 1973 and 1979 social spending [government expenditures on low-income households]
continued to grow, but the economy slowed dramatically.... That the official poverty rate was virtually
constant while spending was rising, however, led to a major shift in public opinion [in opposition to these
programs].”22 Implicit in this quote is the importance of an overall prosperous economy in reducing
poverty. The explicit message that AFDC was losing its political support anticipates the soon-to-come
welfare reform law of 1996. Skepticism about the effectiveness of AFDC in reducing poverty, however,
was always present because of its undeniable disincentives to work and its alleged incentives to form and
maintain a single-parent family.
Again, a comparison with the experience of, and government programs for, the elderly is
informative. The poverty rate of the elderly declined despite a decline in employment that was also in
response to the disincentives of income maintenance programs for the elderly. The LFPR of men over the

20
23The cost of Medicaid is not added to the cash payments and the cash-equivalent value of food stampsbecause it is difficult to know what cash-equivalent value recipients give to Medicaid. Moreover, the cost of a givenservice from Medicaid rose more rapidly than did the Consumer Price Index. For example, the CPI of health carerose by 194 percent from 1980 to 1995, while the overall CPI rose by 85 percent (Statistical Abstract, 1996, p. 483).
age of 65 declined from 23 percent in 1973 to 17 percent in 1997; of women from 9.0 percent to 8.6
percent (USDL, Handbook, 1989, pp. 26–27; USDL Employment and Earnings Jan. 1998, p. 164). Over
the same period the inflation-adjusted value of their government transfer payments from Old Age,
Survivors, and Disability Insurance and (to a lesser extent) Supplemental Security Income rose sharply
and lifted a substantial proportion of the elderly above poverty. (See Danziger and Weinberg, 1994, for
figures up to 1990.) The decline in their poverty rates, rates which are based on money income, does not
reflect the largest increases in government expenditures on their behalf, which came in the in-kind forms
of Medicare and Medicaid.
In contrast, the real value of AFDC cash benefits has declined by 52 percent from 1972 to 1997.
The nationwide median of the maximum state benefits received by a mother with two children and no
earnings fell from $9,442 in 1972 to $4,524 in 1997 (in 1997 dollars). If we add the cash value of food
stamps, the decline was 30 percent, from $11,821 to $8,304 (1993 Green Book, p. 1240, and 1998 Green
Book, p. 418), but noncash benefits are not counted in the income figures that determine the official
poverty line.23 In 1997 the median maximum state benefit for a family of three was only 34 percent of the
poverty line. Adding food stamps increased the state median to 62 percent of the poverty line. Also,
legislative changes in the AFDC program in the early 1980s effectively cut some AFDC recipients from
the program by tightening eligibility standards.
Despite cuts in the cash value of AFDC benefits, the poverty rates of welfare mothers from 1975
to 1997 were not much affected, for the simple reason that by 1975 most families on AFDC were already
below the poverty line. For example, the poverty line in 1975 for a family of three was $4,293 (1975
dollars), while the AFDC maximum annual cash benefit for a three-person family ranged across states

21
24A qualification to this judgment is the following point. As noted earlier in footnote 5, some AFDCfamilies are in the program for less than one year, so these families could have fallen below the poverty line becausethe AFDC cuts reduced their combined income from AFDC and the income they received when they were not inAFDC for that year. It is noteworthy that the ratio of poor female-headed families to AFDC families rose from anaverage of .71 in 1970–1981 to .85 from 1982–1992—the latter period coming after or during the Reagan-Bushadministrations’ cuts in AFDC (Green Book, 1993, p. 685). Perhaps the lower proportion of poor female-headedfamilies in the pre-Reagan years reflected some of the part-year AFDC families whose higher AFDC paymentsraised their full-year’s income above the poverty line.
(excluding Alaska and Hawaii) from $576 a year in Mississippi to $4,152 in Connecticut. The median
state amount for a family of this size was $2,280, only 66 percent of the poverty line (Green Book, 1989,
pp. 546–547). In fact, some of the mothers in families who were cut from the program by eligibility
changes in the early 1980s or who left because of the reductions in cash payments appear to have secured
jobs or made alternative living arrangements that moved them above the poverty line, but this did not
happen often (Smith, 1997). Perhaps others who would have enrolled in AFDC were discouraged or
prevented from doing so, and some of these may have ended up slightly above the poverty line. In
summary, cuts in government expenditures on income maintenance programs, which mainly were cuts in
the cash payments to AFDC families, do not explain the rise in poverty rates in the post-1973 period.24
The next two explanations are more persuasive.
The Labor Market and the General Economy. After 1973, the indicators of family economic
well-being stopped improving, and poverty stopped declining. That much can be said without
controversy. Unemployment rates, after averaging 4.5 percent per year in the 1950s, 4.8 percent in 1960s,
and 5.4 percent from 1970 to 1974, rose to 7.0 percent in the period 1975–1979, 7.3 percent in
1980–1989, and 6.1 percent in 1990–1997 (USDL, Handbook, 1989, p. 129; Economic Report of the
President, 1998). Average earnings declined for full-time, year-round male workers from $37,902 (1997
dollars) in 1973 to $33,674 in 1997. Women’s full-time earnings increased from $21,466 in 1973 to
$24,973 in 1997. Because men are a larger fraction of full-time, year-round workers, the overall

22
25For the all-family group, the 38 year-to-year changes in median family incomes from 1959 to 1997include 31 changes that “agreed” with the theoretically expected opposite-sign change in the poverty rate, fourchanges that did not agree, and three changes that were neutral. There were only two changes in median familyincome of more than 1 percent (1978–1979, 1.3 percent, and 1995–1996, 1.2 percent) when the change in thepoverty rate had the “wrong” sign.
(weighted) average of this measure of earnings and wage rates declined from $32,922 in 1973 to $30,107
in 1997 (Census, P60-184, 1992, p. B-35 and P60-200, 1998, pp. 38–40).
Median family income is a broader measure of the state of the economy than earnings and, like
poverty, is based on the family as the unit of analysis. Median family income, in 1997 dollars, was the
same in 1973 ($40,979) as in the recession year of 1993 ($41,051), despite more multiple-earner families
in 1993 (Census, P60-200, 1998, p. B-8). The family poverty rate increased from 8.8 percent to 12.3
percent over that period. When median family income rose from the 1993 level to $44,568 in 1997 (an
8.6 percent increase), the family poverty rate declined to 10.3 percent, still above the 8.8 percent rate in
1973–1974. Clearly, the increases in poverty after 1974, when median family income slightly increased,
tells us that other factors beyond the stagnation of family incomes were affecting poverty. High
unemployment throughout much of the period between 1973 and 1997 is one factor that would have a
particularly harmful effect on the working poor. Before discussing unemployment and other factors, let
us view the graphs on the 1959–1997 time-series of median family income and poverty rates.
Figures 2, 3, and 4 show a strong year-to-year inverse relation between changes in median
income and the poverty rate for all families, female-headed families, and married-couple families.25 The
interpretation of this relation requires a brief comment on methodology. Three key measures of
macroeconomic performance that affect poverty—median family income, median wages, and the
unemployment rate—may all be viewed as exogenous (and causal) to the poverty rate. Because median
income and median earnings measure the 50th percentiles, they are barely affected by the values of
income and earnings for the poverty population, which makes up the lowest 8–12 percent of families (or
the lowest 11–15 percent of persons). Of course, to say that median earnings of full-time, year-round

0
5,000
10,000
15,000
20,000
25,000
30,000
35,000
40,000
45,000
50,000
59 60 61 62 63 64 65 66 67 68 69 70 71 72 73 74 75 76 77 78 79 80 81 82 83 84 85 86 87 88 89 90 91 92 93 94 95 96 970
5
10
15
20
25
30
35
40
45
50(1996$) % of Families
Median Family Income (Left Axis)
Poverty Rate, Female Headed Households (Right Axis)
Poverty Rate, All Families (Right Axis)
FIGURE 2Median Family Income and the Poverty Rate for All Families and for Female-Headed Families, 1959–1997
Source : U.S. Census Bureau, Current Population Reports P60-200 and P60-201, 1998.Note : The family rate for female-headed families is less than the poverty rate for female-headed families with dependent children that isshown in Table 2.

-20
-15
-10
-5
0
5
10
15
60 61 62 63 64 65 66 67 68 69 70 71 72 73 74 75 76 77 78 79 80 81 82 83 84 85 86 87 88 89 90 91 92 93 94 95 96 97
Annual Percent Change
Median Income
Poverty Rate, All Families
FIGURE 3Annual Percentage Change in Median Income and in Poverty Rate for All Families, 1960–1997
Source : U.S. Census Bureau, Current Population Reports P60-200 and P60-201, 1998.

-4
-3
-2
-1
0
1
2
3
4
5
74 75 76 77 78 79 80 81 82 83 84 85 86 87 88 89 90 91 92 93 94 95 96 97-0.8
-0.6
-0.4
-0.2
0
0.2
0.4
0.6
0.8
1Percent Change Percentage Points
Median Family Income (Left Axis)
Married Couple Poverty Rate (Right Axis)
FIGURE 4Annual Percentage Change in Median Family Income and the Change in the Married-Couple Poverty Rate, 1974–1997
Source : U.S. Census Bureau, Current Population Reports P60-200 and P60-201, 1998.

26
workers are exogenous to poverty does not imply that it would not be useful to know what caused median
earnings to change—to know, for example, that faulty monetary and fiscal policies caused median
earnings to fall. But it is also useful to be able to say that poverty rose because average wages fell, even if
we do not know what caused wages to fall. Think of how often debates about the role of family breakups
or about the disincentive effects of this or that government program arise when there is a jump in poverty
rates.
Between 1980 and 1994, median family incomes were roughly stationary, but family incomes
became more unequal, suggesting that rising inequality was a cause of the increase in the poverty rate.
Causality in this relationship is, however, ambiguous without more information. To illustrate, assume
poverty increased because more marriages broke up, depriving families with children of a full-time
earner. Assume further that the reason for the marital breakups was a societal change—most would say a
societal decline—in “traditional values.” Then, assuming the decline in values was not itself caused by
the widening of the income distribution, the proposition that increased inequality of family incomes
“explained” the rise in the poverty rate is not very useful. An alternative and equally valid hypothesis,
which might be called the “Quayle hypothesis,” is that the rise in poverty (via breakups) caused the rise
in income inequality.
The rise in the proportion of single-parent families (discussed below) is one reason family
incomes have become less equal. However, most economic research on the rise in income inequality
points to the increase in wage inequality, which was mainly a result of changes in the technology of
production that increased the demand for skilled workers relative to the demand for unskilled workers.
(See the discussion of this issue in Johnson, 1997, and the Economic Report of the President, 1997, pp.
163–188.) Evidence of increased inequality in wages is shown in Figure 5, which uses years of schooling
completed as a measure of skill in the labor market. Among full-time, year-round workers the average
earnings of workers with less than 12 years of schooling declined, and declined more than the average of
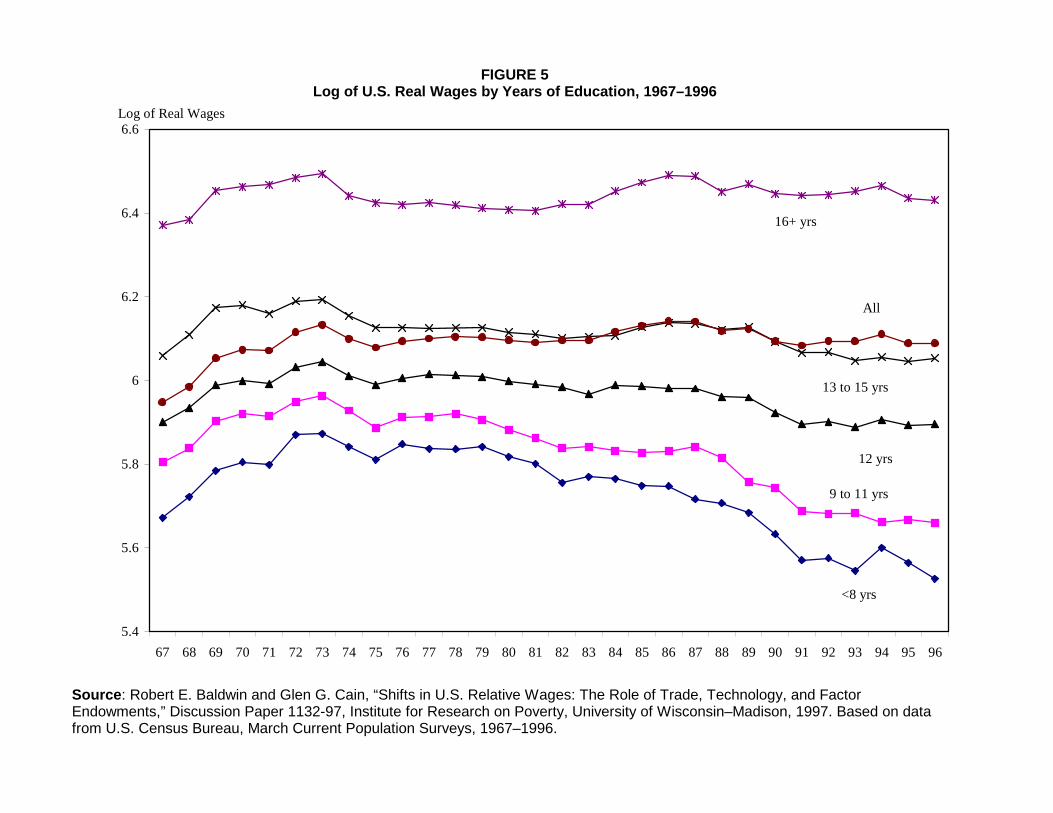
5.4
5.6
5.8
6
6.2
6.4
6.6
67 68 69 70 71 72 73 74 75 76 77 78 79 80 81 82 83 84 85 86 87 88 89 90 91 92 93 94 95 96
Log of Real Wages
16+ yrs
All
<8 yrs
12 yrs
9 to 11 yrs
13 to 15 yrs
FIGURE 5Log of U.S. Real Wages by Years of Education, 1967–1996
Source : Robert E. Baldwin and Glen G. Cain, “Shifts in U.S. Relative Wages: The Role of Trade, Technology, and FactorEndowments,” Discussion Paper 1132-97, Institute for Research on Poverty, University of Wisconsin–Madison, 1997. Based on datafrom U.S. Census Bureau, March Current Population Surveys, 1967–1996.

28
26Baldwin and Cain (1997) use a definition of full-time, year-round worker that was borrowed from Katzand Murphy (1992) and is slightly different from the official definition used by the Department of Labor (see Fig.5). The general pattern of the time series of wages for the different education groups shown in Figure 5 hasappeared in many research articles and books.
27Two authorities on the subject of child support report that “Only six of ten mothers potentially eligible forchild support actually have such an award. Of those who have an award, only half receive the full amount to whichthey are entitled, and over a quarter receive nothing.... Divorced mothers are those most likely to have anaward—eight of ten—whereas never-married mothers are those least likely—three in ten” (Garfinkel andMcLanahan, 1994, p. 208).
all workers from 1979 to 1996. During the same period the average earnings of workers with 12 years of
schooling declined, and declined relative to the average earnings of workers with 13 or more years of
schooling.26 The most serious economic failing affecting poverty in the post-1973 period was the decline
and stagnation of wages. The relative decline in the wages of low-skill workers, who are overrepresented
in low-income families, was a contributing, but secondary, factor.
The Increase in Single-Parent Families with Dependent Children. In 1996 the median income of
single-parent families with dependent children was 33 percent of the median income of two-parent
families (Census, website, 1997, Table 17), a slight decline from 35 percent in 1974 (Census, P60-180,
1992, p. B-23). The reasons for the low incomes of single-parent families are well known: low earnings,
low child support and alimony payments from the absent father,27 and low levels of income support from
government programs. As shown in Table 2, column 4, their family poverty rate was 41 percent in 1997,
slightly above the low of 40 percent in 1979 and far below the high of 60 percent in 1959, the first year in
the modern time series of poverty rates. Despite this long-term decline, we see in columns 5 and 6 the
basis for the much-discussed “feminization of poverty.” The percentage of poor families with a woman
as family head rose from 23.0 in 1959 to 45.4 in 1973 and to 54.5 in 1997. If dependent children were
present the percentages are 28.0 in 1959, 56.4 in 1973, and 61.4 in 1997.
As single-parent families become a larger proportion of the population of families, the overall
risk and incidence of family poverty increases, other things equal. Column 7 in Table 2 shows the
increased percentage of mother-headed families with dependent children among all families with

29
28The all-family poverty rate reached its low point of 8.8 percent in 1973 and 1974, although the povertyrate for families with dependent children was slightly higher in 1974 (12.1 percent) than in 1973 (11.4 percent). Thelowest poverty rate for families with dependent children was 10.8 percent in 1969 (this figure is not shown in Table2). The year 1974 is used in the composition analysis because it is near the “turning point” year, 1973, and it is thefirst year for which poverty rates for families headed by a male (with no wife present) are reported by the U.S.Bureau of the Census in its P60 series (P60-200, 1998, pp. C-9 to C-14). All calculations for this compositionanalysis are available from the author, including the calculations when the “other year” is used as the base year forfixing the demographic composition; for example, predicting the 1974 poverty rate if the 1997 headshipcomposition were used.
dependent children: 9.4 in 1959, 14.8 in 1973, and 23.6 in 1997. The increase in the percentage of all
families headed by women (not shown) is similar: 9.8 in 1959, 12.4 in 1973, and 19.3 in 1997 (Census,
P60-200, 1998, pp. C8–C9).
The following question can be answered by the familiar technique of composition analysis: What
would the family poverty rate have been in year t if the three family types—married-couple, female-
headed (no father present), and male-headed (no mother present)—had the same proportions in year t as
in year t-k, assuming the same poverty rate in year t of each family type and assuming that no other
changes occurred? The method is here applied to families with dependent children, because this group is
most affected by the new welfare reforms and because it is not affected by the government programs that
reduced poverty rates among the elderly. The calculations show that the 1997 poverty rate of 15.7 percent
for families with dependent children would be 12.6 percent if the three family types constituted the same
fractions of all families in 1997 as they did in 1974, when the poverty rate for all families with dependent
children was 12.1 percent.28 Taking the method at face value, the calculation implies that 86 percent
(= {15.7-12.6}/{15.7-12.1}) of the 1974–1997 increase from 12.1 to 15.7 percent is owing to the change
in the composition of family types.
Now consider the earlier period when poverty declined. Between 1959 and 1974, the proportion
of families with dependent children that were single-parent families rose from 10.7 percent to 17.4
percent. If the proportion of single-parent families in 1959 was as high as in 1974, but poverty rates for
each family type remained the same, then the 1959 poverty rate for all families would have been 22.9

30
percent instead of the actual rate of 20.3 percent. The actual 1959–1974 decline from 20.3 percent to 12.1
percent occurred despite the change in composition of family types over this period. This indicates how a
growing economy and the various positive effects of government antipoverty programs can offset the
poverty-increasing effects of higher proportions of single-parent families. This statement holds even if a
growing economy and the government programs in aid of the poor contributed to the increase in female-
headed families.
This type of composition analysis is only suggestive of the underlying causal factors, and there
are potential flaws in its use. Selecting just one type of change, here a particular demographic change,
can be arbitrary. (See Gottschalk and Danziger, 1993, for a discussion of this point.) Also, the
assumption that the selected demographic change would not have changed other forces affecting poverty
is questionable. For my purposes, however, the crucial methodological assumption is that the rise in
female headship is exogenous to the family poverty rate and to other variables that caused the post-1974
rise in the poverty rate.
A contrary example, in which the formation of single-parent families is an endogenous response
to other causes of poverty, is the hypothesis of Wilson (1987) that the loss of jobs to black males of
marriageable ages leads to poverty and, in turn, to marital breakups and out-of-wedlock births. Although
plausible, this hypothesis has been challenged (see Cherlin, 1992, pp. 102–111, and Jencks, 1992, pp.
120–142), and it has been applied only to blacks, who have faced the combined handicaps of living in
neighborhoods where job opportunities have declined and living in a segregated housing market that
inhibits their moving to sites where jobs are more abundant. Black families were 12 percent of all
families and 27 percent of poor families in 1997 (Census P60-201, 1998, pp. C-9 to C-12).
For the population as a whole, however, the case that the long-run increase in female-headed
families is causal to increases in the poverty rate is strong. The rates of marital breakups (divorces and
separations) and out-of-wedlock births (as a proportion of all births) have risen among all ethnic groups

31
29For the increase in divorces across social classes and in other industrialized nations, see Goode (1992,pp. 11–49). For the increase in children born out of wedlock across social classes and in other industrializednations, and the consequent increase in families with a never-married mother as the family head, see DHHS, Out-of-Wedlock Childbearing, 1995, pp. viii and 67–70. On the comparison between the periods of prosperity andstagnation: Table 2 shows that the annual rate of the increase in female-headed families with dependent children asa proportion of all families with dependent children was higher between 1959 and 1973, 3.3 percent, than between1973 and 1996, 2.1 percent.
and economic classes in society; they rose in the prosperous period from 1959 to 1973 and in the period
of economic stagnation from 1973 on; and they have risen in all industrialized nations.29 The cultural
forces that have led to a decline in traditional families are associated with changes in the status of women
in modern industrialized societies. Interestingly, two causes of these changes, the technological advances
in birth control and the technological changes in market production that have diminished the importance
of physical strength in the labor market, have each, by themselves, diminished poverty.
A controversial question among economists and demographers is the extent to which the rise in
female headship is attributable to the incentives to establish single-parent families embedded in the old
AFDC welfare program. Suffice it to say that even if AFDC had this effect, it need not invalidate the
proposition that the increase in female-headed families in AFDC is separate from (exogenous to) the
determination of median incomes, median wages, and national unemployment rates, which are
macroeconomic indicators of poverty-causing forces of central interest to this paper. AFDC mothers were
never a large part of the unemployed population, because most were classified as “not in the labor force”
rather than as employed or unemployed.
Consider, as a final point, the connections between the post-1973 increases in female headship,
family poverty rates, and income inequality. The lowest 20 percent of the family income distribution has
become increasingly made up of female-headed families. Because the (upper) income boundary of this
quintile has been above the poverty line for a family of five since 1960, almost all poor families are
contained in this quintile, even though many families in this quintile are not poor. (In 1997, 87 percent of
poor families with dependent children had a family size of five or fewer [P60-201, 1998, p. 1].) The

32
30All citations are from the decennial censuses of the U.S. Bureau of the Census: Census of the Population,1960, Families, PC(2)-4A, Table 14, p. 146; Census of the Population, 1970, Final Report PC(2)-4A, FamilyComposition, Table 14, p, 162; Census of the Population, 1980, Detailed Population Characteristics, Part 1, U.S.Summary, PC80-1-D1-A, Table 297, p. 475; Census of the Population, 1990, Detailed Population Characteristics,Part 1, U.S. Summary, CP-2-1, Table 37, p. 37. I found no statistics for the income distribution of families withdependent children in 1990. The figure in the text was estimated by using the 1980 ratio of the proportion of allfemale-headed families in the bottom quintile of the all-family income distribution to the proportion of female-headed families with dependent children in the bottom quintile of this income distribution, and then assumed thatthis ratio was the same in 1990.
31To establish the plausibility of this statement, consider that female-headed families with dependentchildren constituted 48.1 percent of poor families with dependent children in 1980; 56.0 percent in 1990 (column 6in Table 2). These percentages are similar to the proportion of female-headed families with dependent children inthe bottom quintiles in the distribution of family incomes in 1980 and 1990 (50 percent and 63 percent,respectively).
decennial censuses show that in 1959, 25 percent of families with dependent children in the lowest
quintile were mother-headed families, 41 percent in 1969, 50 percent in 1979, and 63 percent (estimated)
in 1989.30 Considering that the increase in income inequality occurred mainly in the 1980s, the increase
in the poverty rate for families with dependent children from 14.7 percent in 1980 to 16.4 percent in 1990
is better explained by the increase in single-parent families than by the increase in income inequality.31
In summary, if we combine the sluggish performance of the economy after 1973 with the
continued increase in female-headship among families, there need be no mystery about the overall rise
and persistence of poverty since 1973. The cuts in AFDC cash payments and the widening wage gap
among skill groups of workers also exacerbated the poverty problem, but these were minor factors.
IV. DOES THE STRONG NEGATIVE RELATION BETWEEN ECONOMIC GROWTH ANDPOVERTY RATES SHOWN FROM 1959 TO 1973 STILL EXIST?
Since 1993 a number of econometric studies have examined the relation between aggregative
economic growth and poverty, covering various periods between 1959 and 1993 (Blank and Blinder,
1986; Cutler and Katz, 1991; Blank, 1993; Blank and Card, 1993; Tobin, 1994; Powers, 1995; Blank,
1997). One finding that is common to these studies is that the effectiveness of macroeconomic growth in

33
reducing poverty has diminished in recent years. Blank expresses the implications of this finding as
follows: “The final conclusion ... is not a promising one for policy makers: The impact of economic
growth on poverty has substantially declined in the US during the past decade [i.e., the 1980s]. Even
seven years of sustained economic expansion did little to significantly lower the poverty rate or increase
incomes of low-income families” (1993, p. 51). Given that the new welfare regime calls for work, not
welfare, as the source of income for families with dependent children, the prospect for improving the
well-being of these families would appear to be pessimistic.
An investigation of this pessimistic finding requires a close examination of the econometric
analyses in the research cited. I intend to do this later. At this point, based on simple evidence and some
speculation (see below), I argue that economic growth remains effective as the principal, and a practical,
means to reduce poverty for families with able-bodied adults of working age. In Section III, the
1959–1973 period of secular growth and the post-1973 period of secular stagnation were shown to be
quite consistent with the historic negative relation between wage growth and family poverty that has
prevailed for over a century. I am skeptical that the evidence from a relatively few recent years (1983 to
1989, in several of the cited papers) should overturn the long-standing inverse relation between growth
and poverty.
Before offering evidence on this issue, let me suggest, and then discount, three plausible a priori
arguments why the historic relation between growth and poverty might have weakened in recent years.
1. Increases in female-headed families have led to a larger proportion of families without an
employed adult and, for these families, to minimal earnings gains from tighter labor markets and higher
wages. Yet in Figure 2 the cyclical fall and rise from 1978 to 1984 and the cyclical rise and fall from

34
32Two points about this responsiveness. First, although improvements in the labor market will have agreater income-raising effect on families with one or more earners, most married-couple families have incomes wellabove the poverty line, so their poverty rate will not be much affected by a tighter and more prosperous labormarket. Female-headed families, in contrast, tend to be clustered around the poverty line, which means that theincreases in earnings that do occur for these families are more likely to raise their family incomes above the povertylevel. The second point is that antipoverty effects of the macroeconomic forces on poverty rates of female-headedfamilies shown by Figure 2 are not inconsistent with the proposition made earlier, that the long-run upward trend indivorce, separation, and out-of-wedlock births is exogenous to (not caused by) median income and othermacroeconomic indicators. Consider first that most women who experience a family breakup or have out-of-wedlock children do not become poor. Consider also that the observed negative correlation between changes inmedian income and changes in the poverty rate of female-headed families may reflect only the short-run timing ofwhen these families fall into poverty. Keep in mind that the long-run trend in the two variables, median income andthe proportion of female-headed families, is positive.
1984 to 1993 give evidence that the poverty rate of female-head families remains responsive to cyclical
changes in wages, unemployment rates, and median family income.32
2. Immigration of low-wage workers, mainly Hispanic, (a) has greatly increased in the last 25
years, increasing somewhat the poverty population, and (b) will increase in response to tighter labor
markets and wage growth. Nevertheless, studies of the economic impact of immigration have not shown
that the sluggish U.S. economy after 1973 or the rise and persistence of poverty (except among
Hispanics) can be attributed to immigration (see National Research Council, 1997, especially pp. 141,
164, 190, 220–230).
3. Wage and income inequality could have increased to the extent that poverty would increase
even in a period of sustained and substantial economic growth. This has not occurred in the past. The
widening inequality in the 1980s occurred when wages were stagnant and unemployment was high. And,
as noted above, the time-series relation between poverty and income inequality is made complicated by
their joint causal linkage to the rise in female-headed families.
Evidence that supports the hypothesis that economic growth has maintained its relation to
poverty rates in recent years is shown in Figures 2 to 4. In Table 3, more support is provided by
regressions between changes in the family poverty rate (the dependent variable) and changes in median
family income, in the national unemployment rate, and in per capita GDP. In rows 1, 4, and 7, the income

TABLE 3Regression Estimates: Annual Change in the Family Poverty Rate (Dependent Variablea)
in Response to Changes in Aggregative Economic Variables, 1959–1997, 1959–1973, 1973–1997b
Coefficients of Independent Variables (standard errors in parentheses) Annual Percent Changes in
Years R2 Constant Median Family Incomec Unemployment Rated Per Capita GDPe
1) 1959–1997 [.76] .012 (.006)* -2.18 (.20)*2) [.80] .006 (.005) 1.71 (.25)* .08 (.03)*3) [.58] .028 (.009)* -2.12 (.30)*
4) 1959–1973 [.67] .015 (.016) -2.39 (.48)*5) [.70] .001 (.022) -1.82 (.74)* .09 (.09)6) [.60] .007 (.017) -2.10 (.49)*
7) 1973–1997 [.70] .012 (.006)* -2.06 (.27)*8) [.80] .009 (.005)* -1.21 (.32)* .12 (.03)*9) [.54] .034 (.009)* -1.81 (.33)*
aDependent variable: percent change in poverty rate (mean = -.016, 1959–1997).
bDurbin-Watson tests allow acceptance of null hypothesis of no serial correlation in all regressions.
cMean for 1959–1997 = .013.
dMean for 1959–1997 = -.010.
eMean for 1959–1997 = .020.
*Statistically significant by the standard of a t-statistic greater than 1.645.

36
33The term “strong” is justified on the following grounds. First, in rows 1, 4, and 7 the coefficient of thepercentage change in median family income from year t to t+1 shows that for a 1 percent increase in median familyincome the poverty rate decreases by about 2 percent. To illustrate: a 5 percent increase in median family income,from $40,000 to $42,000, would predict a 10 percent decline in the family poverty rate from, say, 15 percent to 13.5percent. Second, the coefficient of the median family income variable is statistically significant. Third, thecoefficient of median family income was about the same in both the prosperous period of 1959–1973 and thestagnant period from 1973 to 1997, which indicates a robustness and stability in the relation over this 39-yearperiod. In regressions not shown, the level of median family income was also strongly negatively related to the levelof the poverty rate for 1959–1997 and 1959–1973, but there was no relation between the two variables for1973–1997. From 1973 to 1997 there was no secular trend (upward or downward) in either median family incomeor the poverty rate, so only the changes in these variables, brought about mainly by business cycle, could show arelation.
coefficient of median family income is negative, “strong,”33 and, importantly, similar for the periods
when economic growth was strong, 1959–1973 (row 4), and when economic growth was weak,
1973–1997 (row 7). In the simple regressions in rows 3, 6, and 9, with the change in per capita GDP as
the measure of economic growth, the results are similar and almost as strong as they are with median
family income.
Rows 2, 5, and 8 in Table 3 show the relations between the change in the poverty rate and two
right-hand-side variables: the change in median family income and the change in the unemployment rate.
The change in median family income again has the expected sign, and its coefficient is statistically
significant and, although reduced in absolute value, has practical significance. The change in the
unemployment rate has the expected positive sign and is statistically significant for 1959–1997 and
1973–1997, but not for 1959–1973 (where there are only 11 degrees of freedom and where the variation
in the unemployment rate during this 14-year period is relatively small). The quantitative “effect” of the
change in unemployment on the change in poverty is small. For example, using the 1959–1997
regressions, an increase in the unemployment rate from 6.0 to 7.2 percent, a 20 percent increase, would
predict only a 1.6 percent increase in the poverty rate—from, say, 15.0 percent to 15.2 percent. Two
points are worth noting, however: (1) The positive effect of unemployment is somewhat larger and is
statistically significant in the period from 1973 to 1997, when growth was slow. (2) The unemployment

37
rate is a proxy for labor market conditions that are often affected by monetary and fiscal policies; thus,
changes in the unemployment rate can also be interpreted as a cause of changes in median incomes.
The constant term in the regressions in Table 3 is noteworthy because it represents an
underlying, although unexplained, trend in the poverty rate after conditioning on the included variables.
For example, taken at face value, the simple regression with median income shows a similar positive
trend in the poverty rate of somewhat more than 1 percent per year for each of the three time periods
(rows 1, 4, and 7). Including both median income and unemployment produces no trend (i.e., a zero
constant) for the prosperous period of 1959–1973, and a small positive trend for the 1959–1997 and
1973–1997 periods. It is, however, the similarity across all three periods in the response of the poverty
rate to the macroeconomic forces of median family income and the unemployment rate that I emphasize
in this paper.
The effect of unemployment on poverty is of special interest, because unemployment is a
variable that is relatively amenable to change by government policies. Also, it is likely that those in the
low-income population who are in the labor force would be sensitive to the unemployment rate. This is
borne out in a report by the Bureau of Labor Statistics (Mellor, 1994). Mellor found that the poverty rate
for families of the working poor—defined as poor persons who were in the labor force for 27 weeks or
more—fell from 6.3 percent in 1987, when the unemployment rate was 6.2 percent, to 6.1 percent in
1989, when the unemployment rate was 5.3 percent. The poverty rate of the working-poor families then
increased to 7.3 percent in 1992, when the unemployment rate had increased to its 8-year high of 7.4
percent. Mellor states:
The movements [of the poverty rates of the working poor and their families] ... havegenerally followed the changes in the overall economy and reflected even more closelythe changes in the conditions of the labor market. Although the economic recession,which started in mid-1990 officially ended in March 1991, the job market itself wasmuch slower to recover (p. 1).

38
34A New York Times report in July 1998 on the declines in welfare rolls in 14 states and New York City,which together contain 70 percent of the nation’s former AFDC population, cites statistics that suggest an overalldecline in the AFDC caseload of at least 30 percent (De Parle, 1998, p. 1).
A lesson from Mellor’s analysis is that different macroeconomic indicators of the state of the economy
give somewhat different measures of boom or bust, and he emphasizes the importance of the
unemployment rate in tracking changes in poverty rates. In summary, the research that concludes that
economic growth has lost much of its force in reducing poverty may need revision.
Conclusion and Summary. This paper began by describing the new welfare reforms as a change
from the entitlement of cash payments for AFDC families to an end to those entitlements and a
requirement that welfare mothers become self-supporting. (The term “welfare mothers” here includes
former AFDC mothers and those who would have entered the AFDC system had the system continued.)
The new reforms essentially require that most welfare mothers obtain market employment to support
their families. One measure of the success of the new reforms is the amount and speed of the decline in
welfare rolls. By this measure the new reforms have demonstrated considerable success. Welfare rolls
have declined sharply—perhaps by 30 percent or more—in their first year (or years) of operation.34
(Some states had begun their reforms one or several years before 1997, the first year of administering the
Personal Responsibility and Work Opportunity Reconciliation Act.) A more complete measure is the
extent to which the families of welfare mothers rise above the poverty level or improve their standard of
living. Information on this issue will be difficult to obtain, and we probably won’t know “the answer” for
several years.
Sections II and III mainly dealt with the importance of rising wages in reducing poverty. If full-
time, year-round earnings had increased by 1 percent per year from 1973 to 1996—about half the historic
rate of increase in wages—then median full-time, year-round earnings for men would have increased to
$41,200 in 1997, which is 22 percent higher than the actual median, $33,674, of that year. Women’s
median earnings did increase over this period, but only by 0.5 percent. Another policy goal for the labor

39
market is maintaining full employment, and while it is difficult to specify full employment with a number
that economists can agree upon, the 6.8 percent average annual unemployment rate from 1973 to 1997 is
surely well above the full employment level.
Still another way to lower the poverty rate is to return to the proportions of two-parent families
that existed in 1960 and earlier, but this strategy raises two questions that social scientists are unable to
answer. One is whether the broad social and cultural forces that have made marriages less stable (or less
likely to occur) can be reversed. A second is whether higher wages for women—so important in reducing
poverty among female-headed families—would deter marriage and encourage divorce by increasing the
economic independence women achieve from higher wages and expanded employment opportunities.
Higher wages for men might have the opposite effects on marriage, but productivity and wage growth in
modern times stem from brain power, not physical strength, so wage growth would surely apply to both
sexes. Indeed, most economic studies have shown that the male-female wage gap has narrowed in the last
two decades.
My conclusions are the following. Wage growth is essential to reduce poverty among families
with dependent children, particularly among welfare mothers. The traditional source of achieving wage
growth and reducing poverty remains macroeconomic growth. I see no evidence that economic growth
has lost its power to reduce poverty, as some economists have recently claimed. In the near future most
welfare mothers will remain poor under the new welfare system, but wage growth will, at least, raise
their living standards.


41
References
Note: The following short forms of references are used in the text for convenience:
Example of the P60 citations:Census, P60-198, 1997, for U.S. Bureau of the Census, Current Population Reports, P60-198, “Poverty
in the United States, 1996,” 1997, Washington, D.C.: U.S. Government Printing Office (andsimilarly for other P60s).
Census, P23-190, 1996, for U.S. Bureau of the Census, Current Population Reports, P23-190, “65+ inthe United States,” 1996, Washington, D.C.: U.S. Government Printing Office.
Census, Historical Statistics, 1975, for U.S. Bureau of the Census, Historical Statistics of the UnitedStates, Vol. 1, 1975, Washington, D.C.: U.S. Government Printing Office.
Census, website, 1997, Table 17 for http://ferret.bls.census.gov/macro/031998/pov/17-000.htm
DHHS, Out-of-Wedlock Childbearing, 1995, for U.S. Department of Health and Human Services, Reportto the Congress on Out-of-Wedlock Childbearing, 1995, Washington, D.C.: U.S. GovernmentPrinting Office.
Economic Report of the President, 1997, for U.S. Council of Economic Advisors, Economic Report ofthe President, 1997, Washington, D.C.: U.S. Government Printing Office.
Green Book, 1998, for U.S. Congress, Committee on Ways and Means, Background Material and Dataon Programs within the Jurisdiction of the Committee on Ways and Means, Washington, D.C.:U.S. Government Printing Office (and similarly for the 1993 and 1989 Green Book).
Statistical Abstract, 1997, for U.S. Bureau of the Census, Statistical Abstract of the United States, 1997,Washington, D.C., U.S. Government Printing Office.
USDL, Handbook, 1989, for U.S. Department of Labor, Handbook of Labor Statistics, 1989,Washington, D.C., U.S. Government Printing Office.

42
References, continued
Baldwin, Robert E., and Glen G. Cain. 1997. “Shifts in U.S. Relative Wages: The Role of Trade,Technology, and Factor Endowments.” Discussion Paper no. 1132-97, Institute for Research onPoverty, University of Wisconsin–Madison.
Blank, Rebecca M. 1993. “Why Were Poverty Rates So High in the 1980s?” In Poverty and Prosperity inthe USA in the Late Twentieth Century, ed. Dimitri B. Papadimitriou and Edward N. Wolff. NewYork: Macmillan.
Blank, Rebecca M. 1997. “Why Has Economic Growth Been Such an Ineffective Tool against Poverty inRecent Years?” In Poverty and Inequality: The Political Economics of Redistribution, ed. JonNeill. Kalamazoo, Mich: W. E. Upjohn Institute for Employment Research.
Blank, Rebecca M., and Alan Blinder. 1986. “Macroeconomics, Income Distribution, and Poverty.” InFighting Poverty: What Works and What Doesn’t, ed. Sheldon H. Danziger and Daniel H.Weinberg. Cambridge, Mass.: Harvard University Press.
Blank, Rebecca M., and David Card. 1993. “Poverty, Income Distribution, and Growth: Are They StillConnected?” Brookings Papers on Economic Activity 2: 285–339.
Burtless, Gary. 1994. “Public Spending on the Poor: Historical Trends and Economic Limits.” InConfronting Poverty: Prescriptions for Change, ed. Sheldon H. Danziger, Gary D. Sandefur, andDaniel H. Weinberg. Cambridge, Mass: Harvard University Press.
Burtless, Gary. 1995. “Employment Prospects of Welfare Recipients.” In The Work Alternative, ed.Demetra S. Nightingale and Robert Haveman. Washington, D.C.: Urban Institute Press.
Burtless, Gary. 1998. “Can the Labor Market Absorb Three Million Welfare Recipients?” Focus 19 (3,Summer/Fall): 1–6.
Cain, Glen G. 1984. “Lifetime Measures of Labor Supply of Men and Women.” Discussion Paper no.749-84, Institute for Research on Poverty, University of Wisconsin–Madison.
Cherlin, Andrew J. 1992. Marriage, Divorce, and Remarriage. Cambridge, Mass: Harvard UniversityPress.
Cutler, David M., and Lawrence F. Katz. 1991. “Macroeconomic Performance and the Disadvantaged.”Brookings Papers on Economic Activity, pp. 1–74.
Danziger, Sheldon H., and Daniel H. Weinberg. 1994. “The Historical Record: Trends in Family Income,Inequality, and Poverty.” In Confronting Poverty: Prescriptions for Change, ed. Sheldon H.Danziger, Gary D. Sandefur, and Daniel H. Weinberg. Cambridge, Mass.: Harvard UniversityPress.
De Parle, Jason. 1998. “Shrinking Welfare Rolls Leave Record High Share of Minorities.” New YorkTimes, July 27, p. 1.

43
Finder, Alan. 1998. “Evidence Is Scant that Workfare Leads to Full-Time Jobs.” New York Times, April12, p. 1.
Garfinkel, Irwin, and Sara McLanahan. 1994. “Single-Mother Families, Economic Security, andGovernment Policy.” In Confronting Poverty: Prescriptions for Change, ed. Sheldon H.Danziger, Gary D. Sandefur, and Daniel H. Weinberg. Cambridge, Mass.: Harvard UniversityPress.
Goode, William J. 1992. “World Changes in Divorce Patterns.” In Economic Consequences of Divorce,ed. Lenore J. Weitzman. Oxford: Clarendon Press.
Gottschalk, Peter, and Sheldon H. Danziger. 1993. “Family Structure, Family Size, and Family Income:Accounting for Changes in the Economic Well-Being of Children, 1968–1986.” In UnevenTides: Rising Inequality in America, ed. Sheldon H. Danziger and Peter Gottschalk. New York:Russell Sage Foundation.
Heckman, James J., and Mark Killingsworth. 1986. “Female Labor Supply: A Survey.” In Handbook ofLabor Economics, Vol. 1, ed. Orley Ashenfelter and Richard Layard. Amsterdam: North-HollandPress.
Hernandez, Raymond. 1998. “Most Dropped from Welfare Don’t Get Jobs.” New York Times, March 23,p. 1.
Jencks, Christopher. 1992. Rethinking Social Policy. Cambridge, Mass.: Harvard University Press.
Johnson, George. 1997. “Changes in Earnings Inequality: The Role of Demand Shifts.” Journal ofEconomic Perspectives 11: 41–54.
Katz, Lawrence F., and Kevin Murphy. 1992. “Changes in Relative Wages, 1963–1987: Supply andDemand Factors.” Quarterly Journal of Economics 107 (February): 36–78.
Kuznets, Simon. 1971. “Notes on the Pattern of U.S. Economic Growth.” In The Reinterpretation ofAmerican Economic History, ed. Robert W. Fogel and Stanley L. Engerman. New York: Harperand Row.
Lebergott, Stanley. 1964. Manpower in Economic Growth. New York: McGraw-Hill.
Mellor, Earl. 1994. “A Profile of the Working Poor, 1992.” Report 869, U.S. Department of Labor,Bureau of Labor Statistics, Washington, D.C.
Mincer, Jacob. 1962. “Labor Force Participation of Married Women.” In Aspects of Labor Economics: AConference of the Universities, National Bureau of Economic Research. Princeton, N.J.:Princeton University Press.
Murray, Charles. 1984. Losing Ground: American Social Policy, 1950–1960. New York: Basic Books.
National Research Council. 1997. The New Americans, ed. James P. Smith and Barry Edmonston.Washington, D.C.: National Academy Press.

44
Powers, Elizabeth T. 1995. “Growth and Poverty Revisited.” Economic Commentary, Federal ReserveBank of Cleveland.
Rosenberg, Nathan and L. E. Birdzell, Jr. 1986. How the West Grew Rich. New York: Basic Books.
Smith, Paul A. 1997. “The Effect of the 1981 Welfare Reforms on AFDC Participation and LaborSupply.” Discussion Paper no. 1117-97, Institute for Research on Poverty, University ofWisconsin–Madison.
Tobin, James. 1994. “Poverty in Relation to Macroeconomic Trends, Cycles, and Policies.” InConfronting Poverty: Prescriptions for Change, ed. Sheldon H. Danziger, Gary D. Sandefur, andDaniel H. Weinberg. Cambridge, Mass.: Harvard University Press.
U.S. Department of Commerce, Bureau of the Census. 1966. Long Term Economic Growth: 1880–1965.Washington, D.C.: U.S. Government Printing Office.
U.S. Department of Labor. 1998. Employment and Earnings, January.
U.S. General Accounting Office. 1995. “Low-Income Families: Comparison of Incomes of AFDC andWorking Poor Families.” Testimony before the U.S. Senate Committee on Government Affairs,January 25. Washington, D.C.: U.S. General Accounting Office.
Wilson, William Julius. 1987. The Truly Disadvantaged: The Inner City, the Underclass, and PublicPolicy. Chicago: University of Chicago Press.