INSTITUTE FOR PROSPECTIVE TECHNOLOGICAL STUDIES SEVILLE W
203
INSTITUTE FOR PROSPECTIVE TECHNOLOGICAL STUDIES SEVILLE W.T.C., Isla de la Cartuja, s/n, E-41092 Sevilla Climate Technology Strategy Within Competitive Energy Markets Energy Technology Strategy 1995-2030: Opportunities Arising from the Threat of Climate Change Edited by Antonio Soria (IPTS) Contributors N. Akutsu (International Institute for Applied System Analysis) M. Bess (Energy for Sustainable Development, ESD Ltd.) P. Criqui (Institut d’Economie et Politique Energetique – CNRS) D. Finon (Institut d’Economie et Politique Energetique – CNRS) S. Isoard (IPTS – Joint Research Centre) N. Kouvaritakis (ECOSIM Ltd.) Ph. Menanteau (Institut d’Economie et Politique Energetique – CNRS) S. Mima (Institut d’Economie et Politique Energetique – CNRS) L. Schrattenholzer (International Institute for Applied System Analysis) A. Soria (IPTS – Joint Research Centre) M. Whiteley (Energy for Sustainable Development, ESD Ltd.) EUR 18063 EN Work performed in partial fulfilment of JOULE contract n. JOS3-CT95-0008
Transcript of INSTITUTE FOR PROSPECTIVE TECHNOLOGICAL STUDIES SEVILLE W

INSTITUTE FOR PROSPECTIVE TECHNOLOGICAL STUDIESSEVILLEW.T.C., Isla de la Cartuja, s/n,E-41092 Sevilla
Climate Technology Strategy Within CompetitiveEnergy Markets
Energy Technology Strategy 1995-2030:Opportunities Arising from the Threat of Climate
Change
Edited by Antonio Soria (IPTS)
Contributors
N. Akutsu (International Institute for Applied System Analysis)M. Bess (Energy for Sustainable Development, ESD Ltd.)
P. Criqui (Institut d’Economie et Politique Energetique – CNRS)D. Finon (Institut d’Economie et Politique Energetique – CNRS)
S. Isoard (IPTS – Joint Research Centre) N. Kouvaritakis (ECOSIM Ltd.)
Ph. Menanteau (Institut d’Economie et Politique Energetique – CNRS)S. Mima (Institut d’Economie et Politique Energetique – CNRS)
L. Schrattenholzer (International Institute for Applied System Analysis)A. Soria (IPTS – Joint Research Centre)
M. Whiteley (Energy for Sustainable Development, ESD Ltd.)
EUR 18063 EN
Work performed in partial fulfilment of JOULE contract n. JOS3-CT95-0008

Energy Technology Strategy 1995-2030: Opportunities from the Global Warming Threat 2
TABLE OF CONTENTS
CLIMATE TECHNOLOGY STRATEGY WITHIN COMPETITIVE ENERGY MARKETS ........................ 1
CHAPTER 1: INTRODUCTION ............................................................................................................................ 4
1.1 GLOBAL WARMING: ANALYTICAL APPROACHES AND POLICIES .............................................................................. 51.2 TECHNOLOGY CHANGES: A FOCUS IN POWER PRODUCTION SCHEMES .................................................................... 7
CHAPTER 2: ENERGY SYSTEMS: A GLOBAL VIEW..................................................................................... 9
2.1 THE EU CARBON EMISSIONS WITHIN THE OVERALL GREENHOUSE GAME............................................................... 92.1.1 Trends in carbon emissions...........................................................................................................................112.1.2 Trends in carbon intensity.............................................................................................................................132.1.3 Technology and policy responses..................................................................................................................15
2.2 A PROJECTION FOR WORLD ENERGY PATTERNS.....................................................................................................172.2.1 Lessons from world energy outlooks .............................................................................................................172.2.2 WE-2030 exogenous hypotheses: population and GDP growth in 11 world regions ....................................192.2.3 An outlook on world primary energy consumption .......................................................................................252.2.4 A check of final energy demand profiles: the energy service approach ........................................................30
2.3 CHANGES IN THE EU ELECTRICITY MARKETS: THE MOVING TOWARDS LIBERALIZATION......................................352.3.1 Possible industry structures ..........................................................................................................................362.3.2 Contracts and prices .....................................................................................................................................382.3.3 A changing role for the regulator .................................................................................................................402.3.4 The new technology mix................................................................................................................................412.3.5 Managing the grid.........................................................................................................................................41
2.4 FUTURE ENERGY TECHNOLOGY MARKETS AND EU COMPETITIVENESS.................................................................42
CHAPTER 3: CARBON REMOVAL, FUEL CYCLE SHIFT AND EFFICIENCY MEASURES: ASECTORAL VIEW..................................................................................................................................................45
3.1 CARBON REMOVAL AND SEQUESTRATION ............................................................................................................463.1.1 Separation and Recovery Processes .............................................................................................................473.1.2 CO2 Disposal and Storage Processes............................................................................................................503.1.3 Costs and Potentials of Carbon Sequestration, Removal, and Storage .........................................................53
3.2 OTHER REDUCTION OPTIONS ................................................................................................................................553.2.1 Demand-Side Measures ................................................................................................................................563.2.2 Dematerialization and Recycling..................................................................................................................563.2.3 Efficiency Improvements and Technological Change ...................................................................................563.2.4 Fuel-Mix Changes.........................................................................................................................................583.2.5 Removal and Sequestration...........................................................................................................................603.2.6 Energy conversion efficiency ........................................................................................................................623.2.7 Fuel-Mix Changes.........................................................................................................................................65
3.3 THE INDUSTRIAL SECTOR ............................................................................................................................... ......673.3.1 Dematerialization ........................................................................................................ .................................673.3.2 Energy Efficiency Improvement and Process Changes .................................................................................683.3.3 Fuel-Mix Changes.........................................................................................................................................753.3.4 Combined Measures in the Steel Industry .....................................................................................................75
3.4 THE TRANSPORTATION SECTOR............................................................................................................................763.4.1 Efficiency Improvements.................................................................................................. .............................763.4.2 Demand-Side Measures ................................................................................................................................773.4.3 Fuel switching........................................................................................................... ....................................78
3.5 THE RESIDENTIAL & COMMERCIAL SECTOR.........................................................................................................813.5.1 Efficiency Improvements.................................................................................................. .............................81

Energy Technology Strategy 1995-2030: Opportunities from the Global Warming Threat 3
3.5.2 Fuel-Mix Changes.........................................................................................................................................84
CHAPTER 4: POWER GENERATION TECHNOLOGY CLUSTERS: PRESENT STATUS AND ITSPOTENTIAL ............................................................................................................................................................86
4.1 NUCLEAR INDUSTRY: A PARADIGM IN CRISIS ........................................................................................................864.2 CLEAN COAL TECHNOLOGIES ...............................................................................................................................914.3 FUEL CELLS FOR STATIONARY AND MOBILE APPLICATIONS.................................................................................1024.4 WIND POWER GENERATION .................................................................................................................................1094.5 PHOTOVOLTAIC ELECTRICITY .............................................................................................................................114
CHAPTER 5: TECHNOLOGY SCENARIOS TO 2030: BASELINE AND ALTERNATIVETECHNOLOGY STORIES...................................................................................................................................120
5.1 THE NATURE OF TECHNOLOGICAL PROGRESS AND BREAKTHROUGHS .................................................................1205.1.1 Energy technology trends in the longer time scale......................................................................................1205.1.2 Market penetration mechanisms and technological lock-in .................................................................. ......122
5.2 ENERGY TECHNOLOGY BASELINE PROJECTION....................................................................................................1255.3 A LOOK INTO THE FUTURE: WORLD ENERGY TECHNOLOGY SCENARIOS ..............................................................130
5.3.1 Centralized Electricity Production: The nuclear renaissance and incremental innovations.......................1315.3.2 The cleaner fossil-fuel-based baseload electricity production. ...................................................................1325.3.3 The Gas-Induced Decentralized Power Generation System........................................................................1335.3.4 The Energy Efficient Decentralised Power Generation System. .................................................................1355.3.5 A Future of Renewable Energy Technologies. ............................................................................................136
5.4 RUNNING THE SCENARIOS ...................................................................................................................................137
CHAPTER 6: TECHNOLOGY PERFORMANCE: TECHNOLOGICAL SCENARIOS AND MARKETPENETRATION ASSESSMENT..........................................................................................................................141
6.1 INTRODUCTION ...................................................................................................................................................1416.2 SAFIRE SCENARIO DESCRIPTIONS.....................................................................................................................1426.3 SAFIRE RESULTS ...............................................................................................................................................142
6.3.1 Scenario Results..........................................................................................................................................1426.3.2 Summary of Market Penetration of renewable energy Technologies ..........................................................1506.3.3 Comparative Analysis of Climate Mitigating Technologies ........................................................................151
6.4 CONCLUSIONS .....................................................................................................................................................162
CHAPTER 7: BASELINE AND ALTERNATIVE TECHNOLOGY SCENARIOS TO 2030: THE EFFECTONTO THE WORLD’S ENERGY SYSTEM......................................................................................................163
7.1 THE NUCLEAR SCENARIO ...................................................................................................................................1717.2 THE CLEAN COAL SCENARIO ..............................................................................................................................1737.3 THE GAS TECHNOLOGY SCENARIO .....................................................................................................................1767.4 THE FUEL CELL SCENARIO .................................................................................................................................1817.5 THE RENEWABLE ENERGY TECHNOLOGY SCENARIO..........................................................................................1837.6 CONCLUSION.......................................................................................................................................................186
CHAPTER 8: IMPLICATIONS FOR THE EU ENERGY R&D STRATEGY AND OTHER POLICIES...188
8.1 R&D PORTFOLIO, TECHNOLOGICAL PROGRESS AND MARKET STRUCTURE .......................................................1898.2 SHORT-TERM ISSUES: IMPROVEMENTS TO A CARBON-DOMINATED PANORAMA ..................................................1908.3 LONG-TERM OBJECTIVES: MANAGING THE BACKSTOP TECHNOLOGIES ...............................................................192

Energy Technology Strategy 1995-2030: Opportunities from the Global Warming Threat 4
Chapter 1: Introductionby A. Soria, IPTS
The basic issue to be analyzed in this volume concerns the trends that may be identified withinthe energy technology field. Our scope here is first to determine up to what extend cantechnology contribute to a possible structural change within energy markets leading to a lesscarbon-intensive exploitation system, and second to determine what are the possiblemechanisms through which these changes may take place, and what are the conditions that mayfacilitate this transition. Ultimately, the key question to answer is what will be the energytechnologies that are likely to become crucial if energy planners consider with growing attentionthe necessity of limiting (with different degrees of intensity) the carbon emissions to theatmosphere. The identification of these technologies is, however, not the only task to do. Indeed,these technologies may be out of the market today, and could well be faced to enormousdifficulties to become operative within a competitive energy market unless some measuresaiming at facilitating its implementation are taken. These measures may be viewed as anecessary effort to conduct the status of the world energy system from a non-sustainablesituation, in which the free-riding behavior of some agents, the opacity of the market signals andthe induced barriers to technology renewal towards a more efficient and reliable system, wherecosts and benefits are granted to the pertinent agents and the inefficiencies are charged withequity, so as to produce a combination of positive incentives. The passage from the presentscheme to this improved situation is not automatic, and a sort of potential barrier has to beovercome. The task is to provide to policy makers an appropriate strategy so as this obstacle isovercome, ensuring a smooth and reliable transition to a environmental (climatic) safe energyexploitation schemes.
An outline of the remaining of the volume follows.
Section 1.1 recalls the basic analytical approaches and possible policy frameworks that havebeen used to assess the energy-environmental-economy problems, and, in particular, the globalwarming issue. Rather than focusing on a similar basis at all of them, it has been perceived thatthere are sectors (and, associated to them, the corresponding technologies) that are actuallyacting as catalyzers of the technology innovation process. The power generation sector seems tobe the big player within the overall picture. Arguments to support this hypothesis are given insection 1.2.
A general view onto the evolution of the energy system at a global scale is included in Chapter2. Trends on carbon emissions, both in absolute and per capita terms are included to serve as aframing discussion for the baseline world energy projection obtained with POLES. Thepeculiarities of the EU and other OECD countries are also discussed, with particular emphasison the changing structure of the power sector (liberalisation and unbundling), underlying the

Energy Technology Strategy 1995-2030: Opportunities from the Global Warming Threat 5
role that technological diversity within the electricity market can play to foster the transitiontowards new exploitation schemes.
Chapter 3 presents a screening on the portfolio of mitigation measures from a sectoral end-usestandpoint. These include fuel mix shift, energy appliances improved efficiency as well ascarbon removal and sequestration. These technologies are summarized there by sake ofcompleteness, since, as it has been mentioned, focus will be given to power generationtechnologies. The emerging clusters of electricity generation technologies are described inChapter 4, including not only the present techno-economic status of the technologies, but alsothe prospects for each of them to the medium-long term (2000-2030). The possibletechnological scenarios foreseen, even if concerning the whole system, have been conceived andconstructed around different power generation paradigms: they are described in Chapter 5.
Based on the above-described energy technology scenarios, Chapter 6 shows the results obtainedconcerning the forecasts on market penetration on a technology-by-technology basis, as well asthe analysis of the environmental costs and benefits associated, as predicted by the technologydiffusion model SAFIRE.
The expected effects induced onto the global energy system by the technological hypothesisunderlying behind these technologically-driven scenarios are described in detail in Chapter 7.The analysis presented have been conducted using the POLES model, which allow to capturewith accuracy the regional specificities, as well as the integrated dynamics of the world marketsof primary energy carriers.
Finally, Chapter 8 summarizes the main conclusions and gives the guidelines for setting a cost-efficient energy technology R&D strategy.
1.1 Global warming: analytical approaches and policies
The global warming tread has become an important source of concern during the last decade.However, carbon emissions are not the first environmental problem that has worried energyplanners. Indeed, the problem of finding compatible solutions to fulfill the energy supplyrequirements and limiting sulfur and nitrogen oxide emissions was of extreme importanceduring the seventies and the eighties. The solution of the acid rain problem came basicallythrough technological solutions that were found after an aggressive environmental regulatoryframework. The global warming issue, being linked to carbon use in itself (although alsodepending on the carbon combustion modalities), seems a problem whose solution exceeds thestrict technological domain.
Two typical views have been adopted when studying the issue of energy systems and the relatedenvironmental effects:
• The bottom-up approach considers first the individual energy conversion techniques. Themodels based on this approach are therefore often referred to as ‘engineering’ models, andare frequently tools for optimal resource allocation, either for the long term (capacityplanning) as well as for the sort term (dispatching). Obviously, this approach is particularlysuited to simulate the behaviour of some centralized decision subsystem, typically the powersector. On the contrary, subsystems involving a multiplicity of agents (. i.e. the transportsector) are more difficult to analyze using this scheme.

Energy Technology Strategy 1995-2030: Opportunities from the Global Warming Threat 6
• The top-down approach uses macroeconomic models to investigate the mutual interactionbetween the economic variables of the aggregate under consideration and the carbonemission. Indeed, economic development and energy consumption are intimatelyintertwined. The causal relationships are far from being clearly understood: from one side,energy is demanded as a productive factor to generate welfare. On the other side, higherincome undoubtedly induces more consumption of energy-related services. The degree ofdetail of these models may vary depending on the scope of the analysis.
Putting forward the premise that the technology is not the unique aspect of the global warmingproblem, it should be stressed that it has an outstanding importance. It is also important toremark that the term technology has to be understood here on a broad basis. It includes not onlysupply-side technologies, but also demand-side technologies. Amongst the first, energytransformation (and, particularly, electric power generation) is a very important subset, since itaccounts for a remarkable share of the carbon emissions all around the world. From the demandside, energy efficient improvements in domestic and industrial appliances are also a fundamentalfactor to contribute to the greenhouse gas emissions reduction. Special mention should be madeto the transport sector, whose fast growing share of the global carbon emissions lies todayaround 22% (to be compared with the share of 18% corresponding to 1973).
The carbon emissions reduction strategy has to be based along four basic action lines:
• Changing the fossil share within the total primary energy production. This concerns mainlythe enhancement of the production of primary electricity via renewables (especiallyhydroelectric power) and nuclear. In the long run, syntethic fuels obtained from renewableresources could also play a role.
• Changing the fossil fuel mix towards a less carbon-intensive energy system. In principle, thisapplies to all the sectors concerned, although the power sector has shown much moreflexibility than the transport sector in modifying the primary input mix according to the pricesignals provided by the energy resources markets.
• Improving the energy conversion efficiency system as a whole in order to obtain more usefulfinal energy with the same amount of primary energy. Efficiency improvements concern theelectricity transformation system, electric power transmission, the refining industry, andother economic sectors. The universal trend for a more and more electrified world mayoffset the efficiency gains achieved by technological developments.
• Improving the GDP energy intensity, i.e. the final energy consumption required to produce aunit of output. The possibility to achieve this greatly depends not only on the degree ofdevelopment of the economy considered, but also on the structural characteristics of thesectors in which the economy is specialised. The progressive tertiarization of the worldeconomy may contribute to achieve this objective, although there exist several countrieswhose growth is still based on extremely intensive industrial sectors.

Energy Technology Strategy 1995-2030: Opportunities from the Global Warming Threat 7
1.2 Technology changes: a focus in power productionschemes
The technology issue is embedded in all these possible improvements to reduce carbonemissions. Concerning the first two points, the change of the fossil fuel mix or the fossil fuelshare towards a more carbon-saving situation can be possible only if the appropriate technologyis available and makes this shifting economically sensed, using given the primary energy carrierprices (present and expected). Energy conversion efficiency is an almost pure technologicalissue, although ‘external incentives’, such high primary energy prices work also favoringtechnological development. With respect to the fourth point, the overall GDP energy intensitydepends also on the technology, but it should be understood on a broader basis. Technologymeans there overall productive schemes, income-generation patterns and technological regimes,as clusters of technologies mutually connected.
The prospectives on the possible energy technology paths are fundamental in order to depictreliable multisectorial scenarios, which eventually could be used in the negotiating processesabout possible carbon emissions reduction. The actual energy technology trajectory is notindependent from what is happening in the overall economy. This expected feedback forces theconsideration of several possible technological trajectories, to which one could assign a certainprobability, depending on the future state of the world.
Energy technologies are crucial in incorporating energy to the productive process. Raw energycarriers have to be transformed into a form able to provide productive service. As a consequenceof the natural laws, there are clearly increasing marginal costs in the conversion of energyresources. In the same manner, the specific pollution (i.e. pollution per unit of useful or finalenergy use) and other external effects would also increase more than proportionally as thedepletion takes place.
Energy resource depletion would increase the overall energy intensity, since productiveprocesses always use the more accessible natural resources and the exploitation costs (in capital,labor and energy terms) increase as depletion proceeds, so the access to new fossil energyresources is also expected to exhibit increasing marginal costs. It is important to underline thatthis phenomenon takes place independently of the actual size of the resource reserves.Therefore, technology improvements are not unlimited, and they cannot avoid physicalexploitation limits or technical potential for each energy technology.
It may be concluded that, although it is clear that the global warming problem is a complexissue, and therefore requires an accurate description of the energy-economy-environmentinteractions, an adequate technology characterization is mandatory to describe and understandthe carbon-energy global system. In addition, technology prospects are fundamental since theymay provide the clues to the future characteristics of the backstop technological system. Thefeatures of this backstop energy structure are by no means predetermined: although we know apriori that only renewable energy technologies are sustainable in the long run, the precise futureexploitation schemes are still unknown. The path-dependency of the energy techno-economicsystem provides incentive for a further analyses in order to foster the dynamic tracking of thebest choice, minimizing the possibility of endeavouring suboptimal, non-reversible trajectories.

Energy Technology Strategy 1995-2030: Opportunities from the Global Warming Threat 8
Two main trends are detected in the world’s energy system today: increasing electrification ofstationary applications and increasing share of primary energy absorbed by the transportationsector. It generally acknowledged that the moving forces of the overall energy system (and, to alarge extent, of the global carbon emissions) are to be found within these two sectors. Anyserious attempt to assess the carbon mitigation possibilities in terms of costs has to incorporatethis statement as a framework consideration.
Amongst these two basic issues, major attention will be given in this study to the electric powerindustry. The reason for this is twofold: first, the technological diversity that is present withinthe electricity industry is by far much larger than the one corresponding to the transport sector:power generation technologies change faster and react to policy measures with a flexibilitywhich is not present within the transport sector. In addition, and perhaps connected to thepreceding remark, it is perceived that the structural changes within the power sector that arecurrently under way give the possibility to foster a more sustainable electrification pattern.Indeed, within the current exploitation schemes, electrification leaves more room for technologypolicy measures, whereas the transport sector has reached a deeper technological lock-in aroundthe standard explosion engine that makes it difficult to achieve significant advances vis-à-vis thecarbon emission issue from the technological point of view. Infrastructural changes, commandand control measures and deep social and individual behavioral changes would be required toachieve similar results in terms of carbon emissions abatement. This does not mean thattechnology has nothing to say with respect to transport-originated emissions, but rather thattechnology changes are not (today) a sufficient condition to achieve a more sustainabletransportation system, the bottleneck being placed around lifestyles and large infrastructures. Ina word, given the present trends, it is more likely than disruptive technology changes from thepower generation system would have an influence onto the transportation system than viceversa.This important question will be revisited in other parts of this volume.

Energy Technology Strategy 1995-2030: Opportunities from the Global Warming Threat 9
Chapter 2: Energy systems: a globalview
By P. Criqui, IEPE, A. Soria, IPTS and S. Isoard, IPTS
Energy is a key issue that is present in all the sectors of modern economies. Moreover, theavailability of cheap, abundant and safe energy sources is indeed a requisite for sustainedeconomic development in emerging economies. The ways in which it is consumed and used toproduce welfare is the matter of several disciplinary fields. Energy technologies are importantbecause energy crucial in the overall economic system, not only because of the scarcity of theresources (the world energy mix is based on non-renewable energy carriers), but also because ofthe environmental concerns. Indeed, environmental degradation is due, to a large extent, to theeffects of energy production, transformation and use.
The environmental aspects of energy consumption are becoming very important, but thevulnerability of the energy system to price shocks should not be forgotten: two out of the threelarge global economic recessions in the last fifty years were directly originated by a supplyshock in the energy sector.
Indeed, economic development and energy consumption are intimately intertwined. The causalrelationships between them are far from being clearly understood: on one side, energy isdemanded as a productive factor to generate welfare. On the other side, higher incomeundoubtedly induces more consumption of energy-related services.
The ultimate reason behind the massive increase of energy demand is not only the worldeconomic development (energy as productive factor) but also the demographic pressure thatpushes the demand of energy as a purely disembodied consumption good. In the OECDcountries, the average population annual growth rate in the period 1970-2010 is expected to be0.6%, whereas in developing countries, it will reach a 1.7% annual rate (2.1% on 1970-1992).Energy demand is driven in OECD countries mainly by the energy per capita increase, but indeveloping countries, both factors (per capita consumption and population growth) areimportant.
2.1 The EU carbon emissions within the overall greenhousegame
The environmental effects associated to the use of energy are undoubtedly an important drivingmechanism of the world energy system, as far as environmental concerns rapidly spread on thepublic opinion. Among the negative externalities associated to fossil fuels, CO2 emissions areprobably the most important one because of their global climate change implications. However,this threat is perceived with different degrees of concern by governments, decision-makers andgeneral public in different world zones. Amongst the developed nations, the European Union

Energy Technology Strategy 1995-2030: Opportunities from the Global Warming Threat 10
has taken the leading role in recognizing the problem as an important issue to be solved, and inproposing coordinated efforts to achieve a cost-efficient solution. The global warming menace isalso differently regarded from developing countries. Large, rapidly growing countries, suchChina, India and some other in the Asian continent give priority to economic development, oftenaccompanied by massive increase in energy consumption. On the contrary, OECD countriesexhibit energy intensities of the GDP lower than unity, and are expected to contribute relativelyless to the global carbon emission increase. Under the IEA business-as-usual assumption, globalannual emissions are expected to increase by 40% between 1992 and 2010, concentrating indeveloping countries, whose emissions will reach the OECD levels by 2010: electricity supplyin two major developing countries, China and India, is coal-based (73%), which is the morecarbon-intensive energy carrier. In Europe and North-America, the nuclear reduction will bepartially compensated by gas use, whereas Japan is expected to enlarge the coal share in itsprimary energy mix. Within the entire world, however, the energy demand from the transportsector is expanding at a rate higher than the one corresponding to the GDP. Since it is primarilybased in oil and oil-derived fuels, it appears to be an important source of emissions, with a goodpotential for limiting.
Since the environmentally relevant variable is the total accumulated CO2 in the atmosphere, aneventual stabilization of emissions would not solve, in the long run, the greenhouse gasemissions problem. Many other factors, such as the speed of diffusion of carbon dioxide ontothe ocean, and the rate of carbon fixation in the vegetal cover are controlling the dynamics of thewhole carbon cycle, imposing several time constants and determining the actual evolution of thecarbon concentration in the atmosphere. Limiting, and, ultimately stabilizing the carbonemissions is not a well-posed objective unless an agreement is made upon the level on whichthis stabilization should take place. The Intergovernmental Panel for Climate Change oftenrefers to the standard target of 550 parts per million in volume (ppmv), which corresponds totwice as much the concentration in preindustrial times. The carbon concentration stabilizationpath greatly depends on the dynamics made to limit the carbon emissions, which would beaffects by a continuous cost-benefit analysis. The Framework Convention puts forward thepremise that the policies and measures to deal with climate change should be cost-effective so asto ensure global benefits at the lowest possible cost. The uncertainties about the spread overtime of both cost of carbon mitigation and damages to the global economic system is an issue ofutmost importance. Indeed, the reduction pathway is as important as the concentrationstabilization level in determining the total cost of the environmental policy. There exists a lineof thought (Wigley et al 96, Manne & Richels 92) arguing that delaying massive mitigationactions by 10-25 years would induce practically the same atmospheric and climatic harm, butthe costs to stabilize the carbon concentration would be significantly lower (due to thepossibility of exhausting recently new installed capacity and the probable reduction of costs forcarbon substitutes in the meantime). Other analysts share the opinion that, on the contrary, thereis a lot of no-cost (or low-cost) measures that could be taken already now, allowing for a moreaggressive carbon mitigation policy without, yielding a faster carbon concentration stabilizationand at a lower level without important economic effort (Grubb 97).

Energy Technology Strategy 1995-2030: Opportunities from the Global Warming Threat 11
2.1.1 Trends in carbon emissions
While looking at the historical trends of CO2 emissions, it appears that large differences existamongst the main emitters. Looking first at the absolute value of emissions levels, the USA andthe EU appear to be the main polluters. Under starting from much modest levels, it is observedthat the increase rate of the carbon emissions by China and India will lead to these countries toemissions levels close to those of the USA and the EU within relatively few decades, since theyhave the highest annual growth rates (5.3% and 5.9% respectively). By comparing the emissionsannual growth rates on the 1973-1993 period on a country by country basis, with the central lineworldwide emissions growth rate of around 1.6%, the countries from the ASEAN group exhibitthe highest increase rate (6.5%). The OECD exhibits almost constant emissions, with an annualaverage growth rate around 0.5%. The EU-15 has even reduced slightly its level of emissionsabout 0.01% each year. More importantly, it shows that the EU has stopped since a long time toincrease its flow of CO2 emissions and this pattern may give more credibility to the propositionof the European Commission for the Kyoto negotiation table.
Worlwide CO2 Emissions
10000
100000
1000000
10000000
197 197 198 198 199 199
Years
WorldOECDEU-15ASEANChinaIndia
Figure 2-1Worldwide CO2 emissions
According to the more recent evaluations of 1997, the main CO2 emissions in the world aredistributed as follows:

Energy Technology Strategy 1995-2030: Opportunities from the Global Warming Threat 12
Country/Zone CO2 Emissions (%) World PopulationShare(%)
US 25% 4.7%
EU (East Germany included) 19.6% 9.0%
China 13.5% 21.5%
Former Soviet Union 10.2% 2.6%
Japan 5.6% 2.2%
India 3.6% 16.3%
United Kingdom 2.5% 1.0%
South Korea 2.2% 0.8%
Canada 2.1% 0.5%
Australia 1.3% 0.3%
Table 2-1: Per year CO2 Emissions.
Amongst the world-wide CO2 emissions from fossil fuel consumption, the 20 largest carbonemitting countries in 1991 contributed over 81% the total carbon emissions. The top threecountries, i.e. the U.S., the former USSR and China, were responsible for around 49% of theworld emissions. From 1950 to 1990, global per capita emissions of CO2 from fossil fuelsincreased by a factor of 1.8, while global population increased by a factor of 2.1. Therefore,annual CO2 emissions have increased by a factor of 3.7.
These trends may be even reinforced, if one takes into account the emissions growth of thedifferent geographical zones as well as the foreseen population increase in the next threedecades. The EU emissions has been growing from the 1970’s at a mild rate (from 1985 to1994, the CO2 emissions annual rate from fossil fuels has been of 1.15%). A global reduction ofthe emissions from 1991 in electricity and heat production, the domestic and commercial use aswell as in the industry took place. On the contrary, emerging economies and developing onesexhibit high growth rates. Therefore, taking into account the foreseen population growth in theserespective zones, it appears that the EU will count only for a small share of the total CO2emissions in the next decades. Indeed, while France, UK, U.S. and Canada decreasedrespectively their emissions per capita during the 1973-1994 period of 2%, 0.9%, 0.6% and0.5% on average each year, China, India, Ex-USSR and Japan raised on average their emissionsby 3.77%, 3.75%, 1.5% and 0.4%.
An important issue is the analysis of the trends of emissions per capita and per GDP in theOECD and developing countries. The analysis of these trends may provide a very interestinginsight and contribute to the assessment of the future global emissions of the EU and discuss theinstruments to reach the targets

Energy Technology Strategy 1995-2030: Opportunities from the Global Warming Threat 13
2.1.2 Trends in carbon intensity
Regarding the trends on emissions per capita, the emerging picture shows similar trends. Even ifsome developed countries exhibit high emissions rates per capita, the historical trends show ageneral stabilization in Europe of the emissions per capita and a catching-up of China and India.
CO2 Emissions Per Capita
0.1
1
10
100
1970 1975 1980 1985 1990 1995
Years
France
U.S
Japan
Canada
U.K
Ex-USSR
China
India
Figure 2-2: CO2 Emissions per capita.

Energy Technology Strategy 1995-2030: Opportunities from the Global Warming Threat 14
Source: Enerdata
Country Per-capita CO2 Emissions(metric tons)
USA 19.1
Canada 17.0
Australia 15.2
Former Soviet Union 14.1
Czech Republic 13.0
Poland 12.7
United Kingdom 9.8
Japan 8.8
Malaysia 3.7
China 2.3
Brazil 1.4
India 0.8
Table 2-2: Per capita CO2 emissions per country.
Considering these CO2 emissions data in relation with the GDP growth, a strong correlation isfound (not surprisingly). The developing countries, which exhibited two-digit growth rates inthe passed decade, have increasingly counted for a bigger share of total CO2 emissions, theeconomic growth having taken place without any concern of environmental protection ashappened earlier to the European countries. Indeed, in 1950, North America, Western Europeand Eastern Europe accounted for 89.2% of global CO2 emissions, Africa, Centrally PlannedAsia, Developing America, Far East and Oceania contributing for only 10.8%. Nowadays, thelatter regions contribute 40.5% of the CO2 emitted. In total, China has passed from the 10thrank in CO2 emissions in 1952 to the 3rd one in 1991, Japan from the 9th to the 4th, India fromthe 13th to the 6th, South Korea from the 58th to the 14th, North Korea from the 73rd to the16th and Iran from the 164th to the 17th. They are foreseen to become therefore the mainpolluters. The economic growth in the developing countries is expected to slow down but toremain much higher than OECD one. Economic and population growth are therefore the twomain driving-forces of CO2 emissions dynamics. Facing the global warming threat willtherefore require to include, sooner or later, the developing countries as active partners forreaching the emission targets.
During the 1973-1994 period, the rate of emissions/GDP has been very high in as well as in Ex-USSR and in India. While the developed countries have uniformly reduced their emissionsrespectively to the GDP (the average annual growth rate are: France: -3.6%, UK: 2.4%, Japan:2.32%, U.S.: 2% and Canada: 2.1%), India has increased the carbon-intensity of its economic

Energy Technology Strategy 1995-2030: Opportunities from the Global Warming Threat 15
system (+1.2%/year) as well as the Ex-USSR (+0.3%/year). Although China exhibits animportant decreasing annual average rate of -3%, it remains amongst the most carbon-intensiveeconomies.
(Source: Enerdata)
CO2 Emi ssi ons/ GDP
0
2
4
6
8
1 0
1 2
1 9 7 0 1 9 7 5 1 9 8 0 1 9 8 5 1 9 9 0 1 9 9 5
Ye a r s Kg CO2 / US$ 9 0
France
U.S
Japan
Canada
U.K
Ex-USSR
China
India
Figure 2-3: CO2 Emissions/ GDP.
2.1.3 Technology and policy responses
Technological options and political instruments to reach the targets of CO2 emissions have to bediscussed. Several possible actions may be recommended, aiming at correcting externalitieseffects of polluting technologies, at the formation of correct price signals and at enhancing therelated technological progress.
A screening on the possible technology responses to cope with the problem of global warmingwill be presented in Chapter 3. The focus given there consists of a broad set of measures, fromcarbon sequestration and disposal to massive adoption of energy-efficient devices.

Energy Technology Strategy 1995-2030: Opportunities from the Global Warming Threat 16
Amongst possible policy measures, the internalisation of the external costs (in terms ofpollution) of the conventional technologies within the electricity costs per output unit wouldgive non-distorted price basis for the investment decision-making of the utilities. Indeed, thecompetitiveness of the renewables would be much more effective and would benefit a lot fromsuch an initiative. However, negotiations on its implementation as well as on the definition of aunified tax rate across Europe has been the source of delays in its introduction. Additionalinstruments may be used to enhance the diffusion of the new energy technologies which areenvironmental-friendly. R&D policies may contribute to facilitate fuel substitution for movingaway from fossil-fuel based technologies as well as for CO2 removal and sequestration. Finally,joint implementation may provide the opportunity to reduce the CO2 emissions in developingcountries, possibly the most important emitters in the future.
A simple extrapolation from the above-shown data indicates that the EU carbon emission trendwould be to remain roughly constant or even experience a mild increase in the years to come.This business as usual scenario has to be contrasted with the policy objectives of theCommission to reduce emissions to -8% in 2005 and to -13% by 2010 with respect to the 1990values, within the frame of the negotiations auspicated by the IPCC. Preliminary computationsbased on a bottom-up techno-economic approach have delivered a possible distribution of thedisaggregated emission reductions by Member State:
Country CO2 emission index in 2010 (1990 = 100)
B 85
DK 75
D 70
GR 105
E 115
F 95
IR 105
IT 90
L 60
NL 90
AT 75
P 125
FIN 90
SW 105
UK 80
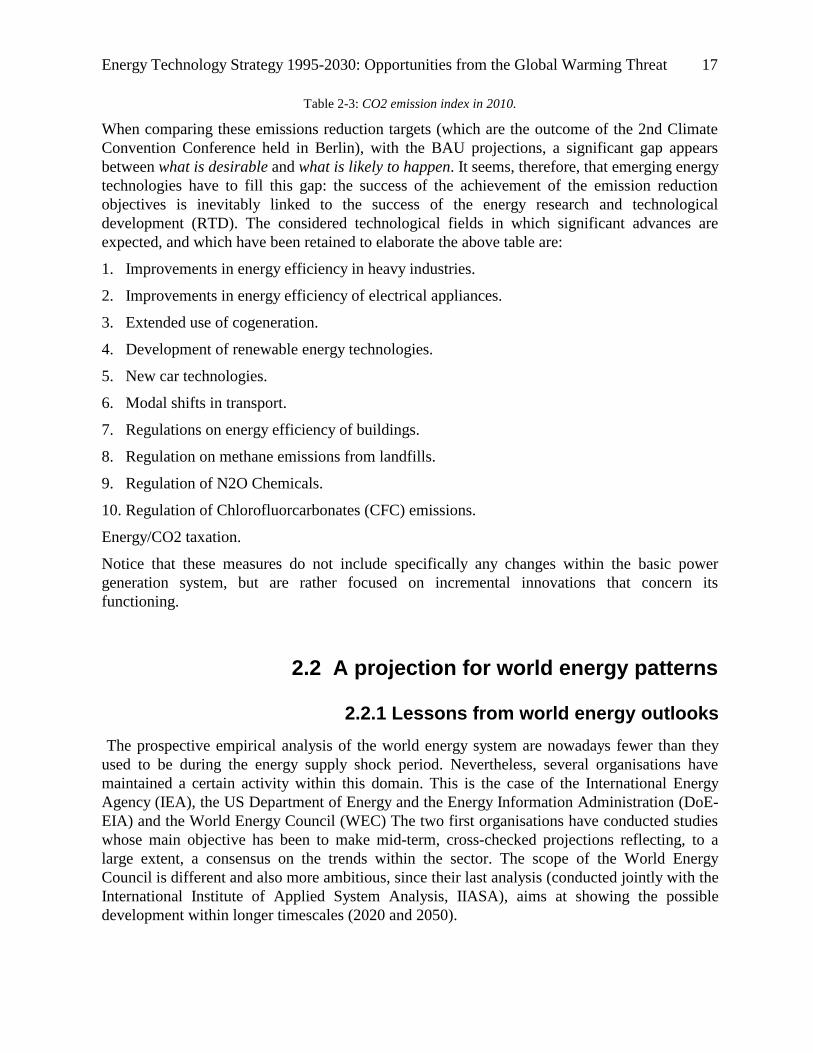
Energy Technology Strategy 1995-2030: Opportunities from the Global Warming Threat 17
Table 2-3: CO2 emission index in 2010.
When comparing these emissions reduction targets (which are the outcome of the 2nd ClimateConvention Conference held in Berlin), with the BAU projections, a significant gap appearsbetween what is desirable and what is likely to happen. It seems, therefore, that emerging energytechnologies have to fill this gap: the success of the achievement of the emission reductionobjectives is inevitably linked to the success of the energy research and technologicaldevelopment (RTD). The considered technological fields in which significant advances areexpected, and which have been retained to elaborate the above table are:
1. Improvements in energy efficiency in heavy industries.
2. Improvements in energy efficiency of electrical appliances.
3. Extended use of cogeneration.
4. Development of renewable energy technologies.
5. New car technologies.
6. Modal shifts in transport.
7. Regulations on energy efficiency of buildings.
8. Regulation on methane emissions from landfills.
9. Regulation of N2O Chemicals.
10. Regulation of Chlorofluorcarbonates (CFC) emissions.
Energy/CO2 taxation.
Notice that these measures do not include specifically any changes within the basic powergeneration system, but are rather focused on incremental innovations that concern itsfunctioning.
2.2 A projection for world energy patterns
2.2.1 Lessons from world energy outlooks
The prospective empirical analysis of the world energy system are nowadays fewer than theyused to be during the energy supply shock period. Nevertheless, several organisations havemaintained a certain activity within this domain. This is the case of the International EnergyAgency (IEA), the US Department of Energy and the Energy Information Administration (DoE-EIA) and the World Energy Council (WEC) The two first organisations have conducted studieswhose main objective has been to make mid-term, cross-checked projections reflecting, to alarge extent, a consensus on the trends within the sector. The scope of the World EnergyCouncil is different and also more ambitious, since their last analysis (conducted jointly with theInternational Institute of Applied System Analysis, IIASA), aims at showing the possibledevelopment within longer timescales (2020 and 2050).
Energy Technology Strategy 1995-2030: Opportunities from the Global Warming Threat 18
IEA-OECD - 96 "Capacity Constraints" EIA-DOE - 97 "Reference"1993 2000 2010 1993-2010 1995 2010 2015 1995-2015
Populatio 1,4% PopulatioGDP 3,2% GDP 3,1%Prim Energy 8,4 9,7 12,3 2,2% Prim Energy 9,1 12,8 14,0 2,2%
Coal 27% 26% 26% 2,0% Coal 26% 24% 24% 1,9%Oil 39% 39% 38% 2,1% Oil 39% 38% 38% 2,1%Nat Gas 20% 21% 23% 2,9% Nat Gas 21% 25% 26% 3,2%Nuclear 7% 7% 6% 1,0% Nuclear 6% 5% 4% -0,1%Hydr + Ren 7% 7% 7% 2,5% Hydr + Ren 8% 8% 8% 2,2%
CO2 (MtC) 5,9 6,7 8,6 2,3% CO2 (MtC) 6,2 8,8 9,7 2,2%
Oil Price 17 25 Oil Price 20,4 21,0
IIASA-CME- 95 A1 Scenario POLES WE-2030 Baseline 07/16/971990 2020 2050 1990-2020 1992 2010 2030 1990-2030
Populatio 5,3 7,9 10,1 1,3% Populatio 5,4 7,0 8,7 1,3%GDP (90$ MER) 20,9 46,9 101,5 2,7% GDP (90$ PPP) 27,9 52,2 96,1 3,3%Prim Energy 9,0 15,4 24,8 1,8% Prim Energy 8,6 12,3 19,1 2,1%
Coal 24% 24% 15% 1,7% Coal 25% 25% 27% 2,3%Oil 34% 31% 32% 1,4% Oil 38% 36% 34% 1,8%Nat Gas 19% 23% 19% 2,5% Nat Gas 20% 23% 24% 2,7%Nuclear 6% 6% 12% 2,0% Nuclear 5% 5% 4% 1,5%Hydr + Ren 18% 16% 22% 1,5% Hydr + Ren 13% 12% 11% 1,8%
CO2 (MtC) 6,0 10,0 15,1 1,5% CO2 (MtC) 6,0 8,6 13,6 2,2%
Oil Price Oil Price 26,2 35,7
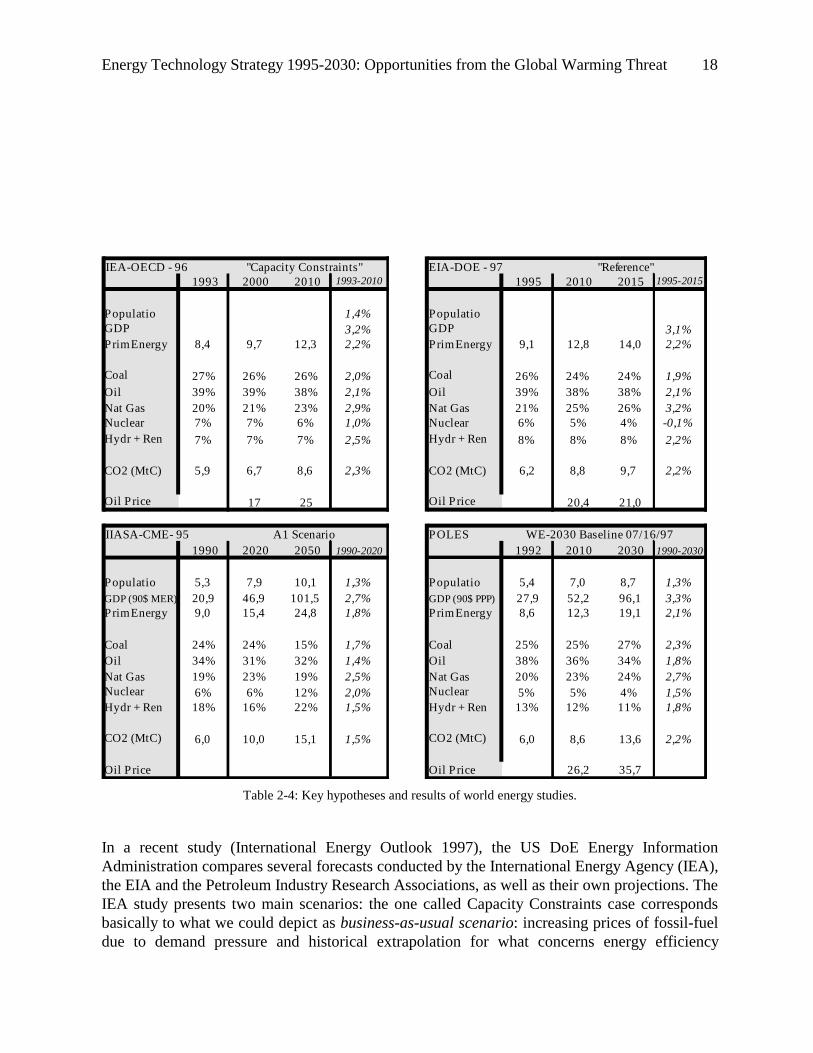
Table 2-4: Key hypotheses and results of world energy studies.
In a recent study (International Energy Outlook 1997), the US DoE Energy InformationAdministration compares several forecasts conducted by the International Energy Agency (IEA),the EIA and the Petroleum Industry Research Associations, as well as their own projections. TheIEA study presents two main scenarios: the one called Capacity Constraints case correspondsbasically to what we could depict as business-as-usual scenario: increasing prices of fossil-fueldue to demand pressure and historical extrapolation for what concerns energy efficiency

Energy Technology Strategy 1995-2030: Opportunities from the Global Warming Threat 19
improvements. The Energy Savings case assumes an increase in energy efficiency measures,lower values of demand growth rates and essentially constant fossil-fuel prices. On the otherhand, the EIA presents three scenarios of low, medium and high economic growth.
Comparing different baseline projections or central scenarios is always problematic sinceaccounting conventions are not identical, especially in what refers to harmonising traditionalrenewable energies. However, results of this comparison reveal a great convergence concerningthe world-wide consumption of these energies, in any case until 2020: all these projections areinscribed, indeed, in a 12-13 Gtep trajectory in 2010 and 15-16 Gtep in 2020. A 19 Gtep in 2030for the POLES projection seems to be perfectly compatible with the continuation of this trend.
However, this apparent convergence of global results conceals potential incoherence, to anextent in which price estimations - once they are specified - are far from being the same. Thus,the DOE projection is supported by an almost stable price estimation of oil until 2015, whereasthis price is already increasing 40% for 2010, in the IEA projection and the POLES referencescenario. In this last projection, it can be noticed that there is a strong price increase after 2010,due to the production decrease of conventional fuel and the urgent necessity of non-conventionalresources.
According to power generation, detailed results are equally less convergent. However, in thescope of 2010 - that is, the deadline nowadays fixed by international greenhouse effectsnegotiations - the world-wide energetic supply should probably have little more than 3 Gtep ofcoal and natural gas and between 4.5 and 5 Gtep of oil. Considering the coefficients of carbon ofeach type of energy, the world-wide energy emissions of CO2 would be about 8,7 GtC, againstthe 6 GtC in 1990. The important difference between the stabilisation aims fixed in theinternational negotiations and the "business-as-usual" projections that lead to an almost 45%increase of the emissions in 20 years, starting from 1990 can be noted.
2.2.2 WE-2030 exogenous hypotheses: population and GDP growthin 11 world regions
While 26 countries or regions are individualised in the POLES model, most analyses of theBaseline exogenous hypotheses and results will be performed according to a worlddisaggregation in eleven geographical or geopolitical regions (acronyms from Table 2.5 are usedin the rest of the text or tables).
Energy Technology Strategy 1995-2030: Opportunities from the Global Warming Threat 20
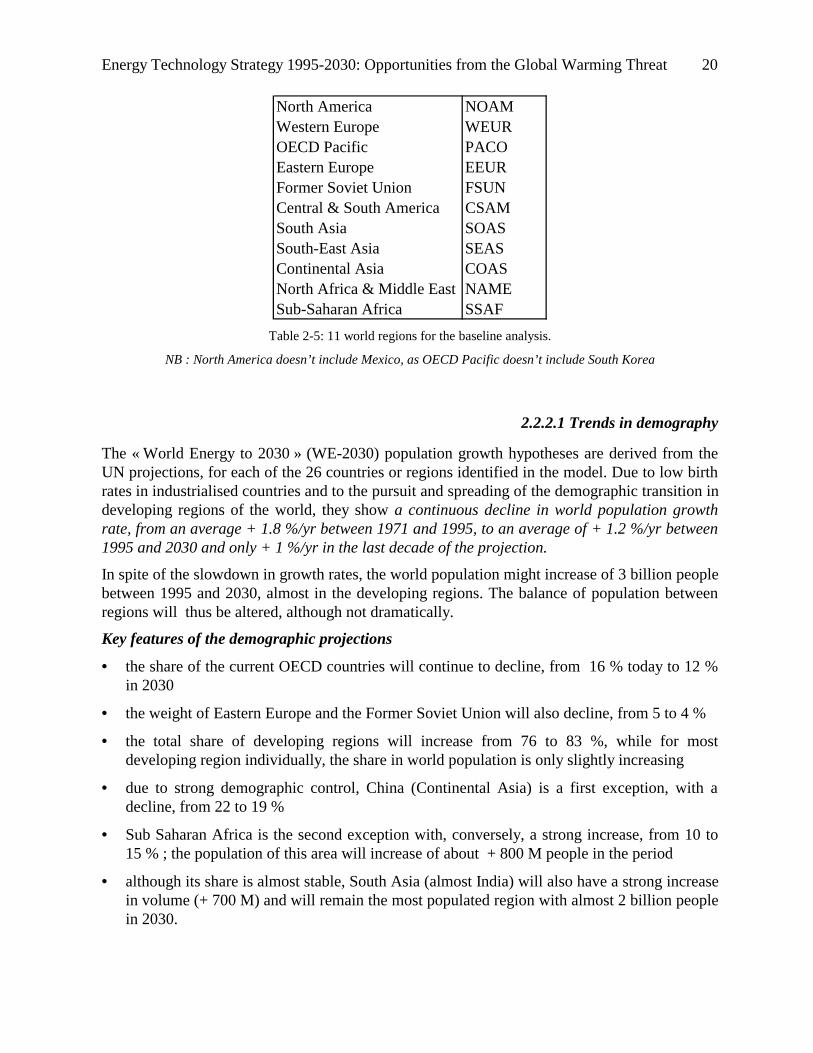
North America NOAMWestern Europe WEUROECD Pacific PACOEastern Europe EEURFormer Soviet Union FSUNCentral & South America CSAMSouth Asia SOASSouth-East Asia SEASContinental Asia COASNorth Africa & Middle East NAMESub-Saharan Africa SSAF
Table 2-5: 11 world regions for the baseline analysis.
NB : North America doesn’t include Mexico, as OECD Pacific doesn’t include South Korea
2.2.2.1 Trends in demography
The « World Energy to 2030 » (WE-2030) population growth hypotheses are derived from theUN projections, for each of the 26 countries or regions identified in the model. Due to low birthrates in industrialised countries and to the pursuit and spreading of the demographic transition indeveloping regions of the world, they show a continuous decline in world population growthrate, from an average + 1.8 %/yr between 1971 and 1995, to an average of + 1.2 %/yr between1995 and 2030 and only + 1 %/yr in the last decade of the projection.
In spite of the slowdown in growth rates, the world population might increase of 3 billion peoplebetween 1995 and 2030, almost in the developing regions. The balance of population betweenregions will thus be altered, although not dramatically.
Key features of the demographic projections
• the share of the current OECD countries will continue to decline, from 16 % today to 12 %in 2030
• the weight of Eastern Europe and the Former Soviet Union will also decline, from 5 to 4 %
• the total share of developing regions will increase from 76 to 83 %, while for mostdeveloping region individually, the share in world population is only slightly increasing
• due to strong demographic control, China (Continental Asia) is a first exception, with adecline, from 22 to 19 %
• Sub Saharan Africa is the second exception with, conversely, a strong increase, from 10 to15 % ; the population of this area will increase of about + 800 M people in the period
• although its share is almost stable, South Asia (almost India) will also have a strong increasein volume (+ 700 M) and will remain the most populated region with almost 2 billion peoplein 2030.

Energy Technology Strategy 1995-2030: Opportunities from the Global Warming Threat 21
1992 2000 2010 2020 2030
M habWorld WRD 5424 6150 7027 7893 8713
% of World totalNorth America NOAM 5 5 5 4 4Western Europe WEUR 8 7 7 6 6OECD Pacific PACO 3 3 2 2 2Eastern Europe EEUR 2 2 2 2 2Former Soviet Union FSUN 5 5 5 4 4Central & South America CSAM 8 9 9 9 9South Asia SOAS 22 22 22 22 23South-East Asia SEAS 10 10 10 10 10Continental Asia COAS 22 21 20 20 19North Africa & Middle East NAME 5 5 6 7 7Sub-Saharan Africa SSAF 10 11 13 14 15
Table 2-6: World population 1992-2030
2.2.2.2 Economic projections : the GDP dynamics
WE-2030 economic projection are derived from Worldscan economic projections, adjusted forthe changes from Market Exchange Rate to Purchasing Power Parity GDP growth rates. Whilemost economic forecasts present variations in MER-GDP, the economic variables used in thePOLES Database are expressed in the CEPII PPP conversion system. This is done in order toaccount both for the informal sector, which in most developing areas constitutes to a largeproportion of total economic activity and for the corresponding purchasing power of households.It is thus considered that the PPP-GDP is a better indicator for the energy consumption andenergy intensity of GDP and is also more suited for international comparisons.
MER-GDP and PPP-GDP projections show significantly different pictures of world economicstructure and dynamics. Using PPP, the initial GDP level is higher in developing regions, whilethe corresponding growth rate of the economy is lower. This results both in a very differentstructure of world GDP and, paradoxically, in a higher aggregated growth - in spite of lowerindividual rates - as the share of the rapidly growing regions is more important. Thisphenomenon is illustrated in Table 2.7, showing the differences in structure and growth rates forthe WE-2030 Baseline and for the original Worldscan economic projection.

Energy Technology Strategy 1995-2030: Opportunities from the Global Warming Threat 22
WE-2030 - Purchasing Power Parity Worldscan - Market Exchange Rate PPP-MER
1990 2020 1990-2020 1990 2020 1990-2020 1990-2020
World WRD G$90 PPP yagr G$90 MER yagr27,4 72,5 3,3% 21,6 54,6 3,1% 0,2%
% of World GDP % of World GDPNorth America NOAM 22 16 2,2% 28 21 2,2%Western Europe WEUR 23 16 2,0% 34 24 2,0%OECD Pacific PACO 10 7 2,2% 15 11 2,2%Eastern Europe EEUR 3 2 2,1% 2 2 3,4% -1,3%Former Soviet Union FSUN 9 5 1,4% 4 4 2,4% -1,0%Central & South America CSAM 9 11 4,1% 5 9 5,2% -1,1%South Asia SOAS 5 7 4,6% 2 5 6,7% -2,1%South-East Asia SEAS 6 10 4,8% 4 9 6,0% -1,2%Continental Asia COAS 9 20 6,2% 2 9 8,7% -2,5%North Africa & Middle East NAME 4 5 4,0% 3 4 4,1% -0,1%Sub-Saharan Africa SSAF 2 2 3,3% 1 2 4,0% -0,7%
Table 2-7: PPP and MER world economic structure and dynamics.
In both the PPP and MER projections, the resulting economic picture is one of a sustainedeconomic growth at world level with an average growth superior to 3 %/yr, between 1995 and2030 at world level. This is not much higher than the secular trend in world output growth of +3 %/yr between 1900 and 1990, according to Angus Maddison. This is also not much higherthan the growth experienced between 1971 and 1995 : + 3.1 %/yr (PPP). It has to be noted thatthis growth rate has been reached, in the past quarter of a century, in spite of a series of criseswhich affected successively the different regions of the world : the oil shocks for theindustrialised oil importing countries, the debt crisis in the LDCs and the decay of the CentrallyPlanned Economies.
For the future and in a decade by decade perspective, it appears that combining the hypothesis ofa recovery in the former CPEs and the one of a declining but still high growth in Asia, the 2000-2010 period might experience the highest growth rate with about + 3.8 %/yr on average. Worldgrowth rates are then declining, to + 3.3 and + 2.9 %/yr in the two following decades.
Key features of the economic projections
• according to the projection, OECD countries might experience a moderate growth in the2000-2010 period (about + 2.5 %/yr), while the growth rate will still decline in the twofollowing decades, in the range of 1 to 2 %/yr
• economies in transition might recover during the two first decades of the next century withgrowth rate around 3.5 %/yr and then experience more moderate growth, above 2 %/yr
• all developing regions might grow at rates higher than + 3.5 %/yr during the projectionperiod
• as compared to the 1971-1995 period, growth will accelerate in Latin America, Africa-Middle East and South Asia, while it will decelerate in South East and Continental Asia

Energy Technology Strategy 1995-2030: Opportunities from the Global Warming Threat 23
• however Continental Asia will remain the region with the highest growth potential, speciallyat the beginning of the projection period, while after 2010 it is overwhelmed by otherregions, specially South Asia
yagr 1971-95 1995-2030 1971-80 1980-90 1990-2000 2000-10 2010-20 2020-30
NOAM 2,5% 2,1% 2,8% 2,7% 2,0% 2,5% 2,2% 1,7%WEUR 2,4% 2,1% 3,0% 2,4% 1,5% 2,5% 2,0% 1,7%PACO 3,6% 2,0% 4,3% 3,9% 2,2% 2,7% 1,6% 1,2%EEUR 0,3% 2,9% 3,6% -0,6% -0,4% 3,4% 3,3% 2,1%FSUN -0,1% 3,3% 3,1% 1,6% -3,3% 3,9% 3,7% 2,7%CSAM 3,3% 3,8% 5,5% 1,2% 3,5% 4,6% 4,1% 3,1%SOAS 4,4% 4,8% 3,4% 5,6% 4,3% 4,7% 4,9% 4,7%SEAS 6,7% 4,2% 7,6% 6,5% 5,3% 5,0% 4,2% 3,3%COAS 7,4% 5,1% 5,6% 8,5% 8,1% 6,3% 4,3% 3,6%NAME 3,3% 4,2% 5,1% 1,6% 3,6% 4,1% 4,5% 4,5%SSAF 2,4% 3,7% 3,0% 2,0% 2,5% 3,1% 4,3% 4,3%
WRD 3,1% 3,3% 3,7% 3,0% 2,7% 3,8% 3,3% 2,9%
Table 2-8: World economic growth (PPP).
2.2.2.3 Changes in per capita GDP profiles
While combining demographic trends and GDP projections, it is possible to analyse the percapita GDP profiles and to characterise the changes in the dynamics in hierarchy of the differentregions considered. In this perspective, the situations in 1970, 1995 and 2030 can be describedas follows :
• in 1970 the North America region presents a clear advance on other industrialised areas witha yearly per capita GDP of 15 000 $ (1990$ PPP) against 10 000 $ in Europe and PacificOECD ; an intermediate group of 4 000 to 6 000 $ per capita is lead by the Soviet Union, italso incorporates Latin America and North Africa - Middle East ; at the bottom end, withrevenues between 750 and 1 400 $ lay the regions of Asia and Sub-Saharan Africa ;
• in 1995, the situation is already significantly altered ; while Pacific OECD is now in anintermediate position between North America and Europe, the former CPEs has slippedbehind Latin America, while South East and Continental Asia have almost caught-up withthe group of intermediate income countries ; only two regions lay behind, Sub-SaharanAfrica and South Asia ;
• in 2030, the picture might still look different ; while the convergence among industrialisedcountries may continue, it may appear quite strong among intermediate income regions withthe complete catch up of South East and Continental Asia to the group formed by LatinAmerica and the countries in transition ; meanwhile, South Asia’s take-off may continue at asteady speed, it may take until 2010 before the increase in per capita income of Sub-SaharanAfrica resumes.
Energy Technology Strategy 1995-2030: Opportunities from the Global Warming Threat 24
0,1
1
10
100
1970 1975 1980 1985 1990 1995 2000 2005 2010 2015 2020 2025 2030
NOAM
WEUR
PACO
EEUR
FSUN
CSAM
NAME
SSAF
SOAS
SEAS
COAS
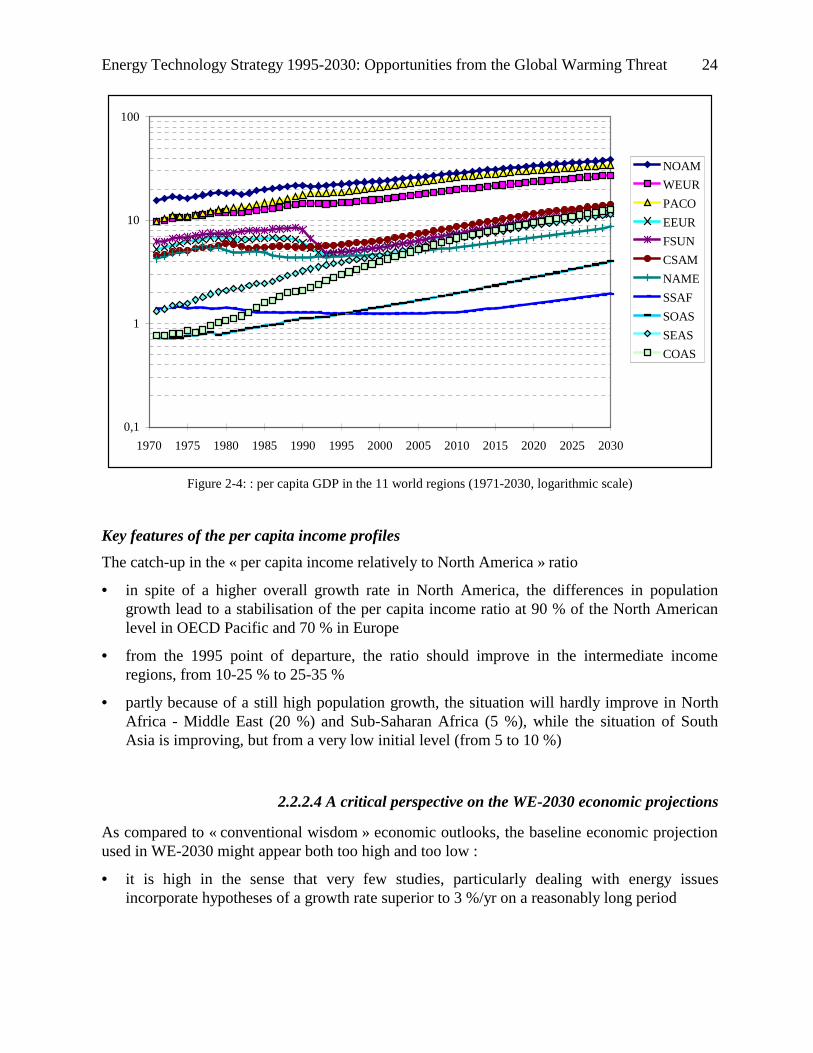
Figure 2-4: : per capita GDP in the 11 world regions (1971-2030, logarithmic scale)
Key features of the per capita income profiles
The catch-up in the « per capita income relatively to North America » ratio
• in spite of a higher overall growth rate in North America, the differences in populationgrowth lead to a stabilisation of the per capita income ratio at 90 % of the North Americanlevel in OECD Pacific and 70 % in Europe
• from the 1995 point of departure, the ratio should improve in the intermediate incomeregions, from 10-25 % to 25-35 %
• partly because of a still high population growth, the situation will hardly improve in NorthAfrica - Middle East (20 %) and Sub-Saharan Africa (5 %), while the situation of SouthAsia is improving, but from a very low initial level (from 5 to 10 %)
2.2.2.4 A critical perspective on the WE-2030 economic projections
As compared to « conventional wisdom » economic outlooks, the baseline economic projectionused in WE-2030 might appear both too high and too low :
• it is high in the sense that very few studies, particularly dealing with energy issuesincorporate hypotheses of a growth rate superior to 3 %/yr on a reasonably long period
Energy Technology Strategy 1995-2030: Opportunities from the Global Warming Threat 25
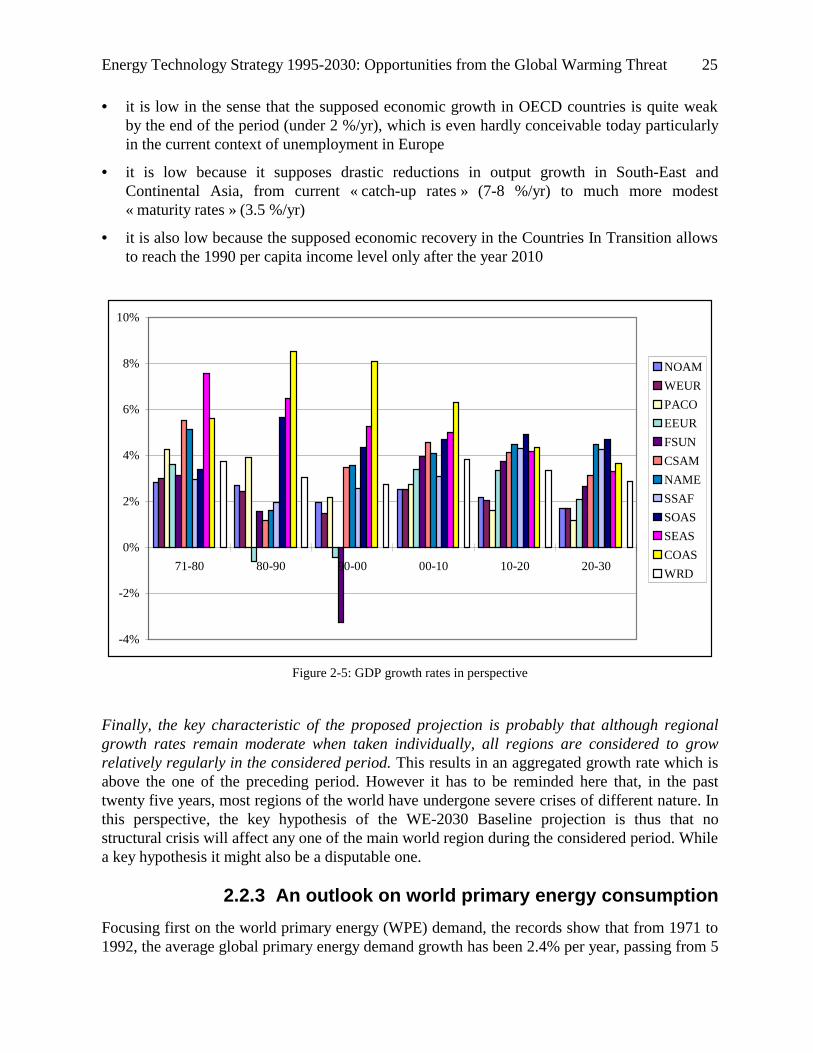
• it is low in the sense that the supposed economic growth in OECD countries is quite weakby the end of the period (under 2 %/yr), which is even hardly conceivable today particularlyin the current context of unemployment in Europe
• it is low because it supposes drastic reductions in output growth in South-East andContinental Asia, from current « catch-up rates » (7-8 %/yr) to much more modest« maturity rates » (3.5 %/yr)
• it is also low because the supposed economic recovery in the Countries In Transition allowsto reach the 1990 per capita income level only after the year 2010
-4%
-2%
0%
2%
4%
6%
8%
10%
71-80 80-90 90-00 00-10 10-20 20-30
NOAM
WEUR
PACO
EEUR
FSUN
CSAM
NAME
SSAF
SOAS
SEAS
COAS
WRD
Figure 2-5: GDP growth rates in perspective
Finally, the key characteristic of the proposed projection is probably that although regionalgrowth rates remain moderate when taken individually, all regions are considered to growrelatively regularly in the considered period. This results in an aggregated growth rate which isabove the one of the preceding period. However it has to be reminded here that, in the pasttwenty five years, most regions of the world have undergone severe crises of different nature. Inthis perspective, the key hypothesis of the WE-2030 Baseline projection is thus that nostructural crisis will affect any one of the main world region during the considered period. Whilea key hypothesis it might also be a disputable one.
2.2.3 An outlook on world primary energy consumption
Focusing first on the world primary energy (WPE) demand, the records show that from 1971 to1992, the average global primary energy demand growth has been 2.4% per year, passing from 5
Energy Technology Strategy 1995-2030: Opportunities from the Global Warming Threat 26
Billion TOE to around 8 Billion TOE in 1992. Looking at the picture on a longer time scale, itmay be noticed that world primary energy consumption has passed from about 0.5 Billion TOEat the beginning of this century to today’s levels. This 1600% increase took placesimultaneously with the comparatively modest increase of 400% of the world population: percapita energy consumption increase accounted for the remaining 400% of WPE increase.
With respect to the fuel mix, it should be remembered that today, around 85% of the globalprimary energy comes from fossil fuels. Within the IEA Capacity Constraints (CC) case(basically a business as usual projection), the WPE is assumed to reach around 12 Billion TOEby 2010, whereas according to the EIA International Energy Outlook 97 in the reference case(IEO 97-RC), this could reach around 12.7 Billion TOE by the same date. The correspondingexpected average annual growth for the period 1990-2010 would be 2.2% and 2.0%,respectively. If this assumption obtains, current WPE demand will double in around 33 years.Under these assumptions, the fossil fuel share of the WPE could reach 90% by 2010, and naturalgas would exhibit the fastest-growing rate (an average annual rate of 2.9% in the next 15 years,according to IEA CC and IEO 97-RC). Nevertheless, the largest increase would take place in thecoal market: the global coal demand will expand from today’s 2400 MToe to 3000 MToe by2010. This expansion would be concentrated around developing economies: actually, the OECDcoal share is expected to shrink from 45% to 30% in the period 1990-2010.
Looking at WPE demand by zones, a noticeable fact is that the relative weight of the developedworld is expected to decrease from 65% in 1971 up to 47% in 2010. On the contrary, thedeveloping countries will expand their share from 26% in 1990 to 38% in 2010.
GDP growth is a key variable to determine energy demand. The standard forecast assumed bythe IEA to carry out the analysis whose results have been summarized above consists of a quiteuniform annual GDP growth of 3% in the forthcoming decades in OECD, whereas the expectedbehavior of the non-OECD countries is not homogeneous: East Asia will be the fastest growingzone (6.6%), followed by South Asia (5.4%), South and Central America and Africa (3.6%). By2010, the GDP of non-OECD countries (not including the Former Soviet Union and newindependent states), encompassing 80% of the world population, is expected to reach theaggregate GDP of OECD countries, that would account for 16% of the world population by thattime. These assumptions are in good agreement with the ones projected by the WEFA group,that have been taken for the IEO 97, with different aggregation patterns.
Although GDP is important, changes in GDP energy intensity can also motivate noticeablefluctuations in the overall energy demand. During the past, a persistent trend of diminishingGDP energy intensity has been observed, and it is expected to continue to decrease on a globalscale, but at lower rate. In OECD countries, the main trade-off will take place between aprogressive tertiarization of the economy vs. increasing transport intensity, both for freight andpassengers. The decline of the secondary sector weight will be particularly relevant in theeconomy of the former Soviet Union and the Central and Eastern Europe countries. Theindustrialization of developing countries will probably concern less energy-intensive processes.
2.2.3.1 World consumption by source of energy
According to the WE-2030 baseline projection, world primary energy consumption couldincrease at an average rate of 2.2 %/yr over the next three decades. Quite important changes may

Energy Technology Strategy 1995-2030: Opportunities from the Global Warming Threat 27
occur in the world fuel mix as oil could incur a loss in market share - from 38 to 34 % , due tosubstantial price increases (see below table 2.9). This would benefit mainly to natural gas - from19 to 24 % - and also to coal. As for non fossil energies, the share of nuclear energy in worldsupply could decrease from 6 to 5%, while the regular increase in large hydro and the take-off ofnew renewables would be offset by the decline of traditional biomass : altogether, the share ofthe renewable sources of energy could slightly decrease from 12.7 to 11.2 % of world energyconsumption.
Mtoe Mtoe % of World total1992 2000 2010 2020 2030 1992 2000 2010 2020 2030
2152 2331 3026 3926 5064 25% 24% 25% 25% 27% Oil 3231 3700 4378 5257 6438 38% 38% 36% 34% 34% Natural 1670 2057 2771 3745 4626 19% 21% 23% 24% 24% Nuclear 457 577 628 708 805 5% 6% 5% 5% 4% Hydro+Geoth 477 557 702 865 1037 6% 6% 6% 6% 5% Trad.Biomass 429 373 315 268 230 5% 4% 3% 2% 1% Other 181 227 487 711 871 2% 2% 4% 5% 5%
P rimary 8596 9822 12307 15480 19070 100% 100% 100% 100% 100%
0,2%
0
2000
4000
6000
8000
10000
12000
14000
16000
18000
20000
1992 2000 2010 2020 2030
Other Renewables
Trad.Biomass
Hydro+Geoth
Nuclear
Natural gas
Oil
Solids
Table 2-9: Energy consumption and supply in WE-2030 Baseline
Figure 2-6: Energy consumption and supply in WE-2030 Baseline

Energy Technology Strategy 1995-2030: Opportunities from the Global Warming Threat 28
2.2.3.2 International energy prices
One of the main features of the POLES model is its ability to produce endogenous changes forinternational energy prices. The price mechanisms incorporated in the model do take intoaccount the balance of supply and demand for oil, natural gas and coal : in the short run, pricesdepend on the demand variation and on oil supply capacities in the Gulf « swing producer »countries ; in the longer run prices depend on the Reserve on Production ratios for oil andnatural gas (see below .).
Price changes are quite significant in the Baseline projection, as oil price increase to 26 90$/blin 2010 and to 36 90$/bl in 2030. Natural gas prices, which are simulated for three mainregional markets, also show significant increases after 2000. These price increases are of coursedue to the total demand increases, they also contribute, in the model, to considerably moderatethese increases.
OIL 1973 1980 1990 2000 2010 2020 2030
World crude oil price 9,8 41,4 20,0 19,7 26,9 32,9 36,9
World RP ratio 24,5 25,9 40,6 39,4 33,3 28,2 22,7
NATURAL GAS 1975 1980 1990 2000 2010 2020 2030 Import prices ($90/boe) N. American market 20,4 30,0 10,8 14,5 19,0 24,4 28,4 European market 11,3 21,4 15,2 15,9 19,0 25,1 30,6 Asian market 19,2 36,5 20,6 28,6 34,0 36,3 42,3
Import prices ($90/Mbtu) N. American market 3,5 5,1 1,8 2,5 3,2 4,2 4,8 European market 1,9 3,6 2,6 2,7 3,2 4,3 5,2 Asian market 3,3 6,2 3,5 4,9 5,8 6,2 7,2
Table 2-10: Oil and gas prices in the WE-2030 Baseline.
2.2.3.3 Trends in energy intensities
In the POLES model, trends in energy intensities are dependent on the structural evolutions ofthe economy and on autonomous technology improvements. But they are also stronglyinfluenced by price-effects.

Energy Technology Strategy 1995-2030: Opportunities from the Global Warming Threat 29
toe / 1000 90$ (PPP) Annual % change1992 2000 2010 2020 2030 92-00 00-10 10-20 20-30
North America 369 340 287 247 218 -1,0% -1,7% -1,5% -1,2%Western Europe 220 217 192 173 159 -0,2% -1,2% -1,0% -0,8%OECD Pacific 205 196 174 159 150 -0,5% -1,2% -0,9% -0,6%Eastern Europe 479 335 270 236 211 -4,4% -2,1% -1,4% -1,1%Former Soviet Union 745 470 324 282 261 -5,6% -3,6% -1,4% -0,8%Central & South America 188 198 181 169 159 0,7% -0,9% -0,7% -0,6%South Asia 258 230 207 191 176 -1,4% -1,1% -0,8% -0,8%South-East Asia 250 240 204 187 173 -0,5% -1,6% -0,9% -0,8%Continental Asia 284 233 220 203 191 -2,5% -0,6% -0,8% -0,6%North Africa & Middle East 318 306 258 255 248 -0,5% -1,7% -0,2% -0,3%Sub-Saharan Africa 379 369 357 339 321 -0,3% -0,3% -0,5% -0,5%World 303 265 227 206 192 -1,7% -1,5% -1,0% -0,7%
Table 2-11: Energy intensities.
Up to 2000 and even 2010 world energy intensity decreases significantly, partly because ofstrong reductions in energy demand in the transition countries ; it has to be noted however thatin 2010 the energy intensity of the Former Soviet Union is still 13 % higher than that of the US.
The oil price increase of more than fifty percent between 2000 and 2020 puts a further pressureon energy intensities, in industrialised countries, but also in developing countries, with energyintensity declines of commonly - 1 %/yr. Intensity gains are lower by the end of the projection,largely because of more moderate oil price increases (less than ten percent in ten years).
2.2.3.4 World consumption by region
Energy demand growth will be low in OECD region, with growth-rate under 2 %/yr at thebeginning of the projection period and under 1 %/yr at the end. The economic recovery in thecountries in transition also induces a recovery in energy demand ; the corresponding increase inconsumption is however moderate, this implies continued improvements in energy efficiency(see below). Conversely, energy demand growth-rates are between 3 and 5 %/yr in alldeveloping regions ; exceptions are growth rates under 3 %/yr in North Africa-Middle East until2010 and South-East Asia after 2020 ; conversely, growth rates exceed 5 %/yr in China, until2010 (this rate has been of 4.4 %/yr between 1985 and 1995).
China’s energy consumption might exceed that of Western Europe by 2010 and that of NorthAmerica by 2020. In 2030 four regions will each represent a total consumption between 1.2 and1.7 Gtoe, i.e. the current consumption of Western Europe: the Former Soviet Union, LatinAmerica, South Asia and South-East Asia.

Energy Technology Strategy 1995-2030: Opportunities from the Global Warming Threat 30
Mtoe % of World total1992 2000 2010 2020 2030 1992 2000 2010 2020 2030
North America 2233 2469 2674 2852 2979 26% 26% 22% 19% 16%Western Europe 1404 1580 1787 1965 2138 17% 17% 15% 13% 12%OECD Pacific 568 642 746 796 847 7% 7% 6% 5% 5%
sub-total 50% 49% 44% 38% 32%
Eastern Europe 279 232 262 317 349 3% 2% 2% 2% 2%Former Soviet Union 1227 786 797 1003 1206 15% 8% 7% 7% 7%
sub-total 18% 11% 9% 9% 8%
Central & South America 474 659 938 1317 1684 6% 7% 8% 9% 9%South Asia 351 448 636 949 1384 4% 5% 5% 6% 8%South-East Asia 486 684 950 1307 1677 6% 7% 8% 9% 9%Continental Asia 786 1204 2095 2963 3974 9% 13% 18% 20% 22%North Africa & Middle East 372 473 595 906 1367 4% 5% 5% 6% 7%Sub-Saharan Africa 260 309 405 586 842 3% 3% 3% 4% 5%
sub-total 32% 40% 47% 54% 59%
Table 2-12: Primary energy consumption, by region
During the projection period a major shift in world energy consumption will thus take place :
• while OECD countries still represent half of total world energy consumption, their share willbe reduced to less than one third in 2030 ;
• conversely, developing countries now represent one third of world total, their share mightincrease up to 60 % in 2030.
This is shift is of course of paramount importance for many key issues, such as energy supplysecurity, financial requirements, new technology development and diffusion, climate changepolicy ...
2.2.4 A check of final energy demand profiles: the energy serviceapproach
World final energy (WFE) demand has passed from 4 Billion TOE in 1970 to something lessthan 6 Billion TOE in 1990, and is expected to reach around 8 Billion TOE by 2010. Thesefigures reflect an increased penetration of electricity, at least until 2000, the progressiveelectrification of the world final demand will being the main reason. Gains in technologicalenergy conversion efficiency are expected to facilitate overall energy efficiency increase from2000 on.
The structure of the WFE demand reflects a progressive electrification and gasification of thesystem, compatibly with a persistent, non-declining oil share. The reason for this has to belooked for in the transport sector, which absorbed 22% of WFE demand in 1971, 26% in 1992,and is expected to reach 28% in 2010. Transport oil demand increased during the period 1971-92 at an annual rate of 2.7%, and the expected rate for 1992-2010 is 2.5% (with more intensegrowth in South and East Asia). The OECD share in world oil transport demand is expected tomove from 75% in 1971 to 56% in 2010.

Energy Technology Strategy 1995-2030: Opportunities from the Global Warming Threat 31
In the household sector, there is a trend of relative increase in the use of gas and electricity.From the solid fuel sector, the coal share for household consumption remains constant, whereasnon-commercial biomass, will be of major importance especially in developing countries withlarge demographic pressure.
The relative electrification of industry also contributes to limit the overall energy efficiency,although this process exhibits very different regional patterns, according to different energyintensities of the GDP, and different shares of industrial sector on GDP.
The world electricity demand (WED) is expected to progress with a annual growth rate of 2.3%during the next 20 years, although the average annual growth rate will reach even 6% indeveloping countries. This means that, roughly speaking, global consumption will double in2020 with respect to 1990. To provide an idea of the vertiginous dynamics of such adevelopment, these growth rates imply that a new 250 MW power plant has to be built in theworld each 3 days during this period (without considering that the existing power capacity hasto be replaced). These figures put into evidence the crucial role that technology can play in thepower sector in the forthcoming decades. Power generation technologies are becoming a hugemarket in which the technological expertise of developed countries will have to be massivelytransferred to emerging economies whose demand for electricity is growing a two-digit annualrates.
Within the IEA CC scenario, past trends in the world electricity mix are as follows: the coalshare remains constant, the hydroelectric generation share slowly decreases, whereas the oilshare decreases more abruptly, as well as the nuclear share, whereas the gas fraction expandsfrom 14% to 22% in the period 1970-2010. In OECD countries, a severe contraction of oil-based electricity production is expected. The dramatic expansion of coal-based electricityproduction in developing countries is reflected by coal share gains of 10 points: from 37 % in1971 to 46% in 2010, although the use of gas rapidly expands also from 4% in 1971 to 17% in2010, the hydroelectric generation share decreases from 34% in 1971 to 24% in 2010 in thosecountries.
The IEO 97 forecasts are generally in agreement with these trends, although it predicts a higherdegree of gasification of the electric sector.
The transport sector accounted for around 22% of the final world energy demand by 1970. Thisshare increased up to 26% by 1992 and tends to keep on growing. Nowadays, the transportsector consumes about half of the world’s oil consumption. As it is well-known, the moststriking note to underline about the world transport sector concerns its high dependency on oil:97% of the energy consumed by this sector is directly dependent on petroleum.
Due to this stiffness, the rapid growth in transport fuel consumption has implications for energysecurity of supply, local and global environment and balance of payments for most countries.From 1992 to 2010, worldwide annual transportation oil demand is projected to increase by 800Mtoe (namely 16 million barrels per day), passing from around 1460 Mtoe/year to around 2260Mtoe/year. For the OECD countries, the annual oil consumption as final energy is expected togrow (according to the IEA) from 1600 to 1950 Mtoe/year in the period from 1992 to 2010. Outof them, the transport sector absorbed 940 in 1992 and is expected to account for 1280 by 2010.

Energy Technology Strategy 1995-2030: Opportunities from the Global Warming Threat 32
During the last 25 years, the worldwide energy use in the transportation sector increased at anaverage annual growth rate of 2.7%. Although its growth was slower than the overall economyfrom 1974 to 1986, there has been a smooth but noticeable change in the trend, and now energyuse for transportation is expanding at the same rate as GDP, or slightly faster.
It goes without saying that changes in transportation efficiency may modify these trends.However, these changes would not be substantial if only incremental improvements on thetraditional road-dominated, single-user explosion engine car would happen. Indeed, althoughtechnology is likely to continue to improve significantly, consumer preferences for larger andmore powerful cars and trucks could completely offset the efficiency improvements.
From 1960 to 1991, the number of passenger cars and commercial vehicles almost quintupledeven though global population less than doubled. The global car stock is expected to double inthe forthcoming 15 years. Currently, there are great differences in car ownership ratios betweencountries, although these differences are likely to be reduced in the future. The rising rates ofindustrialization and urbanization will require more transport and increased investment ininfrastructure for the distribution of goods.
The transportation market can be segmented by purpose (motion of goods and people), by mode(road, rail, air, sea) and by distance (local, national, international). The split between the majormodes of transport will be increasingly influenced by developments affecting their relativequality and performance. In terms of energy consumption, the road subsector is by far the mostimportant, about three quarters of total transport energy demand, its predominance being mainlylocated in the passenger transport rather than in the freight transport.
Bearing in mind these remarks, it is worth to have a look to the POLES results on final energyconsumption. While energy demand is simulated in the POLES model by using a sectoralapproach, consistency checks can be performed while using the « Energy Service » approachelaborated by IEA Secretariat. This approach consists in analysing the relationship between totalGDP and the key « Services » performed by energy, to which three main categories of fuel canbe associated : fossils for stationary fuel use (mostly heat for process and building), liquids fortransport and electricity. This approach overcomes some accounting and statistical difficultieswhich are inherent to the more conventional sectoral approach.
When used at a geographically aggregated level, particularly at world level, it also allows toovercome problems associated to the delocalisation of activities, which have profoundlyinfluenced the energy-GDP relationship in the different regions during the past quarter of acentury. At world level the energy-GDP relationship thus appears much more straightforwardthan in a country by country perspective. The statement drawn by IEA’s Secretariat from pastevolutions is the following :
• for stationary fuel uses, there has clearly been changes in the anterior trend, as energyconsumption decreased in volume the first oil shock, but still more after the second(particularly in IEA countries, where the stationary fuel use then more or less stabilises), andalso after the fall-down of the CPEs ;

Energy Technology Strategy 1995-2030: Opportunities from the Global Warming Threat 33
• transport fuels consumption shows a much more direct relationship with GDP, as it followsa linear pattern with a slight inflexion at the end of the seventies, when more efficient carsentered the market, particularly in the US ;
• electricity-GDP relationship is in fact very near to a straight line at world level, with anelasticity very near or slightly superior to unity, in spite of the crises and profound changesin the world economy and energy system since the early seventies.
This analytical framework at least provides a series of benchmarks for the ex-post analysis ofsectoral energy demand projections. As the relationships between GDP and Energy Serviceslook robust, it is possible to compare the aggregated results of bottom-up models with the pastevolutions
(stationary fuel use - SFU ; transport fuels - TRA ; electricity - ELT)
0
1000
2000
3000
4000
5000
6000
7000
0 10000 20000 30000 40000 50000 60000 70000 80000 90000 100000
SFU
TRA
ELT
SFU
Projection(1992-2030)
Data(1971-94)
Figure 2-7: Three energy sevices as a function of GDP, past and future.

Energy Technology Strategy 1995-2030: Opportunities from the Global Warming Threat 34
1992 2000 2010 2020 2030GDPPOP NOAM 21,4 23,9 28,7 33,7 38,5SFUPOP NOAM 2,644 2,814 2,700 2,567 2,453GDPPOP WEUR 14,5 15,9 19,7 23,5 27,3SFUPOP WEUR 1,309 1,385 1,455 1,450 1,416GDPPOP PACO 18,3 20,7 26,1 30,3 34,1SFUPOP PACO 1,318 1,387 1,454 1,458 1,431GDPPOP EEUR 4,8 5,5 7,3 9,8 11,7SFUPOP EEUR 1,142 1,032 1,043 1,123 1,116GDPPOP FSUN 5,6 5,4 7,4 10,1 12,5SFUPOP FSUN 2,151 1,398 1,270 1,414 1,516GDPPOP CSAM 5,6 6,3 8,6 11,5 14,3SFUPOP CSAM 0,539 0,589 0,677 0,747 0,774GDPPOP SOAS 1,2 1,4 2,0 2,8 4,0SFUPOP SOAS 0,169 0,196 0,223 0,275 0,335GDPPOP SEAS 3,5 4,6 6,6 8,9 11,4SFUPOP SEAS 0,437 0,546 0,634 0,707 0,759GDPPOP COAS 2,4 4,0 6,7 9,5 12,6SFUPOP COAS 0,420 0,574 0,793 0,956 1,104GDPPOP NAME 4,5 4,7 5,4 6,8 8,6SFUPOP NAME 0,483 0,511 0,518 0,546 0,594GDPPOP SSAF 1,3 1,2 1,3 1,6 1,9SFUPOP SSAF 0,276 0,275 0,263 0,276 0,295GDPPOP WRD 5,1 5,8 7,4 9,2 11,0SFUPOP WRD 3731 4282 5143 6088 6996
0,000
0,500
1,000
1,500
2,000
2,500
3,000
0,0 5,0 10,0 15,0 20,0 25,0 30,0 35,0 40,0
NOAM
WEUR
PACO
EEUR
FSUN
CSAM
SOAS
SEAS
COAS
NAME
SSAF
Figure 2-8: Energy Services per capita / GDP per cap, Stationary Fuel Use.
1992 2000 2010 2020 2030GDPPOP NOAM 21,4 23,9 28,7 33,7 38,5TRAPOP NOAM 1,990 2,064 2,011 1,966 1,937GDPPOP WEUR 14,5 15,9 19,7 23,5 27,3TRAPOP WEUR 0,748 0,793 0,868 0,937 1,004GDPPOP PACO 18,3 20,7 26,1 30,3 34,1TRAPOP PACO 0,792 0,850 0,933 0,993 1,053GDPPOP EEUR 4,8 5,5 7,3 9,8 11,7TRAPOP EEUR 0,236 0,231 0,267 0,311 0,340GDPPOP FSUN 5,6 5,4 7,4 10,1 12,5TRAPOP FSUN 0,526 0,399 0,505 0,654 0,783GDPPOP CSAM 5,6 6,3 8,6 11,5 14,3TRAPOP CSAM 0,278 0,312 0,413 0,537 0,654GDPPOP SOAS 1,2 1,4 2,0 2,8 4,0TRAPOP SOAS 0,031 0,035 0,043 0,057 0,078GDPPOP SEAS 3,5 4,6 6,6 8,9 11,4TRAPOP SEAS 0,177 0,214 0,273 0,340 0,416GDPPOP COAS 2,4 4,0 6,7 9,5 12,6TRAPOP COAS 0,043 0,100 0,230 0,350 0,520GDPPOP NAME 4,5 4,7 5,4 6,8 8,6TRAPOP NAME 0,341 0,344 0,344 0,383 0,455GDPPOP SSAF 1,3 1,2 1,3 1,6 1,9TRAPOP SSAF 0,057 0,053 0,050 0,056 0,066GDPPOP WRD 5,1 5,8 7,4 9,2 11,0TRAPOP WRD 1621,5 1901,3 2443,7 3096,8 3923,3
0,000
0,500
1,000
1,500
2,000
2,500
0,0 5,0 10,0 15,0 20,0 25,0 30,0 35,0 40,0
NOAM
WEUR
PACO
EEUR
FSUN
CSAM
SOAS
SEAS
COAS
NAME
SSAF
Figure 2-9: Energy Services per capita / GDP per cap, Transport

Energy Technology Strategy 1995-2030: Opportunities from the Global Warming Threat 35
1992 2000 2010 2020 2030GDPPOP NOAM 21,4 23,9 28,7 33,7 38,5ELTPOP NOAM 0,961 1,053 1,225 1,386 1,506GDPPOP WEUR 14,5 15,9 19,7 23,5 27,3ELTPOP WEUR 0,401 0,428 0,529 0,625 0,721GDPPOP PACO 18,3 20,7 26,1 30,3 34,1ELTPOP PACO 0,533 0,596 0,735 0,835 0,926GDPPOP EEUR 4,8 5,5 7,3 9,8 11,7ELTPOP EEUR 0,222 0,208 0,251 0,322 0,366GDPPOP FSUN 5,6 5,4 7,4 10,1 12,5ELTPOP FSUN 0,359 0,295 0,335 0,422 0,494GDPPOP CSAM 5,6 6,3 8,6 11,5 14,3ELTPOP CSAM 0,100 0,120 0,181 0,263 0,343GDPPOP SOAS 1,2 1,4 2,0 2,8 4,0ELTPOP SOAS 0,020 0,028 0,041 0,065 0,100GDPPOP SEAS 3,5 4,6 6,6 8,9 11,4ELTPOP SEAS 0,066 0,094 0,146 0,209 0,278GDPPOP COAS 2,4 4,0 6,7 9,5 12,6ELTPOP COAS 0,045 0,074 0,129 0,180 0,241GDPPOP NAME 4,5 4,7 5,4 6,8 8,6ELTPOP NAME 0,097 0,112 0,154 0,221 0,312GDPPOP SSAF 1,3 1,2 1,3 1,6 1,9ELTPOP SSAF 0,031 0,031 0,035 0,048 0,068GDPPOP WRD 5,1 5,8 7,4 9,2 11,0ELTPOP WRD 0,158 0,169 0,209 0,255 0,305
0,000
0,200
0,400
0,600
0,800
1,000
1,200
1,400
1,600
0,0 5,0 10,0 15,0 20,0 25,0 30,0 35,0 40,0
NOAM
WEUR
PACO
EEUR
FSUN
CSAM
SOAS
SEAS
COAS
NAME
SSAF
Figure 2-10: Energy Services per capita / GDP per cap, Electricity
To summarize, the relevant facts within the power sector the technology will be faced to are theprogressive gasification of power generation, the coal-expansion in developing countries andthe diminishing of hydroelectric resources market share. Growing final energy uses areelectricity (increasing at a particularly high growth rate in developing countries) and transport(expanding faster than GDP almost everywhere, both for passenger and freight,)
2.3 Changes in the EU electricity markets: the movingtowards liberalization
The European power market liberalisation, as a prerequisite for the construction of the InternalEnergy Market is an essential issue to be analyzed due to mutual implications with the currentstudy of the dynamics of power generation technologies and the related European energytechnology policy.
Several questions may arise when dealing with these issues. In particular, it should be importantto determine to which extent will the market be deregulated, in order to guarantee thatcompetition does induce a fall in energy and electricity prices and increase the global economicsurplus. Exploring the conditions that are necessary for the liberalisation to lead to a sustainableenergy scheme (which may include environmental-friendly new power technologies) is also anecessary analysis to be conducted. Along an institutional line of thought, the newresponsibilities and the acting margins of the market regulator and the national governments isstill unclear. The decentralisation process, which is supposed to come from the new competitiveconditions, could provide some “niche” markets for renewables in order to enter the electricitygrid on a competitive basis. Establishing the appropriate basis for this to happen is one of themain responsibilities of the future regulator at the EU level.

Energy Technology Strategy 1995-2030: Opportunities from the Global Warming Threat 36
There is a clear distinction between issues related to liberalisation from those concerningprivatisation . Essentially of different nature, they appear to be mutual prerequisite along theconstruction of the internal energy market. Indeed, as happened in the UK, the overall effects ofthe liberalisation of the market can not be assessed until the utilities are privatised and themarket re-regulated accordingly. Passing from a public ownership to a private one doesconstitute only the first step of the liberalisation process, that could, in some cases, be skipped ifthe boundary conditions suggest so. Indeed, the question of ownership is only a minor (althoughimportant) part in the overall electric power restructuring: the key questions concern the actualmarket mechanisms, i.e. who are vendors and buyers, what is traded, what are the rules forwholesale and bilateral contracts, and how the transmission channels are priced and managed.
While looking at the liberalisation of the power generation industries in Europe and the potentialimpact on the distribution of the market shares corresponding to the relative technologies,several factors have to be emphasised. The issue concerning the different new industrystructures is crucial, that is the degree to which the market may be liberalised, from thegeneration activities to the distribution ones. Second, the issue of the trading mechanisms andprice formation is determined to a large extent by the type of industrial organization (and vice-versa). Third, the new role of the regulator along this liberalisation process must be assessed.Finally, the potential effects of this process on the technological mix for power generationshould be analysed.
2.3.1 Possible industry structures
Natural monopolies are mainly due to the presence of economies of scale along the entire rangeof the cost curve. In such a circumstance, it is optimal to allow the production of a good to bemet by only one firm while it could, on the other hand, exclude from the marketplace somealternative production technologies. The arguments in favour of the liberalisation and aEuropean competitive energy market are then to be found in the dramatic increase of thedemand curve that each national utility is faced to, as a result of the aggregation of the singlenational demands induced by the creation of the single electric power market. As a result of this,national companies that used to operate under a monopolistic scheme as the cheapest solutioncan be considered as price-taking companies in the unified market, since the European demandsize clearly overtakes the supply capacity of any producer. The growth of independent powergenerators in some of the markets that have been already liberalized, shows that thedisappearance of economies of scale potentials due to the demand increase as well as thediffusion of new technologies allowing for no scale economies loss in decentralised production,no longer justify the view of this activity as a natural monopoly.

Energy Technology Strategy 1995-2030: Opportunities from the Global Warming Threat 37
EU Total Power Demand
Domestic Power Demand
National MonopolyCost Curve
ECU/Kwh
Kwh
Figure 2-11: Electric power demand.
Electric power may be considered as a product from the generator’s optic, but its transmissionthrough the network is a service provided by grid managers. There are several new models ofmarket organisation in which these activities are separated and propose alternative organisationsto the current one. Four generic potential future market structures are distinguished according to“how much” competition is introduced into the marketplace.
• The first structure is the current one in most EU countries, that is a legally establishedmonopoly within a fully vertical-integrated industry: regional monopolies operate providingthe power supply service to all customers. There is no accounting separation betweengeneration, transmission and retail distribution.
• The second structure foresees competition in generation. A single purchasing company hasthe monopoly on transmission networks, and acts as a monopolistic seller to finalconsumers. However, this firm buys under a monopsonistic scheme from a number ofdifferent generators according to an appropriate bidding scheme to encourage competition.The access to the transmission lines is not given to independent power producers.
• The third possible structure supposes competition in generation and in wholesale supply.Under this scheme, distribution companies buy electricity directly from the generators andsupply it to final consumers over a transmission network. Some retail sellers can also buydirectly to power producers. Open access to the transmission grid is allowed, although localretail companies still retain the monopoly over final consumers: there is competition ingeneration and in distribution.
• The fourth potential structure supposes full retail competition and direct access to the grid.Under this scheme, there is full competition in power generation, distribution and retail sale.The customers can choose their suppliers which have open access to the wires.
The possible industrial organization schemes are summarized in the following figure (Hunt andShuttleworth (1996)).

Energy Technology Strategy 1995-2030: Opportunities from the Global Warming Threat 38
Generator
PurchasingCompany /Wholesaler
Distributor /Retailer
Final Consumer
Generator Generator
PurchasingCompany /Wholesaler
Distributor /Retailer
Final Consumer
Generator Generator
PurchasingCompany /Wholesaler
PurchasingCompany /Wholesaler
Distributor /Retailer
Final Consumer
Distributor /Retailer
Final Consumer
Generator Generator
PurchasingCompany /Wholesaler
Distributor /Retailer
Final Consumer
Distributor /Retailer
Final Consumer
Model 1 Model 2 Model 3 Model 4
Figure 2-12: Possible industrial organization schemes.
When considering successively these models, the choice is moving each time closer to the finalconsumer. For them to work properly, the structure of the contractual arrangements amongst themarket actors has to be of different nature. It must be emphasised that the issue of the economiesof scale is fundamental, since the persistence of economies of scale in generation would lead tomaintain a monopoly market structure. Moreover, the benefits of standardisation and ofcentralised programs may constitute scale economies of sufficient significance to outweigh thebenefits of competition.
It should be noticed also that the structure of the current national electric markets is highlycontrasted and it may influence extensively on the negotiation of the power generation industrystructure. Since the generation business may no longer be a natural monopoly, attention is highlyfocused on the transmission business. These activities remain a natural monopoly and are offirst-order importance since the system flexibility as well as the degree of competition strengthwill depend on the grid access tariffs.
2.3.2 Contracts and prices
When looking to the possible future structure of electricity markets, two main contract typesmay emerge for electricity business: the first one, closer to the former situation, is based onbilateral contracts between generators and consumers. These contracts are scheduled on a long-term basis and will include interruptibility, risk sharing and operating penalties. Needless to say,this is a system where the installed capacities of the generating companies have a fundamentalstrategic role. The second approach consists of the creation of a true spot market for electricity,where the price is formed according to the instantaneous market conditions on a, say, 15minutes basis.

Energy Technology Strategy 1995-2030: Opportunities from the Global Warming Threat 39
These schemes actually just reflect the dual nature of the electricity business: from one side, thecapital-intensiveness of the industry is willing to search for long-term stability. On the otherhand, the physical characteristics of the ‘commodity’ delivered urges for a short-term marketmechanism able to make demand and supply match instantaneously. The fact that all the productmust flow through the same delivery/accounting/balancing system makes electricity basicallydifferent from most other commodities.
The situation that is likely to happen will indeed share both types of approaches: an efficiencymarket will have contract and spot trading. An independent company, referred to either as poolcompany (if it operates under a spot market basis) or as independent system operator (ISO) maytake in charge the management of the grid and the overall system. The functions of the ISO,participated by the involved market actors, may include the maintenance of the instantaneoussystem-wide energy balance, the provision of ancillary services, and, above all, the managementof the grid congestion. Note that, in the more general case, the spot price coexists with a numberof different prices agreed for the bilateral contracts.
Under the pool approach, the pool receives bids from the generating companies, and the spotprice formation process takes place when comparing these bids with the hourly-measured loadcurves. The bilateral contracts scheduled need to be communicated to the ISO, which ultimatelymay decide on the feasibility of the arrangements on a day-to-day basis: the transmission rightsdelivered by the ISO need to take into account all other transactions scheduled for the sametime. The main role of the ISO under a multi-bilateral contracts approach is to optimizedispatching flows.
The single-buyer model (described in the previous paragraph as model 2) requires long-termcontracts between the buyer and the competing independent power producers, therefore allowingfor capital insurance for the duration of the contract. The risk of cheaper new entrants isminimized and conveyed, via higher prices, towards the customers, who, on the other hand,have to face a relatively stable supply curve.
On the contrary, models 3 and 4 are supposed to operate more under a spot-price scheme. Themarket is more competitive, since risk is mainly assumed by the agents that take thecorresponding decisions: in a word, the technology risk is fully assumed by the generators, whoautonomously decide upon their own generating park. In this case, the possibility of guidancefrom the regulator according to an energy technology policy diminishes.
Under these circumstances, peak energy prices may be quite high, because it is likely that theavailability of reserve capacity will be lower. As a consequence, there will be objectiveincentives for a flattening of the daily load curve.
However, the picture is not complete. To fulfill the demand increase between baseload andpeakload, utilities may buy electricity from other power sources, or may use the next availablepower plant. Under a more competitive scenario, the reserve installed capacity tends inexorablyto decrease. Many old power plants are considered stranded costs, because they will be put outof service only with partial investment recovery. During severe peaks, utilities are likely to asksome large consumers to interrupt the consumption (or at least to lower the voltage to reducepower), or to purchase high valued electricity from the neighbouring generators, trying to‘export’ the risk (and the cost to operate additional high-cost generation capacity) of brownoutor blackout. Nevertheless, under a competitive reserve requirement system, i.e. when the
Energy Technology Strategy 1995-2030: Opportunities from the Global Warming Threat 40
regulatory authority specifically asks for some installed reserve to be operative, capacity mayhave a separate market value.
2.3.3 A changing role for the regulator
Even in a competitive energy market, government policies and regulation stay of first-orderimportance for reaching the desired reasonable degree of competition and prevent distortedcompetition. Since the power industry transition is starting in many countries from a monopolyposition of the unique power generation utility, much will have to be done to this respect.Besides this, the European governments have committed themselves to prevent environmentdegradation and, particularly, to reduce CO2 emissions. The measures permitting to achievethese targets (CO2/energy tax, the endogeneisation of the externalities of the conventionaltechnologies in the costs calculation of the electricity produced by kWh, the diffusion ofrenewables, specific R&D efforts) are expected to be (and remain) mainly policy-driven andhave immediate effects onto the choices made within the power sector. This constitutestherefore a room for public power intervention in the future energy competitive market that hasto be carefully assessed by the regulatory authority.
Based on the past experience of UK and Norway, the functions of the regulator have beenreinforced as well as adjusted. Indeed, while the old functions of controlling the naturalmonopoly in terms of investments, prices and consumers’ protection, must be redefined, somenew functions emerged related to the competition control. While, in principle, the long-termplanning and coordination as well as the public service obligation are not any more underregulator responsibilities, the competitive rules stated should give anyway incentives for long-term view and environmental constraints respect.
In addition to this role of correcting externalities effects on prices and, therefore, formation ofcorrect price signals, the regulator may have to integrate also strategic, long run views in orderto shape the capacity planning which will be decided by producers on the basis of mainly theshort run total production costs: indeed, the achievement of a environmentally sustainable andcompetitive power generation industry may integrate these long term issues related to thedepletion of the European and world-wide reserves (oil, coal and gas), to the CO2 targets and tothe supply security.
For what concerns green electricity, the new power technologies, and especially the renewables,need to gain the economic and technical confidence within the producers and must overcome thecurrent price-distorted competition taking place with the conventional energy technologies. Theexternal costs internalisation appears as a fundamental way to achieve this target.
This is why an appropriate assessment of the effects of the competitive energy market on thepower generation technologies dynamics appears in fine essential in order to give quantitativeestimations of the proposed policy options.
The experience in the UK and Norway shows that the patterns of ownership within the industryafter a massive restructuring are far from being definitive. This simply reflects the fact that theincentives to form vertically-aggregated power monopolies have not completely disappeared.These strategic movements could prevent market-wide liberalisation as well as the necessary

Energy Technology Strategy 1995-2030: Opportunities from the Global Warming Threat 41
technology renewal. Amongst the regulator’s new tasks, a permanent monitoring of the marketstatus and the capital movements amongst the players will be of crucial importance, in order toavoid the formation of trusts that could have a price-determining power.
2.3.4 The new technology mix
It is widely acknowledged that a deregulated electricity market (at least in generation) will leadthe investors to choose lower capital cost technologies, which allow for more flexibility, lowerconstruction time and therefore more efficiency. The natural gas based power technologies arethen the best-placed candidate. However, possible uncertainties in gas prices may limitsomehow the foreseen huge diffusion of the natural gas for power generation.
The technological evolution within the power market must be analysed with particular care inorder to explain the current tendency towards competition and decentralisation. It has beenalready noted above that the demand curve shift gives an opportunity to introduce competitioninto the market. It should be noticed that the reasons for the establishment of competitivemarkets is not only to be found in the assumption of a depletion of the economies of scale ingeneration activities because of an increase of the demand. What also happens is that newtechnologies, like the latest gas turbines, provide the opportunity to decentralise the powerproduction without any significant losses compared to the centralised system and to invest inless capital-intensive technologies. Therefore, the potential situation of a small-scale powerproduction scheme gives the opportunity to introduce more competition. Nevertheless, theeconomies of scale associated with traditional large baseload power generation technologies arenot exhausted yet, and, considered separately, will continue to operate in the decreasing branchof the cost curve.
An additional important issue is the future trends and direction of R&D expenditures which willbe induced by the liberalisation of the market. According to recent studies on the powergeneration sector privatisation in UK in 1991 (J.A. Walker (1996)), it appears that the R&Dtrends following the liberalisation shows a general increase of the customer-orientedexpenditures. Indeed, R&D expenditures concerning the generation and the protection of theenvironment are decreasing to the benefit of the distribution, utilisation and commercial ones.Short-term planning of R&D may reveal drawbacks since it may leave apart long-term issueslike global warming.
The resulting technological mix of the power market may also be extensively influenced by thecontracts and joint-ventures currently set up by the old utilities with other ones in Europe and inthe U.S., in order to prepare and prevent the competitive pressure which will arise in theforthcoming years. The re-monopolization of the industry could preclude the introduction ofsuperior new technologies competing with the conventional ones currently used by the utilities.
2.3.5 Managing the grid
Industry liberalisation, introducing competition and efficiency from one side, has some otherundesired effects that should be internalized. The power distribution system will probably be

Energy Technology Strategy 1995-2030: Opportunities from the Global Warming Threat 42
much harder to control and manage than it is under the classical, vertically-integrated utilityconcept. In a competitive energy market, market clearing and reliability would ultimately (andonly) be guaranteed by the flexible and rational response from customers to price signals,without the need for administratively determined installed reserve. How reliable may be the‘rational’ behaviour of the demand side is therefore an extremely important issue that needs tobe addressed.
The technologies that may help in the ensuring grid stability are based in computer controlledcommunications, and are about to be ready. Market forces may ignore them if they are notcommitted to do it. It seems that the evolution of the grid should not be left to the market forcespush without having established clearly who is responsible for the grid reliability (or, to put it inother words, who has the property right for safe use of the grid) and therefore having created theconditions and the incentives for these new technologies to fully develop.
The grid ownership and the transmission regulation are likely to become the key factors thatcould lead to a position in which renewable energy technologies penetrate the market.Specifically, if marginal price rule for transmission services is applied, the less flexiblegeneration technologies may be penalised. This would play not only against large, centralisednuclear or coal power stations, but also possibly against renewables, although usually moredivisible.
However, the importance of total network costs prevent to apply this rule, which may beadjusted in order to give price-premium to “green” electricity producing technologies.
The overall aim of the regulator should be therefore to achieve the short-term optimality inprices as well as a long-term sustainable energy scheme.
2.4 Future energy technology markets and EUcompetitiveness
It has been underlined that no massive expansions in the electricity demand nor in primaryenergy consumption have to be expected in Europe in the forthcoming decades. If carbonemissions have to be reduced, this reduction should take place by improving the energyconversion and use that is already being demanded rather than managing additional increments.Energy technologies could be oriented along the gas line, including not only advancedimprovements in traditional equipment (gas turbines, combined cycles), but also innovativeexploitation schemes (fuel cells, etc.), as well as around renewables (wind, solar, biomass..), andenergy efficiency and energy saving measures.
The market for fossil fuel technologies in many parts of the developing world is expanding at avery rapid pace, but priorities are somehow different. Countries with large fossil fuel resourcesand with rapidly growing electricity demand are likely to decidedly go for fossil-fuel-basedelectricity in the next decades. The typical cases of such a situation are China and India. Thesecountries, possessing huge coal reserves, are endeavouring a massive construction of coal-basedpower plants to fulfill the electricity demand accompanying a very rapid economic development.Only in China, more than 200 GW of new coal-fired capacity is projected up to 2010. This

Energy Technology Strategy 1995-2030: Opportunities from the Global Warming Threat 43
would imply the installation of 10-20 new 1000 MW power plants per year. The estimated costsof this capacity expansion have been estimated around US$ 200 billion.
The electrification pattern is, therefore, moving towards a reduction of the capital/variable costratio in the developed world (with the exception of renewables), whereas this ratio is likely toremain constant or even grow for those developing countries having cheap fossil fuels. Havingpassed already through this stage of development of the electric industry, these trends open avery good opportunity for European capital equipment suppliers, which have exhausted theexpansion possibilities of their domestic market. The European energy technologies can offer tothe developing countries the additional advantage of having been designed already includingmany environment-friendly issues: the reliability is high, the conversion efficiency is higher thanthe average performance, acid emissions are lower. Therefore, possible future bindingsconcerning environmental restrictions could be easy to fulfill by these countries if they select theadvanced technologies offered by the European industry. Two main drawbacks may weaken theEU position on this issue: first, the competition of local manufacturers, and second, thecompetition of other advanced countries. For what concerns the former, the difference of thecapital costs may be very large: Chinese domestic coal-firing technology could cost even 50%less than technology imported from the industrialized countries, and, in order to limit thebalance of payments deficit, Chinese authorities may be willing to limit the share of coal-basedpower generation equipment imports. In addition, less advanced technology would require lessskilled staff and lower operation and maintenance costs. The possibility of losing the market foradvanced coal technologies because of the US competence should not be disregarded, evenconsidering the leading role of EU manufacturers in such technologies. The main reason is thatcoal has a brighter future as a power-oriented fuel in the US than in the EU (at least in the shortterm). This creates a dynamic domestic market in the US that is missing in the EU, motivatednot only by the higher environmental consciousness of the EU public opinion, but also becauseof the cheaper domestic coal price in the US.
In order to overcome these difficulties, efforts should be made by the EU manufacturers tomaintain an adequate degree of competitiveness. To achieve this, imaginative jointimplementation schemes should be set up in order to produce incentives for the developingeconomies to adopt the advanced technologies. The production of the capital equipment couldbe transferred to the concerned countries: benefits for the European companies should also arisebecause of the cheaper labour costs. An adequate approach to technology transfer, via theformation of risk-sharing joint enterprises is therefore mandatory to preserve the future of theEuropean fossil-fuel power equipment industry.
For what concerns new technologies, and more precisely, renewables, the European relativeposition changes depending what type of technological branch is considered. During the late80’s and early 90’s, Europe has gained advantage with respect to the USA within the windpower generation field, not only in installed capacity terms, but also regarding equipmentmanufacturing capacity. Off-shore wind plants have started to be considered in some parts of theEU as an alternative to provide power to remote coastal areas (mainly in Germany, Denmark,UK and the Netherlands). On the contrary, the leading solar-based initiatives have been andremain out of Europe, even if remarkable efforts have been made by governments andindustrialists to shift this situation. Photovoltaic power has not yet reached the operativity levelof wind turbines, in terms of equipment costs, and the most salient solar thermal initiatives and

Energy Technology Strategy 1995-2030: Opportunities from the Global Warming Threat 44
demonstration plants are outside the EU (USA, Israel, Australia). The importance of creating,via legal instruments or other type of public intervention, a domestic market large enough toproduce incentives for firms to innovate and compete for the largest share is, for newtechnologies, even more important than for conventional power generation schemes. Indeed, atthe very beginning of a technological outburst, the possible technology paths are still unclear,and the earnings of early adopters motivated by setting references, procedures and standards, aswell as by generating skills and exportable know-how may be huge.

Energy Technology Strategy 1995-2030: Opportunities from the Global Warming Threat 45
Chapter 3: Carbon Removal, Fuel CycleShift and Efficiency Measures: a
Sectoral Viewby L. Schrattenholzer and N. Akutsu, IIASA
The Intergovernmental Panel on Climate Change (IPCCa 1996) distinguishes betweentechnological options and policy measures. The dividing line between the two is fuzzy becausetechnological options stand behind most policy measures. (The only other major source ofemission reductions is consumer behavior.) In this report, we focus on technological measures,but we discuss policies and consumer behavior where we think it influences our analysis in animportant way.
There is a close interplay between technological possibilities, policies, and consumer behaviorin situations in which recipients of benefits are different from those who carry the costs. Aprominent example of this is the construction of a residential facility with rental units. Here, thecosts of effective insulation are borne by the owner, who has an incentive to keep constructioncosts low. The benefits in the form of reduced expenditures for room heating and coolingaccrue to the tenants. Whenever market rates for rents do not properly reflect efficientinsulation costs, the incentive for reaching an overall economic optimum by high levels ofinsulation is low. The policy response to this and similar problems is standard setting. In theU.S., it is estimated that the National Appliance and Energy Conservation Act (NAECA) whichestablishes residential appliance standards during the period 1995–2015 will yield an overall netbenefit of US$60 billion (IPCC 1996b).
Another important distinction can be made between measures that are taken solely in responseto the threat of global climate change and those that represent a simple continuation of historicaltrends in technological progress. The latter is often referred to as dynamics-as-usual (DAU).Distinguishing between these two kinds of measures is conceptually important but beyond thescope of this chapter. To illustrate the difference between the historical trend of carbon intensityand “conventional wisdom,” we show, in Figure 3-1 the average global carbon intensity since1850 and ranges CO2 projections under different scenarios.
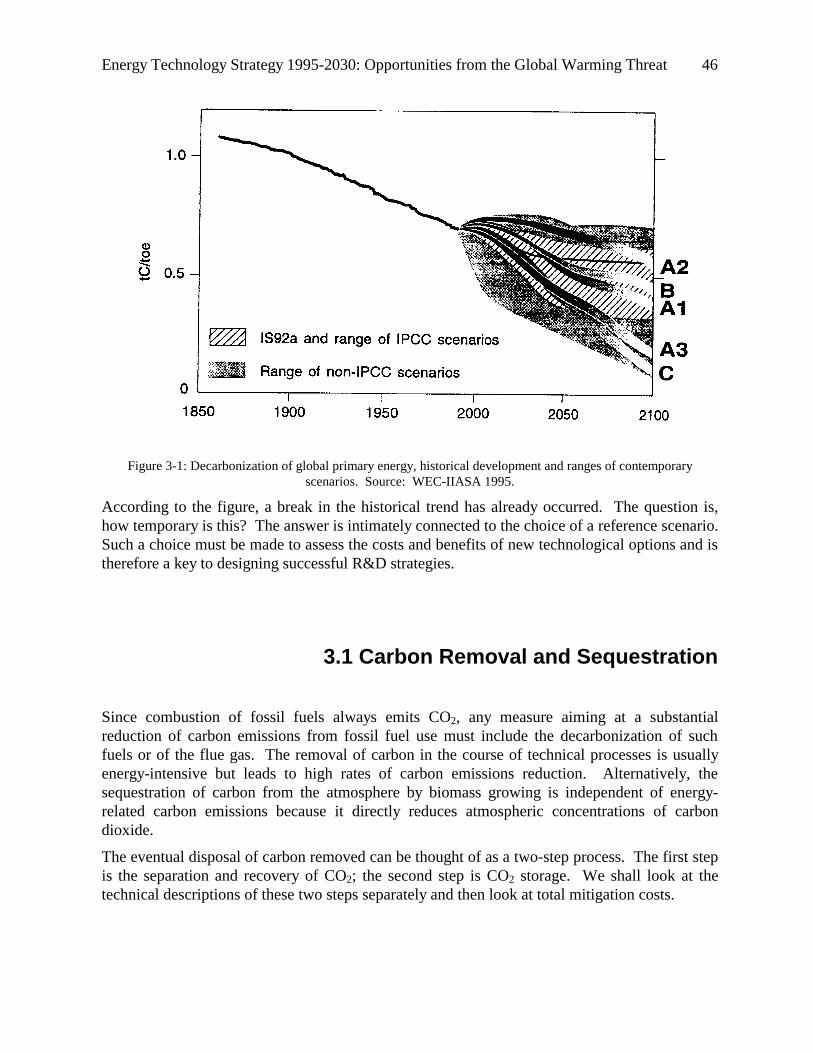
Energy Technology Strategy 1995-2030: Opportunities from the Global Warming Threat 46
Figure 3-1: Decarbonization of global primary energy, historical development and ranges of contemporaryscenarios. Source: WEC-IIASA 1995.
According to the figure, a break in the historical trend has already occurred. The question is,how temporary is this? The answer is intimately connected to the choice of a reference scenario.Such a choice must be made to assess the costs and benefits of new technological options and istherefore a key to designing successful R&D strategies.
3.1 Carbon Removal and Sequestration
Since combustion of fossil fuels always emits CO2, any measure aiming at a substantialreduction of carbon emissions from fossil fuel use must include the decarbonization of suchfuels or of the flue gas. The removal of carbon in the course of technical processes is usuallyenergy-intensive but leads to high rates of carbon emissions reduction. Alternatively, thesequestration of carbon from the atmosphere by biomass growing is independent of energy-related carbon emissions because it directly reduces atmospheric concentrations of carbondioxide.
The eventual disposal of carbon removed can be thought of as a two-step process. The first stepis the separation and recovery of CO2; the second step is CO2 storage. We shall look at thetechnical descriptions of these two steps separately and then look at total mitigation costs.

Energy Technology Strategy 1995-2030: Opportunities from the Global Warming Threat 47
3.1.1 Separation and Recovery Processes
Several CO2 separation and recovery processes are considered for the energy conversion sector.Most of them have already been applied in industrial processes of CO2. Figure 3-2 summarizesthese options.
High molecular membraneLiquid membraneMembrane+absorbent
Combustion in O2/CO2 mixture
CO2 separation/recovery
Absorptionprocess
Adsorptionprocess
Membraneseparationprocess
Cryogenicseparationprocess
Direct recoveryprocess
Physicalabsorption
Chemicalabsorption
Pressure swing adsorptionTemperature swing adsorptionPressure and teperature swingadsorption
Figure 3-2: The main processes of CO2 separation and recovery.
Chemical Absorption Process
Absorption of CO2 is used in chemical plants for the commercial production of CO2. Currentdemand for CO2 is small in comparison with total emissions in the global power sector. As acountermeasure against global warming, chemical absorption would have to be introduced at amuch larger scale. Generally, it is thought that a regenerable amine scrubber is the bestcandidate for CO2 removal schemes. Many absorbents have been proposed for this process, butthe mono-ethanol-amine (MEA) process is the most widely used, owing to its high absorptioncapacity. Recently, researchers have reported the development of new, high performanceabsorbents. Mimura et al. (1994) developed sterically hindered amines (SHAs) and tested themin a pilot plant. They found that the power reduction due to CO2 absorption is about 8 percentwhen this process is used to reduce CO2 emissions from 270 to 25 tons per hour at a power of600 MW. In contrast, conventional absorbents reduce the output by 28 percent.
Other absorption processes in operation or in the planning stage include Statoil’s Sleipnerproject (IEA, 1996) in which CO2 is separated from natural gas. Here the main purpose is

Energy Technology Strategy 1995-2030: Opportunities from the Global Warming Threat 48
purification. In addition, there are a few research plants for CO2 separation by the same processin Japan. Romania has also been conducting pilot plant tests and plans the construction of ademonstration plant.
Physical Absorption Process
Physical absorption processes are studied mainly in Europe and in the U.S.A. (Perry and Green1983 and DOE 1993). The process uses either organic (e.g., dimethylether sulfolane) orinorganic (e.g., water) absorbents. Absorbents are regenerated by reducing pressure and heatingabsorbents in the regenerator. Research on this process is still theoretical and on a laboratoryscale. This method is not expected to be superior to the chemical absorption process for today’satmospheric combustion processes. However, for pressurized combustion processes, thismethod has an advantage because it involves high-pressure gases. Also, physical absorptionprocesses may turn out to be cheaper than the chemical absorption process in coal gasificationplants.
Direct Carbon Recovery by Combustion in an O2-CO2 Mixture.
In the Netherlands, one focus of research is CO2 removal from ICGCC (Integrated CoalGasification Combined Cycle) power plants. Using a technology that is still to be developed,gaseous fuel can be combusted in a mixture of oxygen and recycled CO2. Such CO2-saving gasturbines could lead to specific CO2 emissions as low as 5g/kWh, but development of theturbines could be costly (Turkenburg 1995).
Physical Adsorption Process
The main advantage of physical adsorption over chemical or physical absorption is its simple and energy-efficientoperation and regeneration, which can be achieved through a temperature swing or pressure swing cycle. The
primary adsorption material under consideration is zeolite. Adsorption can be divided into three principal methodsshown in Table 3-1: Classification of Physical Adsorption methods.
.
Adsorption Desorption
PSA High pressure Low pressure
Low temperature Low temperature
TSA Middle pressure Middle pressure
Low temperature High temperature
PTSA High pressure Low pressure
Low temperature High temperature
Table 3-1: Classification of Physical Adsorption methods.
Research and development of adsorption processes has progressed furthest in Japan, where pilotplants have been built. Based on their research on pressure and temperature swing adsorption(PTSA), Ishibashi et al. (1995) reported that energy consumption of CO2 separation was 46
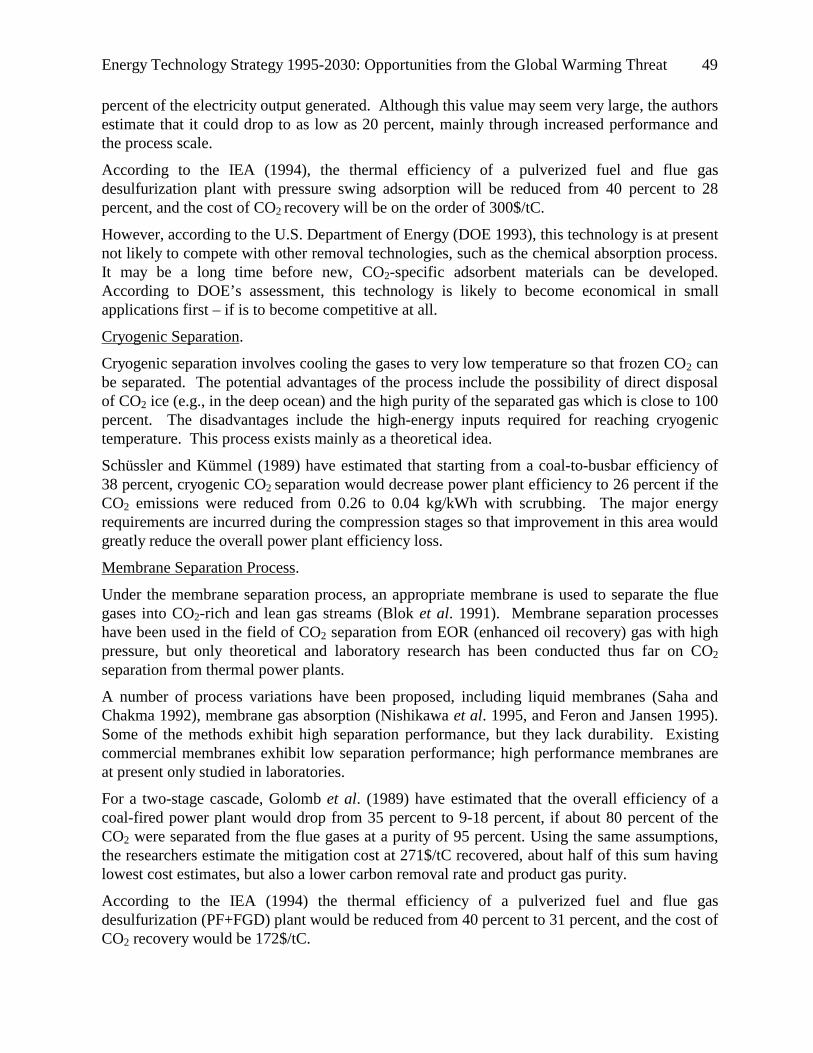
Energy Technology Strategy 1995-2030: Opportunities from the Global Warming Threat 49
percent of the electricity output generated. Although this value may seem very large, the authorsestimate that it could drop to as low as 20 percent, mainly through increased performance andthe process scale.
According to the IEA (1994), the thermal efficiency of a pulverized fuel and flue gasdesulfurization plant with pressure swing adsorption will be reduced from 40 percent to 28percent, and the cost of CO2 recovery will be on the order of 300$/tC.
However, according to the U.S. Department of Energy (DOE 1993), this technology is at presentnot likely to compete with other removal technologies, such as the chemical absorption process.It may be a long time before new, CO2-specific adsorbent materials can be developed.According to DOE’s assessment, this technology is likely to become economical in smallapplications first – if is to become competitive at all.
Cryogenic Separation.
Cryogenic separation involves cooling the gases to very low temperature so that frozen CO2 canbe separated. The potential advantages of the process include the possibility of direct disposalof CO2 ice (e.g., in the deep ocean) and the high purity of the separated gas which is close to 100percent. The disadvantages include the high-energy inputs required for reaching cryogenictemperature. This process exists mainly as a theoretical idea.
Schüssler and Kümmel (1989) have estimated that starting from a coal-to-busbar efficiency of38 percent, cryogenic CO2 separation would decrease power plant efficiency to 26 percent if theCO2 emissions were reduced from 0.26 to 0.04 kg/kWh with scrubbing. The major energyrequirements are incurred during the compression stages so that improvement in this area wouldgreatly reduce the overall power plant efficiency loss.
Membrane Separation Process.
Under the membrane separation process, an appropriate membrane is used to separate the fluegases into CO2-rich and lean gas streams (Blok et al. 1991). Membrane separation processeshave been used in the field of CO2 separation from EOR (enhanced oil recovery) gas with highpressure, but only theoretical and laboratory research has been conducted thus far on CO2
separation from thermal power plants.
A number of process variations have been proposed, including liquid membranes (Saha andChakma 1992), membrane gas absorption (Nishikawa et al. 1995, and Feron and Jansen 1995).Some of the methods exhibit high separation performance, but they lack durability. Existingcommercial membranes exhibit low separation performance; high performance membranes areat present only studied in laboratories.
For a two-stage cascade, Golomb et al. (1989) have estimated that the overall efficiency of acoal-fired power plant would drop from 35 percent to 9-18 percent, if about 80 percent of theCO2 were separated from the flue gases at a purity of 95 percent. Using the same assumptions,the researchers estimate the mitigation cost at 271$/tC recovered, about half of this sum havinglowest cost estimates, but also a lower carbon removal rate and product gas purity.
According to the IEA (1994) the thermal efficiency of a pulverized fuel and flue gasdesulfurization (PF+FGD) plant would be reduced from 40 percent to 31 percent, and the cost ofCO2 recovery would be 172$/tC.

Energy Technology Strategy 1995-2030: Opportunities from the Global Warming Threat 50
The Carnol System.
Researchers at the Brookhaven U.S. National Laboratory in the United States have developedthe so-called Carnol system. (For a detailed description, see Steinberg 1996). This systemcombines CO2 removal from coal-fired power plants with methanol generation. It thuseliminates the need for CO2 disposal. Part of the CO2 emitted is used for methanol production,and some of the carbon is separated in solid form during the process. As such, it can either bestored or sold. The proposed system also uses the waste heat from the methanol production todecrease the energy needs for CO2 extraction from the stack gases. Natural gas is considered tobe the most natural feedstock for methanol synthesis in the Carnol system, but biomass can beused if CO2 emissions are to be reduced further.
The general Carnol system consists of several variants, some of which include non-conventionalmethods. The future system costs after commercialization can only be estimated. Underfavorable conditions, the system could be economic even without credits for CO2 reduction.More conservative assumptions by the same author lead to reduction costs of $175 per ton ofcarbon (Steinberg 1996).
3.1.2 CO2 Disposal and Storage Processes
Carbon Sequestration.
The potential of carbon conservation and sequestration over the time period 1995–2050 isestimated to be somewhere between 60 and 86 billion tons (IPCCb 1996). This corresponds to10 to 14 times the global energy-related carbon emissions in the year 1990. Sequestering carbonin biomass immediately suggests the possibility of using this biomass as a primary energysource. Commenting this possibility, Hall (1994) concludes that “displacing fossil fuel withbiomass sustainably grown and converted into useful energy with modern conversiontechnologies would be more effective in decreasing atmospheric CO2 than sequestering carbonin trees”. Independent of this general conclusion, however, there are pilot projects in whichforestation projects are launched for the specific purpose of offsetting carbon emissions. One ofthe best known examples is that of AES (Applied Energy Services) in the U.S. AES contributestwo million dollars to a 10-year sustainable forest project in Guatemala to offset 378,000 tons ofCO2 emitted annually at a coal-fired power station in Connecticut. This project is an example of“Joint Implementation” with a specific cost of 0.10 $/tC to the power company.
Enhanced Oil Recovery.
The most appealing means of disposing of CO2 is to put the gas to productive use. For example,CO2 can be injected into oil fields, thus improving the oil recovery rate. At present oil prices,only inexpensive CO2 from natural sources is used for enhanced oil recovery in the U.S. CO2 istransported over distances of several hundred kilometers at a typical cost of $8/tC (IPCC 1996a).Based on estimates of future enhanced oil recovery of original reserves plus undiscoveredconventional oil by Masters et al., (1987, 1991), the global potential of using CO2 for enhancedoil recovery is approximately 80 GtC, assuming a 50 percent probability of discovery. Thebiggest part of this potential is located in the Middle East, followed by North America and the

Energy Technology Strategy 1995-2030: Opportunities from the Global Warming Threat 51
Former Soviet Union. However, this is a theoretical maximum. In the Second AssessmentReport of the IPCC (IPCCa 1996), a minimum potential of 20 GtC is estimated for this option.
Chemical Feedstock and Basic Materials.
CO2 is widely used as a feedstock by the chemical industry and has come under limited use as abasic material. In the chemical industry, most CO2 is used in the synthesis of urea. At present,this process uses little more than 10MtC per year. Other chemical uses include the productionof polycarbonates (Kemi 1987) and alcohol. After consumption and use, many of the chemicalsdegrade and release CO2. Existing processes are therefore not suitable as major carbon disposaloptions, and in order to dispose of high levels of CO2, it would be necessary to convert the CO2
to other materials.
One variant Steinberg’s Carnol process (described in the previous subsection) involves as a keydesign element the production and storage of solid-state carbon. It should therefore also beconsidered as a possible storage option.
Carbon Storage in Underground Reservoirs.
Certain kinds of underground structures, such as depleted oil and natural gas reservoirs,aquifers, natural salt domes, and excavated rock caverns can serve as CO2 reservoirs (Blok et al.1991). Of these, depleted oil and natural gas reservoirs and aquifers are the most importantoptions. The IPCC (1996a) estimates the storage potential of depleted oil and gas fields to be inthe range of 130 and 500GtC. Storage potential in saline aquifers could reach more than 90GtC.
Most of the studies involve only theoretical research, e.g., the estimation of storage capacities.However, the Norwegian company Statoil oversees a project at the Sleipner West field thatinvolves the separation of CO2 from natural gas containing 7.9 percent CO2. The recovered CO2is injected into the Utsira Salina Deep Aquifer. The main purpose of the separation is toincrease the purity of the natural gas. Statoil plans to inject 1 million tons of CO2 each year.Esso and Pertamina have also agreed to inject 6 billion tons of CO2 into the aquifer in theNatuna Sea in Indonesia.
Carbon Injection into the Shallow Ocean.
Haugan (1992) proposed a disposal method, which relies on density flow. This means thatseawater containing dissolved CO2, because of its greater density, settles down to the bottom ofocean. The seabed around Norway slopes gently downward. As CO2 is injected into theshallow ocean, it is absorbed by the seawater and it will flow downward into the deep ocean,much as a ball rolls down a slope.
Herzog and Adams (1995) proposed an idea of the droplet plume. Under this method, injectedCO2 will initially rise, owing to its greater buoyancy. After the CO2 is absorbed, however, theCO2-rich seawater with its higher density will move like a plume towards the seabed, enablingdeepwater storage of the CO2.
Carbon Injection into the Deep Ocean.

Energy Technology Strategy 1995-2030: Opportunities from the Global Warming Threat 52
Deep-ocean storage of CO2 was first proposed by Marchetti (1976). His original proposal wasto generate a “gigamixer” by injecting CO2 into sinking thermohaline currents that eventuallyreach the deep ocean bottom. This proposal combines the advantages of injection into shallowparts of the ocean with the advantage of the huge storage capacity of the deep ocean. Theconcrete proposal involved the Gibraltar subduction undercurrent, which would provide storagecapacity on the order of 10 billion tons of CO2 per year. Other sinking thermohaline currentsinclude the subduction currents of Bab-al-Mandab in the Red Sea, the Wedell Sea, and theNorth Atlantic.
In the absence of sinking currents, injection of CO2 into the deep ocean requires large-scalefacilities, such as tankers or floating platforms. This option is therefore more expensive thanstorage in the shallow ocean, but it offers an enormous increase in storage potential.
If injected at depths of about 3000 meters, CO2 exists as a negatively buoyant liquid, whichtends to sink to the sea bottom. Therefore, CO2 would form a negatively buoyant plume in theopen ocean (Nordhaus 1975).
Another disposal method is solidification of CO2. The resulting “dry ice” has a specific gravityof about 1.5. It is important in this scheme that the solid ice “torpedoes” are large enough toreach depths of at least 3 km so that the CO2 can continue to sink spontaneously even in liquidform. Based on preliminary field tests, cubes of 3 to 4 meters would sink below a depth of 3 kmbefore 50 percent of the CO2 is dissolved, thus yielding excellent sequestration potential.
The natural net flow of carbon from the surface to deep ocean waters is approximately twobillion tons per year. Once higher transport rates are available, the amount of CO2 injecteddirectly into the deep ocean can be greatly increased. The total storage potential is estimated tobe enormous. IEA (1994) estimates that the potential for CO2 stored as dissolved carbonate ion(CO3
2-) is 1440 GtC and an even more if the chemical reaction leading to the formation ofcalcium carbonate (CaCO3) sediment is taken into account.
Among the major outstanding uncertainties are the possible ecological effects of higherconcentrations of CO2 in the oceans and their effects on local chemistry in the vicinity of storagesites. According to the IEA (1994), the cost of basic disposal will be 4.1 $/t-CO2.
A potential problem with CO2 storage in the deep ocean – as well as with its storage in theshallow ocean – is the formation of solid clathrates. Upon release, they form sinking plumesand eventually settle on the ocean floor (Saji et al. 1992; Nishikawa et al. 1992; and Austivikand Loken 1992). A major uncertainty in this approach concerns the possibility that hydrateswill dissolve in seawater as they are transported within a plume or as they rest on the seabed.Experimental research is underway to study this problem and the dissolution of liquefied CO2 ingeneral, simulating CO2 concentrations in the ocean. So far, these are only theoretical studies,and empirical research is still required.

Energy Technology Strategy 1995-2030: Opportunities from the Global Warming Threat 53
3.1.3 Costs and Potentials of Carbon Sequestration, Removal, andStorage
To give a rough approximation of carbon reduction costs in the power sector, we reproduce, inFigure 3-3 the trend line derived by EC (1995), which is based on the relationship of carbonemissions to electricity generation costs.
Figure 3-3: Electricity costs and carbon emissions. Source: EC 1995.

Energy Technology Strategy 1995-2030: Opportunities from the Global Warming Threat 54
The trend line in Figure 3-3 corresponds to reduction costs of US $150 per ton of carbon. Notethat the trend line just approximates the relation between electricity costs and carbon emissions.The lowest cost in the figure has lower specific emissions than some higher cost options. Thismeans that the trend line is only indicative and that concrete reduction costs depend on theparticular situation, including the reference technology that applies in a given case.
For the chemical absorption method, Blok et al. (1989, 1991) have estimated the process costsand energy requirements in detail. The authors concluded that the efficiency of coal-fired powerplants decreases from 41 percent to 29.7 percent, if CO2 emissions are reduced from 230 g-C/kWh in the unabated case to 30 g-C/kWh with separation. The electricity costs wouldincrease by about 80 percent, resulting in CO2 mitigation costs of about $140/t-C removed.According to the IEA (1994), the thermal efficiency will be reduced from 40 percent to 29percent, and the cost will increase by 80 percent. These assumptions result in CO2 mitigationcosts of about $130/t-C removed in the case of 90 percent CO2 removal from flue gas of thepulverized coal-fired plant with flue gas desulfurization (PF+FGD). Both the reduction of thethermal efficiency and the costs of two sources are identical. This means that using aconventional absorbent will significantly increase primary energy demands for coal-fired power.
TechnologySpecific
abatement costs Potential ReferenceUS$/t C Gt C
Removal &sequestration
PF+FGD
IGCC
Chemical absorption 128 319 – IEA, 1994aPhysical absorption n.a. 84 – IEA, 1994aPhysical adsorption 308 751 – IEA, 1994aCryogenic separation n.a. 84 – IEA, 1994aMembrane separation 172 458 – Golomb et al., 1989Carnol system 0–175 – Steinberg, 1996O2/CO2 combustion 130–175 – Blok et al., 1995Forestation 6–30 – IPCC, 1996b
Disposal & storageEnhanced oil recovery 0 >20 IPCC, 1996bUndergroundreservoirs
11 130–500 IPCC, 1996a
Aquifers 7–30 90–2500 IEA, 1994bOcean disposal 4 1200> IEA, 1994b
TransportationPipeline, 1000km 32 IPCC, 1996a
Table 3-2: Summary of Costs and Potentials of Removal and Storage Options.

Energy Technology Strategy 1995-2030: Opportunities from the Global Warming Threat 55
3.2 Other Reduction Options
In this section, we summarize other options to reduce carbon emission. After the classificationin this and the previous sections, the rest of this chapter’s sections are devoted to discussing allthe reduction options for each economic sector.
3.2.1 Demand-Side Measures
Carbon emission reduction measures on the demand side aim to reduce the specific energydemand of a given energy service. As such, they are not the direct targets of R&D strategies,but they are nevertheless included here for the sake of completeness. In the sequel, they arediscussed in less detail than technological options.
3.2.2 Dematerialization and Recycling
The reduction in material intensity, particularly in the industrial sector, is the result ofsufficiently high levels of per capita income and is generally observed in post-industrialeconomies. This “dematerialization“ (Herman et al. 1989) goes along with a decrease in overallenergy intensity of the economies. Dematerialization is thus largely an “autonomous”phenomenon, but it can also serve as a guiding concept for policy making. Recycling is anexample because it amounts to the dematerialization of primary inputs. The reuse of scrapmetal, paper, glass, and plastics, as well as the composting of organic matter will not onlyreduce carbon emissions, but will also address the general problem of waste disposal.
Okken and Gielen (1994) estimate that 86 percent of energy inputs necessary for the productionof primary aluminum can be saved by using recycled aluminum instead of bauxite. At present,recycling rates in the EU are low. However, products with a long lifespan currently comprise alarge share of European consumption (Okken and Gielen 1994).
3.2.3 Efficiency Improvements and Technological Change
Decarbonization through efficiency improvements is a fundamental option for achievingenvironmentally compatible energy development. Efficiency improvements reduce most of theadverse environmental impacts of energy, including greenhouse gas emissions, while alsoleading to lower primary energy inputs and therefore to lower fuel costs.
In the context of climate change, the appropriate measures of efficiency are primary energy andenergy services. Energy services, in general, are not measured in energy units, but rather inother units such as, for example, person-kilometers.
Moreover, in some cases, useful energy for a given energy service can be “borrowed” from theenvironment (as with heat that is transferred by heat pumps for the purpose of room heating),

Energy Technology Strategy 1995-2030: Opportunities from the Global Warming Threat 56
and final energy is used only for heat transfer. Useful-energy efficiency can therefore not beexpressed meaningfully in percentages. The question therefore arises as to how much energy isneeded for a particular energy service. No straightforward answers are possible, but the IPCC(1996a) summarizes studies that use the concept of exergy to estimate primary-to-service (orexergy) efficiencies with the result that, typically, these are on the order of a few percent.Granted, the lower limits of energy needs derived in these studies are theoretical, but theunderlying concept is of paramount importance in all long-term studies of the subject.
Technological change in past centuries has improved the efficiency of the factor inputs andsubstituted new or more abundant raw material resources for dwindling supplies, particularlylabor and energy. The growing need to protect the global environment should lead to increasingefforts in the field of technological progress over and above historical trends.
To illustrate the costs and potential of efficiency improvement measures, we show here, in anexample of efficiency improvement measures supply curves for total primary energy, derived byde Beer et al. (1995) for the Netherlands.
Figure 3-4: Supply curves of energy efficiency improvement measures for the periods 1990–2000 and 1990–2050.A discount rate of 5 percent is used. Source: de Beer et al. 1995.
According to this figure, 29 percent of the Netherlands’ primary energy demand between 1990and 2000 can be saved at zero or negative costs. For the period 1990–2050, the value is 43percent. These figures are the result of a bottom-up study (ICARUS) which, by definition, doesnot include “take-back” effects as discussed below where the transportation sector is analyzed.

Energy Technology Strategy 1995-2030: Opportunities from the Global Warming Threat 57
3.2.4 Fuel-Mix Changes
The most straightforward way to reduce carbon emissions is simply to use fuels that either donot emit carbon at all (e.g., nuclear, solar) or that are carbon-neutral (e.g., sustainable use ofbiomass). As far as the practical aspects of carbon emissions are concerned, switching fromfuels with relatively high specific carbon emissions, such as coal, to fuels with lower specificemissions, such as natural gas, is an important option.
Hall (1994) quantified alternative ways of using biomass for CO2 mitigation. His findings aresummarized here in Figure 3-5

Energy Technology Strategy 1995-2030: Opportunities from the Global Warming Threat 58
Figure 3-5: Alternative ways of using biomass for CO2 mitigation: sequestering carbon in forests versus substitutionof coal with biomass for electricity. Source: Hall (1994).

Energy Technology Strategy 1995-2030: Opportunities from the Global Warming Threat 59
Approximately 40 percent of energy-related CO2 was emitted by the energy conversion sector(IPCC 1996b). Theoretically, if all final energy were carbon-free, the entire carbon emissionsproblem could be solved in the energy sector alone. It is therefore clear that many measures andpolicy options exist for this sector to achieve deep reductions of total energy-related carbonemissions.
3.2.5 Removal and Sequestration
Figure 3-6 summarizes findings of the Joule II Programme study on R&D in Clean CoalTechnology. The figure displays several interesting features. First, it indicates that CO2
sequestration becomes competitive even for lignite power plants at approximately 7 UK pence(approximately 11 US cents) per kWh. The other noteworthy point is that there are areas in thetwo parts of Figure 3-6 that show a positive correlation between costs and carbon emissions.One can see that natural gas tends to be an economical and relatively clean source of powerproduction. At electricity prices of 4 UK pence (6.5 US cents) per kWh, it is even profitable tosequester all CO2 produced by a natural gas-fired power plant. However, this is only a staticcost comparison; a scenario analysis would be necessary to determine the potential of such acheap power generation option over time.

Energy Technology Strategy 1995-2030: Opportunities from the Global Warming Threat 60
Figure 3-6: Break-even electricity selling prices for base-case technologies (upper part) and for technologiesinvolving CO2 sequestration (lower part). Source: EC 1995.

Energy Technology Strategy 1995-2030: Opportunities from the Global Warming Threat 61
3.2.6 Energy conversion efficiency
Energy efficiency improvements have already been achieved for almost all types of energyconversion facilities. For example, dramatic improvements in fuel conversion efficiencies havebeen achieved during this century in electricity generation. The efficiency of electricitygeneration at the turn of the century was about 5 percent, whereas today the average efficiencyin OECD countries is about 36 percent. This amounts to approximately a sevenfold efficiencyincrease in less than one hundred years. Today, the best combined-cycle natural gas-fired powerplants can achieve more than 50 percent efficiency (Nakicenovic et al. 1993).
Figure 3-7 illustrates the historical improvements in electric conversion efficiency in the U.S theFormer Soviet Union, Western and Eastern Europe.
Figure 3-7: Improvements in electric conversion efficiency in the U.S., the former Soviet Union, Western andEastern Europe. Source: Nakicenovic et al (1.993).
Eastern Europe. Source: Nakicenoviæ et al. (1993).

Energy Technology Strategy 1995-2030: Opportunities from the Global Warming Threat 62
The IPCC (1996b) estimates that more efficient combustion of all fossil fuel could reduce 30percent of this sector’s GHG emissions at zero or negative costs by 2020 and even by 60 percentin the longer run. For example, the average efficiency of a new coal-fired power plant today isabout 34 percent but can be expected to reach 50 to 60 percent in the medium- to-long run(IPCCb 1996).
Related to energy efficiency is energy intensity, i.e., the ratio of primary energy consumption perunit of gross domestic product (GDP). On the average, the energy intensity of most developedcountries has declined by about 1 percent per year, indicating that during the last 70 years energyrequirements for producing a unit value added have been halved.
The cogeneration of electricity and district heat can substantially increase the overall efficiencyof energy conversion. Cogeneration has efficiencies in the range of 60-80 percent. Often,introduction of cogeneration is hindered by the lack of sufficient demand for low-temperatureheat.
Today, carbon emissions result primarily from the production of power. In the future, thecentralized production of hydrogen or methanol could become a major contributor to carbonemissions in the energy sector. This way, some emissions would be transferred from thetransportation to the energy sector. In this case, it is therefore important to consider life-cycleGHG emissions of alternative automotive fuels. See Figure 3-8 for a summary of recentestimates.

Energy Technology Strategy 1995-2030: Opportunities from the Global Warming Threat 63
Fuel Greenhouse gas emissions in g/km CO2
equivalent average driving cycle; car consuming7 litres petrol/100 km
Pre-tax costs. Based on Renault Clio 1.4 litre 13,800 Km per year,10 year life. 10% d.r.14
Vehiclemanufacture
FuelSupply
Operation
Total
(not final)
Vehicle cost ($) Fuel cost($/litrepetrolequiv.)
TotallevelisedCost ($/km)
Cost relativeto petrol(US/km)
Reformulated Petrol 25-27 17-48 180-193 222-268
Petrol 25-27 15-63 182-207 222-297 15,168.00 0.26 0.29 0.00
Diesel 27-29 7-35 139-202 173-266 15,168-17,443 0.26-0.26 0.29-0.33 -0.35-3.64
LPG 26-28 7-20 147-155 180-203 16,083-15,384 0.19-0.26 0.29-0.30 -0.55-1.02
CNG 29-31 5-68 130-154 164-253 16,083-15,600 0.18-0.24 0.29-0.30 -0.28-0.99
Methanol from NG 25-27 76 149 250-253 16,128-15,168 0.25-0.35 0.28-0.31 -0.72-1.45
Methanol fromWood
25-27 0-44 15-16 40-87 16,128-15,168 0.68-0.82 0.31-0.34 2.30-4.79
Ethanol from SugarBeet
25-27 50-220 15-16 90-263 16,128-15,168 0.94-1.03 0.34-0.36 4.61-6-74
Ethanol from Wood 25-27 0-41 15-16 40-84 16,128-15,168 0.68-0.82 0.32-0.34 2.79-5.27
Liguid Hydrogen 26-28 0-48 3-12 29-88 19,968-18,048 0.38-1.44 0.33-0.43 4.10-13.97
EV using electricitygenerated from:
Emissions based on urban driving cycle
European average 44-48 170 0 114-118 24,768-20,928 0.48-0.96 0.36-0.44 6.81-14.74
Coal 44-48 300-310
0 344-358
Oil 44-48 253 0 297-301
Gas 44-48 130-140
0 174-188
Nuclear 44-48 15 0 59-63
Hydro 44-48 015 0 44-48
Table 3-3: Life cycle GHG emissions and costs. Source: IEA 1994.

Energy Technology Strategy 1995-2030: Opportunities from the Global Warming Threat 64
3.2.7 Fuel-Mix Changes
Renewable use of biomass and non-emitting renewable sources, such as solar and wind energycan reduce carbon emissions of the power sector to a large extent. Today, these technologies arenot competitive except in specific economic niches. However, significant cost reductions areexpected in the future (“technological learning”).
Biomass(1) 4.2-9.9
Solar(2) 9.5-13.8
Wind(3) 2.0-5.0(1)The high end of the range corresponds to conventional technology; the low end to future advanced technology.Source: IEA 1994.
(2)Annualized capital costs assuming a 5 percent discount rate and 30 years of service life, an availability factor of25%, fixed O/M costs of $100 per year; range based on a statistical analysis of future capital costs of solar PV inindustrialized countries. Source: Strubegger and Reitgruber 1995.
(3)Future costs, expected for the time 2020-2030. Source: IEA 1994.
Table 3-4: Electricity costs of biomass, solar photovoltaic, and wind, US cents/kWh.
Nuclear energy is another source of carbon-free energy. To date, it has been introduced forreasons other than GHG emission reduction. In many parts of the world, particularly in Europe,nuclear energy faces the well-known problem of public acceptance. As a consequence, only asmall part of the discussion about carbon mitigation concerns nuclear power, and carbonreduction costs of nuclear energy are hardly a topic. Long-term R&D strategies should thereforedirectly address the problem of public acceptance by developing schemes such as the InherentlySafe Reactor.
Carbon abatement costs of fuel production from biomass are summarized in Table 3-5. Thelowest figure in the table is for methanol from wood. Still, the estimated cost ratio betweenwood-based methanol and gasoline is more than 3, equivalent to carbon abatement costs ofalmost $700 per ton of carbon. Values on the higher end of the scale lead to abatement costs ofmore than $1,800/tC.

Energy T
echnology Strategy 1995-2030: Opportunities from
the Global W
arming T
hreat65
Electricityfrom wood
209.9
22.85
8%
-
9,480
9%
6.4-9.5c/kwh
1.3-1.9
142-447
27-86
5.0
Methanolfrom Wood
158.1
13.33
22%
4,908
10,661
18%
33-39
33-39(USA)
3.4-4.2
1,068-1,436
186-250
3.8
RapeMethylether
48.9
4.98
43%
885
3,722
31%
98-136
50-59
5.6-7.8
710-1,052
304-450
1.2
Ethanolfrom Beet
200.6
12.21
38%
3,961
13,628
28%
92-100
64-72
5.3-5.7
2,960-3,284
374-415
4.8
Ethanolfrom Wheat
58.4
4.74
52%
1,695
4,072
40%
89-103
54-62
5.1-5.9
1,207-1,444
424-507
1.4
Net energy yield
Product energy credit/net input energy
% gasoline or diesel life cycle energy use
Gasoline or siesel substitution (l/ha)
Net CO2 abatement (kg/ha)
% gasoline or diesel life cycle CO2 emissions
Cost of gasoline or diesel replaced (c/l) – EU feedstockprices – world feedstock prices.
Cost ratio of gasoline or diesel (EU)
Net cost (subsidy) required (annual $/ ha)
Cost of C02 abated ($/t)
Net energy yield if 20% of OECD Europe cropland set asideand used in 2050 (EJ)
Table 3-5: C
ost ranges of biofuels for transportation. Source: IEA
1994.

Energy Technology Strategy 1995-2030: Opportunities from the Global Warming Threat 66
As for electricity, significant price reductions are expected from technological learning. TheSecond Assessment Report by the IPCC (1996a) estimates that “advanced biofuels,” such asethanol derived from wood via enzymatic hydrolysis, might be competitive with gasoline at oilprices over approximately $25/bbl. This calculation assumes an annual yield of 150 dry tons perhectare, a value thought to be realistic by Hall (IEA 1994) in the year 2050.
3.3 The Industrial Sector
3.3.1 Dematerialization
At present, about 40 percent of steel, aluminum, and lead are produced from scrap worldwide.The scrap input for copper is estimated to be 15 percent or higher, whereas the global recyclingrate for paper is around one-third, a figure which is similar to the present recycling rate of glassbottles in OECD countries.
In the future, recycling could significantly reduce specific resource requirements and resultingcarbon emissions as illustrated in Figure 3-8. The largest carbon reduction potential would be inenhanced recycling of iron and steel products in conjunction with energy-efficient electric arcfurnaces. By increasing the recycling rate to some 70 percent, the global steel industry couldreduce its annual carbon emissions by about 110 Mt C, or approximately 24 percent. Increasingthe recycling rate of aluminum, paper and glass to 70 percent each could reduce carbonemissions by some additional 50 Mt. Globally, an aggressive recycling strategy, e.g., raising therecycling rate for the major energy and carbon-intensive products as high as 70 percent, couldreduce emissions by at least about 160 Mt C, or 8 percent of current total industrial emissions.

Energy Technology Strategy 1995-2030: Opportunities from the Global Warming Threat 67
Figure 3-8: Carbon reduction potential of industry as a function of the recycling rate for selected materials.
3.3.2 Energy Efficiency Improvement and Process Changes
For the OECD region as a whole, continuous casting yields the highest energy savings potentialper ton of steel produced, followed by dry quenching of coke, hot direct rolling and sensible heatrecovery at basic oxygen furnaces. Part of these measures have already been implemented andhave contributed to the energy efficiency improvements in the steel industries of OECDcountries over the last two decades.
Ranked by their cost effectiveness per ton of carbon reduced, the measures analyzed couldreduce carbon emissions in the OECD steel industry by some 24 Mt C or 14 percent, including12 percent carbon emission reductions at negative or zero cost per ton of carbon reduced. Thesenegative costs are derived from a (hypothetical) comparison of an average OECD steel plantwith the individual efficiency measures outlined above. For instance, applying top-gas recoveryturbines to blast furnaces throughout the EU would cost about $60 million (1990 dollars)annually, while the resulting energy savings are estimated to correspond to $220 million(Springmann, 1991). This would produce annual carbon emission reductions of 0.6 Mt (hence anegative reduction cost per ton of carbon reduced).
Figure 3-9 compares various steel production processes in terms of their specific energyrequirements, carbon emissions, and costs. Several new process technologies offer possibilitiesfor carbon emission reductions in steel manufacturing. Among these are (1) direct smelting(e.g., pre-reduction with a coal-derived reduction gas; followed by a second stage in which

Energy Technology Strategy 1995-2030: Opportunities from the Global Warming Threat 68
sponge iron is melted down either with coal, the Corex process, or electricity, the Plasmameltprocess); (2) the use of electric-arc furnaces in combination with direct reduction of iron ore(using, for example, the HYL III process, which is particularly interesting from a CO2
perspective, since it includes CO2 scrubber for hydrogen and CO recycling from the reductiongas); or (3) the direct reduction with hydrogen followed by an electric arc furnace, which can bea steel production technology with practically no carbon emissions, provided both hydrogen andelectricity are produced carbon-free.

Energy Technology Strategy 1995-2030: Opportunities from the Global Warming Threat 69
Figure 3-9: Steel production chains: energy consumption, carbon emissions, and costs of various production processroutes.

Energy Technology Strategy 1995-2030: Opportunities from the Global Warming Threat 70
Process technologies to reduce carbon emissions also exist in many other industrial sectors.Using the energy efficiency of the best plants as a guide, specific energy consumption foraluminum production in the EU could be reduced to some 47 GJ/ton (that is, by 36 percent) andfor ammonia synthesis to some 28 GJ/ton (22 percent), compared to the industry average(Worrell et al. 1992). In the paper industry, a process change from thermal to mechanicaldewatering in pulp mills would yield an estimated energy reduction of 0.07 kWyr (15 percent)per ton of paper. In the cement manufacturing industry, replacement of the wet by a dry process,in conjunction with precalcination and computer process control, could reduce energyrequirements from 5.5 to less than 3 GJ (from 0.17 to 0.09 kWyr, respectively) per ton ofconcrete, although this process change is very capital-intensive (see Figure 3-10). As the CO2
concentration in flue gases of cement plants reaches 30 percent, an alternative strategy mightinvolve carbon scrubbing. Assuming a cost of $150 per ton of carbon removed, this wouldcorrespond to an additional $50 per ton of cement produced, nearly doubling current averagecement production costs.

Energy Technology Strategy 1995-2030: Opportunities from the Global Warming Threat 71
Figure 3-10: Capital costs (per ton of carbon reduced) for (a) steel and (b) cement process technologyimprovements for major world regions versus emission reduction potential.

Energy Technology Strategy 1995-2030: Opportunities from the Global Warming Threat 72
In addition to process technology changes, a number of more generic technology options exist tofurther improve industrial energy efficiency, including waste heat recovery, cogeneration,optimized control and improvements of combustion, as well as efficiency improvements ofelectricity use. Giovannini and Pain (1990) estimate savings potentials from waste heatrecovery of between 36 and 67 percent for the Netherlands, Germany and Japan, e.g., throughheat exchangers or industrial cogeneration, or through heat upgrading with heat pumps. Forindustries with high demands for both steam and electricity, industrial cogeneration and heatcascading (e.g., via top and bottom-cycle cogeneration) appear promising. The OTA (1991)estimates that industrial cogeneration could reduce industrial energy demand in the U.S. by asmuch as 140 GWyr by the year 2015. For low-temperature heat applications, improved boilerefficiency (e.g., fluidized-bed boilers) and fuel substitution are possible CO2 reduction options.
Improvements in electricity use via improved industrial drives or lighting could offer significantreduction potentials. Fisher (1990) estimates a global potential for industrial electricityreduction of 2–40 percent through replacement of industrial drives by the most efficient models,as well as the use of variable-speed drives. An additional reduction of 60–80 percent might berealized through installation of the most efficient lighting systems. EPRI (1990) has estimated amaximum technical potential for U.S. industrial electricity reduction of close to 40 percent(compared to a “base case“ in the year 2000). The electricity reduction potential inindustrialized countries for high-efficiency adjustable speed drives is estimated to be around 30percent (IEA 1991). The NAS (1991) estimates that electricity saving of 200 TWh fromimproved electric drives would cost an average of about 2.6 U.S. cents/kWh in the U.S. (costsassume immediate replacement of existing units). Assuming an average carbon intensity of U.S.electricity production of 0.18 kg C/kWh (Nishimura, 1991), this translates to specific carbonreduction costs of $144 per ton of carbon.
An example of a full fuel-cycle analysis with IIASA’s CO2DB data base is presented in Figure3-11, comparing the combination of different motor drives with different means of electricitygeneration. It shows that as far as technology is concerned, the overwhelming emissionreduction potential is on the power generation side.

Energy Technology Strategy 1995-2030: Opportunities from the Global Warming Threat 73
Figure 3-11: Energy requirements, costs, and CO2 emissions for six energy chains ending with industrial motordrives. Source: Messner and Nakicenovic 1992.

Energy Technology Strategy 1995-2030: Opportunities from the Global Warming Threat 74
3.3.3 Fuel-Mix Changes
The trend toward increased recycling and remelting of metal scrap requires electric arc furnacesleading to the increasing electrification and lower carbon emissions. The cost of this measureand its carbon emission reduction potential is described above.
3.3.4 Combined Measures in the Steel Industry
The recycling of scrap, in combination with measures in the electricity generating sector,(described in the section on carbon emission reductions in the energy sector), currently appearsto be the least expensive process change measure by which industry can reduce its carbonemissions (see Figure 3-12). Compared with the production economics of the average steelplant, electric arc furnaces could achieve both carbon emission reductions and improvedproduction economics, which would imply negative carbon reduction costs of $250–540 per tonof carbon. Direct smelting (e.g., via the Corex or Plasmamelt processes) could achieve carbonreductions at an additional cost of $10–70 per ton of steel, which translates into $140–370 perton of carbon reduced. The process having the highest carbon reduction potential also has thehighest costs (in excess of $900 per ton of carbon reduced). This is the zero-carbon steelproduction via direct reduction with hydrogen in combination with an electric arc furnace.Because of their high capital requirements, process technology changes on the positive side ofsteel industry's carbon reduction curve generally represent high-cost carbon reduction strategies.
Figure 3-12: Summary of process technologies with carbon reductions in steel manufacture, carbon emissions andcosts (line) versus specific carbon reduction costs (bars).

Energy Technology Strategy 1995-2030: Opportunities from the Global Warming Threat 75
3.4 The Transportation Sector
3.4.1 Efficiency Improvements
The average fuel consumption of U.S. automobiles fell from 18.1 liters per 100 km in 1973 to10.8 liters per 100 km in 1988, representing an average annual decrease of 3.4 percent. Duringthe same 15-year period, average fuel consumption of new vehicles dropped from 16.5 to 8.2liters per 100 km in the U.S. (4.7 percent per year) and from 8.4 to 6.8 liters per 100 km in Italy(1.4 percent per year) (Nakicenovic et al. 1993). In other European countries, such as Germanyand France, there was no decrease of average fuel consumption between 1970 and 1990(Michaelis 1994). In the OECD as a whole, total fuel consumption in the transport sector roseby some 470 GWyr, or at a rate of 2.5 percent per year (Nakicenovic et al. 1993). In general, thedevelopment of total demand for final energy in the transportation sector increases faster thanthe development of specific fuel consumption might suggest. Part of the reason for thisdivergence is the consumers’ reaction to price reductions of automobile transportation.Consumers often respond to more economical automobiles by driving greater distances and bysharing a car less frequently. This phenomenon is referred to as “take back.”
Today, the most fuel-efficient car available on the market is about twice as fuel efficient as thecurrent fleet average. Models such as the Daihatsu Charade, Subaru Justy, or GM Chevette(diesel) have an average fuel consumption of less than 5 liters per 100 vehicle kilometer (47mpg). Experimental vehicles combining all technical and design features can achieve specificfuel consumption of less than 3 liters per 100 vehicle kilometers, as exemplified by theVolkswagen E-80, the Toyota AXV, and the Renault Vesta2. This represents an improvementover current fleet averages of a factor of three to four.
The costs of achieving fuel efficiency improvements are difficult to determine. U.S. costestimates for additional purchase costs to the consumer range from $60–130 per car (EPA 1990)to $500–750 per car (OTA 1991) for a vehicle about twice as efficient as the current U.S.average (55 versus 27 mpg, or 4.3 and 8.7 liters per 100 kilometers, respectively). The resultingfuel savings, based on an annual average of 10,000 miles driven, are about 180 gallons, or $230per year at current U.S. fuel prices. Assuming an annuity factor of 20 percent, fuel savingsimply a break-even point of additional costs on the order of $900 for an energy-efficient vehicle.From such a perspective, the fuel efficiency improvements in passenger cars constitute anattractive cost-saving option to reduce CO2 emissions. As general experience suggest, however,automobile performance in terms of fuel efficiency and carbon intensity is only one of manycriteria influencing consumer behavior. This compounds the “take-back” effect in the sense thatit provides one more reason to explain why price effects can be expected to have only limitedinfluence on energy savings by cars.
3.4.2 Demand-Side Measures
On the demand side, the Mitigation Panel of the American National Academy of Sciences (NAS1991) estimates that a doubling of gasoline prices would induce consumers to prefer cars thatare between 12 and 15 percent more energy efficient. The commercial transportation sector is

Energy Technology Strategy 1995-2030: Opportunities from the Global Warming Threat 76
expected to be more sensitive to such price signals. Still, even there, long-run elasticities are faraway from unity. Kaya et al. (1991) estimate that the energy consumption of trucks in Japancould be expected to drop by only about 13 percent if fuel prices were to be increased by 50percent.
It thus appears that price signals – especially in a politically acceptable range – will not lead todramatic reductions in transportation fuel demands. This points to the need to investigateregulatory approaches, such as mandatory efficiency standards and consumer informationprograms, to more fully realize the CO2 reduction potential of fuel efficiency improvements.
Behavior not only influences what transport modes are chosen, but also how they are used(usage efficiency). Usage efficiency comprises many components, ranging from traffic flow(congestion), driving modes and styles and, most importantly, to load factors. Automobileoccupancy rates for U.S. commuters are estimated not to exceed 1.15 persons per car (NAS1991). The average in the city of Denver is 1.2, and even in densely populated Tokyo, caroccupancy is low, at not more than 1.4 persons/car (Newman and Kenworthy 1989). In citiessuch as London, Copenhagen, or Sydney, car occupancy is about 40 percent higher (above 1.7persons per car), which means less energy use and emissions per passenger kilometer driven.But public transportation modes, which have to provide sufficient capacity even during rushhours, also illustrate the low usage efficiency of transport systems.
Usage efficiency is perhaps the least understood factor having an impact on the carbonefficiency of transportation systems. Improving usage efficiency not only depends on changesin social behavior and trip organization (such as carpooling or car sharing), but also on publicpolicy incentives, such as the provision of special driving lanes or toll reductions for carpools(as practiced in some U.S. cities), or parking fees or city entrance fees (introduced in someEuropean and Asian cities).
One way of looking at behavioral aspects in the transportation sector is to analyze modal splitchanges. The modal split of long-distance passenger transportation systems in the FormerSoviet Union and China. Figure 3-13 shows that the modal split in these countries fits well to amodel of logistic substitution. Good fits like these suggest significant system inertia. In thiscase, it reflects the limited substitutability between different transport modes as a consequenceof different performance and quality requirements, relative economics, accessibility toinfrastructures, and consumer preferences. In short, policies at aiming at influencing modals arelikely to encounter strong “system opposition.”

Energy Technology Strategy 1995-2030: Opportunities from the Global Warming Threat 77
Figure 3-13: Modal split between long-distance passenger transportation systems in the former Soviet Union andChina (shifted time axes), in fractional share of passenger kilometers.
3.4.3 Fuel switching
A summary of fuel switching options for reducing carbon emissions by passenger cars is shownin Figure 3-14. The figure shows that the use of diesel and methanol fuels could reduce carbonemissions by about 20 percent, compressed natural gas (CNG) vehicles up to 30 percent. Thespecific carbon reduction costs of diesel and methanol are slightly positive, whereas for CNGvehicles – owing to fuel efficiency improvements and generally lower fuel costs – overallvehicle operating costs are lower, hence implying savings (negative carbon reduction costs).The data on ethanol admixture or ethanol-fueled cars are based on the Brazilian example. Suchmeasures would entail additional costs, but these appear to be modest (5 percent) and are subjectto the inevitable uncertainty range of such cost estimates.

Energy Technology Strategy 1995-2030: Opportunities from the Global Warming Threat 78
Figure 3-14: Carbon emissions (line) versus carbon reduction costs (bars) of various technological changes topassenger cars.
More revolutionary technological change would be represented by the massive introduction of anew generation of electric vehicles which, owing to the high end-use efficiency of electric cars,would yield lower overall carbon emissions even if electricity were to be produced in oil-firedpower plants. Another alternative is hydrogen fuel cell-powered cars. However, the hydrogenoptions have specific carbon reduction costs in excess of $2,000 per ton of carbon, which makesthem high-cost carbon reduction strategies indeed.
Figure 3-15 summarizes the technological options available in the passenger transportationsector with respect to energy and carbon intensity. Only hydrogen-fueled vehicles would resultin zero carbon emissions, provided fossil fuels are not used in the production of hydrogen.Figure 3-15 also indicates the relative scope of efficiency improvements (see the example of asteam locomotive in 1855, 1955, and a modern, coal-based, electric intercity train) and fuelsubstitution (coal- versus gas-electric intercity train, or gasoline versus CNG car). The relativerankings of transport modes can, however, vary per unit of energy service delivered (e.g.,passenger-km) according to differences in load factors. The latter is highest for aircraft (50 to60 percent) and lowest for private cars and public mass transit systems (as low as 20 to 25percent). There are, however, large regional variations.
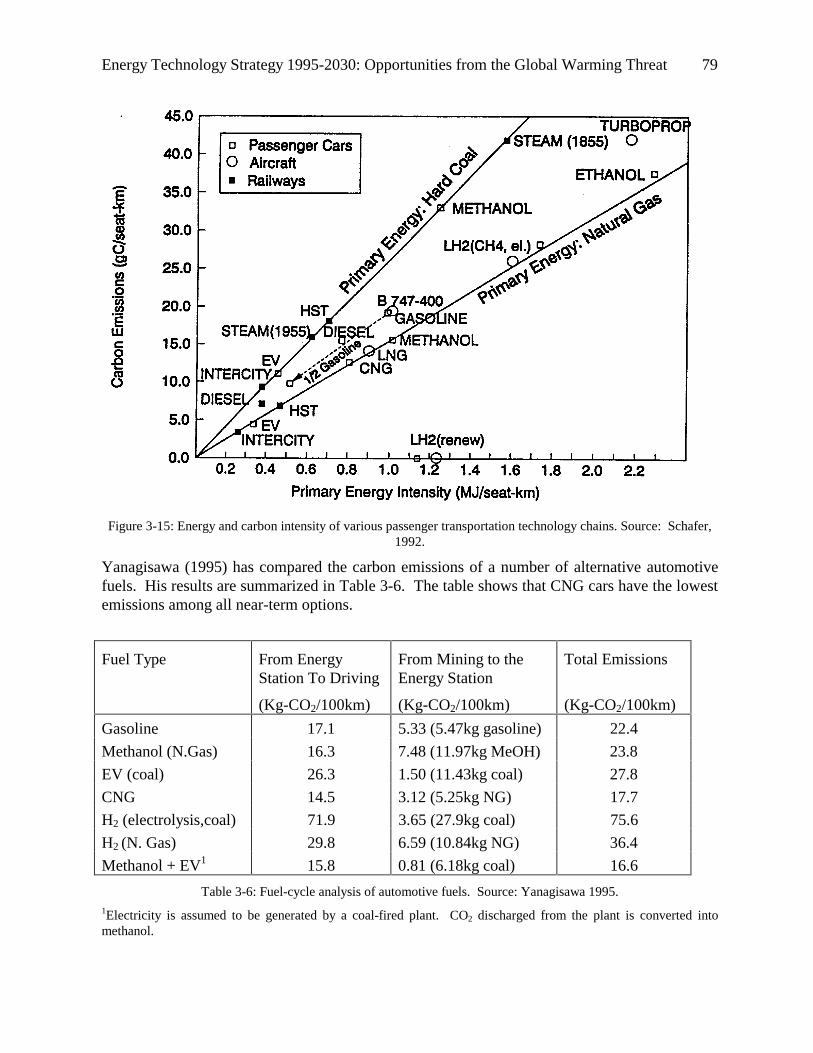
Energy Technology Strategy 1995-2030: Opportunities from the Global Warming Threat 79
Figure 3-15: Energy and carbon intensity of various passenger transportation technology chains. Source: Schafer,1992.
Yanagisawa (1995) has compared the carbon emissions of a number of alternative automotivefuels. His results are summarized in Table 3-6. The table shows that CNG cars have the lowestemissions among all near-term options.
Fuel Type From EnergyStation To Driving
(Kg-CO2/100km)
From Mining to theEnergy Station
(Kg-CO2/100km)
Total Emissions
(Kg-CO2/100km)
Gasoline 17.1 5.33 (5.47kg gasoline) 22.4
Methanol (N.Gas) 16.3 7.48 (11.97kg MeOH) 23.8
EV (coal) 26.3 1.50 (11.43kg coal) 27.8
CNG 14.5 3.12 (5.25kg NG) 17.7
H2 (electrolysis,coal) 71.9 3.65 (27.9kg coal) 75.6
H2 (N. Gas) 29.8 6.59 (10.84kg NG) 36.4
Methanol + EV1 15.8 0.81 (6.18kg coal) 16.6
Table 3-6: Fuel-cycle analysis of automotive fuels. Source: Yanagisawa 1995.1Electricity is assumed to be generated by a coal-fired plant. CO2 discharged from the plant is converted intomethanol.

Energy Technology Strategy 1995-2030: Opportunities from the Global Warming Threat 80
3.5 The Residential & Commercial Sector
Recent literature in the field suggests that the relative energy savings potential of the residentialand commercial sector is larger than the potential in either the industrial or transportationsectors. Moreover, according to several results, a significant proportion of the energy andemissions savings can be achieved economically, i.e., by saving money at the same time. Atypical size of this “no-regrets” potential to reduce carbon emissions in this sector is 50 percent.However, the resulting dollar savings and emissions reductions usually describe a theoreticalpotential: it should not be assumed that merely improving the information flow to consumerswould result in a quick realization of this emission reduction potential. The market price ofgoods and services alone is an unreliable indicator of consumer preference in the residential andcommercial sector.
One way to measure the degree of incompleteness of the market-price criterion is to calculatethe discount rates that are implicit in purchasing decisions in the residential sector. Train (1985)found the following ranges: improvements of thermal integrity of buildings: 10–32 percent;space heating and fuel type: 4.4–36 percent; air conditioning: 3.2–29 percent; refrigerators: 39–100 percent; other home appliances: 18–67 percent. In a way, these high discount rates explainwhy the usual profitability criteria must be applied with caution in this sector. The questionremains as to why the discount rates implied by consumer behavior are so much higher thanmarket discount rates. Discussing this question goes beyond the scope of this report. Readersinterested in this topic are referred to Manne and Schrattenholzer (1993). In any case,increasing the assumed discount rate in a study of conservation potentials very quickly reducesthe size of the calculated savings.
As to the practical savings potential, the IPCC (1996b) estimates that energy efficiencymeasures for appliances, lighting, and office equipment with paybacks to the consumer of fiveyears or less have the technical potential to reduce carbon emissions by approximately 20percent in 2010, 25 percent in 2020, and 40 percent in 2050, all relative to a baseline thatalready includes some energy efficiency improvements. According to the same report (IPCC1996b), improvements in the building envelope have the technical potential to reduce carbonemissions by 10 percent in 2010, 10 percent in 2020, and 15 percent in 2050, again assuming apayback time of up to five years.
3.5.1 Efficiency Improvements
There are numerous examples of improved efficiency of residential appliances. Compared tothe 1986 stock, the 1991 stock of refrigerators, freezers, or room air conditioners in the U.S.consumes about 20 percent less, and 1991 models sold consume an average between 30 to 40percent less than the average 1986 vintages (Levine et al. 1992). With the best available andmost advanced technology, further significant improvements in energy efficiency are possible.In the U.S., where refrigerators are the second largest consumer of residential electricity, theaverage 1991 stock consumed about 1200 kWh/yr, down from 1450 kWh in 1986, and the bestavailable model sold consumed 710 kWh. Further reductions to 200–500 kWh are consideredwithin reach during the 1990s (Levine et al. 1992). According to Meier (1991), more than 25

Energy Technology Strategy 1995-2030: Opportunities from the Global Warming Threat 81
percent of the current U.S. refrigerator electricity demand could be reduced by cost-efficientmeasures. Meier’s calculations assume an annual discount rate of 10 percent, which looks lowin light of the above discussion. Using a rate of 30 percent instead results in positive costs of allsaving measures considered in this case.
An example analyzing costs and emissions of different refrigerator types, based on data ofIIASA’s CO2DB database, is shown in Figure 3-16.

Energy Technology Strategy 1995-2030: Opportunities from the Global Warming Threat 82
Figure 3-16: Energy requirements, costs, and CO2 emissions for six energy chains ending in refrigeration.
Source: Messner and Nakicenovic 1992.

Energy Technology Strategy 1995-2030: Opportunities from the Global Warming Threat 83
The figure shows that an advanced refrigerator model provides cheaper services than even thebest model of today, even if its electricity comes from a source that includes carbon removal.
The message of this subsection is that successful R&D in energy-efficient household appliancesis only the prerequisite for reducing final energy consumption and carbon emissions. Toactually realize existing potentials, policy must help improve consumers’ access to informationand/or involve instruments such as standard setting, taxes, and appliance energy labeling.
3.5.2 Fuel-Mix Changes
Figure 3-17 presents the calculated CO2 emissions and CO2 reduction costs for residential spaceheating. The data represent a residence with 150 square meters of living space at three levels ofbuilding insulation standards. The CO2 reduction costs are calculated as the differences betweenthe reference case (gas heating and 1990 insulation standards) and each alternative consideringthe levelized annual heating costs. In addition to the emissions related to residential heatingsystems, the CO2 emissions of the figure account for all emissions along the energy deliverychain.
Figure 3-17: Carbon emissions (line) versus CO2 reduction cost (bars) for residential heating. The abbreviationsrepresent the three insulation categories in ascending order of technological sophistication (0, I, II): natural gas; a
hydrogen delivery chain based on hydro-electricity and electrolysis (ElH2); and photovoltaic electricity andelectrolytic hydrogen (PVH2).

Energy Technology Strategy 1995-2030: Opportunities from the Global Warming Threat 84
Figure 3-17 conveys that improved building insulation is the single most important factor forimmediate CO2 emission reductions. This, and high-efficiency heating technology, even fornatural gas-fueled systems, could lead to substantial emission reductions. There, the costs ofCO2 reduction are negative, i.e., lowering CO2 emissions reduces heating costs at the same time.
Likewise, the combination of hydroelectricity and electrolytic hydrogen could generate netsavings if used in superinsulated residences (ElH2-II). Photovoltaic hydrogen in conjunctionwith superinsulation (PVH2-II) achieves zero carbon emissions for $140 per ton.
Commercial heating follows the trend of residential heating. Here, the cogeneration of electricityand space/process heat production is an essential prerequisite. Improved insulation andphosphoric-acid fuel cells (PAFC) would result in CO2 reduction costs of approximately $25–80per ton of carbon.

Energy Technology Strategy 1995-2030: Opportunities from the Global Warming Threat 85
Chapter 4: Power generation technologyclusters: present status and its
potential
4.1 Nuclear Industry: a paradigm in crisis
by D. Finon, IEPE
Nuclear technology has experienced an important diffusion in the 70s and 80s, as a result of animportant technology push, originally carried out by governments of the major industrialisedcountries. However, the importance of nuclear energy for the world-wide production ofelectricity (17% in 1995) cannot conceal the great crisis that its diffusion has undergone in thewhole world.
According to the projections made at the end of the 70s, the world-wide electronuclear capacityshould have reached 1,300 GW in 1990 and 3,600 in the year 2000. It was 325 GW in 1990 andwill reach 366 GW in 2001, at best. What changes in the field of the selection of electricproduction techniques would encourage a future boost of its diffusion, especially from thetechnological perspective? Is it an answer to the increase of world-wide energy needs,particularly in those emerging, rapidly-developing countries? Could the necessity to meet thelimitations of greenhouse effect gas emissions agreements revive its development?
Nuclear technology has developed following a precise "technology push" model. This model,less and less used, presents three main characteristics:
- it concerns complex technologies
- its projects are defined according to technological objectives, regardless of economic andcommercial feasibility
- nationalist and military aims: only a very small number of big, national, industrial firms canappropriate the technology
The introduction of hybridised nuclear technology through steam turbines in the 60s and 70smeant a change in the electricity production paradigm. This change can be situated in thecontinuation of the traditional technology trajectory. This trajectory, almost saturated before,had a tendency to focus on the exploitation of the scale effects which lead to an increase ofcapitalistic intensity.

Energy Technology Strategy 1995-2030: Opportunities from the Global Warming Threat 86
The selection of competitive nuclear technologies was realised quickly, with a characteristic“lock-in” phenomenon adaptable to American techniques for light water reactors, in spite oftheir rather poor performance. BWR and PWR techniques have benefited from a prior militaryimpulse (submarine reactors, production of fissile material). They also benefited from the USgovernment support in the geopolitical arena (control over the risk of proliferation permitted byAmerican supply of enriched uranium) and from the market power of the four major Americanindustrial groups of electrical and mechanical construction, which have already licensed themain German and Japanese groups (Bupp and Derian, 1978: Cowan, 1990).
This evolution seeks the introduction of a new radical innovation, which is sustained byorganisational inertia, allowing to transfer the preparation problem of large public researchingcentres to non-strictly nuclear tasks (Finon, 1989). However, the industrial groups, soonconfronted to their sales reduction, preferred to focus on incremental innovation strategies basedon light water reactors that public research had deliberately discarded. Therefore, publicresearch will partially reconsider it again.
At the end of the 60s, there was a consensus disruption, related to the appearance of new socialdemands and values (safety, health, life quality, participation, etc.). Nuclear development hasbeen a major focus of new social conflicts because it embodies different critical aspects ofpolitical control in industrialised societies, and also due the specific nature of its risks, fromwhich particular fears can also arise.
This crisis of social acceptance has put off its commercial diffusion from the mid-70s inindustrialised democratic countries, except for France and, to a less extent, Japan. Thesignificant slackening of the development of electric power (from a 7% to a 1-2%) that hasended in the appearance of strong over-capacities, has but attenuated the effects of thisblockage.
Many orders have been cancelled too, especially in the United States (119 cancellations from1975 to 1978). The reason of this demand decrease can be mainly attributed to:
- technological complexity
- safety demands
- institutional weakness
- great indivisibility of nuclear equipment
Nuclear development between incremental innovation and opportunities trajectory changes.
Some advanced developments (HTR) have been abandoned: efforts for super-generators and fora new management of the wastes have been abandoned in most industrialised countries.

Energy Technology Strategy 1995-2030: Opportunities from the Global Warming Threat 87
A process of incremental innovation, improving the adaptation of 1st generation reactors hassubstituted the “technology push”. It’s a question of preserving or restoring social confidence byplacing in the market reactors that meet stronger safety norms:
- By reinforcing isolation systems
- Through a better prevention of serious accidents produced by fusion of the nucleus.
- By reducing accident probability.
- By simplifying exploitation
The aim is to reduce costs and investing risks, by simplifying the design of the reactors,reducing the components and the instrumentation costs. This would lead back to a “learning”process through standardisation. The result is a reduction of the time and the cost of installationand control authorisations, benefiting from mass production effects and arriving at a limitationof local constructions.
New developments are based on the growing use of quality steel, simpler materials which areless sensitive to operating errors and information technologies.
Looking for a greater divisibility of the equipment more compatible with financing constraintsor faster rentability strategies is very important (see the AP 600 Westinghouse and the AB 600General Electric developments, partly financed by the US Department of Energy).
“Evolutionary” LWR
The nine constructors present in the market are nowadays capable of offering, very often in thecontext of an alliance, better-designed PWR or BWR reactors (see figure 5). Some techniquesare already developed. General Electric, in alliance with Toshiba and Hitachi, is the mostadvanced, since the construction of two 1450 MW ABWR reactors in Japan (first start-up in1997). The first N4 reactors (PWR) by Framatome, recently established, also belong to thiscategory. Meanwhile, the creation of the European Pressurised Water Reactor (EPR) prototype,studied by Framatome and Siemens since 1990, in the frame of the REP 2000 project, could bebuilt in France from 2000 to 2005.
Passive safety LWR reactors (or “revolutionary”)
These reactors are only at a design stage. They are studied especially in countries where theircompletion has been blocked, in order to commercialise reactors of a completely differentdesign and undermine objections. “Passive safety” is ensured through a major thermal inertia ofthe primary circuit and of the weakest and specific fuel potential. The evacuation of the heat incase of an emergency stop is, thus, easier.

Energy Technology Strategy 1995-2030: Opportunities from the Global Warming Threat 88
Stage of the development of the advanced LWR techniques and passive safety techniques.
Concept indevelopment
Agreed
concept
Projectprototype
Prototype inconstruction
Advanceddevelopment
stage
Advancedreactors(evolutionary)
EuropeanPressurized
Reactor: EPR
ABB-Atom :
BWR 90
ABB-CE :System 80 + (1300MW PWR)
Westinghouse-Mitsubishi :APWR(2X1420 MWin Japan)
Commande :1998 ?
GeneralElectricABWR
2 prototypes of1350 MW
(Japan)
Start up :1997-1998
Framatome : N4(4 reactors)
1996-1998
Passive safetyreactors(revolutionary)
GeneralElectric :SBWR
Westingh-Mitsub :SPWR
Siemens :
SWR 1000
European
Passive Plant
Westinghouse :AP600
Renewed technology push?
The heritage of advanced reactor programmes
Programmes have been carried out in France and Japan concerning liquid metal fast breederreactors (LMFBR), as the inertia created by recent efforts to design complex prototypes is to bedeveloped. The importance of accumulated responsibilities and effected investment should

Energy Technology Strategy 1995-2030: Opportunities from the Global Warming Threat 89
probably maintain programmes alive for a decade, after which they are likely to disappearbecause of the lack of “demand pull”.
The technique studied at the CERN (Genèva), backed by the European Commission and theSpanish industry, is but at a preliminary stage. The sub-critical character of the nucleus preventsfusion risk, as the fission reaction is interrupted by particle flux suspension. Besides, itsparticular neutronics allows the reduction of the actinide production and the consideration oflong-term waste transmutation. Moreover, the thorium-U233 cycle presents higher resistance toproliferation, but without radical rupture compared to traditional reactors.
Implementation and diffusion of this new nuclear reactor, a new paradigm indeed, require themastering of a vast number of techniques: powerful linear accelerators adapted to continuouslong-term functioning, lead cooling technology (metallurgy, pumps, valves), controlling Th-U233 combustible elements (manufacture, exposure to irradiation), adapted techniques for themanagement of wastes, the type of storage of residues. Therefore, new specific skills have to bedeveloped for nuclear R&D agencies, electromechanical enterprises and companies within thenuclear cycle.
In industrialised countries, there are “demand pull” factors that could provoke the diffusion ofnuclear technology to be revived. These are the investment necessity in power production as theinstallations become obsolete and the anticipation to tensions in the gas market (in case there istoo much need of gas-combined cycle units by competing technologies). In rapidly developingcountries with limited resources, the growing needs of power capacity will be a paramountfactor.
On the other hand, governmental commitments to prevent the greenhouse effect by limiting gasemissions are also to be taken into account, within the international framework that will beprogressively established in the two coming decades.
Drawbacks to the solution of the social acceptance crisis
The non-fulfilment of the nuclear technology system would have been resolved at the same timeas it was established if the key issue in the question of wastes would not have been socontroversial. There are no clear principles about the necessary scientific evidence to considerthe acceptability of a definitive storage installation, regarding demands on duration and inter-generation issues (Berkhout, 1991). With no other alternative available, temporal surface storageis nowadays considered as a necessary evil, but it is no definitive solution. Therefore,acceptance of definitive storage areas is a decisive issue.
The question of wastes could constitute a permanent focus of public interest on nucleartechnology. For those opposed to it, it constitutes an effective tactical means to face an eventualrevival that could prevent the appearance of a politically credible solution. Furthermore, thepresent lack of diffusion of nuclear technology limits a research process on the end-of-cyclewaste problems.
The industrial organisation of the electric sector, which is based on regulated monopoly, hasfavoured electronuclear technology diffusion mainly due to two reasons:

Energy Technology Strategy 1995-2030: Opportunities from the Global Warming Threat 90
• allowing the client to postpone the costs and risks and ensuring a stable return level, thismodel authorises capital investments with a longer pay-back time;
• likewise, this model allows the socialisation of the risks and the costs associated to eventualaccidents, the management of wastes and equipment dismantling; if regular provisionmechanisms can finance the anticipated expenses associated to these two problems,unforeseen additional costs can be wholly transferred to the price paid by the consumer, orbe financed by the taxpayer.
Competition regulations, in a private-property rights framework, seem to be incompatible withnuclear assets developments. Firstly, competitors tend to privilege divisible investments andlook for shorter repayment deadlines of the order of 5 or 6 years, instead of the 11 or 12 yearsadmitted in a framework of regulated monopoly. Secondly, the combination ofcompetitors/private operators forces the disclosure of real costs. Therefore, it is no longerpossible to rely on a complete socialisation of unforeseen costs and of those risks associated tonuclear development, even when states can somehow guarantee a financial-risk cap in the eventof nuclear accident. Finally, the associated economic risk carried by rival operators –not by theclient- is no longer perceived by private investors as identifiable and assessable.
4.2 Clean Coal Technologies
by Mark Whiteley, ESD
A significant amount of world wide electricity production comes from coal combustion. InEurope, about 35% of electricity comes from solid fuels. The majority of the coal is burnt inpulverised fuel (PF) boilers heating water to drive steam turbines. However, in today’s terms,these PF turbines are relatively inefficient with high levels of emissions. These disadvantageshave driven research into efficiency improvements (better turbines, higher boiler temperatures),alternative methods of combusting coal (gasification, fluidised bed combustion), co-firing withother fuels, and even the conversion of coal into alternative types of fuel (eg. liquefaction,pyrolysis). This report analyses the technological changes that have occurred within thecombustion process itself to improve the economic, efficiency and environmental performanceof electricity from coal combustion.
Clean coal technologies are not a new concept, as an understanding of the theory behind theseapplications has been in the public domain for decades. However, the process of transferringthe theory into practical commercial applications has proved to be difficult and still proves to bethe main stumbling block behind their lack of widespread implementation. There are manyreasons behind this problem, the main ones of which are covered in this report.
There are many factors forcing change in the European and world-wide markets. These areoccurring at a rapid pace, predominantly by technological change, but also from other economicand political factors. The dynamics of the changes are provided in more detail during the rest ofthis section. There are many factors influencing leaps in technological progress, each of whichlead to improvements in various aspects of clean coal combustion. Some of the forces behindtechnological change within coal-based power generation sector are listed below.
Economics

Energy Technology Strategy 1995-2030: Opportunities from the Global Warming Threat 91
In Europe, growth in electricity demand has been relatively low over the last two decades.Therefore, the factor determining the construction of a new plant has tended to be as areplacement for retired power stations, unless there are other circumstances causing changes inthe market. There are two major factors that affect the economics of clean coal plant. One, fuelcosts, is uncontrollable, while the other, investment costs, can be directly affected throughresearch and development. If clean coal is to become the first choice in new plant construction,it has to become economic against the alternative technologies such as traditional coal-firedpulverised coal-fired steam turbines and gas-fired combined cycle power plants.
Fuel price
Another economic factor against clean coal is the price of the fuel itself. Deep mined coal inEurope is expensive in comparison to other fossil fuels, so the various indigenous coalindustries have only survived owing to government support, be it in the form of a direct subsidyor by guaranteeing prices with the utilities. On the other hand, cheap imports are available, sothis is not necessarily a factor against clean coal technology. However, despite the world marketprice for imported coal being relatively stable, this can be greatly affected by shipping costs,which is an added risk.
Competition
Competition between various generating technologies is intense in Europe. The future for coal-fired generation is clean coal. Therefore, as Europe has broad experience in coal burningtechnologies, intense research is being carried out to make clean coal competitive againstalternative technologies, especially with respect to the export market to Asia and the rest of theworld. Private ownership of the utilities has significantly changed the culture of theseorganisations. Over the last few decades, investment policy has become much more financiallybased. This is currently a factor against clean coal. On the other hand, this gives the componentmanufacturers the opportunity to invest in clean coal plant themselves, which frees them fromthe constraint of having a single/few electricity supplier(s) within the region. However, despiteno clean coal plant having yet been built in Europe as a result of privatisation, there is scope forthis to happen. Bearing in mind the liberalisation of electricity markets, the change towardsthird party access is more associated with choice to the consumer. However, this allows theconcept of product differentiation to be introduced. It is possible that clean coal electricity canbe marketed as a premium source of electricity which will encourage the development of thisnew market. Further research would be necessary in this area to investigate the possibility ofclean coal electricity as a niche market and to ascertain the type of niche that this technology canhold.
Environment
Coal is a relatively dirty fuel compared to other fossil fuels. This is in terms of carbon dioxideemissions (global warming), sulphur dioxide and nitrogen oxide emissions (acid rain) and ashdisposal (heavy metals to landfill). Therefore, high levels of research are being carried out tominimise the environmental effects of coal burn, especially in terms of acid rain mitigation.Efficiency improvements will lead to reduced CO2 emissions per unit of electricity produced.
Security of energy supply

Energy Technology Strategy 1995-2030: Opportunities from the Global Warming Threat 92
Coal is Europe’s largest indigenous energy source, so its use in the past was encouraged as ameans of minimising energy imports. However, owing to changes in the world coal trade andcheap imports from other countries, the majority of the European coal industry has closed downduring the last fifty years. This has led to a perceived decrease in the importance of coal as afuel.
A second major impact on the industry has been the termination of the ban on the use of naturalgas in electricity generation. As cheap natural gas supplies are plentiful in Europe, there iscurrently little need for new clean coal plant. However, in the medium to long term, coal isexpected to achieve a renaissance as natural gas becomes a scarcer commodity.
Technology leadership and exports
The main rationale behind maintaining a thriving clean coal technology industry is the exportmarket to developing countries, especially in Asia. For Asia, an increase in the market for cleancoal is expected over the next few decades. By being technology leaders, Europeanorganisations can benefit from their expertise in these markets. The net result is that theseexports can be used to develop and test new processes in preparation for penetrating theEuropean electricity generation market itself.
Key players within the industry
The players forcing change in clean coal technology are both external and internal to theindustry.
The main external influence comes from international and national government funds. Forexample, the European Commission is a major source of funds encouraging research,development and demonstration of clean coal plant. This is making Europe, with the USA andJapan, a world leader in clean coal technologies, which provides an excellent basis for exports tothe rest of the world.
Alternatively, government can force change through regulations and legislation. However, asthe majority of the relevant regulations refer to emissions, coal combustion is penalised owingto its high emissions. On the other hand, laws can be introduced requiring long term security offuel supply. This would help to secure the majority of the remaining deep-mined coalproduction in Europe, which is currently under threat from cheap imports and competing fuels.
Another key type of player is the utilities. Their aim is to provide the most economic electricityto the consumer within any restrictions set by government. If clean coal developments can makeit the best option in certain locations, the long term future for coal combustion in Europe will beassured. Additionally, the faster that technological progress can be made, the better are theprospects for clean coal in the rest of the world.
The final key players are the manufacturers and installers of clean coal technology plant andcomponents. They have a vested interest in the rapid integration of the plant into a first choicetechnology. Their current markets are in the developing world where experience can beobtained into the operating characteristics of this plant. It is vital that this experience can begained so that continuing improvements in efficiencies and emissions from clean coalcombustion can be made.

Energy Technology Strategy 1995-2030: Opportunities from the Global Warming Threat 93
Amongst the main industrial actors involved in clean coal developments, one could outlineFoster-Wheeler Energy, Siemens AG, Babcock Energy International Combustion Ltd, AseaBrown Boveri and many others manufacturers, utilities and technology integrators.
Key technology developments
There are many different clean coal options based upon a small group of technologies. Themain ones are pulverised fuel combustion under critical conditions, fluidised bed combustionand coal gasification. The main technological options arising from these are:
Supercritical and ultra-supercritical coal
Most conventional power stations use sub-critical pulverised fuel (PF) combustion, in whichcoal is ground into fine particles injected, with air, into a combustion chamber. The particlesburn in suspension and heat water tubes in the combustion chamber walls, raising high-pressure,high-temperature steam to drive turbine-generator sets.
Supercritical PF combustion is an evolutionary advance of sub-critical combustion, in whichhigher steam pressures and temperatures are used (above 221 bar and 540�C) to raise efficiencylevels to 44%. Several supercritical plants are in use in Europe, mainly in the Netherlands.Ultra-supercritical plant is currently under development, employing steam pressures above 248bar and temperatures over 566�C, and expected to achieve generation efficiencies of up to 47%.
New PF plant in Europe will almost certainly be of supercritical or, in time, ultra-supercriticaldesign, with associated emissions reduction technologies, including selective catalytic and non-catalytic reduction (SCR/SNCR), low-NOX burners, fuel staging, flue gas desulphurisation(FGD) and dust collection. Equipment manufacturers tend to prefer this technology to moreradical new technologies such as IGCC, because it represents and evolutionary advance of thetried and tested conventional steam cycle.
Conventional supercritical coal-fired steam power plant employing elevated live steamparameters have already been built in past decades. Austenitic materials had to be applied forcomponents operating in the high-temperature at that time. Recent developments in the materialproperties permit the use of ferritic/martensitic steel in present state-of-the-art hard-coal firedpower plants and steam parameters of 221 bar and 540°C. R&D activities for ultra super criticalplant are aiming at higher steam parameters of 248 bar and 566°C. For steam generatorcomponents, pipes, and turbine components, nickel based materials and methods ofmanufacturing the named components from these materials have to be developed. However,ultra super critical is still at the development stage, and demonstration plants of this technologycan not be expected before 2005-2015.
Presurized and Atmospheric Fluidized Bed Combustion (PFBC/AFBC)
In fluidised bed combustion, a continuous high-velocity stream of air is injected through a “bed”of mixed inert material, ash and fuel, creating a “fluidised bed” in which the fuel particles moveabout freely in suspension. In bubbling atmospheric FBC, the bed remains at the bottom of thecombustion chamber, with a defined surface level. In circulating FBC, which is more efficient,higher gas velocities are used resulting in a turbulent cloud of solids throughout the combustor.

Energy Technology Strategy 1995-2030: Opportunities from the Global Warming Threat 94
FBC allows rapid and complete combustion of fuel at temperatures around half those ofconventional PF plants. In-bed heat exchangers are used to generate steam for industrial orpower plant use. Emissions of NOX are limited because the combustion temperatures are low,and SO2 can be removed by adding limestone to the bed.
Bubbling AFBC technology is very useful for the efficient combustion of poor quality fuels (e.g.low-grade coal, lignite, peat, wood, biofuels and waste). The technology is well established forindustrial and small power applications and for CHP. Circulating AFBC is generally preferredfor large-scale power applications (over250MWe).
PFBC is based on AFBC but takes place within a large pressure vessel, at pressures around tentimes above atmospheric. PFBC can be integrated into a combined-cycle system, whereelectricity is generated first in a conventional steam turbine-generator set, and then the hotexhaust gases drive a gas turbine to generate additional electricity. More heat is then recoveredfrom the turbine exhaust gas, to give an overall thermal efficiency of about 44%.
There are three commercial-scale bubbling PFBC plants in the EU, and several demonstrationplants are operating elsewhere in the world. Second-generation PFBC plants are now beingdesigned, which incorporate fluidised bed gasification followed by char combustion (a hybridcycle).
PFBC can therefore be considered as commercially available and applicable for a large varietyof coals. The pressurised combustion reduces the space requirements and the fluidised bed canbe designed to control emissions of SOX (by admixing limestone) and NOX (by air splitting andtemperature control in the furnace) below the environmental standards without cost intensiveflue gas cleaning. Using cyclones and candle filters, the flue gas particles can be reduced by99.9 % before entering the gas turbines, which provides sufficient protection of the turbines andcomplies with most requirements for emission control.
Integrated Gasification with Combined Cycle (IGCC)
In IGCC systems, coal is gasified (by reaction with steam, oxygen or air), and the hot gases arecleaned and burnt in a gas turbine. Exhaust heat from the gas turbine (and from the gas cleaningand gasification processes) is used to raise high-pressure steam for additional electricitygeneration. IGCC plant can achieve net efficiencies of 45% and can be used for low grade fuels(e.g. petroleum coke or refinery residues).
IGCC technology is still at the demonstration stage, with demonstration plant in Europe (atBuggenum in the Netherlands and at Puertollano in Spain) and in the USA. It offers thepossibility of power generation at very high efficiencies, taking in this manner full advantage ofthe achievements on gas turbines and combined cycles technology. Decisive characteristics ofintegrated gasification cycles are the gasification processes (entrained flow, fluidised bed andfixed/moving bed) and oxidant (oxygen- or air-blown). Demonstration plants with an installedcapacity of 200-300MW are under construction. The commercial availability of larger units isnot expected before 2005.
Integrated Gasification with Humid Air Turbine (IGHAT)
In IGHAT, gasification of coal is followed by combustion in a Humid Air Turbine (HAT) cycle.HATs are based on gas turbines, without a bottoming steam cycle, with two modifications to

Energy Technology Strategy 1995-2030: Opportunities from the Global Warming Threat 95
improve efficiency: multi-stage compression of the turbine air with recuperative water coolingbetween each stage to reduce the compressor work; and additional flue gas heat recovery in arecuperator for water and its use for compressed air saturation prior to combustion.
In conventional gas turbines, more than a third of the power generated in the expander isabsorbed to compress the working fluid. This loss of exergy is increased by the requirement foran excess air flow to allow cooling of the turbine components. Humid air turbines (HAT) allowfor lowering this inconvenient disadvantage in two ways: first, they use intercoolers on amultistage compressor, therefore reducing the power requirement of compression and producinglow temperature heat. Secondly, moisture is added to the compressed air (20-40%) in asaturator. To produce this hot water heat is recovered from the compressor intercooler,aftercooler and turbine exhaust.
When HAT is integrated with a coal gasifier (IGHAT), there is a large amount of heat availablefrom the gasifier and other processes (including air separation plant for oxygen blown gasifiers).The hot water is brought into contact with the compressed air in a counter current saturator.Humid air leaving the saturator may have a moisture content of 20% (natural gas HAT) and40% (IGHAT). This is a key stage of the HAT cycle, since the saturator is a multistage columnand the heat exchange approaches reversibility. The humid air is further heated against the hotturbine exhaust in the recuperator. The variable boiling point working fluid of steam and airavoids the large temperature divergence between the water and turbine exhaust in a gas turbinecombined cycle. Thus, the moisture addition increases the work output form the turbine, whilethe intercooling reduces the compressor work requirement. This combines to increase the netpower output. The IGHAT cycle can achieve efficiencies higher than those of conventionalcombined cycles, and is especially adapted for base-load electricity production. An additionalfeature of this cycle is that, given the high moisture content of the exhaust gas, it isparticularly well-suited for district heating.
Direct Coal Combined Cycle (DCCC)
DCCC combustion in a gas turbine offers the potential to increase the efficiency of electricitygeneration from coal by eliminating losses during gasification. However, the main technicalbarrier is damage to the turbine blades from hot ash particles.
The research on direct coal firing in gas turbines has been carried out for over forty years. Since1986, Westinghouse and Textron have run a project at Morgantown Energy Technology Centreof the US DoE, with federal funding. The initial difficulties were related to the severeeffects of coal ash on turbine blade path components (corrosion, erosion anddeposition). Latter-day effort on direct coal firing (DCF) has concentrated ondeveloping high pressure (12-16 bar) slagging coal combustors which allow removal ofash as a liquid prior to entering the turbine. The hot gas clean up must take placeabove the ash melting temperature (1400-1600ºC) and high pressure (at least 18 bar).This high temperature provides additional gains in exergy with respect to otheradvanced coal cycles, such PFBC or IGCC. The molten ashes accumulate on the edge ofthe slagging chamber by a centrifugal effect. Nevertheless, there is an efficiencypenalty with respect to gas-fuelled natural cycles: the foreseeable efficiency ranksaround 44%, and, in general, may be estimated as the efficiency of natural gas

Energy Technology Strategy 1995-2030: Opportunities from the Global Warming Threat 96
combined cycle minus a penalty of around 6 percentage points. Its estimated costswould be twice those of gas-fuelled combined cycle.
It should be kept in mind that DCFCC is not yet a proven technology, its state of developmentbeing still in the laboratory phase. Apart from the slagging combustion system and the liquidash and contaminants removal, all other components of DCFCC (gas turbine, steam cycle, etc.)are commercially available technologies.
A study carried out by Westinghouse/Gilbert-Commonwealth Inc. in 1990 investigated theeconomics of direct coal fired gas turbines fitted with slagging combustion technology. Thestudy concluded that the cost of electricity from this plant type could be 11-18% cheaper than acomparable 220 MWe pulverised coal boiler fitted with FGD.
Other options
The Combined Kalina Cycle is an upgrade of the standard Rankine cycle, which, as used inmost power generation processes today, uses a single fluid (water) which is expanded in a steamturbine and then condensed and returned to the boiler. The Kalina cycle uses a mixture of twoor more fluids, typically ammonia and water, and varies their ratios at different parts of thecycle. This allows optimisation of thermodynamic efficiency, with possible improvements of upto 10%. Conventional steam cycle plant can be adapted to use the Kalina cycle by suitablechanges to the condenser.
Other possible future technologies at the R&D stage are Magneto-Hydrodynamics (MHD) andPressurised Pulverised Coal Combustion (PCCC).
Techno-economic performance and projected developments
The technical performance of each of these options is shown in table 4.2, whereas the economicdata of these five technologies are outlined in table 4.3.
Table 4.2 -
Technology Gross capacity Efficiency (%) Lifetime(MW) 2000 2030 (years)
Supercritical 650 44 49-52 35PFBC 550 43 44-46 35IGCC 760 146 50-53 35IGHAT 400 40 44-46 35DCCC 40 146 50-52 20
Table 4-1: Technical performance of clean coal technologies (2000)

Energy Technology Strategy 1995-2030: Opportunities from the Global Warming Threat 97
Capital cost (1ECU/kW) Operation & maintenance costs
Technology 2000 2030Fixed
(1ECU/kW/year)Variable
(1mECU/kWh)Supercritical 1268 968 45 1.8PFBC 1030 900 77-67 2.4-2.2IGCC 21370 900 70-60 1.75-1.5IGHAT 1300 900 35-30 1.0DCCC 21200 950 45-30 4.0
Table 4-2: Clean coal technology economic data (2000-2030)Notes: 11990 ECU
22005
Environmental impacts
There are three main environmental impacts associated with coal combustion. These are:
• Carbon dioxide (CO2) - global warming
• Sulphur dioxide (SO2) and nitrogen oxides (NOX) - acid rain
• Ash disposal issues
CO2 emissions are directly related to the carbon content of coal, and thus to the efficiency of theplant. However, the acid rain effect of each technology is much more variable. Emissionfigures are shown in table 4.4.
Efficiency Emissions (kg/TJ)(%) SO2 NOX
Technology 2000 2000 2030 2000 2030Supercritical 44 55 30 100 79PFBC 43 69 65 85 80IGCC 46 119 17 138 33IGHAT 40 10 6 20 20DCCC 46 120 20 155 50
Table 4-3: Clean coal technologies environmental performance - acid rainNote: 12005
In terms of emissions output, supercritical uses abatement technologies such as Flue GasDesulphurisation (FGD) plant, Selected Catalytic Reduction, and low nitrogen oxide (NOX)burners. Emissions abatement for the others is integral within the technologies themselves (i.e.hot gas clean-up before combustion, limestone slagging, etc.)

Energy Technology Strategy 1995-2030: Opportunities from the Global Warming Threat 98
Market penetration and prospects for future developments
In Europe, the current market penetration of clean coal technologies is extremely small. Thereare only a few sites, the main ones being in the Netherlands and Spain. However, only super-critical has actually penetrated the market, as the others are demonstration plants.
However, on a world wide basis, there are several clean coal generating stations in thedeveloping world where there is rapid growth in electricity demand, particularly in countriessuch as China. It is these areas where significant growth in market penetration will be achieved.As experience is gained and the technologies become more economic, the potential forsignificant penetration in Europe will increase during the next decade.
There are many factors affecting the almost general lack of clean coal plant installation withinthe European Union so far. However, there are two factors that have combined to dominate allof the others. The first was the lifting of the EU directive banning natural gas use in powerstations, which was predominantly prompted by the realisation that gas was being wasted byflaring off to get to the underlying oil, rather than by the move towards liberalisation. Thesecond factor was the availability of efficient and relatively cheap Combined Cycle Gas Turbine(CCGT) technology. Consequently, even cheap standard coal plant cannot compete in directterms with the combined cycle gas turbines currently being constructed.
The other major barrier to the widespread introduction of clean coal is environmental impact.Even the relatively low emissions from clean coal plant are greater than those from natural gas-fired electricity generation. With climate change commitments requiring the reduction ofoverall carbon dioxide emissions, the clean coal technologies may only become an option wherethey replace a ‘dirtier’ technology, which is old coal or oil plant.
On a world-wide basis, coal will remain a major primary fuel for at least the next two decades.Countries with a large indigenous coal resource and a rapidly growing demand for electricity,such as China and India, will inevitably build significant new coal-fired electricity generatingcapacity. In these circumstances, however, competition arises from traditional pulverised fuelplant which is cheap and an established technology. This issue cannot be underestimated.
There are two aspects to be considered when exploring the future potential importance of cleancoal. The first relates to the fuel. Coal is the most abundant of the fossil fuels and therefore has along term future after natural gas and oil reserves have been exhausted. Thus, the long termprospects for clean coal are good. However, this assumption is based upon the concept that thereserves are accessible. The European (deep mine) coal industry is shrinking rapidly and isalready a tiny proportion of even the industry 20 years ago. If this decline continues until thereis almost no remaining European deep mine industry, many of these current reserves willbecome inaccessible and cease to be a fuel source.
The second aspect is the technology. Coal is a major world wide energy source for electricitygeneration owing to its abundance of supply, and it will continue to be so for many years.However, coal-fired generation will only achieve its full potential if clean efficient plant isdeveloped and installed. Therefore, it is imperative that the best technological options for cleancoal are developed as soon as possible in preparation for its resurgence as the technology ofchoice.

Energy Technology Strategy 1995-2030: Opportunities from the Global Warming Threat 99
Economic competition, constraints and costs: “technology push” and “demand pull”
The factors affecting economic competition are related to the fuel itself and the technology. Incomparison with a few decades ago, coal is now a cheap plentiful source of fuel, especially fromthe open-cast mines in South Africa, Australia, Asia and Latin America. Nevertheless, in aEuropean context, coal is relatively expensive, mainly owing to the currently low gas prices.Europe has a large natural gas resource, but this is expected to start depleting within the nextcouple of decades. Once gas prices increase, as is foreseen, coal will again become an economicoption for electricity generation. On the other hand, a major threat to the coal industry is theprospect of the introduction of green taxes, such as a carbon tax. This will penalise coal andmake it relatively uneconomic in comparison with most other competing fuels.
With respect to the technologies involved, clean coal is still an uneconomic option.Demonstration plant needs to be constructed, so that experience can be gained of the theoreticalconcepts associated with some parts of the generating process. The consequence over time willbe an established range of technologies that are reliable and which can compete againstalternatives.
Both technology push and demand pull have affected the development of clean coal. They bothhave positive effects for the development of clean coal technologies. In the present Europeanmarket, there is very little scope for clean coal in the short term. However, the medium and longterm prospects for the technologies involved can only be brought forward if demand isstimulated by government.
As the European electricity market becomes more liberalised, clean coal plant will onlypenetrate to significant levels if it becomes economic against alternative fuels and technologies.This can be achieved by subsidising the capital cost of the plant or by subsidising plantoperation. Plant operation can be subsidised by receiving a premium price for electricitygenerated (similar in principle to the UK Non Fossil Fuel Obligation) or by reducing operatingcosts (tax credits or fuel subsidies - for example, the former German KohlPfennig, Spanishelectricity subsidies, etc)
The alternative means of stimulating demand is to force it. This is achieved through regulationsrequiring the implementation of clean coal plant, or by preventing the market penetration ofcompeting options.
Results of R&D
Research and development in clean coal has two effects for the technology. Ultimately, it hasthe effect of making it more economic, with the major issues being:
• operating efficiencies
• emissions (sulphur dioxide, nitrogen oxides, particulates)
• ash management and disposal
• control of the combustion process
Secondly, R&D is used to build demonstration plant so that the theories can be tested. Thelessons learnt from full-scale plant are fundamental as part of the demonstration process.

Energy Technology Strategy 1995-2030: Opportunities from the Global Warming Threat 100
In terms of R&D management, there is also the question of combining all of these separateissues for the completed plant, as different areas of research can impinge upon the studies beingperformed in a different section of the electricity generating process.
Therefore, in order to achieve the best benefits and value, it is vital that research anddevelopment is co-ordinated so that all results can be integrated to provide a valuable product.
Conclusions: Prospects for Clean Coal into the 21st Century
On a world wide basis, the prospect for clean coal is extremely good, especially in rapidlydeveloping markets such as Asia. This is especially the case in more remote areas where theavailability of alternative fuels is poor. However, in these countries, speed of development isoften the primary concern and the traditional pulverised fuel combustion plant is often selected,mainly because the technology is established, easy to construct and cheap. Therefore, it is inthese situations that the advantages of clean coal, such as higher efficiencies and loweremissions, need to be emphasised through international agreements (climate change - Kyoto),legislation and regulation within these countries.
In Europe, there is little perceived short term competitive scope for large investment in cleancoal technology plant, mainly owing to the low cost of natural gas and the maturity of themarket itself with minimal growth expected. However, in the medium to long term, as naturalgas becomes a more scarce fuel and prices increase, and in conjunction with further economicimprovements in clean coal technologies, clean coal can expect to receive a renaissance as afeasible option for new large scale electricity generating plant.
Another major issue is environmental legislation or taxation related to climate change and acidrain, in particular a “carbon tax” related to carbon dioxide emissions. This legislation can haveboth a positive and a negative effect on the feasibility of clean coal. On the positive side, it willencourage the implementation of clean coal plant as opposed to pulverised fuel plant.Conversely, a carbon tax will penalise coal and possibly prevent its widespread marketpenetration.
In terms of research expenditure, coal is a medium to long term fuel option, which will maintaina significant presence in world wide electricity generation. The future of coal combustion isthrough the introduction of clean coal technologies on a wide basis. R&D and demonstration isnecessary to achieve economic competitiveness for these technologies, and to enable clean coalto achieve a significant market share in electricity generation. However, it is vital that cleancoal research is carefully co-ordinated so that the optimal benefits can achieved for the minimalcost.
Therefore, it may be concluded that clean coal has the potential to become a major technologyfor electricity generation. However, there are several risks and possible obstacles in Europe interms of security of fuel supply, which is less the case in countries that still have large amountsof accessible reserves. Other risks include environmental regulations, technologicalimprovements, cost reduction and market confidence that have to be met or overcome, if cleancoal is to achieve its potential.

Energy Technology Strategy 1995-2030: Opportunities from the Global Warming Threat 101
4.3 Fuel cells for stationary and mobile applications
by S. MIMA, IEPE
Fuel cells technology, by directly converting fuel chemical energy into electric energy, can attainhigher yields than that of thermic machines. Apart from their high global performance in thedirect production of electricity, fuel cells present some other advantages: silent functioning,small pollutant emissions, relatively small size, good performance in partial charging, modularconstruction, short manufacturing time, quick replacement and economic maintenance. For allthese reasons, fuel cells promise major implementations in a near future.
The trajectory of an efficient and clean technology, but still too expensive
Since 1990, fuel cells seem to have experienced a renewed interest and a number of bodies areengaged in strategies of industrial or user development: a growing number of economic agents,energy suppliers, manufacturers of production material, important chemical industries and R&Dorganisations.
More than a technological trajectory, it must be referred to as a family of trajectoriescorresponding to the type of electrolyte used: Alkaline Fuel Cell (AFC), Phosphoric Acid FuelCell (PAFC), Molten Carbonate Fuel Cell (MCFC), Solid Oxide Fuel Cell (SOFC), PolymerElectrolyte Membrane Fuel Cell (PEMFC). The evolution of this family or cluster ischaracterised by its increasing variety, which is due to the determination of the agents concernedabout fuel cell production to adapt to all the possible implementations.
Although a hundred demonstration operations are taking place in the world nowadays (Table 1),fuel cells are still at an initial stage of their life cycle:
• Phosphoric acid fuel cells (PAFC), which constitute the first generation, are the only ones ata pre-commercialising stage.
• The second generation, molten carbonate fuel cells (MCFC) and polymer electrolytemembrane fuel cells (PEMFC), are at a stage of large-scale demonstration prototypes.PEMFC prototypes with a 10 – 30 kW capacity have been tested in their application totransport and emergency supplying.
• Solid oxide fuel cells (SOFC), representing the third generation, are at a research-development stage.
Existing Units Installed Capacities Largest Capacities
PAFC 160 32 11 MW (IFC, Japan)
PEMFC 11 0.4 120 kW (Ballard, Canada)
MCFC n.a. n.a. 2 MW (ERC, USA)
SOFC n.a. n.a. 25 kW (Westinghouse, Japan)

Energy Technology Strategy 1995-2030: Opportunities from the Global Warming Threat 102
Fuel cells present interesting characteristics in the production of electricity :• 40% to 65% power yield• combined heat and power production (co-generation) that allows rising total yields up to
85%• great variety of usable fuels (natural gas, propane, butane, naphtha, methanol, carbonic oxide
gas, hydrogen, gasified coal, biomass or land-field gas...)• negligible noise and atmospheric pollution• moderate power and easily divisible standard size• small maintenance cost, due to the reduced number of mobile parts• high quality of the steam produced by MCFC and SOFC, which can be used for co-
generation both in buildings and industry.
They can become competitive from one hundred kWe to several MWe in three segments :
• gas-supplied sites of the tertiary sector
• isolated collective network sites
• interconnected sites or average power units (some MWe at some MWe tens) could beimplemented at the centre of a consumption area.
For some years, the furnishing of electric vehicles with fuel cells has been seriously considered,allowing autonomy of 250-300 km against the 80 km of our best batteries nowadays. Using fuelcells for mobile implementations requires the following:
• reasonable weight, linked to the problem of hydrogen supply and storage
• constant/steady power
• an almost complete insensitivity to atmospheric temperature
• rapidly replaceable spares and an excellent degree of reliability
Fuel cells can compete with diesel vehicles in road transport, and can substitute electric vehiclesin urban policies aimed at limiting local pollution, which is usually based on promoting cleanvehicles.

Energy Technology Strategy 1995-2030: Opportunities from the Global Warming Threat 103
Capacities
Applications
Type ofFuel Cell
Necessaryrequirements
10 kW 100 kW 10 MW 100 MW1000 kW
AFCPEMFC
PAFCMCFC
SOFC
Stationary :co-generation
decentralised production centralised production
Small decentralised units <==> Substitution ofthermoelectric units
Transport : inter-city bus fleets of lorries individual vehicleslocomotivesreasonable weightexcellent degree of reliability rapid start-up
high performancelarge variety of fuelslifespan of more than 5 yearshigh quality of the steam produced
Drawbacks to diffusionIt is obvious that fuel cells cannot easily find their way to substitute other rival paradigms in use.The different power-generation paradigms and internal combustion vehicles have benefited fromcontinuous improvements for a long time and constitute a lock-in for new rival paradigms.Besides, several other obstacles prevent commercialisation of fuel cells:Considering the very small number of fuel cells produced every year and the materialsemployed, the cost and the purchase price of a fuel cell remains high (table 2), their productionbeing characterised by few economies of scale, even less standardisation and a high intensity ofqualified work.
PEMFC PAFC MCFC SOFC
Present Cost($/kW)
n.a. 2500-100000(system)
n.a. n.a.
Objective($/kW)
46 (60 kW) mobile
2000 (40 kW stat.)
1000 (250 kW stat.)
250-400 (cell)
1500-2000(system 200 kW)
1500-200(system)
215-650 (cell)
1600-3750(system 50 kW)
Energy Technology Strategy 1995-2030: Opportunities from the Global Warming Threat 104
As consumers are not familiarised with the advantages of fuel cells, they are not being taken intoconsideration for future implementations. The fact that there is no well-established industry inthe production of fuel cells contributes to the high risk and cost and to the financing obstaclesfor their commercialisation.
There is great difference between the results divulged by laboratories and those of practicalimplementations. Considerable efforts are necessary to overcome the process of change from asingle cell, functioning in a controlled environment, to a cell module operating in a practicalimplementation.
Certain technical obstacles must be overcome before fuel cells are commercialised, especiallyfor large-scale mobile implementations: development of increasingly thinner proton exchangemembranes, optimisation of electrodes, minimisation of platinum...
There remain several technical and economic problems, especially in the storage of hydrogen, inthese same mobile implementations. In the case of the cells destined to be used in electricvehicles, hydrogen can be supplied either by on-vehicle storage of methanol, associated to areforming device which transforms fuel into hydrogen whenever necessary, or by pure hydrogenstorage. The latter can be stored in five different ways: as compressed gas, in its liquid formthrough intermediate metallic hydrides, in hollow microspheres and in carbon nanofibres. Thefirst option (methanol) is more convenient and cheaper than the second. In addition, it takesadvantage of the already existing petrol stations. On the other hand, as it produces some carbonoxide (CO) and carbon dioxide gas, it pollutes.
Competitiveness with other power production systems
Fuel cells can become competitive compared to other power production systems such as theGTCC, steam turbines, diesel units for stationary implementations, especially in co-generationranging from some hundred kW to some MW capacity. This is why their cost of capital must beinferior to 1500/1600$/kW depending on the implementations (specialised decentralised powerproduction, co-generation, centralised power production).
For mobile implementations, there are two arguments in their favour: the vehicle releases onlythe air coming from the steam and its yield is much higher than that of a motor submitted to thephysical limitations dictated by the laws of thermodynamics. The fuel cell market covers foursegments: city buses, fleet vehicles, individual vehicles and locomotives. Their diffusion bysector will begin with city buses and fleet vehicles before spreading to individual vehicles and,finally, to locomotives. Competitive access is more difficult for mobile implementations thanfor stationary implementations. In the case of fuel cell buses, if the cost of a PEMFC module is300$/kW, the bus will be still 30% more expensive than a diesel bus. Mass productioneconomies could make costs fall to less than 150$/kW. Furthermore, for fuel cell individualvehicles to become substitutes of electric vehicles in local anti-pollution policies based on cleanvehicles, the PEMFC system can not exceed 55-46 $/kW.

Energy Technology Strategy 1995-2030: Opportunities from the Global Warming Threat 105
Competitiveness between different fuel cell types
Several technical challenges remain unanswered and it is still too soon to foresee which of thefuel cells will reach commercial success. PEMFC and SOFC, which only contain solidcomponents, seem to be the most promising, since they avoid liquid electrolyte defects. Thus,SOFC can have simpler designs, cheap ceramic or metallic materials, which allows reducingcosts. Tests carried out in laboratories show that SOFCs can have more than a 10-year life span,that is, the double of liquid electrolyte cells. PEMFCs seem to be more suitable for transportimplementations: they work at relatively low temperatures (around 80º), providing significantenergy from atmospheric temperature, ensuring a short start-up time. They are insensitive to thepresence of carbon dioxide gas in the air, unlike "alkaline" fuel cells.
Evolution of agents’ strategies and support policies
The lack of information and the complexity of the technologies (AFC, PAFC, MCFC, SOFC,PEMFC), which demands a pooling of different abilities, have made it necessary for thedifferent agents to co-operate in the development of fuel cells. They are, namely, industrial firmsthat develop and sell fuel cells, gas and electricity companies, big automobile manufacturers andprofessional associations. The main industrial firms developing and selling fuel cells are: IFC(US), CLC (Europe), Toshiba (Japan), Ballard (Canada), Fuji Electric (J), ERC (US), Melco (J),Sanyo (J), IHI (J), MC-Power (US), BCN (the Netherlands), Hitachi (J), Westinghouse (US),MHI (J), Allied Signal (US), Dornier, Siemens, ECN (the Netherlands), Sulzer (Switzerland)Ztek (US), De Nora, Ansaldo Ricerche (It).
Their objectives for the financing of technical progression towards commercialisation are thefollowing:
a) in order to reduce costs:
- the reduction of surface area and volume per power unit
- the improvement order systems (i.e. intelligent or predicative systems)
- the manufacturing simplification
- the reduction of the cost of auxiliary elements and increase of their durability: turbo-compressors, filters, catalysts, etc.
b) in order to facilitate their exploitation:
- easy use and maintenance, especially for transport implementations
- normalising and modulating the elements, in order to facilitate technology exchange
- fuel cell integration in other equipment, especially in the event of motor overheating intransport
Gas and electricity companies are major fuel cell buyers, namely, General Electric (US), FujiElectric Company (J), Mitsubishi Electric Company (J), Elfraft, ELSAM (DK), Sydrakft,Vattenfall (S), Iberdorla (ES), ENEL, AEM, Acoser (IT) -the two latter being council services-,
Energy Technology Strategy 1995-2030: Opportunities from the Global Warming Threat 106
SEP (NL), Tokyo Gas (J), British Gas (UK), Ruhrgas (A), SNAM (IT), Naturgas Syd (DK),Imatran Voima (FN), Autriche Ferngas (AU), Enagas (ES), ENI (IT). These companies considerfuel cells as an opportunity to approach their clients and to produce electricity according to theirclients’ needs, with more than 60% efficiency, or 80% in co-generation.
With more or less enthusiasm, automobile firms devote an increasing amount of their budget tothe search of a fuel cell vehicle. Up to now, the rare number of vehicles of this kind, the size of asmall lorry, were small factories where almost all the space was occupied by the fuel cell, itscompressor and its tank. Progress has been made towards miniaturisation. Daimler-Benz is thefirst major international vehicle producer to have presented an electric passenger vehicle run onfuel cells. The first prototype model, called "New Electric Car" (NECAR I), was presented inApril 1994 by Mercedes-Benz. Daimler-Benz presented, the first "standard" monospace run onPEMFC and still developed by Ballard Power System, in June 1996. This prototype is the firstto keep the vehicle’s capacity. This vehicle can develop 50 kW gross power, with a weight of 6kilogram per kW system. It reaches a maximum speed of 110 km/h, with a 250-km autonomy.Other producers in this field are: General Motors, Ford, Chrysler, Toyota, Honda, BMW andRenault.
Public policies
Important efforts have been displayed all over the world to develop this technology, but fuelcells commercialisation is slower than it was thought to be. It has been given a more activesupport in Japan and the United States, by means of governmental programmes and privatecompanies. These efforts have been less systematic in Europe, where interest timidly arose onlyin 1985.
The present challenge for governments is to provide a “market pull” in the first years ofcommercialisation, when costs are still higher than competitive access prices, due to therelatively low production levels.
Distribution of fuel cell production units should also benefit from the reinforcement ofenvironmental measures, as opposed to other power production means, and the pressure exertedtowards some power production decentralisation in Europe.
Cost perspectives
On technical grounds, there is a great difference between the results divulged by laboratoriesand those of practical implementations. Considerable efforts are necessary to overcome theprocess of change from a single fuel cell, functioning in a controlled environment, to a cellmodule operating in practical implementations.
Currently, fuel cell production is characterised by few economies of scale, even lessstandardisation and a high intensity of qualified work. The mass production effects associatedwith large-scale production and increasing standardisation must be sought in order to reachproduction levels. This standardisation will allow fuel cells to approach a level which can rivalpresent-day power production techniques, in the case of stationary implementations. For mobileimplementations, it must be even greater, if we want to rival already-existing vehicles at a

Energy Technology Strategy 1995-2030: Opportunities from the Global Warming Threat 107
competitive level. But the perspectives of access to competitiveness are different, according tothe hypothesis held back by the mass production effects and start-up costs considered. We mayconsider as start-up costs, the hypothesis defended by Daimler-Benz researchers, according towhich technological improvements will allow a factor-10 cost reduction of current prototypes,up to the year 2003. Therefore, PEMFC cost estimates for 2003 will be 5,500-6,800 $/kW. Basiccumulative production is 2 MW. To estimate possible dates for access to competitiveness, wecan refer to the following hypothesis of the cost of competitive techniques: the cost of capital ofa combined cycle is 600 $/kW, that of a diesel bus, 150 $/kW, and that of a private vehicle, 55$/kW. In a pessimistic scenario, built around the analysis of learning curves, fuel cells will becompetitive for combined cycles after the first half of the coming century. Following the mostoptimistic scenarios, PEMFCs will be competitive for combined cycles around 2020, for dieselbuses in 2050 and for individual vehicles from the year 2070.
An approach to commercialising constraints must take into consideration not only unittechnology costs, but also the cost of the associated infrastructures. For mobile implementations,it implies enormous investments to take the hydrogen to the petrol stations and deliver it to thedrivers in a safe and secure way. There is no doubt that Americans and Germans prefer theoption of an in-the-boot device, enabling the production of hydrogen from methanol. Thissolution has the advantage of being supported by already-existing petrol stations.
Perspectives for market penetration
Some experts consider that fuel cells will surpass world-wide sales outlets of 1500-2000MW/year. Taking into account the capacity of current installations in the world, theseobjectives, especially for the year 2000, seem to us to be unattainable.
In Europe, the four energy scenarios 2000-2020 of the European Commission foresee a fuel cellinstalled capacity of 4250 MW to 10240 MW -depending on which scenario-, which represents1-2% of the overall electric capacity estimated for 2020. These estimates also seem somewhatoptimistic for the 2001-2005 period, because they imply a rapid increase of fuel cell productionduring this period. If we do not take into account this constraint and if we work on pessimisticcost estimates, achieving these objectives needs the utilisation of market niches for stationaryimplementations (which concern decentralised power production, co-generation or centralisedproduction): the relevant investment is about 9 thousand million dollars.
Fuel cell diffusion for stationary implementation will probably begin by a specialiseddecentralised production, then by co-generation prior to extending to centralised production,where competitiveness is more difficult to achieve because costs are rather low.
Even if environmental concerns, especially those linked to urban pollution, allow us to believethat mobile implementations will have a priority in fuel cells diffusion, we support the idea thatthis diffusion will begin by stationary applications, because:
-competitiveness can be more easily reached in this sector
-mass production effects could allow, in this sector, a procedure to lower the costs
It is doubtful whether a relay procedure between these two types of implementation functionsthe opposite way. In the transport market, fuel cell diffusion will probably start by city buses and

Energy Technology Strategy 1995-2030: Opportunities from the Global Warming Threat 108
fleets of lorries, before spreading to individual vehicles and, finally, to locomotives. It will beboosted by environmental regulations.
4.4 Wind power generation
by Ph. MENANTEAU, IEPE
At the beginning of the eighties new tax policies in the United States favoured the use ofrenewable energy, and a market for low and medium power turbines was created. Tax incentivestogether with the regulation concerning the conditions of repurchasing electricity by electricpower companies produced an extremely rapid increase in the number of devices installed,especially in California which became the “the world’s biggest wind centre” (I. Miles et al,1994). From 1981 to 1986, wind power installed in California thus passed from 10 MW up toalmost 1000 MW, but this rapid growth was suddenly interrupted because incentives wereeliminated in the mid-eighties.
The elimination or reduction of both federal and Californian State tax incentives in 1985, aswell as the petroleum counter-crisis, noticeably slowed down the rate of installations in theUnited States: 400 MW were installed in 1985, 300 MW in 1986, 150 MW in 1987 and 60 MWin 1988. Keeping in mind that the American market of wind power devices was relativelyimportant at that time, the industrial over-capacity, caused by the collapse of the demand,resulted in extreme competition between producers and some of them disappeared as pricesdropped.
The limitations of the American market led European producers (and mainly the Danish whohad high participation in the United States) to concentrate again on their national markets. In theNetherlands and in Great Britain, wind power production thus became really significant at thebeginning of the nineties.
A remarkable fact is that wind power generation is not only developed in industrialisedcountries. India in particular experienced an important growth since the beginning of thenineties, to the point that the Indian market was second, after Germany, concerning new windpower installations (B.T. Madsen, 1995).
At the end of 1996, wind power installations in the whole world exceeded 6000 MW and theannual electricity generation went beyond 10 Twh. This is low with respect to the scale of theelectricity sector in general, but not to be totally ignored, because the growth rate of the globalmarket has reached 20 to 30% during the last years.
Introduction to wind power technology, present performance and perspectives
Wind turbines allow the production of electricity for individual implementations (in particularlighthouses and buoys) or for the electrification of houses or villages in regions which are noteasily accessible, especially in developing countries.

Energy Technology Strategy 1995-2030: Opportunities from the Global Warming Threat 109
Nevertheless, since the beginning of the eighties, the development and implementation of windpower generation is mainly centred on electricity generation to feed the power supply system. Inorder to reduce connection, infrastructure, maintenance and other costs, wind power devices aremore and more systematically regrouped to form wind power centres, also called wind farms,which may contain hundreds of turbines (California) and generate power of up to tens of MW.
Currently, in the most favoured sites as regards wind resources, the costs to produce wind powerkWh are similar to those of traditional coal-fired power stations, but economic competitivenessis still far from being reached in more conventional sites.
Furthermore, the rotor diameter, which was of 10 to 12 m in the early eighties, nowadaysincreasingly reaches 40 m, corresponding to 500 kW nominal power (as opposed to 50 kW witha 10 m rotor), with 40 m high masts.
Nowadays, 750 kW windmills are being built and commercialised, and 1 500 kW devices with60 m rotors are also being tested. These much larger dimensions of windmills are justified byeconomy-of-scale researches: more favourable distribution of very high windmills, higherproductivity with larger rotors because of comparably lower maintenance costs, betterexploitation of the available sites, etc.
Nowadays, the average productivity of Danish windmills (450 kW model) reaches 900 kWh/m2
whereas the first models (55kW) produced approximately 400 kWh/m2. Similarly, in Californiathe average productivity increased from 500 kWh/m2 in 1985 to 850 kWh/m2 at the end of theeighties, and some wind farms with particularly good wind conditions even reached 1450kWh/m2 (San Gorgonio Farms - USA) or 1300 - 1400 kWh/m2 with the 10 best Danish devices(P. Gipe, 1995).
The costs of wind power generation today are of about 0.05 up to 0.10 ECU/kWh (TERES II,1996). It is obvious that this is still far from the 0,02 $/kWh stated by the DOE at the beginningof the nineties, and it is doubtful that it may ever be reached (K. Karas, 1992, quoted by P.Gipe). Nevertheless, there is a significant progression with respect to the costs of the firstCalifornian installations in 1981 and 1982 which were near 0,50 $/kWh.
Turbine installation cost almost 3-4000 $/kW at the beginning of the eighties. Nowadays, theycost approximately 1200 $/kW (P. Gipe, 1995) or 1100 $/kW (Braun and Smith, 1992) formedium power devices (4-500 kW). This includes the turbine manufacturing costs but those forinstallation, foundation, road access, connection to the power supply system, the purchase of thesite, etc. have to be added, constituting 25 % to 50 % of the turbine cost. According to an AIEanalysis in the principal wind power developing countries average manufacturing costs were of780 - 1200 $/kW in 1995, i.e. an average of 1000 $/kW which means a slight decrease comparedto the former year (AIE, 1995). In 1995, the average total installation costs were of about 1300$/kW in these countries.
Operation and maintenance costs have notably decreased during the last 15 years, and, atpresent, may reach 0.01 $/kW in the most favoured sites. Nevertheless, these costs, like those ofinstallation, are totally variable because they depend on the site, the number and the dimensionsof the installed windmills.

Energy Technology Strategy 1995-2030: Opportunities from the Global Warming Threat 110
Environmental impacts
Atmospheric emissions caused by wind power generation are insignificant compared to thoseproduced by fossil energies. Usually they result from the energy contained by materials or usedto construct, to install or to maintain the devices.
The noisiness of windmills is often mentioned and not totally to be neglected although the noiselevel near windmills is rather limited: a modern windmill of 300 kW operating at a wind speedof 8 m/s produces 45 dB at a distance of 200 m, which is “noisier than a bedroom at night butquieter than a house during the day” (EWEA, 1991).
The visual impact of windmills, and even more so that of wind farms, in the environment andoften in nature reserves, is probably the main environmental disadvantage of this new type ofenergy. The first Californian installations, in particular, have significantly contributed to form apejorative image of wind power.
Perspectives and expected progress with respect to performance
The energetic performance of modern windmills, which is already relatively high (80% of thetheoretically available energy is extracted by the turbine at an optimum velocity – M. Grubb,1996) can be only slightly increased.
Furthermore, to improve the performance of the devices, their dimensions have to be increasedin order to profit from the much higher wind speeds at more altitude and to enlarge the sweptrotor surface. This method, in use since the beginning of the seventies allows the average powerof commercialised windmills to become 10 times higher, should still be applied for some years.The 500 kW threshold reached in the mid 90s is being surpassed by new 750 kW devices nowon the market.
Present pilot studies with offshore wind power generation seem to be quite interesting. Bymeans of offshore production it is possible to profit from the much higher wind speeds andbetter location, avoiding major visual impact by installing the wind farms at a certain distancefrom the shore. Nevertheless, the obtained increase in productivity does not compensate for theextra costs of foundations, electric cables and maintenance up to now, so that an offshoreproduced kWh is 30 to 60 % more expensive than that of the equivalent overland configurations(M. Grubb, 1996).
The global wind power generation capacity, almost zero in the early eighties, has reached 6000MW in 1996, i.e. an annual electricity production of 10 TWh.
The distribution of world-wide installed windmills has evolved in a revealing way during thelast years because the United States, which still regrouped 55 % of the world’s capacity in 1993,only represented 27 % of it in 1996, whereas Europe passed from 41 % to 57 % at the sametime. To be exact, in 1990 wind power devices installed in Europe only produced 500 MW, but3500 MW were reached in 1996, which means an average growth rate of 40 %/year.
The European Wind Energy Association (EWEA), which regroups the industrialists of thesector, aims at covering 10 % of the energy requirements of Europe in 2030 by means of windpower, i.e. installations to produce 100 000 MW (EWEA, 1991). Such a target would requiregrowth rates as high as those observed during the last years in Europe over long periods of time.

Energy Technology Strategy 1995-2030: Opportunities from the Global Warming Threat 111
Taking into account the enduring economical limitations and the difficulties involved inimplanting new sites in some countries, this objective is probably inaccessible although it willcertainly mobilise the whole European wind power industry.
The importance of the resource and the limitations of its availability
A study, carried out in Denmark, evaluates the resource at 780 TWh. It is based on thehypothesis of the systematic and evenly distributed installation of 1 MW windmills evenlydistributed over the all areas.
The introduction of new limitations, visual impact, noise, impact on the fauna, etc. lowers thispotential by some 10 TWh. This potential might be completed by offshore production of amagnitude similar to the national electricity generation of 26 TWh in 1989. The same studycarried out on a European scale (12-members-Europe) led to a potential of 620 TWh, i.e. 40 %of the total electricity generation (M. Grubb and N. Meyer, 1993).
However, the problem of irregularity is more limiting. As the availability of the resource isuncertain, wind power-stations can not guarantee their maximum installed power at a givenmoment, and thus, the installed wind power generation capacity is not 100 % to be counted onfor annual peaks and could weaken electric systems.
Most experts agree that a relative 5 to 10 % wind power contribution would not produce anyweakening of the power supply system (AIE, 1993 quoted by M. Kliman). It would only beinadvisable for contribution levels over 25 to 45 % according to the envisaged power supplysystem (M. Grubb and N. Meyer, 1993).
R&D actions
After the petrol crisis the renewed interest in wind power resulted in the promotion of vastresearch programmes in industrialised countries. These programmes are mainly oriented towardsthe development of three large-sized devices. The economy of scale research seems to be themost appropriate and rapid method to reduce turbine costs. Therefore, first the Americans andthen the Europeans established research programmes, implicating aerospace industries (Boeing,British Aerospace, Messerschmidt, etc.) or other agents involved in the sector like NASA, inorder to develop wind power turbines capable of producing several MW. Some of these deviceshave reached 3 MW with rotor diameters of almost 100 m, as for example: WEG LS-1, 3MW(GB), Mod-5B, 3,2 MW (USA), WTS-4 4 MW (USA), Growian 3MW (D).
These programmes were doomed to failure. This is made clear by the fact that, at the same time,the Danish were developing their own technological trajectory based on low power windmills(7-30 kW) and on a tried and tested idea. This trajectory has been boosted by incrementalimprovements to the initial concept and to operation apprenticeships. These have beenencouraged by market enlargement policies (“market incentives”) established by the Danishgovernment to favour small independent producers (especially cooperatives). This is how thepresent technical standard has been reached. The 500 – 700 kW commercial devices currentlyavailable clearly show their derivation from the first Danish windmills of some ten kW.

Energy Technology Strategy 1995-2030: Opportunities from the Global Warming Threat 112
The prevailing trajectory has consisted in progressively increasing the power of windmills basedon a very classical conception, but without apparent limits so that certain companies are gettingready to commercialise 1 MW devices. The advances on the power (and size) scale have beenachieved by the validation of previous steps and the incorporation of accumulated knowledge.This approach, which may not seem very ambitious, allowed a significant progress to take place.This progress was evident both in terms of productivity of the devices (250 – 300 kWh/m2 in1980 to 600 kWh/m2 in 1988 and 800 kWh/m2 in the mid-nineties – source EWEA and P.Gipe) and of production costs (4000 $/kW at the beginning of the eighties to 1250 $/kW in themid-nineties – source P. Gipe, 1995). At the same time the reliability and availability of turbineswas considerably improved.
Consequently, technological progress in the wind power sector seems now to confirm a uniquestandard constituted by a horizontal-axis windmill with two or three blades mounted on atubular tower about 50 m high, which generates 500 to 750 kW. Present R&D programmes aimto pursue this trajectory incorporating improvements which are basically incremental (variablevelocity, compound materials, easily adaptable towers, etc.), but, in general, technological issuesare not the only ones to be considered in the definition of research programmes. In this aspect,the orientations given by ETSU in Britain for wind power research programme are veryinstructive.
The stimulation of the demand
Most countries resorted to investment aids in order to facilitate the appearance of wind powergeneration established by the PURPA Law in the United States. Investment subsidies like tax-deductible credits have significantly contributed to the explosion of the Californian market.Similarly, the first Danish support programmes for the wind power market were based on a 30% subsidy of the investment costs. This subsidy was then progressively reduced, then abolishedin 1989.
Fixed price systems oblige electricity companies to buy the electricity generated by independentproducers. In general, they are calculated on the basis of average domestic sale prices or of theavoided costs, independent of supply guaranties.
Finally, these incentive price policies may be completed by the creation of reserved marketscorresponding to a fixed proportion of electricity production to be generated by windmills, orrenewable energies in general. In Great Britain, for example, 1500 Mw are reserved to beproduced by renewable sources till 2000, within the framework of the NFFO (Non Fossil FuelObligation). In France, continual invitations to tender for EOLE 2005 should provide the meansto reach the 250 to 500 MW objective.
The industrial participants
The wind power generation industry has advanced considerably during the last fifteen yearssince the creation of small craft enterprises by militant and enthusiastic businessmen in theseventies.

Energy Technology Strategy 1995-2030: Opportunities from the Global Warming Threat 113
Europe, without doubt, occupies the first place in the world’s wind power generation sector.Danish constructors are the European leaders and hold a very important place in theinternational market: in 1994 Danish exports represented 50 % of the global market. Germanand Dutch constructors have also followed the development of their national markets stronglyboosted by public policies, but up to now they have been less present in the international market.Similarly, the American constructors with the exception of Kenetech, handicapped by the factthat wind power technology is mainly increasing in Europe, are relatively insignificant in theglobal market.
Constructor Accumulated store inMW
Accumulated store
number of devices
Vestas (DK)
Kenetech (USA)
Micon (DK)
Bonus (DK)
Nordtank (DK)
Enercon (D)
Mitsubishi (J)
HMZ Windmaster (B)
Nedwind (NL)
Wondworld (DK)
623
400
265
>250
253
250
>210
> 95
> 55
> 50
4 500
3 900
>2 000
2 000
2 123
nd.
370
nd.
nd.
nd.
Source F. Armand, 1995
4.5 Photovoltaic electricity
by Ph. MENANTEAU, IEPE
The photovoltaic cell (PV) is constituted of semi-conducting electronic components. The cellconstitutes an elementary power generator. The resulting current is a function of the lightintensity and the cell’s surface and yield. A 10cm x 10cm cell generates energy of the order of1.5 Wc under a 0.5 V-tension. Several elementary cells are therefore connected to each other ina module, in order to provide a greater amount of energy and tension, i.e. 35 Wc under 12 V.The final product commercialised by the PV industry is the module, which can then beassembled in the shape of panels regrouping several modules.

Energy Technology Strategy 1995-2030: Opportunities from the Global Warming Threat 114
The major relevance of PV energy stems from its functioning principle: the electricity is herebyproduced with the absence of mechanical pieces in movement, without combustion or pressure,from a renewable energy, solar light. PV energy presents, at least in theory, reliable and durablequalities. Its functioning does not produce any gas emissions or noise. Furthermore, the PV canbe separated into modules. A PV generator can be limited to a module of some tens of watts orproduce several hundreds of kW, or tens of MW.
Technological aspects
Silicon represents 97% of the world’s PV production: crystalline silicon (mono- and multi-) andamorphous silicon. The development of other technologies is still marginal but they could play amore important role if the PV technology were developed.
• Crystalline silicon
The basic raw material used is the silicon coming from the wastes of the electronic industry.This material is recast to obtain ingots that are later cut in layers several hundred microns thickto form PV cells.
Multicrystalline silicon presents several advantages compared to monocrystalline silicon. Itdemands lower quality raw materials, the production technique of the ingots is faster and lessenergy- consuming, in short, cells are directly produced in a squared shape that allows bettermodule refilling rates. These advantages are in part compensated by the lower crystallographicquality of the material, which implies an inferior photoelectric yield to that of monocrystallinesilicon.
The highest current yield of industrial multicrystalline cells is 13%, which corresponds to theyield of the functioning modules of the order of 10%. The theoretical yield limit for crystallinecells is close to 30%. Nowadays, crystalline silicon presents the best compromise between yield/ cost of production.
• Amorphous silicon
Production processes of crystalline photocells are not very compatible with continuousproduction processes that would allow an important reduction of production costs. Thin-layerelaboration processes go beyond these constraints by depositing very thin layers of semi-conducting material on glass substratum. The main thin-layer technology, and the only onenowadays industrialised, is the amorphous silicon (a-Si).
Production costs are relatively low and important basic perspectives subsist thanks to theeconomies of scale research. The main a-Si shortcomings stem from current yields, which aresubstantially inferior to those of crystalline cells: this yield is unstable in solar rays and can fallto 4-5%-stabilised yield in real conditions of use.
Other components of PV systems
A PV system also comprises module assembly structures to ensure mechanical resistance, toorientate them, as well as electric connections and, possibly, a storage system and electronicorder system. In the event of very powerful systems, the acquisition of a site, its preparation, the

Energy Technology Strategy 1995-2030: Opportunities from the Global Warming Threat 115
impact studies, the network connections, etc., contribute to the overall cost of the installation.Specific batteries were developed for the storage of electricity some years ago for isolated PVsystems, allowing for high discharges which automobile batteries could not admit.
Concerning metallic structures, one of the main perspectives for development is moduleintegration in ceilings or façades. This latter possibility is being rather seriously considered bythe PV industry because the cost of the modules only exceeds slightly 50% of the total cost of aPV installation. With no symmetrical progress of the costs of the systems, the improvement ofthe cell yields or the decrease of their production cost will only exert a small influence over thecost of the PV kWh.
Investment, functioning and maintenance costs
The cost of a PV installation can be systematically divided into two parts: the PV element strictosenso (the modules) and the non-PV components. Today, the production cost of the modules isestimated to be 420 ECU/m2 by industrialists (EPIA, 1996), (3.33 ECU/W) for monocrystallineand amorphous silicon (2+/-0.5) ECU/m2. Estimates for the cost of non-PV components are anaverage of 3500 ECU/kW (but without batteries) (Wrixon, 1993). In general, a percentageranging from 40 to 60% of the total cost of the system is discounted from the non-PVcomponents’ total cost.
In order to assess the cost of PV equipment, distinctions should be made according to the rangeof power envisaged and the applications regarded (several W or tens of them, versus some MW,autonomous systems supplied with stock versus network systems).
The total cost of PV equipment is rather variable, depending on the power installed, or thenature of the service to be rendered (small-size autonomous system or electric plant connectedto the network). In Europe, the cost of a power production plant connected to the network rangesfrom 6000-8000 ECU/kW (Wrixon, 1993), whereas the cost of a system integrated in a façadeor roof is supposed to be lower than that of a power plant (Wrixon, 1993). For smaller-sizeinstallations or smaller volume orders, costs can be rather high. So, for example, small unitsdestined to ensure lighting in the villages of non-electrified developing countries (an average 50Wp) can reach or surpass 20 $/Wp (16000 ECU/kWp), including the costs of the usageequipment.
Anyhow, the costs reported in the literature are rather variable even for apparently comparableequipment, of the order of 1 cent/kWh.
Present estimations for PV power production costs range from 25 to 300 cents (1990) / kWh, 25to 250 cents / kWh for isolated systems, but 30 to 40 cents (0.24 to 0.32 ECU/kWh) for PVplants.
Environmental impact
The environmental impact of PV-cell power production is small. Surface occupation is clearlyone of the main environmental limitations of PV energy. The issue of toxic wastes follows theuse of potentially dangerous material. Nevertheless, the amounts at stake are small compared to

Energy Technology Strategy 1995-2030: Opportunities from the Global Warming Threat 116
other industrial sectors and recuperation and treatment techniques should reduce the scope of theproblem.
Economic perspectives
Concerning crystalline silicon, industrialists estimate that they will be reaching 15% return atthe beginning of the 20th century, then 18%, by improving the existing processes. Theproduction of amorphous silicon tandems should reduce instability problems and ensure stablereturns around 10% or more towards 2005-2010.
At the same time, the production costs of the modules will continue to decrease even though therhythm may be relatively uncertain. The cost of the production of crystalline PV modules couldevolve from 350 to 250 ECU/m2, that is, a maximum cost of 1.8 ECU/Wc by 2010. The cost ofproduction of the a-Si modules could reach 0.8 ECU/Wc (80 ECU/m2). Parallel improvementsare envisaged on non-PV components resulting from successive learning stages in this field. Thetotal cost of a PV plant with non-PV components could, therefore, descend to 1000 ECU/kW(from a 3000 ECU/kW minimum today) for an ideal configuration based on moderntechnologies.
World market
World-wide sales of PV in 1994 amounted to almost 70 MWc. The total installed capacity allover the world is estimated at 350 MWc, excluding non-energetic implementations.
Traditionally, four main categories of PV energy implementations have been distinguished:
• professional implementations: power supply of isolated or difficult-access equipment
• interior or leisure implemantations
• isolated systems for domestic or collective use: isolated systems are used in mountain huts,villages or rooms not connected to the network
• systems connected to a network: this category covers both “powerful” power PV plants(beyond 1 MWc) and small individual equipment (several kWc of the “solar roof” type.
By prolonging the rhythm of growth observed in the period 1984-94 (15%/year), world-wideannual sales in 2010 would rise to 630MWc, i.e. an accumulated installed capacity of about4000MWc (EPIA, 1996).
Experts agree in predicting a great increase in the isolated PV equipment market for the comingyears, and particularly, as regards the equipment destined for rural power supply of developingcountries.
PV cell producers
The production of PV modules mainly concerns to OECD countries: Europe (essentiallyGermany, France, Italy, Netherlands and the United Kingdom), Japan, USA. Two agents, Japanand USA, dominated the market to a great extent in 1987, but Europe has gradually imposed

Energy Technology Strategy 1995-2030: Opportunities from the Global Warming Threat 117
itself and, today, it occupies the second position following the United States. Module productionexists outside the OECD (India, China, Brazil and Argentina) but still remains minority.
About twenty companies represented more than 80% volume of the world market in 1994, butthe first five already accounted for more than a 50%. Siemens is the undeniable world leaderwith a 20% of the market share (assigning this production to Germany) after having recoveredthe American firm ARCO Solar. Most of these firms belong to important groups, companiesfrom the oil, chemical or electronic sector. The participation of electric companies is much morelimited and relatively recent. The rate of use of the production capacities for x-Si are an averageof 75% (84% for USA and 60% for Europe). On the other hand, the rate of use of the capacitiesfor a-Si is inferior to 50% (36% for USA).
This over-production results in a double research movement of the economies of scale,especially in amorphous silicon production units, and of the over-optimistic anticipations of theexpansion of the market, particularly for a-Si.
Public policies
Public policies in favour of PV energy are divided between programmes aimed at improving theperformance of commercial branches, at developing new technologies, at experimenting newimplementations, etc., and actions to support PV markets, investment grants, protective tariffpolicies, etc.
R&D policies of the IEA countries in the field of renewable energies are strongly dependent onthe political and economic contexts. Stimulated by the oil crisis of the 70s, they later sufferedthe double influence of the decrease of the oil price and of the constraints of public budgets.
Over this period (1984-94), the PV absorbed a third of the R&D public credits and itssupremacy strengthened even more in 1993 and 1994, since it was granted more than a half ofthe total budgets. R&D budget distribution per country reveals extreme concentration; 85% ofthe R&D credits assigned to PV correspond only to four countries: Japan, the United States,Germany and Italy.
In Europe, an important contribution to R&D is provided by the Joule programme (I & II). Atotal 32-million ecus have been devoted to PV researches (Joule I & II) and, particularly,relating to cells, improving x-Si performances, exploring the potentialities of new materials anddeveloping thin-layered cells.
The difference between demonstration and diffusion, in the case of PV installations, is notalways obvious since the number of units implied usually remains relatively limited (particularlyconcerning large production installations). However, programmes carried out by severalcountries (USA, Germany, France, Japan) are mainly concerned with diffusion, insofar asspecific and permanent incentive mechanisms are put into practice to encourage the adoption ofPV power production systems. Other parallel mechanisms help its diffusion in export marketsand, particularly, in the electrification of rural areas in developing countries.Certain countrieshave carried out specific aid programmes in this area.

Energy Technology Strategy 1995-2030: Opportunities from the Global Warming Threat 118
Chapter 5: Technology scenarios to2030: baseline and alternative
technology storiesBy A. Soria (IPTS), P. Criqui (IEPE), M. Bess (ESD) and N. Kouvaritakis (ECOSIM)
5.1 The nature of technological progress and breakthroughs
Technological development is a complex phenomenon that has drawn the interest of manyscholars. Understanding the nature of the forces behind the process of scientific discovery,technological innovation and know-how dissemination is a challenge for which many theorieshave been formulated and are still under discussion. It is customary to distinguish between basicresearch, often supported by public action, and applied research, whose outcome is a technologyof rival use, protected by intellectual property rights under some legal scheme. Precluding apriori any attempt to explain in a formal way the specific technology trends within the energysectors, it has been felt useful to construct several possible technology scenarios the systemcould be already moving to. However, prior to the description of them, this section aims atproviding some insight on the technology dynamics aspects relevant to the energy sector in ageneral and descriptive way.
5.1.1 Energy technology trends in the longer time scale
Historically, it has been noticed that the trends on energy intensity of the GDP exhibit anincreasing-decreasing shape. In stating this, it should be underlined that only commercial flowsof energy are considered. As economic development proceeds, the specific energy consumptionper unit output progressively grows up to a maximum level, from which it starts a steadydecline. The loss of weight of the industrial sector accompanying the massive tertiarization inadvanced economies is responsible for this phenomenon. As economic development diffusesacross countries, this pattern is often repeated. Nevertheless, the peak in the GDP energyintensity tends to lower as time advances and changes from place to place, according to theindustrialization model within each country. Thinking on a long-term basis, several economicscience scholars have pointed out the existence of long-wave economic cycles associated tospecific massive investment waves. Back to the pioneering work of Kondratieff, who firstidentified and characterized these long-term cycles, many theorists have regarded these waves asa particular case of the business cycle. Schumpeter was, however, the first in observing the link

Energy Technology Strategy 1995-2030: Opportunities from the Global Warming Threat 119
between economic cycles (and, in particular, long-term waves) and innovation clusters. We areinterested here in examining energy consumption trends in the light of long-wave cycles in orderto derive some clues about energy as an economic good.
The United Kingdom reached the above-mentioned energy intensity maximum somewherearound 1890. The United States and immediately after Germany and France reached theirmaximum energy intensity of GDP around 1920, just at the final phase of the long-waveeconomic cycle associated with the development of heavy metallurgical industries and massiveelectrification. From those countries, the USA (the first to reproduce the UK developmentmodel) reached the higher maximum, that was, nevertheless, definitively lower than the oneexperienced 40 years earlier in the UK. The maxima corresponding to countries industrializedafter the World War II were even lower, and one can expect that the pattern will be repeatedwith today’s emerging economies.
An interesting point to stress is that energy technology paths that the industrialized world havefollowed up to-date clearly match the well-known Schumpeterian scheme of a series ofdisruptive innovations followed by a number of incremental improvements onto the basictechnology. The massive bulk of industrial innovations that took place in the period 1890-1945had energy technologies as a triggering event: the massive diffusion of the electric bulb, theelectric engine, the alternator and the massive electrification that followed prompted a numberof patents and innovations. Simultaneously, the transportation technological regime softlychanged from railroad (a common transportation scheme) to individual cars and trucks, thanks(again) to a disruptive innovation: the explosion engine.
Since then, however, short and long-wave business cycles have passed, and the energytechnological regime has become more or less unchanged: the massive electrification processenhanced the centralized electricity generation and distribution scheme. Moreover,electrification experienced somehow a regression: when hydropower was not able anymore tosatisfy electricity generation, the technology shifted to the well-known combustion engineering-based Rankine cycle, inherited from the first industrialization upraise. Improvements have beenof incremental type both in the power generation industry as well as in the transportation modes.
Nevertheless, some changes in the power sector have been more noticeable. Indeed, two majornovelties have happen during the last 50 years within the power generation system. The first oneconsisted of the cluster of innovations around the introduction of nuclear power plants. Whennuclear power plants entered the power sector, a number of competing technologies wereavailable. After some years, and following a paradigmatic case of technology lock-in, Rankine-cycle based light water reactors started to dominate the sector, expelling the gas-graphitereactors and some other technological options. The main reason for this success is probably tobe found in the fact that the experience gained in small naval applications with LWR was easyto extrapolate to power generation on-shore plants (as well as other military and strategicconstraints). The LWR era started around the 70’s but it did not succeed in massively diffuse.Around ten years later, the nuclear programmes of most of the advanced countries were stoppedbasically because of the negative perception of the technology in the public opinion, as well asbecause the environmental concerns of the technology were not solved by that time. In addition,due to the possible military applications of the technology, the penetration of the technology indeveloping countries was restricted in an effort to prevent nuclear weapon proliferation.

Energy Technology Strategy 1995-2030: Opportunities from the Global Warming Threat 120
The second novelty appeared somewhere in the middle of the 80’s, consisting of the use of gasturbines for electricity production. Although at a first glance it was not a disruptive innovation,it may have hosted the seed for a future major perturbation within the electric system. First ofall, having flexible (either for baseload and peakload) electricity production without using asteam cycle was a significant technological change (inherited, by the way, from the fastexpanding air transport sector). Second, the possibility of installing combined Brayton-Rankinecycles opened the way to combined heat and power schemes achieving dramatic increases in theoverall energy conversion efficiency.
However, the importance of the emergence of the gas turbine is even greater due to the abilitythat this technology exhibits in order to downsize the generation units without any loss ofeconomies of scale. This may facilitate the diffusion of less centralized electricity generationschemes. The traditional view according to which the power industry was considered a typicalexample of natural monopoly is changing, at least in the power generation side. As aconsequence of its versatility, gas turbines may pull the penetration of renewable energytechnologies, since they are particularly well-suited for hybrid devices.
Looking towards a time horizon placed around 2010, it seems clear that at least one generationof capital equipment will be replaced in developed countries with slowly-increasing electricitydemand. The situation is different in emerging economies in South and East Asia (typicallyChina and India, but also Latin America and some parts of Africa), where brand new capacitywill have to be installed to satisfy electricity demands that will grow almost at two-digit annualrates. This opens a good opportunity for a change in the technological paradigm: the lack ofstructural inertia in those zones may indeed act as a catalyzer to the diffusion of moreenvironmental-benign energy technologies. There is, however, the possibility that thesecountries, adopting a follower approach within an standard leader-follower scheme, may tend toreplicate the technological regime dominating today in OECD countries.
5.1.2 Market penetration mechanisms and technological lock-in
Increasing returns in production is a well-known innovation-driving mechanism. Manyeconomists have underlined the significant role that is played by the incentives that firms haveto benefit from a transitory monopolistic position. These fluctuations or departures from theMarshallian long-term industry equilibrium are intimately linked to the changes in the long-termcost curve of the industry, and therefore, with the technological regime dominating at each stageof the economic development. The relationship between the adoption of an innovation, theirfurther improvements and their further costs makes so that the selected equilibrium is dependenton the actual technological and economic history. The mechanisms providing incentives forinnovation are often positive feedback economic effects, i.e. de-stabilizing schemes that inducegrowing perturbations within the system. As technologies, information, and know how diffuse,the relative advantage of the innovator is exhausted, and the system comes back to a sort ofstable equilibrium. The mechanisms are similar to those encountered in the description of othercomplex systems, either coming from the natural science, such as biological and speciesdynamics, or from other social sciences, such urban or firm dynamics. The analysis of thesephenomena has prompted the emergence of a new approach to economic problems, i.e. the

Energy Technology Strategy 1995-2030: Opportunities from the Global Warming Threat 121
evolutionary economics focus. A key issue in the analysis of these subject is the identification ofthe positive feedback mechanisms. There are several types of these mechanisms. Some of themare linked to the productive process itself, are usually known as increasing returns to scale. Theymay be due to a number of reasons. Positive spillovers may play also a fundamental role inexplaining economies in production: learning effects are to be considered under this chapter.Research and development is another important issue that may have a capital influence onto thetechno-economic system in the long term, and deserves a particular attention, either consideredas an exogenously-driven variable or as variable endogenously generated.
Returns to scale, to adoption and to scope
The first idea to be considered is the pure returns to scale concept, which is simply related to theoutput rate the firm. The idea is related to the effect on the production level of a simultaneousrelative in-crease of all the production factors. From the mathematical standpoint, constantreturns of scale are associated to first-degree homogeneous production functions, whereashomogeneous production functions with degree larger than unity yield increasing returns toscale.
The existence of increasing returns to scale is, basically, a short and medium-term issue.Increasing returns to scale have been traditionally associated to the existence of large fixed coststhat must be incurred by firms independently on the actual output volume. Fixed costs arespread over more units as output increases, leading to a decreasing average cost. According tothis, the existence of returns to scale is ultimately due to the use of productive factors withdifferent degrees of flexibility: in the most typical case, in the short run labor costs are variable,whereas capital costs are fixed. R&D costs is an important chapter within the fixed costs budgetin the case of emerging energy technologies. Nevertheless, there are also external reasons foreconomies of scale to appear: good infrastructures, adequate legal and regulatory frame,existence of abundant natural resources, normalization and standardization of procedures andlabour skills.
Returns to adoption is a positive feedback effect that appears providing more and moreincentives to potential adopters to go for a particular technology as this technique isprogressively enlarging its market share. Increasing returns to information are at the root ofincreasing returns to adoption. Coordination effects amongst market actors are conferringrelative advantages to those who follow the leading line of thought within the business, creatinga incentives for uniformity: a technology that gets ahead, tends not only to stay ahead, butconsolidate its position as leader, whereas the competing technologies have progressivelygreater difficulty in entering or surviving in the market. However, not only past adoptions play asignificant role in markets evolving under this scheme: the expectations that the agents form onthe possible future choice of the competitors are also an important issue to look at. The decision-making therefore consists of a tradeoff between the potential gains of imposing the owntechnology to the entire market, thus benefiting from the early-dominant position, and thereluctance of risk-averse investors to go for technologies that could be made prematurelyobsolete by the returns to adoption mechanism. Labor skills fixation by learning by usingcontributes also to endogenize technological change and lead to irreversibility and path-

Energy Technology Strategy 1995-2030: Opportunities from the Global Warming Threat 122
dependent phenomena. The final uniform technology panorama is, in many cases, unpredictable.Small events may possibly give one of them an initial advantage, favoring its adoption. Then,thanks to these early events that induce more improvements in this technology than in theothers, it may attract a broader proportion of potential adopters, and, finally, lock-in the market.These perturbations that initiate the technology path bifurcation may be related to technologicalchoices by individual entrepreneurs, prior experience of technology developers, politicalcircumstances or simply the timing of contracts. Nothing, however, guarantees the overalloptimality of the technology path emerging from this competition scheme: since the benefits aredue to the uniformity and not to the costs or the efficiency, first hit is privileged no matter itstechno-economic characteristics. The possibility of suboptimal selection is an issue ofteninvoked for public intervention via an adequate technology policy.
3) When a company is able to produce at lower costs two or more products that werealternatively produced by specialised firms it is said that the former company has increasingreturns to scope. Shared equipment or common facilities may make producing several goodstogether less expensive than each of them separately. As with increasing returns to scale, it maybe possible that some ranges of output of the goods produced exhibit increasing returns to scopewhile decreasing returns to scope at others. Once again, the cost-effectiveness of one firmproducing several goods depends on how the regions of economies and diseconomies of scoperelate to the demand for the goods. For two technologically close goods or services, it may existincreasing returns to scope that could avoid redundant expenditures like fixed costs.
Increasing returns to scope are potentially important within the energy-environment system. Thepossibility of implementing hybrid energy plants (i.e. combining, for example, the natural gasand an intermittent energy source like wind energy) open a huge field of possible developmentsto achieve the objective of designing more sustainable energy exploitation schemes.
Increasing returns to scope and to scale can reinforce each other or have opposite effects. Itcould be cost-effective to produce in the same firm several goods while expanding theproduction of each raises costs more than proportionally. Whether a natural monopoly exists ornot depends on the overall cost situation. Therefore, the hypothesis underlying the currentpolicies of deregulation of the energy markets may also be analyzed within the frameworkanalysis of the increasing returns. Indeed, a competitive market can benefit consumers ofelectricity as well as environment only if it incorporates some long-term vision.
Learning curves and R&D as positive feedback mechanisms
It has been argued that the returns to scale are a short-term issue since it deals, given the fixedcosts, with the annual productive flow. On the contrary, the learning effects are a long-termissue: the learning curve principle states that there is a (quasi-linear) relationship between thelogarithm of the unit production cost and the logarithm of the cumulative production. Thejustification of this has to be found within the experience and skill gained in the wholeproduction process, changing in the course of the expansion of a firm or an industry the averageunit production cost. Originally formulated and conceived for labour-intensive industries, theconcept was rapidly extrapolated to a variety of cases. Ultimately, it may be viewed as a sort oflong-term reward (or technology fidelity-dividend) taking into account the benefits of stayingwithin a specific technology rather than changing to another one that could be potentially

Energy Technology Strategy 1995-2030: Opportunities from the Global Warming Threat 123
cheaper but which exhibits adaptation costs in the short term. Notice that the difference with thereturns to adoption rely on the fact that the learning effect reinforces the decision made time agoby the agent, whereas the returns to adoption mechanism reinforces the decision made in thepast by other agents (possibly the competitors).
Along the market structure and innovation framework, Schumpeter [1942] argued that a marketinvolving large firms having market power is the price society must pay for rapid technologicalprogress. This has been usually called the “Schumpeterian hypothesis”. The main arguments areto be found in economies of scale in R&D and management, greater capabilities for riskspreading and finance advantages proper to large firms. Concerning the R&D, the absence ofduplication and the diversification of the expenditures may be the principal advantages.Appropriability advantages, that is, the level of production, the productive capacity or marketingservices, may also favorite the large firms in exploiting more quickly on a large scale theinnovations . The big firms, able to block imitation by competitors, increase their appropriabilityand ensure their revenues by a procedure that blocks the emergence of a superior technologicalpath, and therefore may be catalogued as “socially suboptimal”. Large firms or monopolydisplacement could therefore only be achieved through the development of new technologiesrequiring quite different technological background, providing to new firms the opportunity toarise and to weak the advantages that large firms derive from their experience and imitativeability. Oligopoly has been however viewed as the most desirable structure, involving neitherthe R&D incentive problem of perfect competition nor the pricing problem and R&D uniquesource of monopoly. The profits, reward of innovation, provide motivation and funds for firmgrowth, supported furthermore by the welfare advantages to have the firm with a bettertechnology supplying a growing share of the market.
5.2 Energy technology baseline projection
In order to conduct the prospective analysis of energy technology trends, two main generalizedexpected technology deployment trajectories have been explored within this research: the firstone basically corresponds to the BAU (Business As Usual) scenario, for whose numbers aconsensus has been achieved after having had an in-depth look to the literature survey. Inaddition, a generalized, cross-technological moderately optimistic scenario has been also made.This scenario, including all the technologies, may be referred to as EI (EnhancedImprovements). In order to enlarge this perspective, several possible and plausible energytechnology trajectories constructed around technology clusters have been also considered. Theidea behind this approach is to try to capture the differentiated behaviour of each of thesetechnological clusters. Some of the key technologies within each cluster could experiencesignificant progresses, and therefore induce in the related technology families important anddifferentiated cost diminishings. These alternative technologies scenarios will also be outlinedbelow.

Energy Technology Strategy 1995-2030: Opportunities from the Global Warming Threat 124
The main reason why it is desirable to have a series of energy technology scenarios relates to thefact that most of the energy models these data are supposed to be supplied to are actually lackingan appropriate representation of endogenous technological progress. It should be kept in mindthat the aim is to focus on a time horizon around 2010-2030, and that the multiplicity of thesetechnological scenarios is justified by the above-mentioned lacking feedback effect from the restof the global socio-economic system.
The electricity generating costs for some selected technologies as they are characterized in thetechnology database, and corresponding to years 1990 and 2030 (both for the BAU and EIassumptions) are reported in the following graphs). The fuel price trend hypothesis made forthese cases were that, during the period considered, coal price would increase by 5% in realterms, lignite price would remain stable, whereas oil and natural gas prices would experiencesubstantial increase, by 50% and 80%, respectively.

Energy Technology Strategy 1995-2030: Opportunities from the Global Warming Threat 125
0
100
200
300
400
500
600
700
800
0.5 1 1.5 2 2.5
hours (thousands
C1. Hard Coal 200-500 MW
C1(2). Hard Coal >500 MW
C3. Lignite + FGD (200-500 MW)
C5. GTCC 200-350 MW
C6. Oil Boiler (200-500 MW)
C8. Gas Turbine > 50 MW, oil fired
C10. Nuclear 1000-1500 MW LWR
C11. Large Hydro
A1(i) Supercritical Coal
A3. IGCC>500 MW
A4. PFBC 200-500 MW
A6. Integrated Oil Gasif. Comb. Cycle 200-500
F5. New Nuclear design
F7. Advanced Coal Cycle
A7. Small Hydro > 2 MW
A8. Wind on shore > 0.5 MW
A10. Low Temp.Solar
C12. Biomass
F2 ii) Fuel Cell Stationary
35
45
55
65
75
85
95
105
115
125
3 3.5 4 4.5 5 5.5 6
hours (thousand
C1. Hard Coal 200-500 MW
C1(2). Hard Coal >500 MW
C3. Lignite + FGD (200-500 MW)
C5. GTCC 200-350 MW
C6. Oil Boiler (200-500 MW)
C8. Gas Turbine > 50 MW, oil fired
C10. Nuclear 1000-1500 MW LWR
C11. Large Hydro
A1(i) Supercritical Coal
A3. IGCC>500 MW
A4. PFBC 200-500 MW
A6. Integrated Oil Gasif. Comb. Cycle 200-500
F5. New Nuclear design
F7. Advanced Coal Cycle
A7. Small Hydro > 2 MW
C12. Biomass
F2 ii) Fuel Cell Stationary
35
40
45
50
55
60
65
70
75
80
6.5 7
hours (thousands
C1. Hard Coal 200-500 MW
C1(2). Hard Coal >500 MW
C3. Lignite + FGD (200-500 MW)
C5. GTCC 200-350 MW
C6. Oil Boiler (200-500 MW)
C8. Gas Turbine > 50 MW, oil fired
C10. Nuclear 1000-1500 MW LWR
C11. Large Hydro
A1(i) Supercritical Coal
A3. IGCC>500 MW
A4. PFBC 200-500 MW
A6. Integrated Oil Gasif. Comb. Cycle 200-50
F5. New Nuclear design
F7. Advanced Coal Cycle
C12. Biomass
F2 ii) Fuel Cell Stationary
Figure 5-1: 1990 Electricity generation costs by load for some selected technologies

Energy Technology Strategy 1995-2030: Opportunities from the Global Warming Threat 126
0
100
200
300
400
500
600
700
800
0.5 1 1.5 2 2.5
hours (thousands)
C1. Hard Coal 200-500 MW
C1(2). Hard Coal >500 MW
C3. Lignite + FGD (200-500 MW)
C5. GTCC 200-350 MW
C6. Oil Boiler (200-500 MW)
C8. Gas Turbine > 50 MW, oil fired
C10. Nuclear 1000-1500 MW LWR
C11. Large Hydro
A1(i) Supercritical Coal
A3. IGCC>500 MW
A4. PFBC > 500 MW
A6. Integrated Oil Gasif. Comb. Cycle 200-500
F5. New Nuclear design
F7. Advanced Coal Cycle
A7. Small Hydro > 2 MW
A8. Wind on shore > 0.5 MW
A10. Low Temp.Solar
C12. Biomass
F2 ii) Fuel Cell Stationary
A9i. Photov. in Buildings
34
44
54
64
74
84
94
104
114
3 3.5 4 4.5 5 5.5 6
hours (thousand
C1. Hard Coal 200-500 MW
C1(2). Hard Coal >500 MW
C3. Lignite + FGD (200-500 MW)
C5. GTCC 200-350 MW
C6. Oil Boiler (200-500 MW)
C8. Gas Turbine > 50 MW, oil fired
C10. Nuclear 1000-1500 MW LWR
C11. Large Hydro
A1(i) Supercritical Coal
A3. IGCC>500 MW
A4. PFBC > 500 MW
A6. Integrated Oil Gasif. Comb. Cycle 200-50
F5. New Nuclear design
F7. Advanced Coal Cycle
A7. Small Hydro > 2 MW
A8. Wind on shore > 0.5 MW
A9i. Photov. in Buildings
A9(ii). Photov. Rural
A10. Low Temp.Solar
C12. Biomass
F2 ii) Fuel Cell Stationary
36
41
46
51
56
61
6.5 7
hours (thousands)
C1. Hard Coal 200-500 MW
C1(2). Hard Coal >500 MW
C3. Lignite + FGD (200-500 MW)
C5. GTCC 200-350 MW
C6. Oil Boiler (200-500 MW)
C8. Gas Turbine > 50 MW, oil fired
C10. Nuclear 1000-1500 MW LWR
C11. Large Hydro
A1(i) Supercritical Coal
A3. IGCC>500 MW
A4. PFBC > 500 MW
A6. Integrated Oil Gasif. Comb. Cycle 200-500 M
F5. New Nuclear design
F7. Advanced Coal Cycle
C12. Biomass
F2 ii) Fuel Cell Stationary
Figure 5-2: 2030 (BAU) Electricity generation costs by load for some selected technologies

Energy Technology Strategy 1995-2030: Opportunities from the Global Warming Threat 127
0
100
200
300
400
500
600
700
800
0.5 1 1.5 2 2.5
hours (thousands
C1. Hard Coal 200-500 MW
C1(2). Hard Coal >500 MW
C3. Lignite + FGD (200-500 MW)
C5. GTCC 200-350 MW
C6. Oil Boiler (200-500 MW)
C8. Gas Turbine > 50 MW, oil fired
C10. Nuclear 1000-1500 MW LWR
C11. Large Hydro
A1(i) Supercritical Coal
A3. IGCC>500 MW
A4. PFBC > 500 MW
A6. Integrated Oil Gasif. Comb. Cycle 200-50
F5. New Nuclear design
F7. Advanced Coal Cycle
A7. Small Hydro > 2 MW
A8. Wind on shore > 0.5 MW
A10. Low Temp.Solar
C12. Biomass
F2 ii) Fuel Cell Stationary
A9i. Photov. in Buildings
34
44
54
64
74
84
94
104
114
3 3.5 4 4.5 5 5.5 6
hours (thousand
C1. Hard Coal 200-500 MW
C1(2). Hard Coal >500 MW
C3. Lignite + FGD (200-500 MW)
C5. GTCC 200-350 MW
C6. Oil Boiler (200-500 MW)
C8. Gas Turbine > 50 MW, oil fired
C10. Nuclear 1000-1500 MW LWR
C11. Large Hydro
A1(i) Supercritical Coal
A3. IGCC>500 MW
A4. PFBC > 500 MW
A6. Integrated Oil Gasif. Comb. Cycle 200-50
F5. New Nuclear design
F7. Advanced Coal Cycle
A7. Small Hydro > 2 MW
A8. Wind on shore > 0.5 MW
A9i. Photov. in Buildings
A9(ii). Photov. Rural
A10. Low Temp.Solar
C12. Biomass
F2 ii) Fuel Cell Stationary
36
41
46
51
56
61
6.5 7
hours (thousands
C1. Hard Coal 200-500 MW
C1(2). Hard Coal >500 MW
C3. Lignite + FGD (200-500 MW)
C5. GTCC 200-350 MW
C6. Oil Boiler (200-500 MW)
C8. Gas Turbine > 50 MW, oil fired
C10. Nuclear 1000-1500 MW LWR
C11. Large Hydro
A1(i) Supercritical Coal
A3. IGCC>500 MW
A4. PFBC > 500 MW
A6. Integrated Oil Gasif. Comb. Cycle 200-50
F5. New Nuclear design
F7. Advanced Coal Cycle
C12. Biomass
F2 ii) Fuel Cell Stationary
Figure 5-3: 2030 (EI) Electricity generation costs by load for some selected technologies

Energy Technology Strategy 1995-2030: Opportunities from the Global Warming Threat 128
0.3
0.35
0.4
0.45
0.5
0.55
0.6
450 650 850 1050 1250 1450 1650 1850 2050 2250
Specific capital cos
C1. Hard Coal 200-500 MW
C3. Lignite + FGD (200-500 MW)
C5. GTCC 200-350 MW
C10. Nuclear 1000-1500 MW LWR
A1(i) Supercritical Coal
A3. IGCC>500 MW
A4. PFBC > 500 MW
A6. Integrated Oil Gasif. Comb. Cycle 200MWF5. New Nuclear design
F7. Advanced Coal Cycle
F2 ii) Fuel Cell Stationary
C12. Biomass
Figure 5-4: Capital costs-efficiency map for some selected power generation technologies
5.3 A look into the future: world energy technologyscenarios
We present hereafter the possible energy technology paths that could be foreseen, according tothe past evolution of the global energy system that has been discussed above, and to theevidence found in the state-of-the-art technological review that has been made within ourproject.
The scenarios presented below have been constructed bearing in mind the state-of-the-art andthe technology characterization patterns that were outlined in Chapter 2, and around the trendsconcerning the long-term fuel cycles presented in Chapter 3. It should be underlined again that,although the scenarios are supposed to capture a complete, coherent and self-consistenthypothesis on the whole energy system, they have been constructed around technologies andmarket organisation schemes corresponding to the power sector. The reason for this was alreadysuggested in Chapter 1: looking at the most dynamic final energy demand sectors, namely theelectric and the transportation ones, it has been remarked that, in terms of technologicaldiversity, the power generation sector is experiencing rapid changes that can hardly be found inother sectors.
If the centralized electricity production and distribution scheme is supposed to continue, we mayforesee two versions for this possible energy system structure (Scenarios 1 and 2). On thecontrary, scenarios 3, 4 and 5 are related to the decentralized power generation schemes.

Energy Technology Strategy 1995-2030: Opportunities from the Global Warming Threat 129
5.3.1 Centralized Electricity Production: The nuclear renaissanceand incremental innovations.
Under this hypothesis, when the time for massive decommissioning of nuclear power plantsinstalled in OECD countries will arrive (around the year 2005), no other reliable and carbon freealternative will be available for baseload electricity production. In this case, one could forecastthe substitution of old nuclear power plants by new, safer (possibly smaller) nuclear devices.Nevertheless, the possible downsizing of this technology would never reach a degree in whichthe power generation could be considered as decentralized: the typical power of these new,advanced reactor could lie around the 600 MW, i. e., close to the typical size of coal-baseloadpower plants (which ranges around 300-600 MW). The possibility of disruptive innovations inthis field (such as the energy amplifier concept) should be considered also within this scenario.The applicability of this scenario is mainly limited to OECD, already-nuclearized countries, thepossibility for new economies to shift towards this scheme ex nihilo being lower. Nevertheless,some emerging economies could follow this way (India, Pakistan, China). The implications interms of global geostrategy that this may have are far beyond the scope of our discussion, but itseems that this would not be viewed with sympathy from the OECD countries. However, interms of nuclear weapon proliferation, the choice for massive nuclear-based power generation ina limited number of these countries would not dramatically change the composition of the worldnuclear club of nations. Operating in the fringes, new and renewable energy technologies mayprogress with low speed.
Basically, the picture that has to be retained within this scenario could be:
• The power sector would be supposed to rely on the reengineering of nuclear power plants,with progress in safety and waste management and the finding of socially acceptablesolutions to decommissioning and retrofitting. In a longer time horizon, passive reactorsand/or energy amplifiers, focusing on intrinsic safety, enhanced operation flexibility andsmaller size would allow for the massive replacement of nuclear by nuclear, and the partialnuclearization of some emerging economies. At a European scale, this nuclearization (or re-nuclearization process) may take place first on a reduced cluster of countries (France,Belgium, Germany and Sweden). A second group could then follow, including the UK,Spain, the Netherlands and Italy.
• The transport sector would be supposed to stay relying on oil-based fuels, allowing for aprogressive penetration of hybrid cars first, and then electric battery cars.
• No structural changes would be supposed for the heat market within this scenario. Theprocess of electrification would be enhanced and a non declining share of domestic heatingwould be electric.
• The demand side target technologies would be grouped around electrical appliances, for thereasons invoked in the above paragraph.
• From the natural resource capital stock point of view, for this scenario to occur, one shouldassume also high primary fossil fuel prices, or alternatively (for those models withendogenous prices) reduced reserves, especially of natural gas.

Energy Technology Strategy 1995-2030: Opportunities from the Global Warming Threat 130
The foreseen technology characterization to be supplied to the models under these assumptionswould look like this:
• All the nuclear capacity dismantled will be replaced by new nuclear in OECD countries. Toachieve this, one has to be really optimistic for what concerns the projected costs of nuclear,and quite pessimistic on the future fossil fuel prices.
• Baseload electricity production in the largest emerging electricity demanders (China andIndia) will have a significant share (say 30%) of nuclear.
• The rest of the technologies could be assumed to follow a non-constrained but conservativepath.
5.3.2 The cleaner fossil-fuel-based baseload electricity production.
Under this scenario, and maintaining the hypothesis that no disruptive innovation has takenplace in the dominating power generation schemes, nuclear power will be progressivelysubstituted by cleaner fossil-fuel-based power generation schemes. The degree of innovationwithin this scenario may depend on the restrictions applying to a given world zone: thedeveloped world is likely to shift toward GTCC schemes, which still have a good potentialfor efficiency improvement, provided a smooth evolution of the gas prices. New, largeconsumer nations sitting on huge coal reserves are likely to use these resources. Thepotential of advanced clean coal technologies is to be found mainly there. The possibletechnological trajectory along this scenario would include as a first step the adoption offluidized bed combustion power plants (in all its possible variants), to be progressivelyreplaced by supercritical and ultra-supercritical power plants that may reach thermalconversion efficiencies far beyond 50%. The utilization of ceramic filters and advanced inoxsteel will allow for noticeable operation improvements and simultaneous specific pollutantemissions reductions. Marginal improvements to the today predominant Rankinethermodynamic cycle may also be obtained by the use of modified thermodynamic fluids.Further on, new coal-based technologies (Integrated Gasification, possibly in combinationwith Humid Air Turbines, Direct Coal Fired Combined Cycle, Magneto-hydrodynamicsCycle, etc.) have to prove their full potential beyond 2010.
Therefore, in international terms, the picture may be catalogued as a possible jointimplementation success story, within a basically non-changing power sector structure: thelimitations imposed by the baseload coal-dominated sector would preclude (at least at thefirst stages of this story) a massive decentralization of the grids.
The sector-wise picture that could describe this scenario might be as follows:
• The power sector would be supposed to rely on the technology innovations concerning cleancoal technologies and the gasification of solids. The Rankine-cycle technological trajectorywould start from traditional coal boilers and fluidized bed combustion plants, that aresupposed to be rapidly replaced by supercritical and ultra-supercritical power plants, withsignificant progress in material science allowing for the development of steels able towithstand the extremely severe enthalpy conditions of the main steam in these plants.Simultaneously, developments in the gasification technologies may take place, propagating

Energy Technology Strategy 1995-2030: Opportunities from the Global Warming Threat 131
to biomass-based (either waste or crops) techniques, both based on the gas turbine combinedcycle thermodynamic approach.
• The transport sector would also in this case stay relying on oil-based fuels. Oil should moreand more become an specialized fuel for transportation applications. The expectedtechnological progress in this field would be incremental, allowing for a progressivepenetration of low-consumption cars (5 l/100km and less), giving less space for thepenetration of the electric car into the market, since no cheap baseload electricity would beavailable, contrary to what could happen in the first scenario.
• For what concerns the heat market within this scenario, the expected changes with respect tothe present situation should be of minor importance. The diffusion of cogeneration, althoughimportant, may have a limited potential ceiling due to the limits on natural gas and thedifficulties in implementing such schemes for non-utility purposes at lower scale.
• The demand side target technologies would be grouped around electrical appliances, energyconservation device, and, last but not least, more and more efficient gasoline and dieselengines.
• From the natural resource capital stock point of view, within this scenario, one shouldsimultaneously assume high natural gas prices (or low reserves) and low coal prices (or highreserves).
The foreseen technology characterization to be supplied to the models under these assumptionswould look like this:
• The nuclear will be replaced by nuclear in OECD countries only in a relatively reduced share(new reactors may be introduced for experimental purposes).
• Baseload electricity production will be progressively occupied by clean-coal technologies,first in OECD, and immediately also in the emerging economies, who will benefit from jointimplementation schemes. Natural gas is expected to enter in the power sector veryintensively, but operating exclusively in the peak hours.
• The remaining technologies could be assumed to follow a non-constrained but conservativepath.
5.3.3 The Gas-Induced Decentralized Power Generation System.
This technology path represents a more radical change within the organizational structure of theenergy system. Under this hypothesis, it is assumed that today’s economies of scale in producingand distributing energy (and more precisely, electricity) will progressively disappear, beingsubstituted by technologies operating in the Marshallian branch of the cost curve, i.e. withdiseconomies of scale (in other words, with increasing marginal costs). As a first expectedresult, the production units would have lower size. Consequently, large, high voltage lineartransport lines will loss their importance and will be substituted by local, radial, low-voltagegrids, locally operated. The interconnection between different generators, necessary to ensure anadequate grid reliability, would therefore multiply at a very reduced scale. This may facilitate

Energy Technology Strategy 1995-2030: Opportunities from the Global Warming Threat 132
the economic competition between independent power producers, as well as a significant degreeof technology diversification. However, it is expected that this decentralization in powergeneration would not be strong enough so as to induce dramatic changes in the distributionsystem. The most salient technology that may be effectively downsized without significantefficiency loss is the gas turbine (either in single or combined cycle). As this scenario would bealmost entirely dominated at the beginning by natural gas, an appropriate network of gas pipesor any other transporting system is mandatory in this case. Long-distance electric lines wouldbe replaced by gas pipes. The generation and distribution of electricity would take place at alocal level. This system may be complemented by some traditional centralized baseloadelectricity generation, decentralized co-generation to satisfy heat demand, as well as someintermittent renewable electricity production operating in their market niches.
The sector-wise picture that could describe this scenario might be as follows:
• The power sector would be supposed to rely on the innovations concerning gas turbine-related technologies. Solid fuels and some nuclear capacity would also be present for a sharein baseload electricity generation. The former would be used under IGCC schemes. Tosummarize, further advances in small GTCC and coal power plants may be foreseen, as wellas on-site conversion of wastes and biomass residues.
• The presumed abundance of natural gas and the pressure in favor of carbon emissions wouldinduce some changes within the transport sector along this scenario: one may assume thatthe oil-fired explosion engine vehicle may progressively shift towards compressed naturalgas (CNG) vehicles. The potential market share of them would at the end be determined bythe price paths of oil and natural gas. The use of bio-methanol from biomass pyrolisis as atransportation fuel may be foreseen also.
• The heat market within this scenario may develop according to the general decentralizationtrend, by a significant penetration of co-generation schemes within the industrial sector. Theend-use efficiency increase in this sector would therefore be noticeable.
• The demand side target technologies would have a comparatively minor importance, sincethe emerging generation technologies would be able to accommodate both to peakload andbaseload. Significant improvements are to be assumed for what concerns the development ofCNG vehicles.
• Concerning the natural resource capital stock issue, one should assume very optimistichypothesis on the global reserves of natural gas within this scenario, since it would occupy aprogressively higher role within the world’s primary energy mix.
As a consequence, the pressure on natural gas price would be progressively higher. As naturalgas price increases, coal gasification and direct coal combustion may start to be more and moreattractive, provided that, in the meantime, the corresponding capital costs had undergone alreadya significant decrease.
To summarize, the fundamental technological notes for this scenario are:
• Nuclear power is replaced by nuclear only in a very limited share.
• The availability of natural gas at low price would contribute for massive installation of smallscale GTCC power plants.
Energy Technology Strategy 1995-2030: Opportunities from the Global Warming Threat 133
• Coal resources would partially channelled to power production through gas-fuelled Braytonturbines: IGCC, DCCT (direct coal combustion turbine) or similar technologies which allowfor more flexible, load-tracking devices: optimistic assumptions are made on the costs ofthese technologies.
5.3.4 The Energy Efficient Decentralised Power Generation System.
This scenario would represent a more radical change within the organizational structure of theenergy system. It may be considered as a technologically-enhanced version of the previous one.Indeed, in the short run, its development would overlap with scenario 3: gas turbines wouldallow for a first move towards decentralization. As a first expected result, the production unitswould have lower size. As other alternative technologies will be available, they would enterprogressively into the market. In particular, natural-gas fuel cells for decentralized electricityproduction would be the natural sequel to the initial small-size gas turbine capital equipment.Consequently, large, high voltage linear transport lines will loss their importance and will besubstituted by local, radial, low-voltage grids, locally operated. The interconnection betweendifferent generators, necessary to ensure an adequate grid reliability, would therefore multiply ata very reduced scale. This may facilitate the economic competition between independent powerproducers, as well as a significant degree of technology diversification. The existence of anappropriate network of gas pipes or any other transporting system is also a requisite for thisscenario to develop. The traditional centralized baseload electricity generation would remainimportant only during the first transient period, to progressively loose importance afterwards.Decentralized co-generation would also contribute to satisfy heat demand. The technology pullinduced by fuel cells would allow for a more intense expansion of intermittent renewableelectricity expansion production, possibly using hydrogen as energy carrier.
The sector-wise picture that could describe this scenario might be as follows:
• The natural gas is supposed to dominate the more and more decentralized power sector, firstvia gas turbine technologies, then with the even more efficient energy conversion fuel cells.As in the previous scenario, solid fuels and some nuclear capacity would also be present fora share in baseload electricity generation. In a second step, fuel cells and new systems forindependent power producers will represent a disruptive innovation (although still gas-based).
• The emergence of fuel cells for static applications is supposed to rapidly spread to electricfuel cell automobile. This would indeed mean a dramatic change in the transport sector. Theavailability of a cheap primary fuel (natural gas in this case) is a prerequisite for this schemeto emerge. Later on, the issue of alternative fuels (hydrogen from renewables) may dependon the long-term behaviour of the fossil fuel reserves, as well as on the prices of theseconversion technologies (biomass distillation, renewable-based water electrolysis, etc.).
• The generalized decentralization of the energy system would foster the outbreak of energyservice companies, as well as local markets for heat and power.
• As in scenario 3, the demand side target technologies would have a comparatively minorimportance, because of the physical approaching between supply and demand thanks to thedecentralized generation technologies.

Energy Technology Strategy 1995-2030: Opportunities from the Global Warming Threat 134
• As in scenario 3, one should assume very optimistic hypothesis on the global reserves ofnatural gas within this scenario, and, therefore, low gas prices at least in the first phase.
As a consequence, the pressure on natural gas price would be progressively higher. As naturalgas price increases, coal gasification and direct coal combustion may start to be more and moreattractive, provided that, in the meantime, the corresponding capital costs had undergone alreadya significant decrease.
To summarize, the technological characterization would look like this:
• Nuclear power is replaced by other types of centralized electricity generation.
• The availability of natural gas at low price would contribute for massive installation of smallscale GTCC power plants in the first phase of the period of analysis.
• In order to properly simulate this scenario, one has to assume really optimistic capital costsdecrease for fuel cells beyond 2005-2010.
• The fuel cell development would facilitate the use of coal and biomass resources throughgasification schemes.
5.3.5 A Future of Renewable Energy Technologies.
The picture selected within this hypothesis is probably the less likely in the short and mediumterm. Its early stages may be coincident with scenarios 2 and 3. Further in advance, one coulddevise a world status in which, either due to supply-side shocks from the fossil-fuel market, to adramatic decrease of RET costs, or to both reasons, RET would reach a commercial status. Theindustrial organization within this scenario may combine aspects from the fully centralizedelectricity generation and transmission scheme, and those of the decentralized downsizingscheme. Among the first, we may outline the possibility for long-distance, baseload electricityhydro resources that may be put in exploitation if the adequate conditions in transmissiontechnology apply (super conductor lines, etc.). Concerning the second, home-producedelectricity or heat (via photovoltaics, or low temperature solar thermal devices, whose marketpenetration may be induced by using the appropriate building regulation) may be introduced.The fundamental issue that would characterize this scenario is the necessity to find appropriatetechnological solutions to provide a sufficient degree of flexibility in the system toaccommodate to a significant share of intermittent power generation. The key technologieswould therefore concern energy storage. This may take place at the power source, byaccumulation of energy under several forms: thermal (molten salt reservoirs), mechanical (pumpstorage), chemical (synthetic fuels) or electrical (batteries), to be delivered to the grid when theoriginal source is not available. The energy storage can also take place at the final consumptionlevel. In addition, demand side management technologies would have a key role in achievingand maintaining the above-mentioned system flexibility.
This scenario could be sectorally described as follows:
• The fossil fuels are supposed to diminish its predominant role within the power sector. Thisdoes not mean that they would disappear, but rather that they will be confined to captive

Energy Technology Strategy 1995-2030: Opportunities from the Global Warming Threat 135
markets. The standard electric networks will be reinforced by new long distancetransmission technologies able to put in exploitation large scale renewable power generationschemes: large hydro, on-shore and off-shore wind power, as well as solar thermal powerplants. Large scale electricity storage facilities would allow to cope with the problem ofintermittence of renewables. Simultaneously, small scale decentralized production, based onsolar heat and building-integrated PV systems, small wind generators and battery storagewould allow for massive decentralization.
• The emergence of renewables will also imply significant changes in the transport sector. Theelaboration of synthetic fuels using renewable energy technologies would certainly inducesignificant changes in the environmental external costs of transport. The changes may ormay not be based on technological disruptions: synthetic methanol could, for instance beused within conventional (although more efficient) internal explosion engine cars, or used inelectric fuel cell cars. The energy carrier could also be hydrogen. The adoption of a giventechnological paradigm will certainly depend on the cost and the opportunity factors.
• As in scenario 4, the decentralization of the energy system would encourage the appearanceof energy service companies operating in local markets for heat and power.
• The demand side technologies would again have a comparatively minor importance withinthis scenario, for the same reasons invoked above.
• Contrary to what was said for scenarios 3 and 4, a necessary condition for this scenario tooccur is that the energy system would move onto a situation with high primary fossil fuelprices (either due to shortage in reserves or to full internalization of the correspondingexternal costs).
The notes to be retained in order to characterize this scenario would be:
• Nuclear power is replaced by decentralized fossil-fuel based electricity generation first, thenby baseload, long-distance renewable energy supply.
• The electric grid evolves towards a more decentralized one, combined with some long-distance, large capacity transport lines.
• The fraction of baseload power occupied by renewables increases as a consequence ofdevelopments in energy storage technologies.
5.4 Running the scenarios
The practical question to be solved now is how to construct a coherent set of input data tosimulate the above-described scenarios. The models under consideration (POLES, PRIMES,SAFIRE) are of very varied nature and therefore special care has to be taken in order to combinesuitable hypothesis for technology deployment. POLES, for instance, requires particularassumptions in different world zones. This problem is not present when dealing with theEuropean energy markets in PRIMES, although the characterization of different national energysystems within this model makes also necessary to introduce country-specific issues. The degreeof technological disaggregation is also different from model to model. The current version of thePOLES model includes basically 10 conventional electricity generation technologies, as well as10 new and renewable energy technologies, whereas the number of energy technologies retained
Energy Technology Strategy 1995-2030: Opportunities from the Global Warming Threat 136
in PRIMES is significantly greater. For instance, the conventional electricity generationtechnologies considered in POLES are:
• Conventional, large-size hydro
• Conventional nuclear LWR
• New Nuclear Design
• Pressurized Fluidised Bed Combustion
• Integrated Gasification Combined Cycle
• Advanced Thermodynamic Cycle (Coal Powered)
• Lignite-powered conventional
• Coal-powered conventional
• Oil-powered conventional
• Gas-powered conventional
• Oil-powered gas turbine combined cycle
• Gas-powered gas turbine combined cycle.
A significant change has been introduced within the POLES electrical submodel in order toassign the share of electricity generation for each technology, via a sharing ratio which isfunction of a substitution parameter rather than by pure and strict variable cost order of merit.On the contrary, future capacity requirements are planned according to a full future costs,depending on the peak-to-baseload diminishing shares. These full future costs are also affectedby the discounting method as well as the capacity factor.
The important point to retain here is that both variable (variable operation & maintenance, butnot the fuel) and fixed costs (investment and fixed operation & maintenance) are exogenous tothe model. We have, therefore, to modify the set of data (eventually including some capacityconstraints) in order to set up different scenarios. The technology database that has beendeveloped within our project may assist in finding a coherent set of possible technological paths.Referring to the list of 64 technologies that have been revised up to now by the TechnologyWorking Group, each modelling team has to select the most appropriate technologies to beincluded within the corresponding analytical tool to capture as much adequately as possible thetechnological development path.
The technology database has been enlarged, including two prospects for the year 2010. The firstone, referred to as Business as Usual (BAU), contains the original data elaborated by theworking group. A column entitled Enhanced Improvements (EI), containing optimistic prospectson emissions, costs and efficiencies for 2010. These data, that have been cross-checked also bylooking at the confidence intervals provided in some of the literature that was used to elaboratethe original database, are summarized in the annex. Selection of the data from one or the othercolumn should be made according to the lines given when describing the four proposed electricsector scenarios.

Energy Technology Strategy 1995-2030: Opportunities from the Global Warming Threat 137
It should be underlined that modifying the technology data is not the only way in which differentenergy technology scenarios can be simulated and analyzed. Indeed, the modification of some ofthe structural constants of a given model could be the preferred way to shift from one scenario toanother, with the same set of techno-economic data. Increasing the market sharing elasticities (orsubstitution parameters) may induce that small perturbations in the costs have amplified effectson the market shares as the absolute value of the substitution parameter increases, thereforeinducing a faster penetration of slightly cheaper technologies This is why the issue of modelcalibration and design has to be regarded in close connection to the data provided for thescenario definition.
Notice also that the market shares computed in POLES and PRIMES are in most cases fullyreversible, and no lock-in mechanism is foreseen: the structural inertia may disappear in the longrun as old installed capacity is dismantled. This should be considered especially when interest isput in simulating a possible lock-in of the nuclear market share around today’s values in theOECD countries (i.e. the electric scenario nº 1).
Running scenarios for the renewable energy technologies may imply several tasks, but the mostimportant one in order to achieve satisfactory results is to adjust some of current econometricspecifications, according to alternative hypotheses which could lead to the definition and thesimulation of possible different potential technological scenarios.
For instance, the NREN module of POLES includes a learning curve function for eachtechnology. The evolution of the capital costs are then endogenous, that is, they are driven bythe learning curve elasticity for each of these technologies, as well as by an exogenously-givenautonomous technological progress, and by the difference between the levelized renewableelectricity price and the corresponding NREN electricity price. This difference is used for thecalculation of the pay-back time, which is considered an appropriate measure of the cost-effectiveness or the competitiveness associated with each technology. Endogenising thetechnical progress has been of capital importance for the modelling and the simulation of thedynamics of the diffusion of renewables. Therefore, it would now be possible to integrate theinstitutional R&D expenditures as a explaining factor of the technological change instead of themore ambiguous concept of technological exogenous progress. Under this new approach, thetechnical progress, specified as a technological policy decision variable and then subjected tostructural and short-term fluctuations, may have a great influence on the diffusion of therenewables.
It has been suggested to derive also for new and renewable energy technologies two basicbaselines (an optimistic one and a pessimistic one). Setting up the scenarios in terms of learningcurve elasticities and technical progress ratios is a task that may be done by looking at thetechnology parameters forecast (basically the costs), both under pessimistic (BAU) or optimistic(EI) assumptions, and therefore try to identify whether the selected learning curve elasticitiesand exogenous technological progress rates lead or not to these baselines. The BAU and EI dataare included in Annex.
Some alternative hypotheses, which could lead, each of them or combined, to the definition ofpotential technological policies for the renewables diffusion are discussed in the following.Basically, we see three relevant issues to be tackled, involving one technical point and twotechnological policy related decision variables:

Energy Technology Strategy 1995-2030: Opportunities from the Global Warming Threat 138
• The modelling of emerging energy technologies does not suppose any annual capacityconstraint for the diffusion of the renewables. Therefore, these constraints could be added tothe models and would allow to simulate different scenarios according to the degree to whichthe industry and the states are committed, in particular with the CO2 emissions reductionsobjectives.
• Moreover, by integrating the R&D variable, it would be possible to do different assumptionson the future support of the authorities towards the diffusion of renewables: specifically, itcould involve the possible substitution of the institutional R&D by private R&Dexpenditures.
• This institutional behaviour issue should be specifically in concordance with the calibrationof the substitution parameter in the above-mentioned the sharing ratio function for theallocation of electricity generation for each technology. Indeed, within the present structure,no real competition is allowed between traditional electricity generation schemes andrenewables: whereas the former are installed according to the demand forecast, the capitaland other various variable costs, and the sharing function whose exponential parametermeasures somehow the stiffness of the decision-making, the latter diffuse according to analmost independent, Fischer-Pry-like scheme.
Nevertheless, and bearing in mind the significant effort that has been made to upgrade thestructure of the electrical sector within POLES and PRIMES, the above remarks should be keptin mind only as possible future themes for further development.

Energy Technology Strategy 1995-2030: Opportunities from the Global Warming Threat 139
Chapter 6: Technology Performance:Technological Scenarios and Market
Penetration Assessment
By M. Bess and M. Whiteley (ESD)
The five above-described technology scenarios that were agreed as a reasonable way ofhypothesizing forthcoming energy technology trends have been introduced to the SAFIREenergy technology assessment module. In addition ESD has run its market penetration modelSAFIRE for a sixth scenario, ‘Business as Usual’. This is essentially a continuation of presenttrends with no major changes in the energy supply structure or energy policies. This scenario issimilar to the “Conventional Wisdom” scenario from DGXVII’s “European Energy to 2020 - AScenario Approach”. There are no major fuel price shocks, with crude oil prices rising steadilyfrom US$ 17.60 per barrel (in 1993 terms) in 1995 to US$ 31 (1993 dollars) in 2020. Mostnuclear plants come to the end of their life early in the next century and are not replaced underthis scenario. Gas based power generation continuous to make significant inroads into thegeneration mix.
6.1 Introduction
This chapter analyses the scope for renewable and new conventional energy technologies up tothe year 2030. This has been done using ESD’s SAFIRE1 energy model. As agreed at theClimate Technology meeting in Sevilla on 30th April 1997, five technology scenarios have beeninvestigated. These, along with a 6th Business as Usual scenario developed by ESD, are asfollows:
• Centralised electricity production with nuclear renaissance and incremental innovations;
• Cleaner fossil-fuel-based base load electricity production;
• Gas-induced decentralised power generation system;
• Energy efficient decentralised power generation system;
1 SAFIRE was financed by the European Commission - Directorate General XII, Science, Research andDevelopment under the Joule II Programme.

Energy Technology Strategy 1995-2030: Opportunities from the Global Warming Threat 140
• A future of renewable energy technologies.
Section 2 describes the assumptions used in more detail for each scenario. Section 3 describesthe results of the SAFIRE runs, while section 4 provides a comparative analysis of eachtechnology based up on these results
6.2 SAFIRE Scenario Descriptions
SAFIRE assesses the impact of energy technologies and associated policies on a variety ofeconomic indicators including: market penetration, pollution emissions, investment cost,employment, import dependency etc. SAFIRE takes base data on technology costs,performance, renewable energy resources, energy demand in 63 sectors of the economy, fuelprices and scenario data describing potential views of the future energy situation.
Technology market penetration is then calculated both for decentralised and centralisedapplications. For centralised electricity generation a least cost dispatching methodology is usedto calculate market penetration for each technology. For decentralised heat and electricitymarkets the payback period of a particular technology is used to determine its market potentialwhich is then correlated with a market penetration curve to give an assessment of eachtechnology’s contribution to meeting energy demand in each sector, for each year.
The Business as Usual scenario considered here is essentially a continuation of present trendswith no major changes in the energy supply structure or energy policies. This scenario is basedon the “Conventional Wisdom” scenario from DGXVII’s “European Energy to 2020 - AScenario Approach”. There are no major fuel price shocks, with crude oil prices rising steadilyfrom US$ 17.60 per barrel (in 1993 terms)in 1995 to US$ 31 (1993 dollars) in 2020. Mostnuclear plants come to the end of their life early in the next century and are not replaced underthis scenario. Gas based power generation continuous to make significant inroads into thegeneration mix. The remaining technological scenarios have been described in the precedingchapter.
6.3 SAFIRE results
There follows a description of the key features of the technological development seen in eachscenario. For each scenario the results for renewable energy technologies are presentedseparately from the results for new fossil based and nuclear technologies.
6.3.1 Scenario Results
6.3.1.1 Business as Usual Scenario
Renewable energy (excluding large hydro) penetration rises from 3.6% of primary energy in1993 to 8.4% by 2030, as shown in figure 1. This increase is largely accounted for by greaterutilisation of industrial solid waste, wood energy crops, agricultural waste, municipal solidwaste, landfill gas and geothermal and wind. This can be attributed to the rise in fossil fuelprices increasingly making renewable energy technologies cost competitive. In the case of thebiomass technologies 70-100% of their increased penetration comes in decentralised heat

Energy Technology Strategy 1995-2030: Opportunities from the Global Warming Threat 141
markets rather than centralised electricity markets. Overall, the split between electricity andheat provided by renewable energy by 2030 is approximately 50/50.
Figure 6-1: Renewable technology penetration to 2030 - BAU scenario. The graph shows the total delivered energy(in GWh/year) by each technology; ie. the sum of heat and electricity generated and, in the case of biofuels, the
energy used in the transport sector.
With respect to new fossil fuel technologies, figure 2 shows the market penetration to 2030. Inthis scenario, CCGT technology makes large inroads into the European electricity generatingmarket, due to its cost competitiveness and the availability of gas. After 2010, IGCC alsopenetrates rapidly, due to reductions in the capital cost of the equipment. Existing coal, oil, gasand nuclear generating technologies are largely phasing out by 2030.
1993 20
10 2030
Sol
ar -
pas
sive
Coo
ling
& d
aylig
htin
g
PV
ele
c
Agr
ic w
aste
, liq
uid
Sol
ar -
act
ive
Ene
rgy
crop
s, b
iodi
esel
Indu
st w
aste
, liq
uid
Wav
e
Tid
e
Ene
rgy
crop
s, e
than
ol
Mun
ic. d
iges
tible
Land
fill g
as
Agr
ic w
aste
, sol
id
Geo
ther
mal
Sm
all H
ydro
Win
d
Mun
icip
al w
aste
Ene
rgy
crop
s, w
ood
Indu
st w
aste
, sol
id
For
est r
esid
ues
Larg
e H
ydro
0
50,000
100,000
150,000
200,000
250,000
300,000G
Wh
per
yea
r
Renewable Technology Penetration to 2030BAU Scenario
19932010
2030
Sol
ar -
pas
sive
Coo
ling
& d
aylig
htin
g
PV
ele
c
Tid
e
Agr
ic w
aste
, liq
uid
Sol
ar -
act
ive
Ene
rgy
crop
s, b
iodi
esel
Wav
e
Indu
st w
aste
, liq
uid
Ene
rgy
crop
s, e
than
ol
Mun
ic. d
iges
tible
Land
fill g
as
Agr
ic w
aste
, sol
id
Sm
all H
ydro
Geo
ther
mal
Win
d
Ene
rgy
crop
s, w
ood
Mun
icip
al w
aste
For
est r
esid
ues
Indu
st w
aste
, sol
id
Larg
e H
ydro
0
50,000
100,000
150,000
200,000
250,000
300,000
GW
h p
er y
ear
Renewable Technology Penetration to 2030Centralised Electricity Scenario

Energy Technology Strategy 1995-2030: Opportunities from the Global Warming Threat 142
Figure 6-2 Renewable energy (excluding large hydro) penetration rises from 3.6% of primary energy inConventional technology market penetration to 2030 - BAU scenario. The graph shows the total delivered energy
(in GWh/year) by each technology; ie. the sum of heat and electricity generated.
6.3.1.2 Centralised Electricity Production Scenario
In this scenario, when old nuclear plant is being retired in around 2005, the capacity is replacedwith newer, smaller nuclear technologies.
1993 to 8.7% by 2030, as shown in figure 3. This increase is again largely accounted for bygreater utilisation of industrial solid waste, wood energy crops, agricultural waste, municipalsolid waste, landfill gas and geothermal in the decentralised heat market and also wind. Incomparison to the Business as Usual scenario the split between heat and electricity supply fromrenewables has increased slightly to 55/45.
Figure 6-3: Renewable technology penetration to 2030- Centralised electricity scenario. The graph shows the totaldelivered energy (in GWh/year) by each technology; ie. the sum of heat and electricity generated and, in the case of
biofuels, the energy used in the transport sector.
Figure 4 shows that CCGT, as in the Business as Usual scenario makes a large leap inpenetration by 2030, however, the drop off in nuclear penetration experienced after 2010 is herehalted and a small increase in penetration is noted.
19932010
2030
Sol
ar -
pas
sive
Coo
ling
& d
aylig
htin
g
PV
ele
c
Tid
e
Agr
ic w
aste
, liq
uid
Sol
ar -
act
ive
Ene
rgy
crop
s, b
iodi
esel
Wav
e
Indu
st w
aste
, liq
uid
Ene
rgy
crop
s, e
than
ol
Mun
ic. d
iges
tible
Land
fill g
as
Agr
ic w
aste
, sol
id
Sm
all H
ydro
Geo
ther
mal
Win
d
Ene
rgy
crop
s, w
ood
Mun
icip
al w
aste
For
est r
esid
ues
Indu
st w
aste
, sol
id
Larg
e H
ydro
0
50,000
100,000
150,000
200,000
250,000
300,000
GW
h p
er y
ear
Renewable Technology Penetration to 2030Centralised Electricity Scenario

Energy Technology Strategy 1995-2030: Opportunities from the Global Warming Threat 143
Figure 6-4Conventional technology market penetration to 2030- Centralised electricity scenario. The graph showsthe total delivered energy (in GWh/year) by each technology; ie. the sum of heat and electricity generated
The change in nuclear penetration is accounted for by the phase out of current nuclear capacityand the introduction of new capacity as shown in the figure below. Increased levels of fundingfor research, development and demonstration of new safer smaller nuclear technologies hasallowed significant cost reductions to be made therefore making the installation of some newcapacity cost effective.
6.3.1.3 Cleaner Fossil Fuel Scenario
Under this scenario nuclear power is progressively substituted for by cleaner fossil fuel basedenergy generating technologies.
Renewable energy penetration is similar to the previous scenarios, with the largest contributionsin 2030 still coming from large hydro, industrial solid waste, forest residues, energy crops, andmunicipal solid waste. The large increase in penetration of the biomass technologies comingfrom the decentralised heat market. Once again it is the gradual increase in fossil fuel prices andthe gradual evolution of the performance of renewable energy technologies that makesrenewable energy technologies increasingly cost competitive.
1993
2010
2030
Fue
l Cel
ls (
dece
ntra
lised
)
Exi
stin
g O
il F
ired
PS
Hea
t Pum
ps(d
ecen
tral
ised
)
HO
CC
- O
il P
S
Exi
stin
g ga
s P
S
OC
GT
- O
il P
S
PF
BC
- C
oal P
S
IGC
C -
Coa
l PS
Exi
stin
g C
oal F
ired
PS
Fos
sil/G
as C
ogen
.(d
ecen
t.)
Nuc
lear
(C
urre
nt &
new
PW
R)
CC
GT
- G
as P
S
0
200,000
400,000
600,000
800,000
1,000,000
1,200,000G
Wh
per
yea
r
Conventional Technology Penetration to 2030Centralised Electricity Scenario
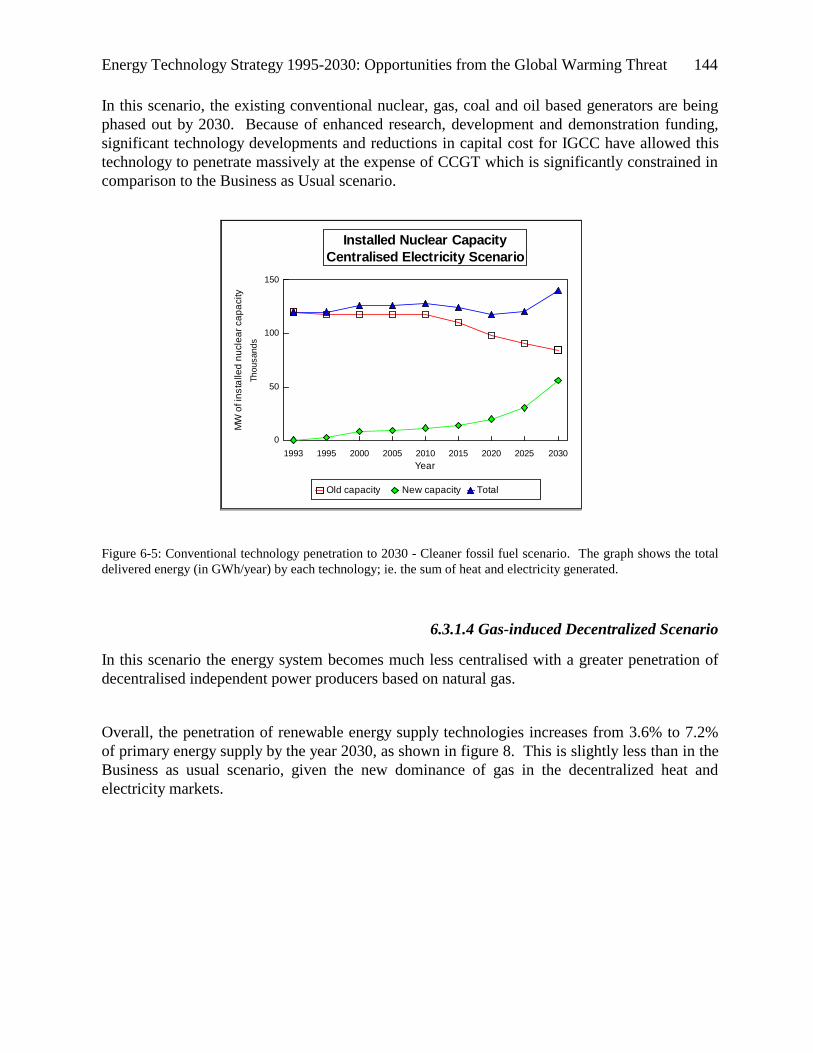
Energy Technology Strategy 1995-2030: Opportunities from the Global Warming Threat 144
In this scenario, the existing conventional nuclear, gas, coal and oil based generators are beingphased out by 2030. Because of enhanced research, development and demonstration funding,significant technology developments and reductions in capital cost for IGCC have allowed thistechnology to penetrate massively at the expense of CCGT which is significantly constrained incomparison to the Business as Usual scenario.
Figure 6-5: Conventional technology penetration to 2030 - Cleaner fossil fuel scenario. The graph shows the totaldelivered energy (in GWh/year) by each technology; ie. the sum of heat and electricity generated.
6.3.1.4 Gas-induced Decentralized Scenario
In this scenario the energy system becomes much less centralised with a greater penetration ofdecentralised independent power producers based on natural gas.
Overall, the penetration of renewable energy supply technologies increases from 3.6% to 7.2%of primary energy supply by the year 2030, as shown in figure 8. This is slightly less than in theBusiness as usual scenario, given the new dominance of gas in the decentralized heat andelectricity markets.
0
50
100
150
Thou
sand
s
Year
MW
of i
nst
alle
d n
ucl
ea
r ca
pa
city
1993 1995 2000 2005 2010 2015 2020 2025 2030
Old capacity New capacity Total
Installed Nuclear CapacityCentralised Electricity Scenario

Energy Technology Strategy 1995-2030: Opportunities from the Global Warming Threat 145
Figure 6-6: Renewable technology market penetration to 2030- gas decentralised scenario. The graph shows thetotal delivered energy (in GWh/year) by each technology; ie. the sum of heat and electricity generated and, in thecase of biofuels, the energy used in the transport sector.
Once again the conventional generating capacity is dominated by CCGT by 2030. However, thedecentralized nature of the energy supply system is allowing more significant penetration ofdecentralized gas fired CHP systems.
Figure 6-7: Conventional technology market penetration to 2030 - gas decentralised scenario. The graph shows thetotal delivered energy (in GWh/year) by each technology; ie. the sum of heat and electricity generated.
1993 20
10 2030
Sol
ar -
pas
sive
Coo
ling
& d
aylig
htin
g
PV
ele
c
Agr
ic w
aste
, liq
uid
Sol
ar -
act
ive
Ene
rgy
crop
s, b
iodi
esel
Indu
st w
aste
, liq
uid
Wav
e
Tid
e
Ene
rgy
crop
s, e
than
ol
Mun
ic. d
iges
tible
Land
fill g
as
Agr
ic w
aste
, sol
id
Geo
ther
mal
Sm
all H
ydro
Win
d
Mun
icip
al w
aste
Ene
rgy
crop
s, w
ood
For
est r
esid
ues
Indu
st w
aste
, sol
id
Larg
e H
ydro
0
50,000
100,000
150,000
200,000
250,000
300,000
GW
h p
er y
ear
Renewable Technology Penetration to 2030Cleaner Fossil Scenario
1993
2010
2030
HO
CC
- O
il P
S
Fue
l Cel
ls (
dece
ntra
lised
)
Hea
t Pum
ps (
dece
ntra
lised
)
Exi
stin
g O
il F
ired
PS
Exi
stin
g ga
s P
S
OC
GT
- O
il P
S
CC
GT
- G
as P
S
PF
BC
- C
oal P
S
Exi
stin
g C
oal F
ired
PS
Fos
sil/G
as C
ogen
. (de
cent
.)
Nuc
lear
(C
urre
nt &
new
PW
R)
IGC
C -
Coa
l PS
0
200,000
400,000
600,000
800,000
1,000,000
1,200,000
1,400,000
1,600,000
GW
h p
er y
ear
Conventional Technology Penetration to 2030Cleaner Fossil Scenario

Energy Technology Strategy 1995-2030: Opportunities from the Global Warming Threat 146
6.3.1.5 Energy Efficient Decentralized Scenario
The decentralisation of the energy system is more marked than in the previous scenario, withsmaller scale gas based energy generation units coming into the decentralised heat andelectricity markets.
As in the previous scenario, the penetration of renewables is slightly hampered by the increasedpenetration of small scale gas fired cogeneration.
Figure 6-8 Renewable technology market penetration 2030 - Energy efficiency scenario. The graph shows the totaldelivered energy (in GWh/year) by each technology; ie. the sum of heat and electricity generated and, in the case ofbiofuels, the energy used in the transport sector.
Figure 6-9 shows that increased funding for R,D&D of fossil fuel based technologies, CCGT,decentralized gas CHP and IGCC means that they all make large increases in penetration as theircosts come down. However, fuel cells also benefit from increased R,D&D and their lowercapital costs mean that for the first time they begin to make penetrations, albeit at a much lowerlevel.
1993 20
10 2030
Sol
ar -
pas
sive
Coo
ling
& d
aylig
htin
g
PV
ele
c
Agr
ic w
aste
, liq
uid
Sol
ar -
act
ive
Wav
e
Tid
e
Indu
st w
aste
, liq
uid
Ene
rgy
crop
s, b
iodi
esel
Land
fill g
as
Ene
rgy
crop
s, e
than
ol
Mun
ic. d
iges
tible
Geo
ther
mal
Agr
ic w
aste
, sol
id
Sm
all H
ydro
Win
d
Ene
rgy
crop
s, w
ood
Mun
icip
al w
aste
Indu
st w
aste
, sol
id
For
est r
esid
ues
Larg
e H
ydro
0
50,000
100,000
150,000
200,000
250,000
300,000
GW
h p
er y
ear
Renewable Technology Penetration to 2030Gas Decentralised Scenario

Energy Technology Strategy 1995-2030: Opportunities from the Global Warming Threat 147
Figure 6-9: Conventional technology market penetration to 2030 - Energy efficiency scenario. The graph shows thetotal delivered energy (in GWh/year) by each technology; ie. the sum of heat and electricity generated.
6.3.1.6 Renewable Future Scenario
Under this set of optimistic assumptions about the future costs and technical efficiencies ofrenewable energy technologies, their penetration is significantly enhanced in comparison to theother scenarios, reaching over 12% by 2030. Wastes, energy crops, wind and geothermaltechnologies benefit in particular. The increase in penetration in this scenario over the Businessas Usual scenario is largely (65%) due to increased penetration of the decentralised heat marketby biomass technologies. The remaining penetration is in both the centralised and decentralisedelectricity markets.
1993
2010
2030
Fue
l Cel
ls (
dece
ntra
lised
)
Exi
stin
g O
il F
ired
PS
Hea
t Pum
ps(d
ecen
tral
ised
)
HO
CC
- O
il P
S
Exi
stin
g ga
s P
S
OC
GT
- O
il P
S
PF
BC
- C
oal P
S
Exi
stin
g C
oal F
ired
PS
Nuc
lear
(C
urre
nt &
new
PW
R)
IGC
C -
Coa
l PS
Fos
sil/G
as C
ogen
.(d
ecen
t.)
CC
GT
- G
as P
S
0
200,000
400,000
600,000
800,000
1,000,000
1,200,000
1,400,000
GW
h p
er y
ear
Conventional Technology Penetration to 2030Gas Decentralised Scenario
1993 20
10 2030
Sol
ar -
pas
sive
Coo
ling
& d
aylig
htin
g
PV
ele
c
Agr
ic w
aste
, liq
uid
Sol
ar -
act
ive
Wav
e
Tid
e
Indu
st w
aste
, liq
uid
Ene
rgy
crop
s, b
iodi
esel
Land
fill g
as
Ene
rgy
crop
s, e
than
ol
Mun
ic. d
iges
tible
Geo
ther
mal
Agr
ic w
aste
, sol
id
Sm
all H
ydro
Win
d
Mun
icip
al w
aste
Ene
rgy
crop
s, w
ood
Indu
st w
aste
, sol
id
For
est r
esid
ues
Larg
e H
ydro
0
50,000
100,000
150,000
200,000
250,000
300,000
GW
h p
er y
ear
Renewable Technology Penetration to 2030Energy Efficiency Scenario

Energy Technology Strategy 1995-2030: Opportunities from the Global Warming Threat 148
Figure 6-10: Renewable technology market penetration to 2030 - Renewable future scenario. The graph shows thetotal delivered energy (in GWh/year) by each technology; ie. the sum of heat and electricity generated and, in thecase of biofuels, the energy used in the transport sector.
figure 11 shows that, large improvements in the cost of IGCC allow huge penetrations of thistechnology at the expense of the existing technologies nuclear coal, oil and gas which are allphased out by 2030.
Figure 6-11: Conventional technology market penetration to 2030 - Renewable future scenario. The graph shows
the total delivered energy (in GWh/year) by each technology; ie. the sum of heat and electricity generated.
6.3.2 Summary of Market Penetration of renewable energyTechnologies
The table below shows the market penetration of renewable energy technologies (excludinglarge hydro power) to 2030 under the six different scenario views of the future. The figures area percentage of total primary energy supply.
1993
2010
2030
Exi
stin
g O
il F
ired
PS
HO
CC
- O
il P
S
Hea
t Pum
ps(d
ecen
tral
ised
)
Exi
stin
g ga
s P
S
OC
GT
- O
il P
S
PF
BC
- C
oal P
S
Fue
l Cel
ls (
dece
ntra
lised
)
Exi
stin
g C
oal F
ired
PS
Nuc
lear
(C
urre
nt &
new
PW
R)
IGC
C -
Coa
l PS
Fos
sil/G
as C
ogen
.(d
ecen
t.)
CC
GT
- G
as P
S
0
200,000
400,000
600,000
800,000
1,000,000
1,200,000
1,400,000
GW
h p
er y
ear
Conventional Technology Penetration to 2030Energy Efficient Scenario

Energy Technology Strategy 1995-2030: Opportunities from the Global Warming Threat 149
Table 6-1 Market penetration of renewable technologies in 2030 (% of primary energy supply)
1993 2000 2010 2020 2030
Business as Usual 3.6% 4.6% 6.3% 7.5% 8.4%
Centralised electricity 3.6% 4.6% 6.0% 7.7% 8.7%
Cleaner fossil fuels 3.6% 4.7% 6.5% 7.6% 8.5%
Decentralised gas 3.6% 4.8% 6.2% 6.3% 7.2%
Energy efficiency 3.6% 4.9% 6.2% 6.3% 7.2%
Renewables Future 3.6% 7.7% 9.5% 10.3% 12.3%
It is noticeable that the only scenario that brings significantly more renewable capacity on line isthe Renewables Future scenario. The technologies effected are mostly wastes, energy crops,geothermal and wind; these all respond to increased R,D&D and to efficiencies of scaleproduction to be come more cost competitive.
6.3.3 Comparative Analysis of Climate Mitigating Technologies
This section assesses which technologies within each scenario represent the most effectiveinvestment for reducing carbon dioxide emissions. The new fossil fuel and renewable energytechnologies have been ranked according to three criteria.
6.3.3.1 Comparison criteria
• Net Benefit• Investment per tonne of carbon dioxide avoided• Total annual reduction in carbon dioxide emissions.
These criteria are described below.
• Net Benefit (billion ecu).
This is the cumulative net present value of the investments required to bring about the level ofmarket penetration of each energy technology observed in the scenario (see equation 1). Theinitial capital cost of new technologies is offset by the avoided capital cost of the equivalentcapacity of conventional fossil fuel generating technologies that would otherwise be required.The avoided costs of fossil fuel and also the external benefits to the environment of reducedCO2 emissions also offset the initial capital cost. The value of the environmental benefit of eachtechnology is based on figures produced by the EXTERNE2 project.
2 ‘Externalities of fuel cycles: Externe project’

Energy Technology Strategy 1995-2030: Opportunities from the Global Warming Threat 150
Equation 6.1: Calculation used to produce net benefit figure (NB. all costs are discounted at 10%).
Net Benefit = Capital cost of technology (ecu/MW)*Installed capacity (MW)- Average capital cost of current technology (ecu/MW)*Installed
capacity of new technology (MW)- Energy generated by technology (kWh)*avoided fossil fuel cost
(ecu/kWh)- cost of reduced damage to environment (ecu/kWh)*energy generated
by technology (kWh)
All new technology capital costs and avoided fossil fuel technology capital costs over theaccounting period of 1993 to 2030 are included in this analysis. The avoided fossil fuel capitalcost is based on the average cost of generating heat and electricity from fossil fuels today.Avoided fuel costs and external benefits are included from throughout the lifetime of the plant,so any benefits that accrue after 2030 are also included in the analysis. All the costs andbenefits were then discounted to the base year with a discount rate of ten percent.
A positive figure for the net benefit of investing in a particular technology means that thebenefits in terms of the savings in capital costs of equivalent conventional technology and thesavings in fossil fuel and the savings in damage to the environment outweigh the capital costs ofthe technology. Conversely, a negative net benefit figure means that capital cost is greater thanall the cost savings achieved by using that technology.
This criteria gives a measure of the overall benefits in ecu derived from each new technology. Itis dependent on the overall level of market penetration of the technology as well as its costeffectiveness at reducing carbon dioxide emissions. Therefore, the same technology in differentscenarios may have different values for the net benefit according to the level of penetration ofthat technology in that scenario.
In order to compare just the cost effectiveness of one technology against another in terms ofreducing carbon dioxide emissions we need to use the next criteria.
• Investment per tonne (ecu/tn).
This is the total present capital investment in a technology per tonne of carbon dioxide avoided(see equation 2). The capital cost of new plant installed up to 2030 is divided by the totalcarbon dioxide savings over the lifetime of the plant. The capital costs incurred up to 2030 arediscounted to the present at a rate of 10%. The reduction in carbon dioxide is in comparisonwith the level of emissions from today’s conventional energy generating technologies.
Equation 6.2: Investment per tonne of carbon dioxide avoided (NB. all costs are discounted at 10%).Investment per tonne CO2 = Capital cost new technology (ecu/MW)
* Installed capacity(MW)/ total reduction in CO2 emissions over the lifetime of the
plant with respect to 1990.
• Annual reduction in carbon dioxide emissions in 2030.
This is the reduction in carbon dioxide emissions per year achievable with each technology by2030. Once again this uses as a comparison the level of carbon dioxide emissions from today’s

Energy Technology Strategy 1995-2030: Opportunities from the Global Warming Threat 151
conventional energy generating technologies. This criteria will be dependent on both theabsolute level of market penetration of the technology and also its effectiveness in reducingcarbon dioxide emissions.
Equation 6.3: Annual reduction in CO2 emissions in 2030Annual reduction of CO2 = Energy generated by technology in 2030(kWh)
* reduction in CO2 emissions per kWh
The results for each scenario are presented next. The analysis tables relate to new installedcapacity for each technology. Technologies are only analysed if they increase their installedcapacity during the period up to 2030. Therefore, nuclear only appears in the table for thecentralised electricity scenario.
A technology may produce a high net benefit because a large capacity is installed, whether thatis because it has low initial capital costs or because there is a large available fuel resource.However, other technologies may be more cost effective in terms of cost per tonne of carbondioxide reduced, but have a lower net benefit because they achieve a lower market penetrationdue to higher capital costs or are constrained by the availability of the fuel resource, as is thecase with some renewable energy technologies.
6.3.3.2 Business as Usual Scenario
CCGT and IGCC have the highest net benefit for the investment required to produce theobserved penetration. These technologies are the most cost effective technologies for reducingemissions of carbon dioxide. They also make the largest overall contribution to reductions incarbon dioxide emissions because of their high levels of penetration.
The most cost effective renewable energy technologies for reducing carbon dioxide emissionsare biomass based, ie. energy crops and forest residues. However, because of its largepenetration (33.8 GW in 2030), wind is the renewable technology that has the greatest potentialin absolute terms to reduce the emissions of carbon dioxide.
Noticeably, photovoltaics are the least cost effective (investment per tonne of carbon dioxidereduced) because of their high cost and low market penetration. PV also has a negative netbenefit figure because the costs are greater than the sum of the benefits.
Nuclear makes no savings in carbon dioxide emissions and is not presented here because there isno new installed capacity in this scenario.

Energy Technology Strategy 1995-2030: Opportunities from the Global Warming Threat 152
Table 6-2: Business as Usual Scenario - Analysis of SAFIRE Results
Net Benefit (Billion ecu) Investment per tonne of carbondioxide (ecu/tn)
Annual reduction in carbon dioxideemissions by 2030 (million tonnes
CO2/yr)
CCGT - Gas PS 272.4 CCGT - Gas PS 0.2 CCGT - Gas PS 481.6
IGCC - Coal PS 92.4 IGCC - Coal PS 0.4 IGCC - Coal PS 227.6
Fossil/Gas CHP(decent.)
56.9 Energy crops,biodiesel
0.6 Wind 56.3
PFBC - Coal PS 19.5 Forest residues 0.7 Energy crops, wood 45.3
Small Hydro 15.6 Energy crops,ethanol
0.8 Fuel Cells(decentralised)
38.0
Large Hydro 13.6 Fuel Cells(decentralised)
0.9 Small Hydro 25.9
Wind 12.1 Energy crops, wood 1.0 Municipal waste 22.3
Indust waste, solid 8.8 OCGT - Oil PS 1.0 Large Hydro 21.4
OCGT - Oil PS 7.2 Agric waste, solid 1.1 Agric waste, solid 18.9
Fuel Cells(decentralised)
4.1 Landfill gas 1.8 OCGT - Oil PS 16.5
Geothermal 4.1 Small Hydro 2.2 Forest residues 15.8
Municipal waste 3.9 Agric waste, liquid 2.7 Geothermal 15.3
Landfill gas 3.7 Wave 2.7 Fossil/Gas CHP(decent.)
14.8
Energy crops,wood
1.7 PFBC - Coal PS 3.2 Landfill gas 14.7
Munic. digestible 1.7 Munic. digestible 3.8 Wave 13.6
Forest residues 1.3 Wind 4.2 Indust waste, solid 13.2
Wave 1.1 Large Hydro 4.4 Munic. digestible 13.1
Solar - active 0.6 Solar - active 4.7 Energy crops,ethanol
7.0
Indust waste, liquid 0.5 Fossil/Gas CHP(decent.)
5.4 Solar - active 6.8
Agric waste, solid 0.2 Geothermal 7.5 PFBC - Coal PS 6.1
Energy crops,biodiesel
0.1 Municipal waste 9.6 Energy crops,biodiesel
5.4
Agric waste, liquid 0.0 Indust waste, liquid 22.6 Agric waste, liquid 2.4
Energy crops,ethanol
-0.0 Indust waste, solid 37.5 Indust waste, liquid 1.0
PV elec -1.1 PV elec 231.7 PV elec 0.2
6.3.3.3 Centralised Electricity Production Scenario
From the table below, CCGT and IGCC are the most cost effective technologies for reducing theemissions of carbon dioxide. Because of innovations leading to reduced costs, nuclear powerincreases its market penetration in this scenario, though it is not amongst the most cost effectivefor reducing carbon dioxide emissions.

Energy Technology Strategy 1995-2030: Opportunities from the Global Warming Threat 153
Again, the biomass based technologies are the most cost effective of the renewable energytechnologies and wind provides the greatest potential for absolute carbon dioxide emissionsreduction.

Energy Technology Strategy 1995-2030: Opportunities from the Global Warming Threat 154
Table 6-3: Centralised Electricity Production Scenario - Analysis of SAFIRE Results
Net Benefit (Billion ecu) Present Gross Investment pertonne of carbon dioxide (ecu/tn)
Annual reduction in carbon dioxideemissions by 2030 (million tonnes
CO2/yr)
CCGT - Gas PS 279.2 CCGT - Gas PS 0.3 CCGT - Gas PS 458.3
Fossil/Gas CHP(decent.)
59.0 IGCC - Coal PS 0.3 IGCC - Coal PS 130.8
IGCC - Coal PS 46.6 Forest residues 0.6 Wind 56.2
Nuclear 34 Energy crops,biodiesel
0.6 Fuel Cells(decentralised)
48.9
Small Hydro 15.2 Energy crops,ethanol
0.7 Energy crops, wood 42.4
PFBC - Coal PS 14.2 Fuel Cells(decentralised)
0.7 Nuclear 36.3
Large Hydro 14.0 Energy crops, wood 1.0 Small Hydro 24.9
Wind 12.3 Agric waste, solid 1.0 Geothermal 23.7
Indust waste, solid 9.6 OCGT - Oil PS 1.1 Large Hydro 23.5
OCGT - Oil PS 7.0 Agric waste, liquid 1.5 Agric waste, solid 23.4
Geothermal 4.8 Small Hydro 1.6 Municipal waste 22.5
Landfill gas 4.6 Landfill gas 1.7 Fossil/Gas CHP(decent.)
21.8
Fuel Cells(decentralised)
4.2 Fossil/Gas CHP(decent.)
3.6 Landfill gas 20.3
Municipal waste 4.1 Wave 3.6 Forest residues 19.1
Energy crops,wood
1.7 Munic. digestible 3.7 Indust waste, solid 18.2
Munic. digestible 1.7 Solar - active 4.0 OCGT - Oil PS 15.8
Wave 1.4 Wind 4.2 Wave 13.5
Forest residues 1.3 Large Hydro 4.5 Munic. digestible 13.5
Solar - active 0.8 Geothermal 5.4 Solar - active 9.3
Indust waste, liquid 0.6 Nuclear 5.5 Energy crops,ethanol
6.8
Agric waste, solid 0.2 PFBC - Coal PS 7.3 Energy crops,biodiesel
5.5
Energy crops,biodiesel
0.1 Municipal waste 9.2 Agric waste, liquid 4.6
Agric waste, liquid 0.02 Indust waste, liquid 20.9 PFBC - Coal PS 2.1
Energy crops,ethanol
-0.01 Indust waste, solid 25.8 Indust waste, liquid 1.1
PV elec -1.4 PV elec 191.4 PV elec 0.3
6.3.3.4 The Cleaner Fossil Fuel Based Scenario
In this scenario IGCC and CCGT are once again dominant, however, because of the capital costreductions in cleaner coal technology IGCC becomes the most cost effective technology forreducing carbon dioxide emissions and has by far the largest absolute potential to reduceemissions.

Energy Technology Strategy 1995-2030: Opportunities from the Global Warming Threat 155
Table 6-4: The Cleaner Fossil Fuel Based Baseload Electricity Production Scenario - Analysis of SAFIRE Results
Net Benefit (Billion ecu) Present Gross Investment pertonne of carbon dioxide (ecu/tn)
Annual reduction in carbon dioxideemissions by 2030 (million tonnes
CO2/yr)
IGCC - Coal PS 255.4 IGCC - Coal PS 0.4 IGCC - Coal PS 448.3
CCGT - Gas PS 99.6 CCGT - Gas PS 0.6 CCGT - Gas PS 102.8
Fossil/Gas CHP(decent.)
57.2 Energy crops,biodiesel
0.6 Wind 56.3
PFBC - Coal PS 28.3 Forest residues 0.7 Energy crops, wood 43.4
Small Hydro 15.6 Energy crops,ethanol
0.8 Small Hydro 25.9
Large Hydro 13.7 Energy crops, wood 1.0 Large Hydro 21.8
Wind 12.2 OCGT - Oil PS 1.0 Municipal waste 21.5
Indust waste, solid 9.8 Agric waste, solid 1.1 Fuel Cells(decentralised)
20.1
OCGT - Oil PS 7.2 Fuel Cells(decentralised)
1.2 Agric waste, solid 18.6
Geothermal 4.7 PFBC - Coal PS 1.4 Geothermal 18.4
Landfill gas 4.0 Landfill gas 2.0 OCGT - Oil PS 16.6
Fuel Cells(decentralised)
3.6 Small Hydro 2.2 Forest residues 16.0
Municipal waste 3.6 Agric waste, liquid 2.7 Landfill gas 16.0
Munic. digestible 1.7 Wave 2.8 Fossil/Gas CHP(decent.)
15.9
Energy crops,wood
1.7 Munic. digestible 3.9 PFBC - Coal PS 15.0
Forest residues 1.3 Wind 4.2 Wave 13.6
Wave 1.1 Large Hydro 4.4 Munic. digestible 13.2
Solar - active 0.8 Fossil/Gas CHP(decent.)
5.1 Indust waste, solid 12.7
Indust waste, liquid 0.6 Solar - active 6.1 Solar - active 7.5
Agric waste, solid 0.2 Geothermal 7.1 Energy crops,ethanol
7.0
Energy crops,biodiesel
0.1 Municipal waste 10.0 Energy crops,biodiesel
5.4
Agric waste, liquid 0.0 Indust waste, liquid 21.0 Agric waste, liquid 2.4
Energy crops,ethanol
-0.0 Indust waste, solid 41.5 Indust waste, liquid 1.1
PV elec -1.1 PV elec 231.7 PV elec 0.2
6.3.3.5 The Gas-induced Decentralised Power Generation System
In this scenario, the market penetration of decentralised gas CHP systems is much more marked,it is second only to CCGT by 2030. This leads to a leap in the cost effectiveness of thistechnology for reducing the emissions of carbon dioxide. However, CCGT and IGCC followed

Energy Technology Strategy 1995-2030: Opportunities from the Global Warming Threat 156
by the biomass renewable energy technologies are still the highest ranking in terms ofinvestment per tonne of carbon dioxide.
Nuclear makes no savings in carbon dioxide emissions and is not presented here because there isno new installed capacity in this scenario.

Energy Technology Strategy 1995-2030: Opportunities from the Global Warming Threat 157
Table 6-5: The Gas-induced Decentralized Power Generation System Scenario - Analysis of SAFIRE Results
Net Benefit (Billion ecu) Present Gross Investment per tonneof carbon dioxide (ecu/tn)
Annual reduction in carbon dioxideemissions by 2030 (million tonnes
CO2/yr)
CCGT - Gas PS 276.2 CCGT - Gas PS 0.2 CCGT - Gas PS 501.4
Fossil/Gas CHP(decent.)
135.2 IGCC - Coal PS 0.2 IGCC - Coal PS 248.2
IGCC - Coal PS 89.8 Energy crops,biodiesel
0.6 Fossil/Gas CHP(decent.)
122.0
Small Hydro 15.4 Forest residues 0.6 Wind 54.1
Large Hydro 13.6 Energy crops,ethanol
0.8 Energy crops, wood 39.4
Wind 11.2 OCGT - Oil PS 1.0 Small Hydro 25.8
PFBC - Coal PS 11.0 Energy crops, wood 1.0 Large Hydro 21.4
Fuel Cells(decentralised)
6.5 Agric waste, solid 1.4 Agric waste, solid 18.7
Indust waste, solid 6.0 Landfill gas 1.8 Municipal waste 16.8
OCGT - Oil PS 5.8 Small Hydro 2.0 Fuel Cells(decentralised)
16.3
Municipal waste 3.7 Wave 2.6 OCGT - Oil PS 14.2
Geothermal 3.5 Fossil/Gas CHP(decent.)
2.7 Geothermal 13.2
Landfill gas 2.9 Agric waste, liquid 2.7 Forest residues 12.2
Munic. digestible 1.6 Solar - active 4.0 Landfill gas 11.6
Energy crops,wood
1.5 Wind 4.0 Wave 11.4
Forest residues 1.0 Fuel Cells(decentralised)
4.3 Munic. digestible 11.0
Wave 0.9 Large Hydro 4.4 Indust waste, solid 8.5
Solar - active 0.5 PFBC - Coal PS 5.6 Energy crops,ethanol
7.0
Indust waste, liquid 0.4 Munic. digestible 7.4 Solar - active 6.4
Energy crops,biodiesel
0.1 Geothermal 8.0 Energy crops,biodiesel
5.4
Agric waste, solid 0.1 Municipal waste 19.3 Agric waste, liquid 2.4
Agric waste, liquid 0.0 Indust waste, liquid 49.7 PFBC - Coal PS 2.2
Energy crops,ethanol
-0.0 Indust waste, solid 63.2 Indust waste, liquid 0.5
PV elec -0.7 PV elec 230.3 PV elec 0.1
6.3.3.6 The Energy Efficient Decentralised Power Generation System
As the energy supply system becomes more decentralised even than in the previous scenario,decentralised gas CHP penetrates to an even larger degree. Fuel cells experience significantcapital cost reductions and are therefore making a large absolute contribution to carbon dioxideemissions reduction, and are also now one of the most cost effective technologies. Again,nuclear makes no savings in carbon dioxide emissions.

Energy Technology Strategy 1995-2030: Opportunities from the Global Warming Threat 158
Table 6-6: The Energy Efficient Decentralized Power Generation System Scenario - Analysis of SAFIRE Results
Net Benefit (Billion ecu) Present Gross Investment per tonneof carbon dioxide (ecu/tn)
Annual reduction in carbon dioxideemissions by 2030 (million tonnes
CO2/yr)
CCGT - Gas PS 265.9 CCGT - Gas PS 0.2 CCGT - Gas PS 489.1
Fossil/Gas CHP(decent.)
161.0 IGCC - Coal PS 0.2 Fuel Cells(decentralised)
417.5
IGCC - Coal PS 87.3 Energy crops,biodiesel
0.6 IGCC - Coal PS 239.9
Fuel Cells(decentralised)
24.2 Forest residues 0.6 Fossil/Gas CHP(decent.)
119.5
Small Hydro 15.4 Fuel Cells(decentralised)
0.7 Wind 53.2
Large Hydro 13.5 Energy crops,ethanol
0.8 Energy crops, wood 41.9
Wind 11.0 OCGT - Oil PS 0.9 Small Hydro 25.8
PFBC - Coal PS 10.9 Energy crops, wood 0.9 Large Hydro 20.9
Indust waste, solid 6.1 Agric waste, solid 1.2 Agric waste, solid 18.1
OCGT - Oil PS 5.5 Landfill gas 1.9 Municipal waste 16.6
Municipal waste 3.5 Small Hydro 2.1 OCGT - Oil PS 13.8
Geothermal 3.5 Agric waste, liquid 2.6 Geothermal 13.1
Landfill gas 2.9 Wave 2.6 Forest residues 12.2
Energy crops,wood
1.7 Fossil/Gas CHP(decent.)
3.3 Landfill gas 11.3
Munic. digestible 1.6 Solar - active 4.0 Munic. digestible 11.0
Forest residues 1.0 Wind 4.1 Wave 10.6
Wave 0.8 Large Hydro 4.4 Indust waste, solid 8.8
Solar - active 0.5 PFBC - Coal PS 5.8 Energy crops,ethanol
7.0
Indust waste, liquid 0.4 Munic. digestible 7.6 Solar - active 6.4
Agric waste, solid 0.1 Geothermal 8.0 Energy crops,biodiesel
5.3
Energy crops,biodiesel
0.1 Municipal waste 21.1 Agric waste, liquid 2.4
Agric waste, liquid 0.0 Indust waste, liquid 49.7 PFBC - Coal PS 2.1
Energy crops,ethanol
-0.0 Indust waste, solid 65.0 Indust waste, liquid 0.5
PV elec -0.7 PV elec 230.3 PV elec 0.1
6.3.3.7 A Future of Renewable Energy Technologies Scenario
In this scenario the rate of adoption of renewable technologies is much more rapid as capitalcosts decrease significantly. Whilst CCGT is still the highest ranking technology, renewables arenow making a much larger contribution overall to reductions in carbon dioxide emissions.
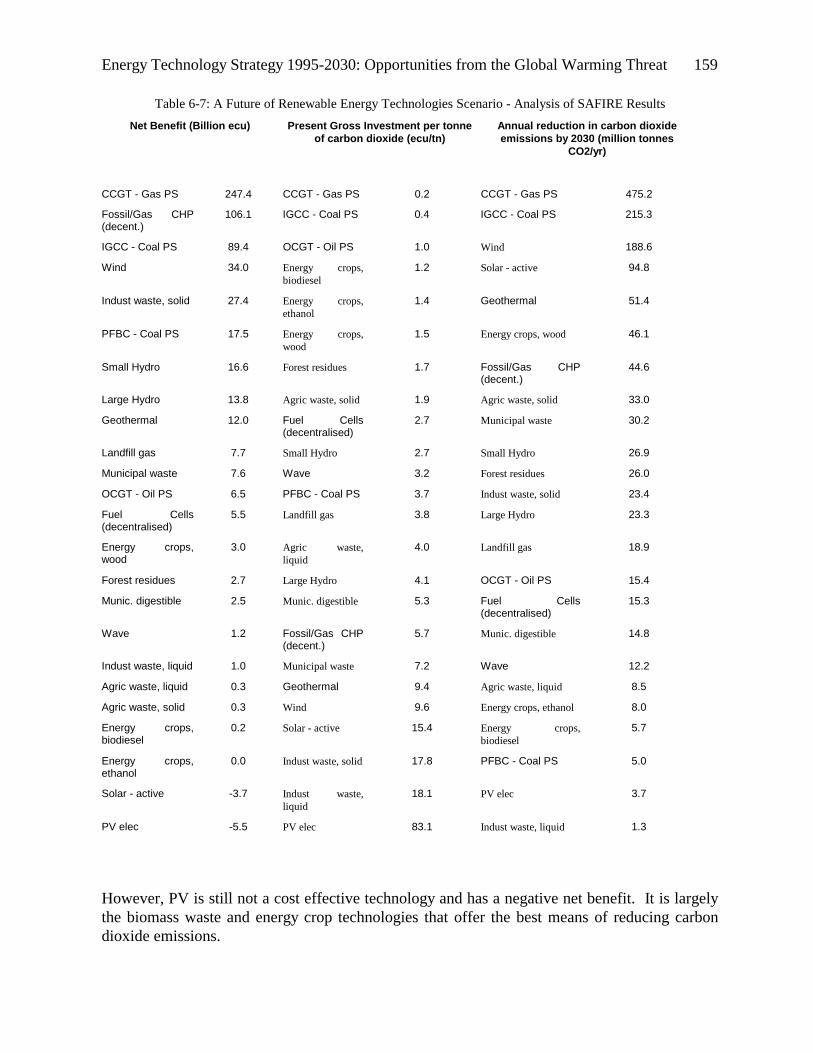
Energy Technology Strategy 1995-2030: Opportunities from the Global Warming Threat 159
Table 6-7: A Future of Renewable Energy Technologies Scenario - Analysis of SAFIRE Results
Net Benefit (Billion ecu) Present Gross Investment per tonneof carbon dioxide (ecu/tn)
Annual reduction in carbon dioxideemissions by 2030 (million tonnes
CO2/yr)
CCGT - Gas PS 247.4 CCGT - Gas PS 0.2 CCGT - Gas PS 475.2
Fossil/Gas CHP(decent.)
106.1 IGCC - Coal PS 0.4 IGCC - Coal PS 215.3
IGCC - Coal PS 89.4 OCGT - Oil PS 1.0 Wind 188.6
Wind 34.0 Energy crops,biodiesel
1.2 Solar - active 94.8
Indust waste, solid 27.4 Energy crops,ethanol
1.4 Geothermal 51.4
PFBC - Coal PS 17.5 Energy crops,wood
1.5 Energy crops, wood 46.1
Small Hydro 16.6 Forest residues 1.7 Fossil/Gas CHP(decent.)
44.6
Large Hydro 13.8 Agric waste, solid 1.9 Agric waste, solid 33.0
Geothermal 12.0 Fuel Cells(decentralised)
2.7 Municipal waste 30.2
Landfill gas 7.7 Small Hydro 2.7 Small Hydro 26.9
Municipal waste 7.6 Wave 3.2 Forest residues 26.0
OCGT - Oil PS 6.5 PFBC - Coal PS 3.7 Indust waste, solid 23.4
Fuel Cells(decentralised)
5.5 Landfill gas 3.8 Large Hydro 23.3
Energy crops,wood
3.0 Agric waste,liquid
4.0 Landfill gas 18.9
Forest residues 2.7 Large Hydro 4.1 OCGT - Oil PS 15.4
Munic. digestible 2.5 Munic. digestible 5.3 Fuel Cells(decentralised)
15.3
Wave 1.2 Fossil/Gas CHP(decent.)
5.7 Munic. digestible 14.8
Indust waste, liquid 1.0 Municipal waste 7.2 Wave 12.2
Agric waste, liquid 0.3 Geothermal 9.4 Agric waste, liquid 8.5
Agric waste, solid 0.3 Wind 9.6 Energy crops, ethanol 8.0
Energy crops,biodiesel
0.2 Solar - active 15.4 Energy crops,biodiesel
5.7
Energy crops,ethanol
0.0 Indust waste, solid 17.8 PFBC - Coal PS 5.0
Solar - active -3.7 Indust waste,liquid
18.1 PV elec 3.7
PV elec -5.5 PV elec 83.1 Indust waste, liquid 1.3
However, PV is still not a cost effective technology and has a negative net benefit. It is largelythe biomass waste and energy crop technologies that offer the best means of reducing carbondioxide emissions.

Energy Technology Strategy 1995-2030: Opportunities from the Global Warming Threat 160
6.4 Conclusions
In all of the scenarios, except the Cleaner Fossil Fuel Based scenario, CCGT is the newtechnology that has the greatest market penetration in 2030 and makes the largest contribution toreducing emissions of CO2 at between 450 and 500 million tonnes of CO2 per year. CCGT alsoproduces the largest net benefit on the investment in its construction and is the cheapesttechnology for avoiding a tonne of CO2 at between 0.2 and 0.6 ecu per tonne.
The reason for the success of CCGT is the availability of relatively cheap gas and the lowcapital costs of the technology.
In most of the scenarios, natural gas-fired CHP makes large inroads into decentralised heatmarkets. However, it is interesting to note that it is substantially more costly per tonne of CO2
avoided than CCGT. This is because the capital cost of CHP is higher than CCGT, and alsobecause in the sectors where CHP penetrates the heat that it is replacing has lower CO2
emissions coefficients than the centralised electricity that CCGT is replacing.
IGCC only challenges CCGT, in terms of cost effectiveness of CO2 emissions mitigation, in theCleaner Fossil Fuel scenario where the availability of cheap coal, coupled with efficiencyimprovements and cost reductions arising from stimulated R,D&D, allow IGCC to compete on acapital cost basis.
Nuclear power is phased out in all scenarios, except the Centralised Electricity scenario, simplybecause of its high cost. In the Centralised Electricity scenario, increased funding for R,D&Dresults in efficiency improvements and cost reductions that allow nuclear to compete to someextent on a cost basis and to maintain its level of installed capacity.
All the scenarios, except the Renewable Future scenario, are not particularly helpful torenewable energy technologies which only achieve a market penetration of about 8% of primaryenergy demand. In the Renewable Future Scenario a more significant penetration of 12% ofprimary energy is achieved.
In this scenario, wind has a large market penetration and is therefore the renewable energytechnology which makes the largest contribution to reducing CO2 emissions at 190 milliontonnes per year in 2030. However, the most cost effective technologies per tonne of CO2 are theenergy crop technologies at 1.2 to 1.5 ecu per tonne of CO2.

Energy Technology Strategy 1995-2030: Opportunities from the Global Warming Threat 161
Chapter 7: Baseline and alternativetechnology scenarios to 2030: the
effect onto the world’s energy system
By N. Kouvaritakis (ECOSIM) and P. Criqui (IEPE)
The POLES baseline projection up to 2030 has been produced using the main BAU technologycharacterisation dataset discussed in the preceding Chapter (the reader is referred for details tothe accompanying Annexes to this volume). With these data, the emerging world balance issummarized in Tables 7.1 to 7.3.
Table 7-1: POLES World Primary Energy Projection
MTOE 1992 2000 2010 2020 2030 1992/2000 2000/2010 2010/2020 2020/2030
Primary Production 8358.17 9485.38 11926.80 14911.35 18243.26 1.6% 2.3% 2.3% 2.0%
Solids 2151.61 2380.67 3428.54 4563.62 5897.01 1.3% 3.7% 2.9% 2.6%
Oil 3263.79 3616.87 4346.27 5200.87 6260.11 1.3% 1.9% 1.8% 1.9%
Natural gas 1670.03 2123.46 2652.69 3429.52 4115.73 3.0% 2.3% 2.6% 1.8%
Nuclear 457.13 582.83 648.35 743.66 878.21 3.1% 1.1% 1.4% 1.7%
Hydro+Geoth 190.86 222.30 278.48 344.05 412.49 1.9% 2.3% 2.1% 1.8%
Trad.Biomass 428.51 401.19 340.35 291.00 251.09 -0.8% -1.6% -1.6% -1.5%
Other Renewables 196.24 158.07 232.12 338.63 428.63 -2.7% 3.9% 3.8% 2.4%
The world primary energy mix trend is captured
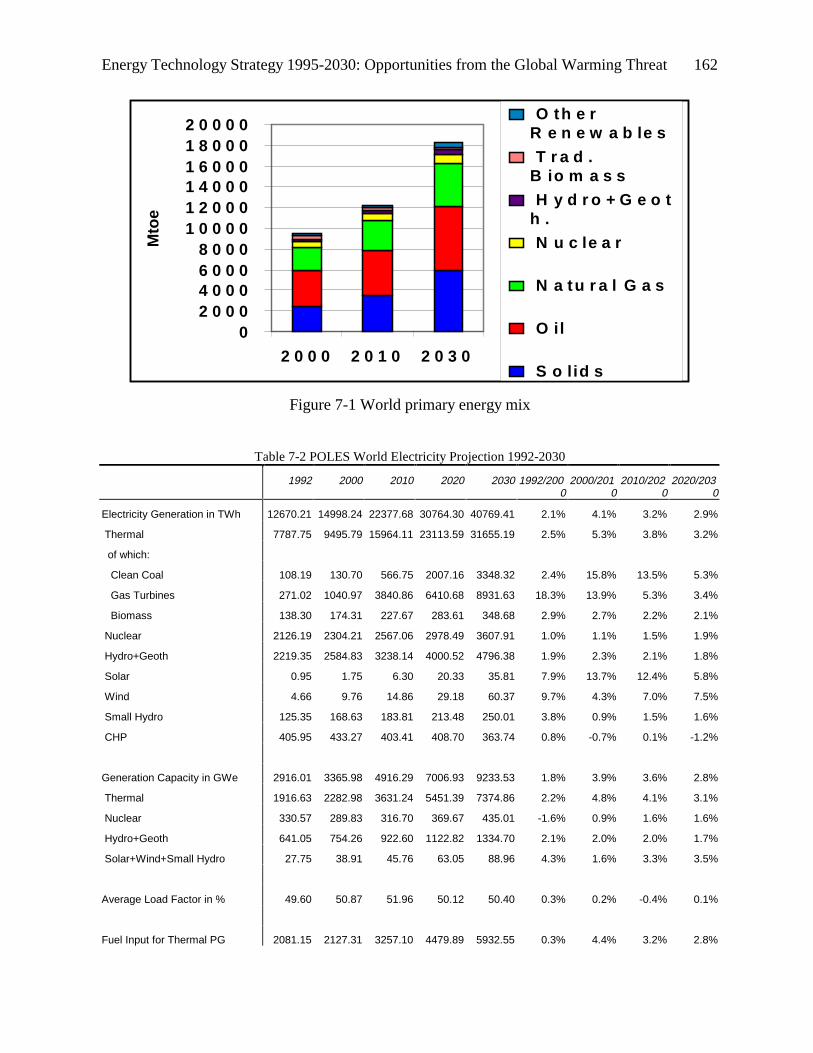
Energy Technology Strategy 1995-2030: Opportunities from the Global Warming Threat 162
02 0 0 04 0 0 06 0 0 08 0 0 0
1 0 0 0 01 2 0 0 01 4 0 0 01 6 0 0 01 8 0 0 02 0 0 0 0
2 0 0 0 2 0 1 0 2 0 3 0
Mto
e
O th e rR e n e w a b le s
T r a d .B io m a s s
H y d r o + G e o th .
N u c le a r
N a tu r a l G a s
O il
S o lid s
Figure 7-1 World primary energy mix
Table 7-2 POLES World Electricity Projection 1992-2030
1992 2000 2010 2020 2030 1992/2000
2000/2010
2010/2020
2020/2030
Electricity Generation in TWh 12670.21 14998.24 22377.68 30764.30 40769.41 2.1% 4.1% 3.2% 2.9%
Thermal 7787.75 9495.79 15964.11 23113.59 31655.19 2.5% 5.3% 3.8% 3.2%
of which:
Clean Coal 108.19 130.70 566.75 2007.16 3348.32 2.4% 15.8% 13.5% 5.3%
Gas Turbines 271.02 1040.97 3840.86 6410.68 8931.63 18.3% 13.9% 5.3% 3.4%
Biomass 138.30 174.31 227.67 283.61 348.68 2.9% 2.7% 2.2% 2.1%
Nuclear 2126.19 2304.21 2567.06 2978.49 3607.91 1.0% 1.1% 1.5% 1.9%
Hydro+Geoth 2219.35 2584.83 3238.14 4000.52 4796.38 1.9% 2.3% 2.1% 1.8%
Solar 0.95 1.75 6.30 20.33 35.81 7.9% 13.7% 12.4% 5.8%
Wind 4.66 9.76 14.86 29.18 60.37 9.7% 4.3% 7.0% 7.5%
Small Hydro 125.35 168.63 183.81 213.48 250.01 3.8% 0.9% 1.5% 1.6%
CHP 405.95 433.27 403.41 408.70 363.74 0.8% -0.7% 0.1% -1.2%
Generation Capacity in GWe 2916.01 3365.98 4916.29 7006.93 9233.53 1.8% 3.9% 3.6% 2.8%
Thermal 1916.63 2282.98 3631.24 5451.39 7374.86 2.2% 4.8% 4.1% 3.1%
Nuclear 330.57 289.83 316.70 369.67 435.01 -1.6% 0.9% 1.6% 1.6%
Hydro+Geoth 641.05 754.26 922.60 1122.82 1334.70 2.1% 2.0% 2.0% 1.7%
Solar+Wind+Small Hydro 27.75 38.91 45.76 63.05 88.96 4.3% 1.6% 3.3% 3.5%
Average Load Factor in % 49.60 50.87 51.96 50.12 50.40 0.3% 0.2% -0.4% 0.1%
Fuel Input for Thermal PG 2081.15 2127.31 3257.10 4479.89 5932.55 0.3% 4.4% 3.2% 2.8%

Energy Technology Strategy 1995-2030: Opportunities from the Global Warming Threat 163
Solids 1275.53 1358.27 2171.47 3024.65 3946.01 0.8% 4.8% 3.4% 2.7%
Oil 329.53 275.68 304.08 370.71 592.08 -2.2% 1.0% 2.0% 4.8%
Gas 476.09 493.35 781.55 1084.53 1394.45 0.4% 4.7% 3.3% 2.5%
Average Thermal Efficiency in % 32.18 38.39 42.15 44.37 45.89 2.2% 0.9% 0.5% 0.3%
Table 7-3: POLES World Final Energy Projection
1992 2000 2010 2020 2030 1992/2000 2000/2010 2010/2020 2020/2030
Final Energy Consumption 6211.42 7123.79 8720.28 10544.87 12534.63 1.7% 2.0% 1.9% 1.7%
Solids 805.97 922.37 1087.31 1264.29 1485.76 1.7% 1.7% 1.5% 1.6%
Oil 2706.67 3093.75 3747.99 4464.11 5255.20 1.7% 1.9% 1.8% 1.6%
Gas 1143.96 1380.86 1571.46 1854.46 2090.65 2.4% 1.3% 1.7% 1.2%
Heat 206.29 183.12 183.76 184.47 185.27 -1.5% 0.0% 0.0% 0.0%
Electricity 880.59 1099.57 1662.92 2262.97 2971.43 2.8% 4.2% 3.1% 2.8%
Renewables 590.01 559.26 572.47 629.63 679.73 -0.7% 0.2% 1.0% 0.8%
by Sector:
Industry 2331.38 2843.23 3448.39 4061.23 4664.30 2.5% 1.9% 1.6% 1.4%
Transport 1621.48 1814.36 2245.45 2763.14 3365.43 1.4% 2.2% 2.1% 2.0%
Dom. Tert. Agr. 2258.56 2466.19 3026.43 3720.50 4504.90 1.1% 2.1% 2.1% 1.9%
The baseline world electricity mix for 2030 is summarized in figure 7.1. The technologiesretained in the figure include those considered in the central electricity production module ofPOLES, as well as some other included in the new and renewable module. Notice theremarkable success of the gas turbine in combined cycle technology. Amongst the baseloadtechnologies, supercritical coal seems to expands rapidly its market share, although IGCCretains a significant degree of competitiveness due to its flexibility in using fuels of variedqualitiy.

Energy Technology Strategy 1995-2030: Opportunities from the Global Warming Threat 164
World Power Reference Production (2030)
0.00
4795.26
2538.00
1042.37
5940.16
2978.122784.252760.97
5592.87
414.30555.93
1454.72
8873.48
364.07249.30
60.22 31.16 81.01267.57
100.95 7.400.00
1000.00
2000.00
3000.00
4000.00
5000.00
6000.00
7000.00
8000.00
9000.00
1
TW
H
HYD: Large Hydro
NUC: Nuclear 1000-1500 MW
NND: New Nuclear design
PFC: Supercritical Coal
ICG/ IGCC
ATC: Advanced Coal Cycle
LCT: Lignite+FGD
CCT: Hard Coal
OCT: Oil Boiler Monovalent
GCT: Gas Powered Trad. Turbine
OGC: Oil Powered Gas Turbine
GGT: GTCC 200-350 MW
CHP: GTCC & CHP
WRD_SHYPRO
WND: Wind on Shore
SPP: Solar Power Plant
BF2: Waste Incineration CHP
BGT: Biomass Gasification
MFC: Proton Exchange Membran Fuel Cell
SFC: Solid Oxyde Fuel Cell
Figure 7-2 Baseline World Electricity Mix (TWH) by 2030
The results territorially disaggregated are shown only for the group OCDE and the aggregateAsia, for sake of conciseness. The reference energy balances corresponding to these aggregatedzones are given below. Tables 7-4 to 7-6 to summarize the results for OCDE countries, whereastables 7-7 to 7-9 correspond to Asia.
Table 7-4: POLES OCDE Primary Energy Projection
MTOE 1992 2000 2010 2020 2030 1992/2000 2000/2010 2010/2020 2020/2030
Primary Production 3012.86 3394.72 3693.92 4053.11 4792.87 1.5% 0.8% 0.9% 1.7%
Solids 863.59 863.34 1074.39 1326.23 1635.74 0.0% 2.2% 2.1% 2.1%
Oil 814.27 932.23 820.81 783.48 1080.50 1.7% -1.3% -0.5% 3.3%
of which non conventional 32.74 32.74 32.74 32.74 518.25 0.0% 0.0% 0.0% 31.8%
Natural gas 720.87 908.48 1057.94 1125.88 1165.14 2.9% 1.5% 0.6% 0.3%
Nuclear 375.14 460.88 481.90 532.91 606.92 2.6% 0.4% 1.0% 1.3%
Hydro+Geoth 97.71 103.20 110.21 116.13 120.24 0.7% 0.7% 0.5% 0.3%
Trad.Biomass 44.89 52.37 53.73 55.21 56.82 1.9% 0.3% 0.3% 0.3%
Other Renewables 96.38 74.23 94.95 113.28 127.50 -3.2% 2.5% 1.8% 1.2%

Energy Technology Strategy 1995-2030: Opportunities from the Global Warming Threat 165
Table 7-5 POLES OCDE Electricity Projection 1992-2030
1992 2000 2010 2020 2030 1992/2000
2000/2010
2010/2020
2020/2030
Electricity Generation in TWh 7688.12 8583.89 10924.56 13002.77 14976.27 1.4% 2.4% 1.8% 1.4%
Thermal 4359.79 5078.56 7268.24 9012.90 10589.83 1.9% 3.6% 2.2% 1.6%
of which:
Clean Coal 64.52 74.74 256.83 740.82 1036.78 1.9% 13.1% 11.2% 3.4%
Gas Turbines 271.02 794.85 1950.78 2707.85 3205.97 14.4% 9.4% 3.3% 1.7%
Biomass 84.93 105.98 117.02 144.32 173.81 2.8% 1.0% 2.1% 1.9%
Nuclear 1744.84 1822.08 1908.13 2133.26 2486.98 0.5% 0.5% 1.1% 1.5%
Hydro+Geoth 1136.15 1199.95 1281.57 1350.34 1398.16 0.7% 0.7% 0.5% 0.3%
Solar 0.89 1.69 6.20 20.17 35.38 8.3% 13.9% 12.5% 5.8%
Wind 4.55 8.88 12.86 24.21 43.28 8.7% 3.8% 6.5% 6.0%
Small Hydro 65.06 89.51 92.88 93.64 95.06 4.1% 0.4% 0.1% 0.2%
CHP 376.85 383.23 354.69 368.26 327.58 0.2% -0.8% 0.4% -1.2%
Generation Capacity in GWe 1746.21 1937.30 2497.97 3046.42 3507.72 1.3% 2.6% 2.0% 1.4%
Thermal 1105.58 1303.54 1833.39 2325.38 2727.40 2.1% 3.5% 2.4% 1.6%
Nuclear 267.53 230.61 234.99 261.80 292.99 -1.8% 0.2% 1.1% 1.1%
Hydro+Geoth 357.56 380.56 403.01 422.40 436.47 0.8% 0.6% 0.5% 0.3%
Solar+Wind+Small Hydro 15.54 22.60 26.57 36.83 50.86 4.8% 1.6% 3.3% 3.3%
Average Load Factor in % 50.26 50.58 49.92 48.72 48.74 0.1% -0.1% -0.2% 0.0%
Fuel Input for Thermal PG 1028.47 1080.63 1447.80 1718.96 1956.61 0.6% 3.0% 1.7% 1.3%
Solids 744.74 787.09 977.64 1191.31 1417.66 0.7% 2.2% 2.0% 1.8%
Oil 122.08 119.96 131.05 107.48 64.33 -0.2% 0.9% -2.0% -5.0%
Gas 161.65 173.58 339.11 420.18 474.63 0.9% 6.9% 2.2% 1.2%
Average Thermal Efficiency in % 36.46 40.42 43.17 45.09 46.55 1.3% 0.7% 0.4% 0.3%
Table 7-6: POLES OCDE Final Energy Projection
1992 2000 2010 2020 2030 1992/2000 2000/2010 2010/2020 2020/2030
Final Energy Consumption 3061.32 3380.67 3738.54 3984.03 4176.42 1.2% 1.0% 0.6% 0.5%
Solids 149.56 114.92 108.48 113.34 119.53 -3.2% -0.6% 0.4% 0.5%
Oil 1620.49 1778.55 1886.17 1946.64 1988.01 1.2% 0.6% 0.3% 0.2%
Gas 708.73 796.68 837.60 857.35 856.47 1.5% 0.5% 0.2% 0.0%
Heat 22.07 17.09 17.73 18.44 19.23 -3.1% 0.4% 0.4% 0.4%
Electricity 537.05 639.46 819.75 965.42 1106.52 2.2% 2.5% 1.6% 1.4%
Renewables 121.23 126.60 148.67 168.49 184.33 0.5% 1.6% 1.3% 0.9%
by Sector:

Energy Technology Strategy 1995-2030: Opportunities from the Global Warming Threat 166
Industry 1101.08 1169.80 1231.51 1265.42 1280.01 0.8% 0.5% 0.3% 0.1%
Transport 1010.99 1135.66 1240.51 1322.81 1388.58 1.5% 0.9% 0.6% 0.5%
Dom. Tert. Agr. 949.24 1075.21 1266.51 1395.80 1507.83 1.6% 1.7% 1.0% 0.8%
Table 7-7: POLES Asia Primary Energy Projection
MTOE 1992 2000 2010 2020 2030 1992/2000 2000/2010 2010/2020 2020/2030
Primary Production 1446.36 1890.43 2795.09 3571.38 4306.51 3.4% 4.0% 2.5% 1.9%
Solids 737.91 1104.75 1893.02 2585.50 3269.23 5.2% 5.5% 3.2% 2.4%
Oil 308.79 330.13 370.35 352.17 291.02 0.8% 1.2% -0.5% -1.9%
of which non conventional 0.00 0.00 0.00 0.00 0.00 NA NA NA NA
Natural gas 116.40 156.21 206.50 267.05 321.62 3.7% 2.8% 2.6% 1.9%
Nuclear 20.97 48.23 74.78 99.72 134.35 11.0% 4.5% 2.9% 3.0%
Hydro+Geoth 26.58 40.21 61.15 87.46 112.55 5.3% 4.3% 3.6% 2.6%
Trad.Biomass 197.49 182.17 148.84 121.62 99.37 -1.0% -2.0% -2.0% -2.0%
Other Renewables 38.22 28.73 40.45 57.87 78.37 -3.5% 3.5% 3.6% 3.1%
Table 7-8 POLES Asia Electricity Projection 1992-2030
1992 2000 2010 2020 2030 1992/00 2000/10 2010/20 2020/30
Electricity Generation in TWh 1712.42 2927.30 6545.40 10253.96 14726.05 6.9% 8.4% 4.6% 3.7%
Thermal 1251.85 2203.37 5475.67 8752.46 12742.44 7.3% 9.5% 4.8% 3.8%
of which:
Clean Coal 7.40 6.64 200.30 997.76 1813.44 -1.4% 40.6% 17.4% 6.2%
Gas Turbines 0.00 146.68 905.28 1413.78 2218.15 NA 20.0% 4.6% 4.6%
Biomass 7.41 6.65 4.83 4.12 7.84 -1.3% -3.1% -1.6% 6.6%
Nuclear 97.55 190.67 296.22 401.23 560.03 8.7% 4.5% 3.1% 3.4%
Hydro+Geoth 309.02 467.56 711.00 1016.94 1308.67 5.3% 4.3% 3.6% 2.6%
Solar 0.02 0.03 0.07 0.06 0.05 1.5% 10.8% -1.9% -2.2%
Wind 0.10 0.81 1.73 3.73 9.63 30.2% 7.8% 8.0% 9.9%
Small Hydro 48.66 58.61 55.52 74.16 101.59 2.4% -0.5% 2.9% 3.2%
CHP 5.22 6.26 5.19 5.39 3.63 2.3% -1.8% 0.4% -3.9%
Generation Capacity in GWe 382.67 569.37 1239.50 2180.69 3093.18 5.1% 8.1% 5.8% 3.6%
Thermal 272.04 403.36 993.85 1832.35 2640.55 5.0% 9.4% 6.3% 3.7%
Nuclear 14.90 23.73 36.93 50.30 66.22 6.0% 4.5% 3.1% 2.8%
Hydro+Geoth 85.91 130.16 196.78 281.54 362.05 5.3% 4.2% 3.6% 2.5%
Solar+Wind+Small Hydro 9.82 12.13 11.95 16.49 24.37 2.7% -0.2% 3.3% 4.0%
Average Load Factor in % 51.08 58.69 60.28 53.68 54.35 1.8% 0.3% -1.2% 0.1%

Energy Technology Strategy 1995-2030: Opportunities from the Global Warming Threat 167
Fuel Input for Thermal PG 354.81 489.29 1130.40 1702.03 2316.20 4.1% 8.7% 4.2% 3.1%
Solids 277.46 401.25 951.31 1475.78 1978.99 4.7% 9.0% 4.5% 3.0%
Oil 52.56 45.43 26.04 6.47 4.80 -1.8% -5.4% -13.0% -2.9%
Gas 24.78 42.61 153.05 219.78 332.41 7.0% 13.6% 3.7% 4.2%
Average Thermal Efficiency in%
30.34 38.73 41.66 44.22 47.31 3.1% 0.7% 0.6% 0.7%
Table 7-9: POLES Asia Final Energy Projection
1992 2000 2010 2020 2030 1992/2000 2000/2010 2010/2020 2020/2030
Final Energy Consumption 1222.84 1716.84 2494.97 3300.66 4264.44 4.3% 3.8% 2.8% 2.6%
Solids 457.65 653.35 845.75 986.09 1154.05 4.6% 2.6% 1.5% 1.6%
Oil 364.99 539.96 818.77 1118.75 1489.15 5.0% 4.3% 3.2% 2.9%
Gas 46.03 100.30 161.46 286.82 404.36 10.2% 4.9% 5.9% 3.5%
Heat 17.13 11.66 11.66 11.66 11.66 -4.7% 0.0% 0.0% 0.0%
Electricity 114.10 207.58 474.26 725.80 1038.31 7.8% 8.6% 4.3% 3.6%
Renewables 228.46 210.90 189.29 179.48 177.74 -1.0% -1.1% -0.5% -0.1%
by Sector:
Industry 599.56 893.38 1294.82 1651.31 2033.64 5.1% 3.8% 2.5% 2.1%
Transport 183.31 266.54 436.03 643.81 923.38 4.8% 5.0% 4.0% 3.7%
Dom. Tert. Agr. 439.97 556.92 764.13 1005.54 1307.42 3.0% 3.2% 2.8% 2.7%
The baseline demographic and economic trends are summarized in the following table:
Table 7-10: POLES Socio-economic trends
1992 2000 2010 2020 2030 1992/2000 2000/2010 2010/2020 2020/2030
Population (Million) OCDE 873.60 919.77 961.52 991.50 1012.77 0.6% 0.4% 0.3% 0.2%
GDP (M$90) OCDE 15208.83 17813.38 22917.96 27950.75 32763.31 2.0% 2.6% 2.0% 1.6%
Population (Million) ASIA 2892.50 3265.03 3696.45 4098.94 4461.12 1.5% 1.2% 1.0% 0.9%
GDP (M$90) ASIA 6258.00 9980.13 17272.94 26545.79 38380.23 6.0% 5.6% 4.4% 3.8%
Population (Million) World 5423.80 6145.45 7023.36 7888.82 8709.81 1.6% 1.3% 1.2% 1.0%
GDP (M$90) World 27946.81 35862.32 52249.09 72476.23 96131.60 3.2% 3.8% 3.3% 2.9%
To conclude with, the baseline projection on natural resources trends (reserves, prices anddistribution) is also outlined in the following tables. For sake of conciseness, the information islimited to oil and gas, since the pressure on coal resources is supposed to be much lower.

Energy Technology Strategy 1995-2030: Opportunities from the Global Warming Threat 168
Table 7-11: POLES Baseline oil market outlook
OILPRODUCTION(mbd)
1973 1980 1990 2000 2010 2020 2030 1980/
1973
1990/
1980
2000/
1990
2010/
2000
2020/
2010
2030/
2020
GulfConventional
21.0 18.8 16.3 20.9 34.4 44.6 54.5 -1.6% -1.4% 2.5% 5.1% 2.6% 2.0%
OECDConventional
13.3 14.5 15.2 18.1 15.8 15.1 11.3 1.2% 0.5% 1.7% -1.3% -0.5% -2.8%
OtherConventional
24.3 30.2 33.7 33.0 36.6 38.3 37.2 3.1% 1.1% -0.2% 1.0% 0.5% -0.3%
World NonConventional
0.0 0.0 0.3 0.7 0.7 6.5 22.8 NA NA 7.0% 0.0% 25.6% 13.3%
Total 58.6 63.5 65.2 72.6 87.5 104.6 125.7 1.1% 0.3% 1.1% 1.9% 1.8% 1.9%
OIL RESERVES(thousand mb)
1973 1980 1990 2000 2010 2020 2030 1980/
1973
1990/
1980
2000/
1990
2010/
2000
2020/
2010
2030/
2020
Gulf 305 338 592 591 565 494 388 1.5% 5.8% 0.0% -0.5% -1.3% -2.4%
OECD 58 52 59 52 39 36 38 -1.4% 1.1% -1.2% -2.7% -1.0% 0.6%
Other 173 216 315 443 395 333 262 3.3% 3.8% 3.5% -1.1% -1.7% -2.4%
World Conventional 0 0 917 1086 1000 863 687 NA NA 1.7% -0.8% -1.5% -2.2%
Non Conventional 0 0 48 130 195 314 451 NA NA 10.4% 4.1% 4.9% 3.7%
Total 524 601 966 1217 1195 1177 1138 2.0% 4.9% 2.3% -0.2% -0.2% -0.3%
1973 1980 1990 2000 2010 2020 2030 1980/
1973
1990/
1980
2000/
1990
2010/
2000
2020/
2010
2030/
2020
World crude oil price 9.8 41.4 20.0 18.5 24.7 31.8 36.0 22.8% -7.0% -0.8% 3.0% 2.6% 1.2%
World RP ratio 24.5 25.9 40.6 45.9 37.4 30.8 24.8 0.8% 4.6% 1.2% -2.0% -1.9% -2.2%
Average RecoveryRate (%)
80.0 80.0 80.0 31.1 37.1 44.2 51.3 0.0% 0.0% -9.0% 1.8% 1.8% 1.5%
Table 7-12: POLES Baseline gas market outlook
GASPRODUCTION(billion m3)
1973 1980 1990 2000 2010 2020 2030 1980/
1973
1990/
1980
2000/
1990
2010/
2000
2020/
2010
2030/
2020
OECD 728 0 774 1021 1189 1265 1309 NA 2.8% 1.5% 0.6% 0.3%
of which N.America
568 582 572 761 828 876 918 0.5% -0.2% 2.9% 0.9% 0.6% 0.5%
Former SovietUnion
269 404 742 756 836 1050 1255 8.5% 6.3% 0.2% 1.0% 2.3% 1.8%
Middle East 37 40 94 193 346 662 939 1.5% 8.9% 7.4% 6.0% 6.7% 3.6%
Asia 24 49 116 176 232 300 361 15.8% 8.9% 4.2% 2.8% 2.6% 1.9%
Other 0 0 187 240 378 577 759 NA NA 2.5% 4.6% 4.3% 2.8%

Energy Technology Strategy 1995-2030: Opportunities from the Global Warming Threat 169
World 1149 1397 1914 2386 2981 3853 4624 4.0% 3.2% 2.2% 2.3% 2.6% 1.8%
GAS RESERVES(Trillion m3)
1975 1980 1990 2000 2010 2020 2030 1980/
1973
1990/
1980
2000/
1990
2010/
2000
2020/
2010
2030/
2020
OECD 15 15 18 14 14 15 17 -0.5% 1.9% -2.4% 0.2% 0.8% 0.8%
of which N.America 9 9 8 7 6 7 7 -0.7% -0.7% -2.5% -0.9% 0.9% 1.3%
Economies intransition
23 29 50 75 72 69 64 5.2% 5.4% 4.1% -0.4% -0.4% -0.7%
Latin America 2 5 8 7 7 7 5 15.5% 4.2% -1.0% 0.7% -1.0% -2.2%
Asia 2 5 9 8 7 7 6 21.0% 5.4% -1.6% -0.5% -1.0% -1.6%
Other 24 28 51 64 73 78 76 2.5% 6.4% 2.3% 1.3% 0.6% -0.2%
World 67 82 135 168 174 175 168 4.1% 5.2% 2.2% 0.4% 0.1% -0.4%
1973 1980 1990 2000 2010 2020 2030 1980/
1973
1990/
1980
2000/
1990
2010/
2000
2020/
2010
2030/
2020
RP ratios
N.Americanmarket
14.9 16.1 15.9 9.4 7.5 6.3 5.9 1.5% -0.1% -5.1% -2.3% -1.6% -0.7%
Europeanmarket
68.0 58.1 56.7 71.3 58.6 45.8 38.0 -3.1% -0.3% 2.3% -1.9% -2.4% -1.9%
Asian market 161.7 90.6 75.1 44.6 37.3 32.2 25.1 -10.9% -1.9% -5.1% -1.8% -1.5% -2.5%
World 70.6 70.3 58.5 45.5 36.4 0.0% -1.8% -2.5% -2.2%
Import prices($90/boe)
N.Americanmarket
20.4 30.0 10.8 14.9 19.6 24.3 26.5 8.1% -9.7% 3.2% 2.8% 2.2% 0.9%
Europeanmarket
11.3 21.4 15.2 14.5 18.3 25.6 32.1 13.6% -3.4% -0.5% 2.4% 3.4% 2.3%
Asian market 19.2 36.5 20.6 28.7 31.8 33.4 40.5 13.6% -5.6% 3.4% 1.0% 0.5% 2.0%
7.1 The Nuclear Scenario
This scenario has been implemented in POLES by altering the technico-economic characteristicsof two types of Nuclear plants:
• A standard large LWR which in the reference case saw its capital cost slightly increasingover time was assumed to be about 30 % cheaper compared to reference in 2030.Furthermore fixed operation and maintenance costs were assumed to be about 35 % lower.

Energy Technology Strategy 1995-2030: Opportunities from the Global Warming Threat 170
• A new evolutionary nuclear design assumed to be introduced gradually in the reference caseand finishing costing about 5 % less to construct and about 25 % less to operate than theLWR by to 2030 gained a substantial share of the nuclear share (over 25 %) thanks primarilyto its inherent safety characteristics. For the nuclear scenario this type of plant was assumedto be 30 % cheaper to construct and 50 % to operate than in the reference case.
These changes have had a substantial impact on the competitiveness of these plants in terms ofgenerating costs : whereas in the reference case they were un-competitive in most regions of theworld even for the higher annual loads they become generally cost-attractive vis-à-vis combinedcycle gas turbines(*) in the region of 5-6 thousand hours per year and vis-à-vis supercritical coaltechnologies(*) in the region of 4-5 thousand hours per year. Such enhanced competitiveness isparticularly marked for the new nuclear design. It is worth noting however that the changes werephased in gradually and power plants but especially nuclear ones are characterised by a slowturnover.
Figure 7-3: The Nuclear Scenario: World power production by technologies with respect to the reference scenario
-31
1104
4770
-691-389-229
-823-534
-41
11
-90
-1163
-54-13-14-7-10-56-23
-1
-2000
-1000
0
1000
2000
3000
4000
5000
6000
TW
h
Large Hydro
Nuclear 1000-1500 MW LWR
New Nuclear design
Supercritical Coal
Integrated Coal Gasificationwith Combined CycleAdvanced Coal Cycle
Lignite+FGD
Hard Coal 200-500 MW
Oil Boiler Monovalent
Gas Powered Trad. Turbine
Oil Powered Gas Turbine
Gas Turbine in Combined Cycle200-350 MWGas Turbine in Combined Cycle& CHPSmall Hydro

Energy Technology Strategy 1995-2030: Opportunities from the Global Warming Threat 171
Asia
180
26
2
207
0
50
100
150
200
250Mt of C
CoalGasOilCO2
OECD
306
57
13
376
0
50
100
150
200
250
300
350
400Mt of C
CoalGasOilCO2
Other World
114
1627
157
0
20
40
60
80
100
120
140
160Mt of C
CoalGasOilCO2
World
600
99
42
741
0
100
200
300
400
500
600
700
800Mt of C
CoalGasOilCO2
Figure 7-4: The Nuclear Scenario by zones: comparison with the baseline
The overall effect of the scenario is a world wide reduction of CO2 emissions of 5.3 % (8.6 % inthe OECD). Naturally this effect is produced almost exclusively within the power generatingsector. World-wide: the new nuclear design plant passes from about 1000 TWH to 5800 TWHand the more conventional LWR from 2500 TWH to 3600 TWH overall nuclear contributionincreases from under 9 % to over 22 % (from 16 % to 37 % in the OECD). Clearly nuclearpower which suffers from heavy costs in the reference case erodes into the high to mediumannual loads displacing about 3000 TWH; of coal fired and 1200 TWH of gas fired electricityproduction. The most severely affected technology is large scale brown coal fired plants (-30 %)while IGCC and gas turbine CC are both 13 % lower and the remainder coal technologies (8-12%) lower. The relatively important reduction in gas turbine CC is a measure of its bigcontribution in relative high loads in the reference case. Combined Heat and Power (-15%) andBiomass gasification Combined Cycle (-21 %) suffer from the lower baseload electricity pricesresulting from the cheaper nuclear power. Wholesale coal prices are 5-10 % lower while gasprices 3-8 % lower. World oil prices stand virtually unaffected (-1 %) since most of the changesimplied by the scenario occur within the electricity sector where petroleum plays a relativelysmall role.
(*) These are basically the “winning” technologies in the reference case
7.2 The Clean Coal Scenario
For the purpose of this scenario three new clean coal technologies have been retained :
1. Supercritical coal which in the reference case achieved 49 % efficiency and average specificcapital cost of around 970 ECU/KW with low operating and maintenance costs (by coal fired

Energy Technology Strategy 1995-2030: Opportunities from the Global Warming Threat 172
power plant standards) was the “winning” coal technology gaining about 14 % of world totalcentral generation and 30 % of world coal generation by 2030. For the purpose of the scenariothe efficiency was increased to 55 % and the capital cost brought to 750 ECU/KW by 2030while a 12 % reductions in O&M costs was also introduced.
2. An IGCC type plant reaching about 50 % efficiency and costing 1100 ECU/KW by 2030with still relatively high O&M costs of about 60 ECU/KW achieved a penetration of about halfthe importance of supercritical coal in the reference case. For the scenario the techno-economicperformance of this type of plant was substantially improved to reach 54 % efficiency by 2030while achieving 25 % reductions in both capital and fixed O&M costs.
3. An Advanced Thermodynamic cycle (direct coal fixed combined cycle) plant costing 1000ECU/KW and reaching 50 % thermal efficiency by 2030 with relatively low operating costsachieved a penetration comparable to the IGCC plant in the reference case. A capital cost of 780ECU/KW and an efficiency of 52 % was retained for the scenario resulting in cost performancessimilar to those of the IGCC plant.
The changes in the aggregated world electricity output by 2030 are summarized in Figure 7-10.
Figure 7-5: The Clean Coal Scenario: World power production by technologies with respect to the referencescenario
It is worth noting that for regions with access to reasonably cheap gas only the supercritical coalplant, and for loads higher than 6500 hours per year, had a clear advantage over CombinedCycle gas plants. In the scenario under otherwise similar circumstances supercritical coal andAdvanced Thermodynamic cycle plants become attractive for loads higher than around 3000hours/year while the IGCC for loads higher than 4500 hours/year. Some improvements (though
-51-147-350
2111
1719
2254
82
-2303
-78
19
-115
-1376
-21-38-18 -9 -9
-49
-6 0
-3000
-2000
-1000
0
1000
2000
3000
TW
h
Large Hydro
Nuclear 1000-1500 MW LWR
New Nuclear design
Supercritical Coal
Integrated Coal Gasificationwith Combined CycleAdvanced Coal Cycle
Lignite+FGD
Hard Coal 200-500 MW
Oil Boiler Monovalent
Gas Powered Trad. Turbine
Oil Powered Gas Turbine
Gas Turbine in Combined Cycle

Energy Technology Strategy 1995-2030: Opportunities from the Global Warming Threat 173
clearly on a smaller scale) were assumed especially in terms of capital cost reductions for moreconventional coal technologies which were justified as knock on effects arising from theimprovements in the new clear coal technologies.
Asia
-41
44
9 11
-50
-40
-30
-20
-10
0
10
20
30
40
50
Mt
of
C
CoalGasOilCO2
OECD
-212
54
8
-150
-250
-200
-150
-100
-50
0
50
100
Mt
of
C
CoalGasOilCO2
Other World
-36
0
34
-2
-40
-30
-20
-10
0
10
20
30
40
Mt
of
C
CoalGasOilCO2
World
-290
98
50
-141
-300
-250
-200
-150
-100
-50
0
50
100
Mt
of
C
CoalGasOilCO2
Figure 7-6 The Clean Coal Scenario by zones: comparison with the baseline
This scenario results in a net increase in world CO2 emissions (+1 %) which conceals someregional differences : a slight decrease in Asia (-0.2 %) an increase (3.5 %) in the OECD andstagnation in the rest of the world. This rather ambiguous result stems from the fact that whilethe clean coal plants are more efficient and therefore produce considerably less CO2 per KWHgenerated they also become more cost attractive and are often chosen in preference to nuclearand gas fired plants which produce even less CO2 per KWH : Coal consumption in powerstations increases by 7.5 % while gas consumption decreases by 14 %, oil by 10 %, nucleargeneration by 13 % and hydro generation by 1 %. Of the new coal technologies the mostdramatically affected is the advanced thermodynamic cycle (+81 %) which sees its share ofworld power generation go up from under 7 % to around 12 % while the increase in IGCCgeneration is of the order of 58 % (share up from 7.3 % to 11 %). The performance of thesupercritical coal plants is less spectacular + 35 % and a share increase from 15 % to 19 % bothbecause of its relatively deep penetration already in the reference case but also due to the moremodest additional technico-economic improvements implied by the scenario.
The above new coal technologies replace very substantially conventional coal generation (-2300TWH) and to a lesser extent gas turbine C.C. (-1380 TWH). They act as a break for thedevelopment of new nuclear design power plants which reach only 690 TWH down from 1040TWH in the reference case. The more conventional LWR are less affected (-150 TWH). Alsoseverely affected are the Biomass gasification CC (-18 %) and especially wind power generation

Energy Technology Strategy 1995-2030: Opportunities from the Global Warming Threat 174
(-30 %) mainly due to the lower baseload electricity prices (nearly 10 % lower). Coal prices inthe world and regional markets are 5-7 % higher which is clearly not sufficient to reducesignificantly the competitiveness of the new coal technologies.
7.3 The Gas Technology Scenario
This scenario is composite and its implementation in POLES involved, apart from modificationsin the technico-economic characteristics of some key technologies, an expansion of worldultimate resources in gas. This latter was carried out by following the 5 % probability upperestimate for undiscovered resources contained in the “World Petroleum Assessment andAnalysis” of the U.S. Geological Survey National Center (1991). Special care was taken toensure that correlations and statistical independence for undiscovered gas in different regionswas reflected in a manner consistent with the above survey. On the other hand no attempt wasmade to link the possible higher resource base for gas with eventual higher occurrence ofpetroleum resources. The latter have hence remained at their reference case values.
The geographical distribution of these additional gas resources has been uneven about half ofthem occurring in the Former Soviet Union with large additions also recorded for Canada, Iranand China.
In terms of the technological side of the scenario the following main gas powered technologieshave been treated:
• Gas turbine combined cycle is already the most successful power generating technology inthe reference case contributing about 22 % of total generation by the year 2030. This gain inshare achieved in the face of substantial increases in natural gas prices is mainly due to themajor improvements in technico-economic performance of this already attractive technologyincorporated in the reference case : i.e. an 18 % decrease in capital costs mainly due to anincrease in efficiency from around 50 % at present to 59 %. For the scenario capital costswere reduced by a further 12 %, specific fixed operations costs reduced by more than halfand efficiencies raised to 63 %. These improvements were assumed to occur mainly by alearning curve effect associated with the greater availability of cheaper gas itself a majorcomponent in the structure of generating costs for these technologies.
• Gas Turbine combined Cycle Combined Heat and Power which is another turbine dependenttechnology saw sluggish performance in the reference case to higher gas prices. For thescenario apart from the lower prices this technology is assisted by a two point increase inboth electric and steam conversion efficiency but also by a 20 % reduction in specific capitalcost, fixed and variable operating costs.
Apart from these gas technologies, the scenario implies improved technico-economicperformance albeit on a smaller scale for two coal technologies : the advanced thermodynamiccycle and especially the IGCC which benefit from gas turbine improvements.
The technology shift with respect to the baseline projection in terms of global electric powerproduction is outlined in Figure 7-7.

Energy Technology Strategy 1995-2030: Opportunities from the Global Warming Threat 175
Figure 7-7: The Gas Scenario: World power production by technologies with respect to the reference scenario
This scenario represents a radical alternative in terms of world energy market configurations dueto the enhanced natural gas resource base : Gas in place is assumed to be 45 % higher than in thereference case. Introducing this assumption in POLES results in new discoveries (from thepresent to 2030) twice as large in the scenario than in the reference case and world gas reserves.This implies that in spite of much higher cumulative production world reserves stand are morethan one and a half times their reference level in 2030 resulting at much lower bulk gas prices(in North America less than half Europe -27% and Asia -20%).
These assumptions have yielded an alternative oil and gas market evolution which issummmarized in the following (to be compared with the baseline provided in Table 7-11 and Table
7-12):
Table 7-13: POLES Baseline oil market outlook
OILPRODUCTION(mbd)
1973 1980 1990 2000 2010 2020 2030 1980/
1973
1990/
1980
2000/
1990
2010/
2000
2020/
2010
2030/
2020
GulfConventional
21.0 18.8 16.3 20.6 33.3 42.0 49.3 -1.6% -1.4% 2.4% 4.9% 2.3% 1.6%
OECDConventional
13.3 14.5 15.2 18.0 15.4 14.3 10.6 1.2% 0.5% 1.7% -1.6% -0.7% -3.0%
-108-213-531
-2542
1444
-124
-1093-1635
-255-286
-1246
9242
618
-53-33-18-21-123
14 0
-4000
-2000
0
2000
4000
6000
8000
10000T
Wh
Large Hydro
Nuclear 1000-1500 MW LWR
New Nuclear design
Supercritical Coal
Integrated Coal Gasificationwith Combined CycleAdvanced Coal Cycle
Lignite+FGD
Hard Coal 200-500 MW
Oil Boiler Monovalent
Gas Powered Trad. Turbine
Oil Powered Gas Turbine
Gas Turbine in Combined Cycle200-350 MWGas Turbine in Combined Cycle& CHPSmall Hydro

Energy Technology Strategy 1995-2030: Opportunities from the Global Warming Threat 176
OtherConventional
24.3 30.2 33.7 32.8 36.0 37.3 35.8 3.1% 1.1% -0.3% 0.9% 0.3% -0.4%
World NonConventional
0.0 0.0 0.3 0.7 0.7 5.7 19.7 NA NA 7.0% 0.0% 23.9% 13.3%
Total 58.6 63.5 65.2 72.1 85.3 99.2 115.4 1.1% 0.3% 1.0% 1.7% 1.5% 1.5%
OIL RESERVES(thousand mb)
1973 1980 1990 2000 2010 2020 2030 1980/
1973
1990/
1980
2000/
1990
2010/
2000
2020/
2010
2030/
2020
Gulf 305 338 592 592 567 498 401 1.5% 5.8% 0.0% -0.4% -1.3% -2.1%
OECD 58 52 59 52 39 34 35 -1.4% 1.1% -1.2% -2.9% -1.2% 0.4%
Other 173 216 315 443 395 333 262 3.3% 3.8% 3.5% -1.1% -1.7% -2.4%
World Conventional 0 0 917 1086 1000 865 699 NA NA 1.7% -0.8% -1.4% -2.1%
Non Conventional 0 0 48 130 187 291 399 NA NA 10.4% 3.7% 4.5% 3.2%
Total 524 601 966 1216 1187 1157 1097 2.0% 4.9% 2.3% -0.2% -0.3% -0.5%
1973 1980 1990 2000 2010 2020 2030 1980/
1973
1990/
1980
2000/
1990
2010/
2000
2020/
2010
2030/
2020
World crude oil price 9.8 41.4 20.0 18.1 23.9 30.1 32.7 22.8% -7.0% -1.0% 2.8% 2.3% 0.8%
World RP ratio 24.5 25.9 40.6 46.2 38.1 31.9 26.1 0.8% 4.6% 1.3% -1.9% -1.8% -2.0%
Average RecoveryRate (%)
80.0 80.0 80.0 31.0 36.8 43.3 49.8 0.0% 0.0% -9.0% 1.7% 1.7% 1.4%
Table 7-14: POLES Baseline gas market outlook
GASPRODUCTION(billion m3)
1973 1980 1990 2000 2010 2020 2030 1980/
1973
1990/
1980
2000/
1990
2010/
2000
2020/
2010
2030/
2020
OECD 728 0 774 1115 1474 1836 2302 -100.0%
NA 3.7% 2.8% 2.2% 2.3%
of which N.America
568 582 572 776 1007 1314 1753 0.5% -0.2% 3.1% 2.6% 2.7% 2.9%
Former SovietUnion
269 404 742 666 716 979 1339 8.5% 6.3% -1.1% 0.7% 3.2% 3.2%
Middle East 37 40 94 186 411 940 1490 1.5% 8.9% 7.0% 8.3% 8.6% 4.7%
Asia 24 49 116 241 385 515 628 15.8% 8.9% 7.5% 4.8% 2.9% 2.0%
Other 0 0 187 293 482 813 1150 NA NA 4.6% 5.1% 5.4% 3.5%
World 1149 1397 1914 2501 3469 5084 6909 4.0% 3.2% 2.7% 3.3% 3.9% 3.1%
GAS RESERVES(Trillion m3)
1975 1980 1990 2000 2010 2020 2030 1980/
1973
1990/
1980
2000/
1990
2010/
2000
2020/
2010
2030/
2020
OECD 15 15 18 18 20 27 40 -0.5% 1.9% 0.0% 1.5% 2.7% 4.0%

Energy Technology Strategy 1995-2030: Opportunities from the Global Warming Threat 177
of which N.America 9 9 8 7 10 16 28 -0.7% -0.7% -1.7% 3.0% 5.4% 5.8%
Economies intransition
23 29 50 79 83 90 97 5.2% 5.4% 4.6% 0.6% 0.8% 0.7%
Latin America 2 5 8 10 13 15 16 15.5% 4.2% 2.4% 2.8% 1.7% 0.5%
Asia 2 5 9 12 13 13 12 21.0% 5.4% 3.2% 0.8% -0.4% -0.8%
Other 24 28 51 70 85 96 98 2.5% 6.4% 3.2% 1.9% 1.3% 0.3%
World 67 82 135 188 215 241 263 4.1% 5.2% 3.4% 1.3% 1.2% 0.9%
1973 1980 1990 2000 2010 2020 2030 1980/
1973
1990/
1980
2000/
1990
2010/
2000
2020/
2010
2030/
2020
RP ratios
N.Americanmarket
14.9 16.1 15.9 9.9 9.3 10.4 12.6 1.5% -0.1% -4.6% -0.6% 1.1% 1.9%
Europeanmarket
68.0 58.1 56.7 82.6 70.2 55.1 47.1 -3.1% -0.3% 3.8% -1.6% -2.4% -1.5%
Asian market 161.7 90.6 75.1 52.2 46.1 41.7 32.4 -10.9% -1.9% -3.6% -1.2% -1.0% -2.5%
World 70.6 75.4 61.9 47.5 38.1 0.7% -1.9% -2.6% -2.2%
Import prices($90/boe)
N.Americanmarket
20.4 30.0 10.8 14.4 15.1 13.4 10.6 8.1% -9.7% 2.9% 0.5% -1.1% -2.4%
Europeanmarket
11.3 21.4 15.2 12.5 15.0 20.0 23.6 13.6% -3.4% -1.9% 1.8% 3.0% 1.7%
Asian market 19.2 36.5 20.6 22.8 26.9 27.3 32.4 13.6% -5.6% 1.0% 1.6% 0.2% 1.7%

Energy Technology Strategy 1995-2030: Opportunities from the Global Warming Threat 178
Asia 382
-280
-8
94
-300
-200
-100
0
100
200
300
400M
t o
f C
CoalGasOilCO2
OECD 552
-586
21
-13
-600
-400
-200
0
200
400
600
Mt
of
C
CoalGasOilCO2
Other World
188
-378
404
213
-400
-300
-200
-100
0
100
200
300
400
500
Mt
of
C
CoalGasOilCO2
World
1122
-1245
417294
-1500
-1000
-500
0
500
1000
1500
Mt
of
C
CoalGasOilCO2
Figure 7-8 The Gas Technology Scenario by zones: comparison with the baseline
At these levels gas becomes competitive not only vis-à-vis oil (which it was already) but also fora number of substantial market segments vis-à-vis coal. Consequently oil prices are draggeddown (by 9%) and coal prices fall sharply from already low levels (-20% in North America and -10% elsewhere). Accompanying these changes is a substantial increase in international gas trade(for example in China gas imports double despite a 50% increase in domestic production). Yetthe impact of the scenario on CO2 emissions is a paltry -2.1% in 2030 (+0.3% in the OECD).The reason for this apparent paradox are numerous and are summarised below :
Generally low gas prices and lower energy prices have meant that final consumption of gas hasincreased (by 27%) but lower prices of other fuels have meant that their consumption has notfallen sufficiently to compensate for gas increases. In the case of electricity the combination oflow fuel costs and improved power plant technico-economic characteristics has produced lowergenerating costs and hence lower electricity prices.
This has been particularly striking for low to medium loads (residential/commercial electricity)where due to the suitability of GTCC to meet such demand, electricity prices have fallen onaverage woldwide by nearly 20%. This naturally led to higher electricity consumption (up by 8.5%) which the accompanying multiplier effect associated with transformation losses.
Within the power generating sector, many striking changes occur woldwide. Generation fromgas turbines c.c. increase by 9250 Twh (more than double the reference case) bringing theirshare to 42% of total generation instead of the 22% of the reference case. This increase isachieved at the expense of super critical coal (-2550 Twh) conventional coal (-1640 Twh) oil (-1500 Twh), brown coal (-1100 Twh) but also nuclear (-750 Twh, 70 % of which the newnuclear design which finds little room to develop). Furthermore, one clean coal technology (theIGCC) because of the improvements associated with turbines finds itself reinforced in thescenario (+1450 Twh worldwide). Three quarters of this latter increase takes place in Asiawhere the benefits of the enlarged gas supplies are less obvious as most of the increment has to

Energy Technology Strategy 1995-2030: Opportunities from the Global Warming Threat 179
come from distant sources involving costly transport thus leaving coal competitive over a largepart of the load curve. Combined Heat and power c.c. sees its contribution increasing by 170%to nearly 1000 Twh and in many parts of the world it comes close to saturation imposed by theindustrial constraints to its potential. On the other hand, many renewable sources of electricitysee their prospects slashed by half (notably biomass gasification combined cycle, Wind powerplants and Solar thermal). Even small hydro plants and waste incineration see their contributionreduced by around 20%.
7.4 The Fuel Cell Scenario
This is not strictly speaking an autonomous exercise but an extension of the Gas technologyscenario presented above. It retains the enhanced gas resources with all their ramifications andincorporates the same improvements relating to gas turbine combined cycles, CHP as well as theturbine related clean coal technologies. In addition, three fuel cell technologies are given muchimproved technico-economic characteristics :
• The proton exchange membrane fuel cell for fixed applications which in the reference casesaw fuel efficiency rising from 55% in 2000 to 60% in 2030 has it rising further to 63% forthat latter year. Likewise, specific capital costs which fell from 3450 Ecu/Kw in 2000 to 864Ecu/Kw in 2030 in the reference case are allowed to reach one third of that value and thefixed operating costs for the scenario are also 1/3 of their reference value while specificvariable operating costs are allowed to halve.
• The Solid Oxyde fuel cell with cogeneration which is also a stationary application hadefficiencies rising from 60% to 70% between 2000 and 2030 this latter efficiency wasdeemed to represent an upper limit and was therefore kept unchanged in the scenario.Specific capital costs which reached 800 Ecu/Kw in the reference case were further reducedto 600 Ecu/Kw for the scenario while fixed and variable operating costs by 2030 represent inthe scenario one third of their respective values in the reference case. Variable costsreductions are mostly due to large stack cost reductions.
• A hydrogen fuel cell car was included on the rationale that stationary fuel cell technologyimprovements as outlined above would also have an impact on smaller mobile formsrequired for vehicles. Although important improvements have been assumed relating to costper Kw, stack costs and car Km/Kwh performance and technical lifetime they have provedinsufficient for producing a significant impact: in the best of cases i.e. in the scenario by theyear 2030 the propulsion system alone costs an additional 20000 ($90) for a relatively small40 Kw car.
As the fuel cell scenario is additional to the gas technology scenario and therefore embodiesmost of the features of the latter, a comparison with the reference case would entail to a largeextent a repetition. A more interesting comparison can be made between the fuel cell and gastechnology scenarios.
The proton exchange membrane fuel cell technology which in the gas technology case hadreached the relatively small contribution of 115 Twh worldwide by 2030 makes significantinroads reaching 1030 Twh. On the other hand the Solid Oxyde fuel cell though trebling in
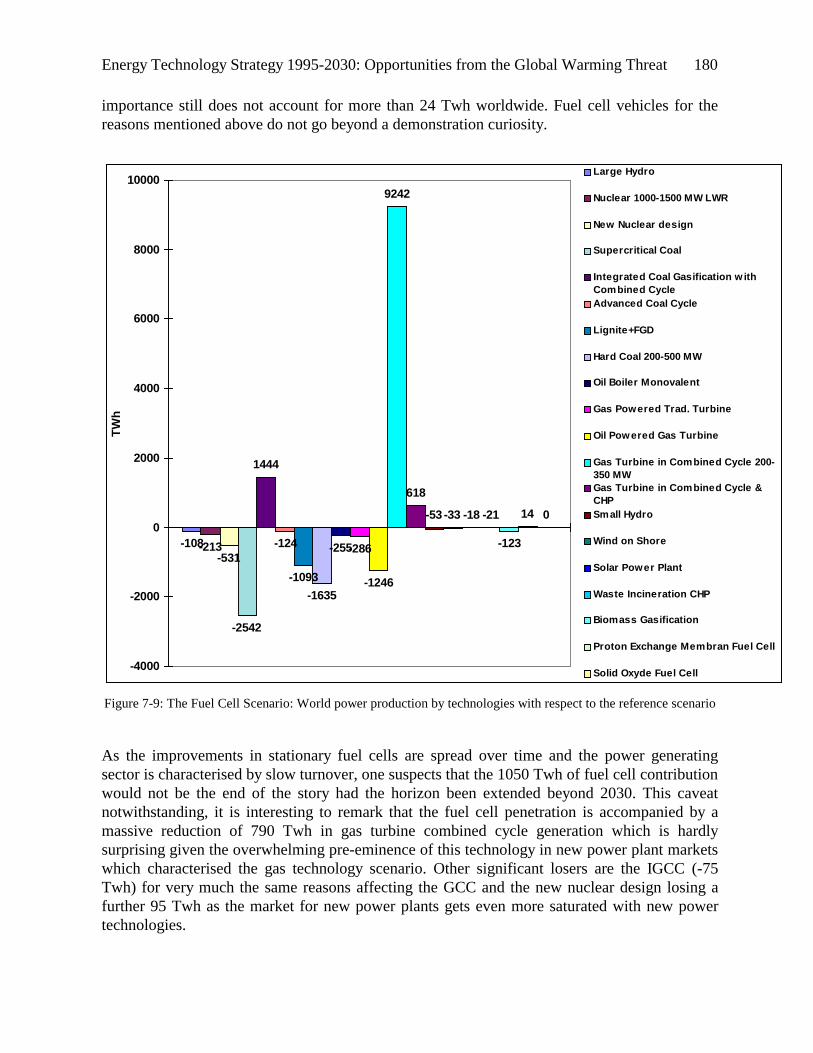
Energy Technology Strategy 1995-2030: Opportunities from the Global Warming Threat 180
importance still does not account for more than 24 Twh worldwide. Fuel cell vehicles for thereasons mentioned above do not go beyond a demonstration curiosity.
Figure 7-9: The Fuel Cell Scenario: World power production by technologies with respect to the reference scenario
As the improvements in stationary fuel cells are spread over time and the power generatingsector is characterised by slow turnover, one suspects that the 1050 Twh of fuel cell contributionwould not be the end of the story had the horizon been extended beyond 2030. This caveatnotwithstanding, it is interesting to remark that the fuel cell penetration is accompanied by amassive reduction of 790 Twh in gas turbine combined cycle generation which is hardlysurprising given the overwhelming pre-eminence of this technology in new power plant marketswhich characterised the gas technology scenario. Other significant losers are the IGCC (-75Twh) for very much the same reasons affecting the GCC and the new nuclear design losing afurther 95 Twh as the market for new power plants gets even more saturated with new powertechnologies.
-108-213-531
-2542
1444
-124
-1093
-1635
-255-286
-1246
9242
618
-53 -33 -18 -21
-123
14 0
-4000
-2000
0
2000
4000
6000
8000
10000
TW
h
Large Hydro
Nuclear 1000-1500 MW LWR
New Nuclear design
Supercritical Coal
Integrated Coal Gasification w ithCombined CycleAdvanced Coal Cycle
Lignite+FGD
Hard Coal 200-500 MW
Oil Boiler Monovalent
Gas Powered Trad. Turbine
Oil Pow ered Gas Turbine
Gas Turbine in Combined Cycle 200-350 MWGas Turbine in Combined Cycle &CHPSmall Hydro
Wind on Shore
Solar Power Plant
Waste Incineration CHP
Biomass Gasification
Proton Exchange Membran Fuel Cell
Solid Oxyde Fuel Cell

Energy Technology Strategy 1995-2030: Opportunities from the Global Warming Threat 181
Asia416
-291
-8
117
-300
-200
-100
0
100
200
300
400
500
MtofC
CoalGasOilCO2
OECD584
-586
23 21
-600
-400
-200
0
200
400
600
MtofC
CoalGasOilCO2
Other World
193
-379
404
218
-400
-300
-200
-100
0
100
200
300
400
500
MtofC
CoalGasOilCO2
World
1193
-1256
419 356
-1500
-1000
-500
0
500
1000
1500
MtofC
CoalGasOilCO2
Figure 7-10 The Fuel Cell Scenario by zones: comparison with the baseline
Under these circumstances it is not surprising that world CO2 emissions decrease only by afurther 0.4-0.5% making a 2.5% difference from reference. It seems that there are strict limits asto what can be achieved by adding attractive technologies to one another when essentially theyare competing for the same patch.
7.5 The Renewable Energy Technology Scenario
This Scenario is different from the ones previously examined in that it is not organised around asingle technological breakthrough or a generically linked cluster of technological developments.It is rather representative of a situation where a major R&D effort would be directed ondecentralised renewable technologies producing drastic improvements in the techno-economiccharacteristics of a number of them which are otherwise technologically heterogeneous. Themain technologies affected in this scenario are the following:
• Biomass gasification for electricity production in small scale (less than 25 MW) combinedcycle plants. In the reference case this technology saw no improvement in specific capitalcosts but a 40 % reduction in fixed operating costs and an increase in efficiency from about35 % at present to 43 %. Under these circumstances the contribution of this technologyslightly more than doubled by 2030 (registering a very low average growth of under 2.5 %p.a.)
For the technology scenario specific capital costs were assumed to halve by 2030 with somefurther improvements in efficiency and operating costs. The impact of these changes was a nearseven fold increase in contribution between the present, and 2030, albeit with an inflexion of

Energy Technology Strategy 1995-2030: Opportunities from the Global Warming Threat 182
growth towards the end of the period due to increasing costs of the biomass itself as the cheapersources are gradually exhausted.
• Photovoltaics in buildings, involving mostly cells incorporated in window panels saw theircapital cost plunge from about 12,000 ECU/ kW to 5,000 ECU/kW by 2010 and 4,000ECU/kW by 2030 in the reference case. Specific fixed O& M costs were halved between thepresent and 2030. Impressive as these reductions are they left the cost of electricity producedat a generally uncompetitive level and the technology contributed a relatively symbolic, 4,6Twh world-wide by 2030. The technology scenario implies a halving of 2030 reference coststhis implies a reduction of the cost of the Kwh delivered to around 0.17 ECU which thoughstill not generally competitive with network electricity allows at least the development ofniche markets and leads to a contribution of around 32 Twh world-wide by 2030. Of theseonly about 6 Thw are produced in developing countries despite the fact that on average theyenjoy better insolation conditions. This discrepancy underlines the “luxury” nature of thistechnology even with the additional improvements.
• Molten Salt Tower Solar plant with storage was the main solar thermal power technologyretained with a capital cost reduced to 1600 ECU/ kW fixed O & M costs of 34 ECU/kWp.a. and a capacity factor of 36 % by 2030. In the reference case it achieved a contributionof 31 Twh word-wide. In the technology scenario with these figures reaching 1130 ECU/kW25 ECU/kW. p.a. and 38 % respectively its contribution reaches 114 Twh world-wide. It isworth noting that though this latter figure is relatively modest it does not represent the fullpotential impact of the scenario as by 2030 this technology is still in the stage of verticaltake off in industrialised countries and has not even entered that stage in the developingcountries where most of the physical potential exists.
• Small hydro which in the reference case was assumed to be a mature technology registeringinsignificant gains over the projection period sees its capital cost halved for the scenario andhence its contribution double from 250 Twh to 505 Twh word-wide by 2030. However bythe end of the period the technology displays clear signs of saturation as the best availablesites are gradually exhausted.
• On shore wind turbine (over 500 kW capacity) offers the highest contrast betweenreference and scenario. In the reference case no significant reduction in capital costs wasassumed all improvements being concentrated in a relatively modest increase in capacityfactors to a range of 12-30 % depending on site. The technology scenario by contrastimplies a reduction of capital costs to one third of their present level and further significantincreases (+ 33 %) in capacity factors.
These developments render wind power highly competitive, its intermittent characternotwithstanding and lead to massive development world-wide (nearly 1600 Twh by 2030). Thisdevelopment is furthermore fairly evenly distributed about half occurring in industrialisedcountries.
Figure 7-11 shows the projected differences in terms of world power output by 2030 with respectto the baseline scenario.

Energy Technology Strategy 1995-2030: Opportunities from the Global Warming Threat 183
Figure 7-11: The Renewables Scenario: World power production by technologies with respect to the referencescenario
In addition to the above, the renewable scenario included three more technologies where theimprovements implied were insufficient to produce a significant impact. These were: (a) lowtemperature passive solar which due to insufficient cost reductions remained a niche option, (b)rural photovaltaic which becomes uncompetitive with network connection and therefore faces ashrinking market potential as electrification proceeds, and (c) methanol from biomass for use invehicles which even with the improvements assumed in the technology scenario remained morecostly than conventional oil and failed to penetrate significantly in the absence of preferentialfiscal treatment.
The net result of the scenario is a 3.3 % reduction in world-wide emissions (2 % in Asia and 5% in OECD). This is primarily achieved by an across the board reduction in centrally produced
-14-58-112
-412
-224-157
-387-410
-30-43-149
-907
54
256
1500
831
510
4 0
-1500
-1000
-500
0
500
1000
1500
2000T
Wh
Large Hydro
Nuclear 1000-1500 MW LWR
New Nuclear design
Supercritical Coal
Integrated Coal Gasificationwith Combined CycleAdvanced Coal Cycle
Lignite+FGD
Hard Coal 200-500 MW
Oil Boiler Monovalent
Gas Powered Trad. Turbine
Oil Powered Gas Turbine
Gas Turbine in Combined Cycle200-350 MWGas Turbine in Combined Cycle& CHPSmall Hydro
Wind on Shore
Solar Power Plant
Waste Incineration CHP
Biomass Gasification
Proton Exchange Membran Fuel

Energy Technology Strategy 1995-2030: Opportunities from the Global Warming Threat 184
electricity (-1600 Twh of coal fired -950 Twh of gas fired and -180 Twh of nuclear generatedelectricity world-wide).
World oil prices are little affected (-1.3 %) but wholesale gas and coal prices are moresubstantially reduced (around - 5 %) allowing for some increase of the consumption of thesefuels outside the power generation (especially in industry) which, partially offsets the substantialreductions in power generation. Generally the scenario has major implications for the field ofnew and renewable technologies but fails to produce a major impact on the CO2 problem.Indeed, these technologies are mostly applicable to the power generating sector, often (beingmostly intermittent) even a limited section of this sector displaying also marked geographicalniches. Another reason for the relatively subdued overall impact of this scenario is that the mostimportant technologies become truly competitive only towards the end of the period thus havinglittle time to penetrate to their full potential
7.6 Conclusion
The main findings of the previous comparison exercise between the 5 considered energytechnology scenarios are briefly summarized in Table 7-15.
Table 7-15 SUMMARY TABLE OF THE IMPACT OF TECHNOLOGY SCENARIOS
(World 2030) Comparison with Reference Case
Scenario Coal Oil Gas Nuclear Hydro CO2 Emissions
Nuclear -94% -0.8% -4.0% 142% -0.7% -5.3%
Clean Coal 4.5% -1.0% -3.9% -13.1% -1.1% 1.0%
Gas Technology -17.5% -8.1% 49.7% -19.6% -2.2% -2.1%
Gas and Fuel Cells -18.6% -8.2% 50.1% -22.5% -2.6% -2.5%
Renewables -5.4% 0.1% -2.3% -4.5% -0.3% -3.3%
A cursory glance at the table above is sufficient to realise that the technology scenarios asdefined in the current work do not offer panaceas for the global CO2 emission problem. Thereasons for this are inherent in the way the scenarios were constructed as well as energy marketstructures and the way their functioning is represented in the POLES model. In lieu ofconclusions some brief points are proposed here for discussion:
• The technology scenarios have been defined in terms of clusters of technologicalbreakthroughs affecting only a part of the energy market and hence global CO2 emissions.They have almost exclusively concentrated on power generation and often essentially onmere segments of the load curve. Important though the power generating sector may be, itstill accounts for about a one third of world CO2 emissions projected to increase to 40% by

Energy Technology Strategy 1995-2030: Opportunities from the Global Warming Threat 185
2030. By simple arithmetic technologies addressing only this sector risk at the best of timesto have an impact which seems 2.5 to 3 times too small.
• Scenarios involving major technico-economic improvements in fossil fuel technologiesproduce weakened impacts on CO2 emissions because at the same time as they reducespecific emissions they make these technologies economically attractive, not only vis-à-vismore polluting technologies but also more polluting ones. Choices are therefore influencedin a far from unambiguous manner as far as CO2 emissions are concerned. In this context itis worth noting that all supply side technological improvements result one way or another ina reduction in the cost of consuming energy and hence potentially cause consumption toincrease. In any case, it is hardly surprising that the scenarios involving non-fossil energy(the nuclear and renewable scenarios) have produced markedly better outcomes as far asCO2 emissions are concerned.
• The two scenarios involving increased gas availability have, in view of the majorrestructuring they imply in world energy markets, produced surprisingly weak results as faras CO2 emissions is concerned. This is due partly to the uneven geographical distribution ofthe enhanced resources resulting in the gas not being available at sufficiently cheap priceswhere it could have made the biggest impact (the big Asian coal users: China and India) butalso due to a series of secondary market effects which brought fuel prices down and causeddemand firmness especially in electricity and gas. All this, notwithstanding the indisputablefact that these scenarios represent a more comfortable energy market situation with all itsconcomitant virtues of security and a propitious environment for economic development.
• There is a clear need for energy saving technology breakthroughs as these are likely to sufferless from the ambiguities and secondary effects associated with supply technologies. It is,however, very difficult to identify a cluster of technologies which would be homogeneousenough to be convincing as an identifiable alternative while at the same time addressing awide spectrum of energy demand. A possible area where such a cluster could beconvincingly found is in the transport sector where perhaps the fuel cell vehicle could berevisited with more drastic improvements in its characteristics.
• It is hard to see how clusters of energy technologies could by themselves make a majorimpact on the global CO2 problem unaccompanied by major policy initiatives albeit marketrelated ones. Combining technology breakthroughs with internalisation of external coststhrough taxation or tradable permits would magnify the impact and tend to neutralise someof the more ambiguous side effects quite apart from the fact that these policy instrumentscan by definition act on a much wider front.

Energy Technology Strategy 1995-2030: Opportunities from the Global Warming Threat 186
Chapter 8: Implications for the EUEnergy R&D Strategy and other
policies
By A.Soria (IPTS)
Having explored the main sources of uncertainty within the energy issue, the practical questionthat public manager have to face is how to assign appropriately R&D funds in order to foster thetransition towards a more sustainable energy system, compatibly with other main policyobjectives such as ensuring energy supply, improving the competitiveness and efficiency of theEuropean industry and guaranteeing the technological leadership of EU countries within thisfield.
Besides these general objectives, there exist a number of additional boundary conditions thathave to be considered when designing a R&D portfolio for the European Union:
• the creation of a single energy market is an important issue within the Union’s politicalagenda. Merging domestic markets to achieve a larger, unified one will have positive effectson the transparency of prices, on the competitivity of energy services and therefore on theefficiency achieved in processes related to energy transformation and use. Nevertheless,although these benefits will appear in fine, the transition towards a single energy market canbe an extremely painful process, if the adequate measures are not taken.
• the transition towards a single market is being accompanied in the EU by a massive changein the structures of the markets: rather than experiencing transboundary movements to mergenational monopolies to produce a situation with a larger market with similar degree ofmonopolistic control, national companies are being privatised and disaggregated. In manycases, national markets are being simultaneously open to domestic and foreign competition.Some of the energy companies are being unbundled prior their privatisation, whereas someother are likely to maintain their size. The creation of transnational energy companies is,however, a less likely scenario. Therefore, the downsizing of the average energy company(operating more and more as a price-accepter, with lower control on the market and closer tothe zero-profit borders) is a fact that has to be taken into account when considering the R&Dpriorities in the EU.
• the EU technology policy has to be designed within the framework of the subsidiarityprinciple that holds for the European-wide coordinated programmes: actions should be taken

Energy Technology Strategy 1995-2030: Opportunities from the Global Warming Threat 187
at a European level only when the instrumentation of such a coordinated policy is moreefficient than separately implementing national plans (even if aiming at the same generalscope). There are many reasons indicating that energy R&D is a field wher significant gainsmay be obtained as a result of a coordinated, EU-wide R&D action plan. Amongst thesereasons one may remark the presence of importants economies of scale in executing R&Dactions at a EU scale, because of the complementarities and savings induced by conductingmany research in trans-European pools of R&D corporations: larger, coordinated groupsavoid the possibility of doubling the efforts and allow for a more exhaustive exploration ofthe concerned lines of research. In addition, subcritical research teams that are maintained byinertial reasons may regain efficiency if stimulated by the exchange of ideas within a broaderresearch consortium. Besides this, there are research fields whose costs are simply too highto be endeavoured by a single Member State, are feasible only concerted research poolsanimated by the European Commission. Economies of scope are also found in extending theoverall R&D framework to include energy technology programmes: the possibililty ofapplication of innovations originated within the energy technology cluster may diffusetowards other industrial sectors more efficiently if the R&D programmes are coordinated atthe same European level.
8.1 R&D Portfolio, Technological Progress and MarketStructure
Technological innovations often requiere the public support at the early stages of theirdevelopment. Although this was not the case for many many technologies whose emergence hashad great importance, nowadays most of the relevant innovation clusters are supported, in a wayor another, by public policies.
A question of capital importance is to determine the basic lines for energy research andtechnological development to be supported by the means of public policies at the EU level.Answering this question implies first a clear understanding on the situation the system ismoving towards and second to figure out how should look like the situation that may beclassified as ‘optimal’.
It is usual to distinguish between product innovation and process innovation, supply side beingmostly concerned by the former, whereas demand side is more affected by the latter. Thisdichotomy is even stronger in the case of the energy markets. Being supply and demandseparated quite apart by the physical presence of the energy carrier (electricity, distributed gas,etc.), whose price did not depend on the conditions of delivery, the two innovation subsystemswere connected (at least in the short to medium term) only by the weak line of a single pricesignal. From the demand side, the incentives to adopt energy-saving consumption devicesdepend basically on the price of the energy carrier that the final has to pay consumer. Similarly,the main incentive that supply-siders have to develop new processes to deliver consumableenergy concentrate around the product price thay are allowed to charge.
Besides this, compulsory administrative rules may play a role in the adoption of innovations.They have been focused around the supply-side and process innovation, especially for what

Energy Technology Strategy 1995-2030: Opportunities from the Global Warming Threat 188
concerns the elctric sector, which exhibits a remarkable degree of technological diversity.Focusing the regulatory issue in the supply side was customary since energy industries were fora long time typical examples of natural monopolies. Corrective measures to hinder theabsorption of the consumer surplus by the supply side had to be adopted. In addition,environmental constraints emerged later as an important aspect to be considered in the energysector regulation, as well as security of supply issues. These regulatory measures were oftenapplied to generators, since the control from the authorities is easier to be addressed to a reducednumber of firms.
These reasons explain why the innovation process scheme (i.e. supply side) have beenpredominant with respect to the product innovation process (in the sense of more energy-efficentfinal consumption devices). To a certain extent, the demand dynamics is even regressive in thissense. This is so due not only to larger domestic appliances demand more power supply, but alsoto new domestic devices (personal computers, faxes, and many other stand-by machines), andto the generalisation of advanced space heating and air conditioning.
Without misregarding the improvements to the efficiency of the global energy system that maybe obtained from the demand side, it is perceived, however, that these should be considered asincremental efficiency gains that would not solve, in the long run, the problem of theenvironmental compatibility of the energy sector. The trend of the industrial organizationtowards a more dissagregated, decentralized and competitive scheme seems to convey the samemessage: the demand being determined by the general economic development and theemergence of new needs, the industry remains essentially a supply-controlled one, and is viasupply forces that the main bottlencks identified so far have to be solved.
8.2 Short-term issues: improvements to a carbon-dominated panorama
Recalling the results illustrated in Chapter 2, and looking basically to the primary energy mix,the main conclusion that may be extracted is that a fossil fuel-dominated panorama willcontinue to prevail. The difference with the present situation is, however, that the mix,dominated by oil in the past, is moving towards a more balanced situation combining oil, coaland gas in similar shares by the end of the analysed period.
The interpretation of these trends opens a debate. Indeed, in terms of carbon emissions, thefossil-fuel system is experiencing a sort of bifurcation: on one side, low-carbon natural gas isentering in the mix for power generation and industrial and domestic use, because of it isversatile, clean, available and relatively cheap. On the other hand, coal is becoming more andmore an specialised fuel for baseload electricity generation. The interpretation given to themassive use of gas is often referred to the trend of energy de-carbonisation. On the contrary, thepenetration and consolidation of coal in the power generation sector may be viewed as theemergence of the backstop technology already fixing. Indeed, as it has been already commentedabove, there has been a change of paradigm concerning the electric sector: during the sixties andthe seventies, many people thought that nuclear power (a carbon-free technology) wasreinforcing its position as backstop technology within the sector. The reality, however, has gone

Energy Technology Strategy 1995-2030: Opportunities from the Global Warming Threat 189
against this hypothesis, and today it may be agreed that the power generation backstoptechnology is coal, due to both the size, distribution and availability of the reserves as well asthe readiness of the technologies. For what concerns the transport sector , it seems to be solidlylocked-in around the use of oil-derived fossil fuels, which is, today, the corresponding backstoptechnology according to the analyses presented within this report.
• Clean Fossil Fuels
Bearing this in mind, it seems that a significant effort should be put into the development oftechnologies for the clean use of fossil fuels, with particular emphasis on coal and liquid-fuelsfor combustion engines, as well as for its rational use. The importance of developing and puttinginto the market such technologies should pace the increasing awareness of the potential risksassociated to the global warming.
The urgency of going to clean coal also depends on the importance of short-term emissions vis-à-vis the hypothetical level of steady-state carbon concentration in the atmosphere. The carefulassessment of the environmental scenarios including the economic links will continue to betherefore a useful requisite in order to determine the degree pressure that should be put inconducting the technology shifting towards a more carbon-free system. The analysis ofenergy/economy/energy interactions should therefore be pursued and improved, as well as theanalysis coming from the climatology and geology that aim at refining the damage functions(including dynamic effects) of carbon emission and its effects onto the atmosphere.
• Energy Efficiency Measures
It has been already said that, even if the industry as a whole may be considered as supply-driven(since the demand is more or less exogenous and quite rigid to prices), energy efficiencymeasures can contribute to mitigate the pressure on natural resources (as far as they areavailable). Subsidies to incorporate energy savings devices and mandatory rules imposing anadequete degree of energy eficiency in new (and old) constructions are appropriate tools forwhat concerns the domestic and buildings sector.
The transport sector remains the most rigid to control and the less responsive to market-basedtools. In addition, transportation involves issues such as international competitiveness,environmental protection, as well as local congestion of infrastuctures that are extremelydifficult to harmonise. The coordination of these programs should involve all the relatedadministrative bodies, as well as local and national administrations. Simultaneously, theindustry shall receive the clear and credible message that there exists a resolution from thepublic authorities to reconduct the transport system (understanding it as a whole, includinginfraestructures, propulsive technology and organisational issues, such the ‘access to the grid’)towards a more environmentally sustainable one. This may turn out on a race to rapidly adoptthe best available technologies and therefore induce (or at least facilitate) an endogenousstructural change.

Energy Technology Strategy 1995-2030: Opportunities from the Global Warming Threat 190
• Joint Implementation Schemes
Last, but not least, it should be remembered that, for these measures concerning clean coal (and,on a broader basis, clean fossil fuel) technologies to be fully operative, they have to beimplemented world-wide. In particular, they could be more effective in those parts of the globeexperiencing the fastest transition from primitive and poor energy use towards advanced energysystems. A formidable challenge for the advanced countries is to find imaginative and effectiveschemes for technology transfer that simultaneously preserve the interests of technology-ownersand produce incentives in technology demanders to go for the best available technologies. Themeans to achieve this scope may be addressed along many policy lines, implemented viaseparated, but (hopefully) coordinated programmes. These lines may involve from the setup ofefficient know-how difussion mechanisms to the implementation of adequate channels oftechnology transfer. The flow of know-how, bringing to the emerging economies exactly whatthey are looking for, should be combined with increasing awareness on the necessity to satisfythe fast growing demand with the environmental-friendly technologies.
8.3 Long-term objectives: managing the backstoptechnologies
Coming back to the future world energy mix sketched in Chapter 2, there is a wide agreementon the unsustainability of such a coal-dominated panorama. Bearing this in mind, and assumingfor granted (with different probabilities depending on the scenario considered) that a sort ofcoal-era is about to start, a basic objective of the EU energy technology policy should be theminimization of the lenght of this coal age, fostering the emergence of a really sustainablebackstop cluster of technologies. The efforts in R&D should be directed, under this point ofview, towards renewable energy sources and its integration within the energy system.
• Renewable Energy Technologies and their integration
It is evident that, in the long term, only renewable energy sources are sustainable. It is thereforea priority for policy making to foster technological advancements that could put thesetechnologies in a position closer to the commercialisation phase. The support given in the pastto solar technologies, wind power and other RE technological schemes should therefore becontinued, taking into account the relative successes and failures that have been encountered inthe past. The technologies that are not yet close to enter the market should be the target of basicresearch efforts: this is the case of solar technologies (low temperature solar for domestic use,photovoltaics, high temperature solar thermal for power production). Other RE schemes,exhibiting less technological difficulties, are finding obstacles due logistic problems, lack offinancial support, structural inertiae and/or information opacity. This may be the case for windpower and several biomass exploitation schemes. These technologies require a comparativelyhigher effort on dissemination under appropriate finance planning.
One of the main difficulties hindering the penetration of renewables relates to its intrinsicintermittency. Overcoming this difficulty would certainly represent a significat step towardstheir entering in the market as real competitors of the already-established technologies. One ofthe factors that make fossil-fuel valuable as energy carriers is precisely its time-flexibility for

Energy Technology Strategy 1995-2030: Opportunities from the Global Warming Threat 191
use. Due to this, the idea of devices possessing only active regulation (and no passive reservecapacity) was predominant. In this way, at the micro-level, no reserve is required due to the useof flexible energy carriers (natural gas, LPG, electricity), whereas at the macro-level (theelectrical grid), the peak-to-base management is simplified due to the inter-grid connection andthe flexibility of the peak-covering technologies (gas and hydro). New renewable energycandidates have to prove to be at least as flexible as standard peaking schemes (gas turbines andhydro).
Particular emphasis should be given to RE-hybrid schemes, since they could represent thenatural transition towards a fully decarbonized energy system. The experimental implementationof such hybrid schemes (wind-gas, solar thermal-gas) could start to be applied to isolatedsystems to be progressively imcorporated to the main market via decentralised schemes.
Technological R&D in RE is therefore a critical issue for those RE schemes that, beingtechnology-intensive, did not achieve yet competitive unit costs or have an intrisic lack ofoperativeness due to intermittency.
• Energy storage devices
It is clear from the above considerations that an efficient R&D program on long-term energyoptions should not underestimate the research line devoted to energy storage and batteries. Theavailability of cheap, efficient and enviromental friendly electric batteries may indeed contributenot only to the development of decentralised, renewable-based electric systems, but also (andpossibly with more importance) would contribute to the emergence of the electric car and undertechnological formats similar to the ones available today, increasing the degree of technologicaldiversity of the transport sector and preparing the way for more advanced and sustainabletransportation schemes.
High efficency devices, such as fuel cells, are the natural candidate to integrate RE-obtainedenergy carriers onto the electrical system. Although the fuel cell technology has reached asignificant degree of development, with remarkable cost decline in the past years, they are stillwell abovce the competitive threshold. This is also due to the fact that the technology directlycompeting with fuel cells within the natural gas fuel line has (i.e. the gat turbine in combinedcycle) has become extremely competitive.
The topic of energy-storage goes even beyond these issues. Indeed, the development of efficient,safe and versatile energy carriers would make it possible to overcome the intrinsic limitationsof use of many specialised energy technologies, able to operate using particular fuels of energyforms. The most appealing case, that puts again into evidence the stiffness of the energy system,is the technological impermeability between the electric and transport sectors. These sectors areleading the bulk of the expansion of the world primary energy demand, and jointly contributingfor more than 50% of the global carbon emissions. The possible candidates to play a significantrole as inter-technology energy carrier are well known: hydrogen, methanol, and, of course,battery-stored electricity. Developing these technologies is a challenge in which the R&D effortwill have a significant role, and for which public R&D programmes have a room to complementand reinforce the private efforts, that would be concentrated on research domains closer to themarket place.

Energy Technology Strategy 1995-2030: Opportunities from the Global Warming Threat 192
• Nuclear energy: the fission and fusion programmes
It is extremely difficult to ascertain now wheter nuclear energy has to be considered as adefinitive backstop technology or just as a valuable tool that could contribute (temporarily) tomake shorter the carbon era. In a way, this debate is irrelevant. The reality is that nuclear energysupplies today a non-negligible share of the world primary energy, which is considerably higherin some countries of the OECD. Many developing countries whose demand for electricityincreases rapidly are considering a progressive nuclearization of their electrical sectors. This isthe case even for countries such China and India, with significant coal reserves. On the contrary,there are advanced countries that decidedly endeavoured a dismantling policy (Canada, Sweden)or at least a nuclear moratoria (USA, Germany, and many others). The outcome of the process isnot yet clear. In any case, nuclear power is a carbon-free option that may or not expandaccording first to the social willingness to accept the associated disadvantages and second to thedegree with which the global warming threat will emerge in the forthcoming decades.
Besides this, there is a number of nuclear-based advanced technology initiatives that offer ahuge potential, and could indeed become the ultimate backstop technology, but whose degree ofadvancement is still far from the commercialization phase, namely nuclear fusion. Basicresearch is still required to determine the feasibility today’s design. The private sector still feelsthis alternative so remote, that only public support could contribute to the exploration of thesenew technology lines.

Energy Technology Strategy 1995-2030: Opportunities from the Global Warming Threat 193
References
Armand, F. and Ayache, G.1995. Le développment de l’éolien en France et dans le monde:quelles perspectives pour l’éolin en France?. Brochure ADEMA, Nov. 1995
Beer, J., Worrell, E. and Blok, K., 1995. Long term energy efficiency improvement, in: S.Zwerver, R.S.A.R. van Rompaey, M.T.J. Kok and M.M. Berk (eds.), Climate ChangeResearch: Evaluation and Policy Implications, Elsevier Science, The Netherlands (pp.1081–1086).
Berkhout, F., 1991,Radioactive wastes and the nuclear revival, Energy Policy, vol 19, nº7,pp615-620Elsevier Science, The Netherlands (pp. 1081–1086).
Blok, K., Farla, J., Hendriks, C., and Turkenburg, W., 1991, Carbon Dioxide Removal: AReview, Paper presented at the International Symposium on Environmentally Sound EnergyTechnologies and their Transfer to Developing Countries and European Economics inTransition (ESETT '91).
Bupp, I. and Derian, J.C. 1978. Light water: how the nuclear dream dissolved. New York, BasicBlackwell.
Committee on Science, Engineering and Public Policy (COSEPUP), 1991, Policy Implicationsof Greenhouse Warming: Report of the Mitigation Panel, U.S. National Academy ofSciences, U.S. National Academy of Engineering and Institute of Medicine, U.S. NationalAcademy Press, Washington, DC, USA.
Cowan, R. 1990. Nuclear Power Reactors: a study in technological lock-in. The Journal ofEconomic History, Vol. 4, nº 3
DOE (US Department of Energy), 1993, A Research Needs Assessment for The Capture,Utilization and Disposal of Carbon Dioxide from Fossil Fuel-Fired Plants, DOE,Washington, DC, USA.
DOE/EIA, 1996, The Changing Structure of the Electric Power Industry: An Update,Department of Energy/Energy Information Administration, December.
DOE/EIA, 1997, Electricity Prices in a Competitive Environment: Marginal Cost Pricing ofGeneration Services and Financial Status of Electric Utilities, A Preliminary AnalysisThrough 2015, Department of Energy/Energy Information Administration, August.
Douglas, J. 1991, Fuel Cells for Urban Power EPRI Journal September, pp 5-11.
EC (European Commission) 1995. Techno-economic assessment studies of fossil fuel and fuelwood power generation technologies, Joule II-Programme R&D in Clean Coal Technology,Directorate-General for Science, Research and Development, Brussels, Belgium (pp. 125).

Energy Technology Strategy 1995-2030: Opportunities from the Global Warming Threat 194
Environmental Protection Agency (EPA), 1990, Policy Options for Stabilizing Global Climate,EPA, Washington, DC, USA.
Electric Power Research Institute (EPRI), 1990, New push for energy efficiency, EPRI Journal15(3): 4–17; and Barakat and Chamberlin Inc., 1990, Efficient Electricity Use: Estimates ofMaximum Energy Savings, EPRI Report CU-6746, EPRI, Palo Alto, CA, USA.
EWEA 1991, Time for action: Wind energy in Europe. European Wind Energy Association.
Feron, P.H.M., and Jansen, A., E., 1995, Capture of Carbon Dioxide Using Membrane GasAbsorption and Reuse in the Horticultural Industry, Paper presented at the 2nd InternationalConference of Carbon Dioxide Removal, 25–27 October 1994, Kyoto, Japan.
Finon D., 1995, “La Diversification des Modèles d’Organisation des Industries Electriques dansle Monde: une Mise en Perspective”, Revue de l’Energie, 465, Janvier-Février.
Finon D., et Menanteau, Ph,. 1989, “L’échec des surgénerateurs: autpie d’un grand programme”Grenoble PUG..
Fisher, D., ed., 1990, Options for Reducing Greenhouse Gas Emissions, StockholmEnvironment Institute, Stockholm, Sweden.
Giovannini, B. and Pain, D., 1990, Scientific and Technical Arguments for the Optimal Use ofEnergy, Université de Genève, Geneva, Switzerland.
Gipe, P. 1995, Wind Energy Comes of Age, John Wiley & sons, Inc.
Gipe, P. 1996, 1996 Overview of Wind Generation, WWW, P. Gipe Inc..
Golomb, D., Herzog, H., Tester, J., White, D., and Zemba, S., 1989, Feasibility, Modeling andEconomics of Sequestering Power Plant CO2 Emissions in the Deep Ocean, MIT-EL 89-003, Massachusetts Institute of Technology, Cambridge, MA, USA.
Grubb, D., and Meyer, N.I., 1993, Wind energy: Resources, systems and regional strategies, inRenewable Energy: Sources for fuel and electricity, Ed. T.B. Johansson, H. Kelly, A.K.N.reddy and R.H. Williams.
Grubb, M., Chapuis, T. and Duong M. H., 1995: The economics of changing course.Implications of adaptability and inertia for optimal climate policy. Energy Policy, 23, 417-432.
Hall, D.O., 1994. Biomass energy options, Proceedings of the Energy Technologies to ReduceCO2 Emissions in Europe: Prospects, Competition, Synergy, April 11-12, 1994. Petten, TheNetherlands, OECD/IEA, Paris, France (pp. 159–194).
Haugan, P.M., and Drange, H., 1992, Sequestration of CO2 in the Deep Ocean by ShallowInjection, Nature, 357: 318–320.
Herman, R., Ardekani, S.A., and Ausubel, J.H., 1989, Dematerialization, in J.H. Ausubel andH.S. Sladovich, eds., Technology and Environment, U.S. National Academy Press,Washington, DC, USA.

Energy Technology Strategy 1995-2030: Opportunities from the Global Warming Threat 195
Herzog, H.J., and Adams, E.E., 1995, Environmental Impacts of Ocean Disposal of CO2, Paperpresented at the International Energy Agency Greenhouse Gases: Mitigation OptionsConference, 22–25 August 1995, London, UK.
Hirschenhofer, J.H., 1997, Fuel cell statuts: 1996, IEEE AES Systems Magazine, March 1997 p23-28.
Hunt S. and Shuttleworth, G. 1996, Competition and Choice in Electricity, John Wiley&Sons.
International Energy Agency (IEA), 1991, Energy Efficiency and the Environment, OECD/IEA,Paris, France.
IEA (International Energy Agency Greenhouse Gas R&D Programme), 1994, Carbon DioxideCapture from Power Stations, Report Number SR2P, IEA, Gloucestershire, UK.
International Energy Outlook 1997. Energy Information Administration. Office of IntegratedAnalysis and Focasting. US Department of Energy, Washington, DC.
International Energy Agency 1995: World Energy Outlook. IEA Paris.
International Energy Agency 1997: World Energy Outlook. IEA Paris.
IPCC (Intergovernmental Panel on Climate Change), 1996a, Climate Change 1995, A Review ofMitigation Cost Studies, Cambridge University Press, Cambridge, UK.
IPCC (Intergovernmental Panel on Climate Change), 1996b, Policies and Measures forMitigating Climate Change 1996, Cambridge University Press, Cambridge, UK.
Ishibashi, M., Ota, H., Akutsu, N., Umeda, S., Tajika, M., Izumi, J., Yasutake, A., andKageyama, Y., 1995, Technology for Removing Carbon Dioxide from Power Plant Flue Gasby the Physical Adsorption Method, Paper presented at the International Energy AgencyGreenhouse Gases: Mitigation Options Conference, 22–25 August 1995, London, UK.
Karras, K. 1992, Wind Energy: what does it really cost? , Paper presented at the Windpower ‘92Annual Conference of the American Wind Energy Association, Seattle, USA.
Kaya, Y., Fujii, Y., Matsuhashi, R., Yamaji, K., Shindo, Y., Saiki, H., Furugaki, I., andKobayashi, O., 1991, Assessment of Technological Options for Mitigating Global Warming,Paper presented at the IPCC EIS Group Meeting, 6–7 August 1991, Geneva, Switzerland.
Kemi, W., 1987, Industrial uses of carbon dioxide, in M. Aresta and G. Forti, eds, CarbonDioxide as a Source of Carbon, NATO ASI Series C, Vol. 206, Reidel, Dordrecht, TheNetherlands.
Kliman, M., 1997, Enhancing the Market Deployment of Energy technology, Edited by theInternational Energy Agency..
Levine, M.D., Geller, H., Koomey, J., Nadel, S., and Price, L., 1992, Electricity End-UseEfficiency: Experience with Technologies, Markets, and Policies Throughout the World,Lawrence Berkeley Laboratory, Berkeley, Ca, USA.
Madsen, B.T. 1995: Market Update. Wind Stats Newsletter, Vol 8, nº 2

Energy Technology Strategy 1995-2030: Opportunities from the Global Warming Threat 196
Manne, A.S. & Richels, R.G. 1992: Buying greenhouse insurance. pp 182 The MIT Press,Cambridge, Massachusetts.
Marchetti, C., 1976, On Geoengineering and the CO2 Problem, RM-76-17, InternationalInstitute for Applied Systems Analysis, Laxenburg, Austria.
Masters, C.D. et al., 1987, World Resources of Crude Oil, Natural Gas, Natural Bitumen andShale Oil, Proceedings of the 12th World Petroleum Congress, 5:3–27, John Wiley,Chichester, UK.
Masters, C.D., Root, D.H., and Attanasi, E.D., 1991, World resources of crude oil and naturalgas, Preprints of the 13th World Petroleum Congress 25: 1–14, John Wiley, Chichester, UK.
Mc Mullan, J. T. Williams, B.C., Campbell, P. McIlveen-Wright, D. and Bemtgen, J.M., 1995Techno-economic assessment studies of fossil fuel and fuel wood power generationtechnologies, EC, DG XII Brussels
Meier, A., 1991, Supply Curves of Conserved Energy, in Proceedings of the IEA InternationalConference on Technology Responses to Global Environmental Challenges: EnergyCollaboration for the 21st Century, 6–8 November 1991, Vol. 1, Inter Group Corporation,Kyoto, Japan.
Michaelis, L., 1994. The transport sector, Proceedings of the Energy Technologies to ReduceCO2 Emissions in Europe: Prospects, Competition, Synergy, April 11–12, 1994. Petten, TheNetherlands, OECD/IEA, Paris, France (pp. 73–114).
Mimura, T., Shimojo, S., Suda, T., Iijima, M., and Mitsuoka, S., 1994, Research andDevelopment on Energy Saving Technology for Flue Gas Carbon Dioxide Recovery andSteam System in Power Plant, Paper presented at the 2nd International Conference ofCarbon Dioxide Removal, 25–27 October 1994, Kyoto, Japan.
Nakicenovic, N., Grübler, A., Inaba, A., Messner, A., Nilsson, S., Nishimura, Y., Rogner, H.-H.,Schäfer, A., Schrattenholzer, L., Strubegger, M., Swisher, J., Victor, D. and Wilson, D.,1993. Long-term strategies for mitigating global warming, Special Issue of Energy–TheInternational Journal 18(5):401–609.
Nakicenovic, N., 1995. Carbon dioxide reduction strategies, PIK/WI Workshop on Cost-BenefitAnalyses of Climate Change, 10-11 November 1995, Potsdam, Germany.
Newman, P. and Kenworthy, J., 1989, Cities and Automobile Dependence: A Sourcebook,Gower Technical, Aldershot, UK.
Nishikawa, N., Morishita, M., Uchiyama, M., Yamaguchi, F., Otsubo, K., Kimuro, H., andHiraoka, R., 1992, Carbon Dioxide Clathrate Formation and its Properties in the SimulatedDeep Ocean, Paper presented at the 1st International Conference of Carbon DioxideRemoval, 4–6 March 1992, Amsterdam, The Netherlands.
Nishikawa, N., Ishibashi, M., Ohta, H., Akutsu, N., Matsumoto, H., Kamata, T., and Kitamura,H., 1995, CO2 Removal by Hollow-Fiber Gas-Liquid Contactor, Paper presented at the 2ndInternational Conference of Carbon Dioxide Removal, 25–27 October 1994, Kyoto, Japan.

Energy Technology Strategy 1995-2030: Opportunities from the Global Warming Threat 197
Nishimura, F., 1991, Technology Assessment for the Reduction of Carbon Emissions in theElectricity Sector, International Institute for Applied Systems Analysis, Laxenburg, Austria(draft).
Office of Technology Assessment (OTA), 1991, Energy Technology Choices Shaping ourFuture, OTA, Washington, DC, USA.
Okken, P.A. and Ybema, J.R., 1994. CO2 Reduction through Materials Chain Management,Proceedings of the Energy Technologies to Reduce CO2 Emissions in Europe: Prospects,Competition, Synergy, April 11–12, 1994. Petten, The Netherlands, OECD/IEA, Paris,France (pp. 303–324).
Perry, R.H., and Green, D., 1983, Perry’s Chemical Engineers Handbook, 6th edition, McGrawHill, New York, NY, USA.
Saha, S., and Chakma, A., 1992, Separation of CO2 for Gas Mixtures with Liquid Membranes,Paper presented at the 1st International Conference of Carbon Dioxide Removal, 4–6 March1992, Amsterdam, The Netherlands.
Saji, A., Yoshida, H., Sakai, M., Kitamura, H., and Kamata, T., 1992, Fixation of CarbonDioxide by Clathrate Hydrate, Paper presented at the 1st International Conference of CarbonDioxide Removal, 4–6 March 1992, Amsterdam, The Netherlands.
Schüssler, U., and Kümmel, R., 1989, Carbon Dioxide Removal from Fossil Fuel Power Plantsby Refrigeration Under Pressure, in W.D. Jackson and D.A. Hull, eds., Proceedings of the24th Intersociety Energy Conversion Engineering Conference, Washington, DC, USA.
Springmann, F., 1991, Analysis of the Ecological Impact of Demonstration Projects in the Fieldof Rational Use of Energy: Development of Evaluation Criteria, Study on behalf of theCommission of the European Communities, Directorate General for Energy (DG XVII),Regio–Tec GmbH, Starnberg, Germany.
Steinberg, M., 1996. The carnol system for methanol production and CO2 mitigation from coalfired power plants and the transportation sector, Brookhaven National Laboratory, Upton,NY.
Strubegger, M. and Reitgruber, I., 1995. Statistical analysis of investment costs for powergeneration technologies, WP-95-109, International Institute for Applied Systems Analysis(IIASA), Laxenburg, Austria (pp. 21).
TERES II 1996, The European Renewable Energy Study Energy for Sustainable Development,ESD Ltd. Corsham, UK.
Train, K.E., 1985, Discount rates in consumers' energy-related decisions: a review of theliterature, Energy 16(12): 1243–1253.
Train K.E., 1991, Optimal Regulation: the Economic Theory of Natural Monopoly, The MITPress, Cambridge, Massachusetts
Turkenburg, W.C., 1995. Energy demand and supply options to mitigate greenhouse gasemissions, in S. Zwerver, R.S.A.R. van Rompaey, M.T.J. Kok and M.M. Berk (eds.),Climate Change Research: Evaluation and Policy Implications, Elsevier Science, TheNetherlands (pp. 1013–1054).

Energy Technology Strategy 1995-2030: Opportunities from the Global Warming Threat 198
World Energy Council and International Institute for Applied Systems Analysis, (WEC-IIASA),1995, Global Energy Perspectives to 2050 and Beyond, World Energy Council, London,UK.
Worrell, E., Cuelenaere, R.F.A., and Blok, K., 1992, Energy Consumption of IndustrialProcesses in the EC, University of Utrecht, The Netherlands.
Walker J.A.,1996, The Influence of Privatization on the Direction and Scale of R&D: RecentUK Experience in Competition and New Technology in the Electric Power Sector,International Energy Agency/OECD.
Wigley, T. M. L., Richels, R. & Edmonds, J.A. (1996): Economic and environmental choices inthe stabilisation of atmospheric CO2 concentrations. Nature, 379, 240-243.
World Energy Council and International Institute for Applied System Analysis., 1995. GlobalEnergy Perspectives to 2050 and Beyond. London, WEC Report.
Wrixon, G.T., Rooney, A.M, and Paltz, W., 1993, Renewable Energy Ed. Springer Verlag.
Yanagisawa, Y., 1995. Separation, conversion and disposal of carbon dioxide as mitigationmeasures to global climate change, in Proceedings of the Role of Energy TechnologiesTowards Sustainable Development, 16–20 October 1995, Kansai, Japan.

Energy Technology Strategy 1995-2030: Opportunities from the Global Warming Threat 199
TABLE OF FIGURES.
Figure 2-1Worldwide CO2 emissions ......................................................................................... 11
Figure 2-2: CO2 Emissions per capita. ........................................................................................ 13
Figure 2-3: CO2 Emissions/ GDP. .............................................................................................. 15
Figure 2-4: : per capita GDP in the 11 world regions (1971-2030, logarithmic scale)................ 24
Figure 2-5: GDP growth rates in perspective............................................................................... 25
Figure 2-6: Energy consumption and supply in WE-2030 Baseline............................................ 27
Figure 2-7: Three energy sevices as a function of GDP, past and future.................................... 33
Figure 2-8: Energy Services per capita / GDP per cap, Stationary Fuel Use............................... 34
Figure 2-9: Energy Services per capita / GDP per cap, Transport ............................................... 34
Figure 2-10: Energy Services per capita / GDP per cap, Electricity............................................ 35
Figure 2-11: Electric power demand............................................................................................ 37
Figure 2-12: Possible industrial organization schemes................................................................ 38
Figure 3-1: Decarbonization of global primary energy, historical development and ranges ofcontemporary scenarios. Source: WEC-IIASA 1995......................................................... 46
Figure 3-2: The main processes of CO2 separation and recovery. ............................................... 47
Figure 3-3: Electricity costs and carbon emissions. Source: EC 1995. ...................................... 54
Figure 3-4: Supply curves of energy efficiency improvement measures for the periods 1990–2000 and 1990–2050. A discount rate of 5 percent is used. Source: de Beer et al. 1995. 57
Figure 3-5: Alternative ways of using biomass for CO2 mitigation: sequestering carbon in forestsversus substitution of coal with biomass for electricity. Source: Hall (1994). .................. 59
Figure 3-6: Break-even electricity selling prices for base-case technologies (upper part) and fortechnologies involving CO2 sequestration (lower part). Source: EC 1995........................ 61
Figure 3-7: Improvements in electric conversion efficiency in the U.S., the former Soviet Union,Western and Eastern Europe. Source: Nakicenovic et al (1.993). ....................................... 62
Figure 3-8: Carbon reduction potential of industry as a function of the recycling rate for selectedmaterials............................................................................................................................... 68
Figure 3-9: Steel production chains: energy consumption, carbon emissions, and costs of variousproduction process routes. ................................................................................................... 70
Figure 3-10: Capital costs (per ton of carbon reduced) for (a) steel and (b) cement processtechnology improvements for major world regions versus emission reduction potential. .. 72
Figure 3-11: Energy requirements, costs, and CO2 emissions for six energy chains ending withindustrial motor drives. Source: Messner and Nakicenovic 1992. .................................... 74
Figure 3-12: Summary of process technologies with carbon reductions in steel manufacture,carbon emissions and costs (line) versus specific carbon reduction costs (bars)................. 75

Energy Technology Strategy 1995-2030: Opportunities from the Global Warming Threat 200
Figure 3-13: Modal split between long-distance passenger transportation systems in the formerSoviet Union and China (shifted time axes), in fractional share of passenger kilometers. . 78
Figure 3-14: Carbon emissions (line) versus carbon reduction costs (bars) of varioustechnological changes to passenger cars. ............................................................................. 79
Figure 3-15: Energy and carbon intensity of various passenger transportation technology chains.Source: Schafer, 1992. ........................................................................................................80
Figure 3-16: Energy requirements, costs, and CO2 emissions for six energy chains ending inrefrigeration.......................................................................................................................... 83
Figure 3-17: Carbon emissions (line) versus CO2 reduction cost (bars) for residential heating.The abbreviations represent the three insulation categories in ascending order oftechnological sophistication (0, I, II): natural gas; a hydrogen delivery chain based onhydro-electricity and electrolysis (ElH2); and photovoltaic electricity and electrolytichydrogen (PVH2)................................................................................................................. 84
Figure 5-1: 1990 Electricity generation costs by load for some selected technologies ............. 127
Figure 5-2: 2030 (BAU) Electricity generation costs by load for some selected technologies . 128
Figure 5-3: 2030 (EI) Electricity generation costs by load for some selected technologies ...... 129
Figure 5-4: Capital costs-efficiency map for some selected power generation technologies .... 130
Figure 6-1: Renewable technology penetration to 2030 - BAU scenario. The graph shows thetotal delivered energy (in GWh/year) by each technology; ie. the sum of heat and electricitygenerated and, in the case of biofuels, the energy used in the transport sector.................. 143
Figure 6-2 Renewable energy (excluding large hydro) penetration rises from 3.6% of primaryenergy in Conventional technology market penetration to 2030 - BAU scenario. The graphshows the total delivered energy (in GWh/year) by each technology; ie. the sum of heat andelectricity generated. .......................................................................................................... 144
Figure 6-3: Renewable technology penetration to 2030- Centralised electricity scenario. Thegraph shows the total delivered energy (in GWh/year) by each technology; ie. the sum ofheat and electricity generated and, in the case of biofuels, the energy used in the transportsector. ................................................................................................................................. 144
Figure 6-4Conventional technology market penetration to 2030- Centralised electricity scenario.The graph shows the total delivered energy (in GWh/year) by each technology; ie. the sumof heat and electricity generated ........................................................................................ 145
Figure 6-5: Conventional technology penetration to 2030 - Cleaner fossil fuel scenario. Thegraph shows the total delivered energy (in GWh/year) by each technology; ie. the sum ofheat and electricity generated............................................................................................. 146
Figure 6-6: Renewable technology market penetration to 2030- gas decentralised scenario. Thegraph shows the total delivered energy (in GWh/year) by each technology; ie. the sum ofheat and electricity generated and, in the case of biofuels, the energy used in the transportsector. ................................................................................................................................. 147

Energy Technology Strategy 1995-2030: Opportunities from the Global Warming Threat 201
Figure 6-7: Conventional technology market penetration to 2030 - gas decentralised scenario.The graph shows the total delivered energy (in GWh/year) by each technology; ie. the sumof heat and electricity generated. ....................................................................................... 147
Figure 6-8 Renewable technology market penetration 2030 - Energy efficiency scenario. Thegraph shows the total delivered energy (in GWh/year) by each technology; ie. the sum ofheat and electricity generated and, in the case of biofuels, the energy used in the transportsector. ................................................................................................................................. 148
Figure 6-9: Conventional technology market penetration to 2030 - Energy efficiency scenario.The graph shows the total delivered energy (in GWh/year) by each technology; ie. the sumof heat and electricity generated. ....................................................................................... 149
Figure 6-10: Renewable technology market penetration to 2030 - Renewable future scenario.The graph shows the total delivered energy (in GWh/year) by each technology; ie. the sumof heat and electricity generated and, in the case of biofuels, the energy used in thetransport sector................................................................................................................... 150
Figure 6-11: Conventional technology market penetration to 2030 - Renewable future scenario.The graph shows the total delivered energy (in GWh/year) by each technology; ie. the sumof heat and electricity generated. ....................................................................................... 150
Figure 7-1 World primary energy mix ....................................................................................... 164
Figure 7-2 Baseline World Electricity Mix (TWH) by 2030..................................................... 166
Figure 7-3: The Nuclear Scenario: World power production by technologies with respect to thereference scenario .............................................................................................................. 172
Figure 7-4: The Nuclear Scenario by zones: comparison with the baseline .............................. 173
Figure 7-5: The Clean Coal Scenario: World power production by technologies with respect tothe reference scenario ........................................................................................................ 174
Figure 7-6 The Clean Coal Scenario by zones: comparison with the baseline.......................... 175
Figure 7-7: The Gas Scenario: World power production by technologies with respect to thereference scenario .............................................................................................................. 177
Figure 7-8 The Gas Technology Scenario by zones: comparison with the baseline.................. 180
Figure 7-9: The Fuel Cell Scenario: World power production by technologies with respect to thereference scenario .............................................................................................................. 182
Figure 7-5 The Fuel Cell Scenario by zones: comparison with the baseline ............................. 183
Figure 7-11: The Renewables Scenario: World power production by technologies with respect tothe reference scenario ........................................................................................................ 185

Energy Technology Strategy 1995-2030: Opportunities from the Global Warming Threat 202
INDEX OF TABLES.
Table 2-1: Per year CO2 Emissions............................................................................................. 12
Table 2-2: Per capita CO2 emissions per country........................................................................ 14
Table 2-3: CO2 emission index in 2010....................................................................................... 17
Table 2-4: Key hypotheses and results of world energy studies. ................................................. 18
Table 2-5: 11 world regions for the baseline analysis. ................................................................ 20
Table 2-6: World population 1992-2030 ..................................................................................... 21
Table 2-7: PPP and MER world economic structure and dynamics. ........................................... 22
Table 2-8: World economic growth (PPP). ................................................................................. 23
Table 2-9: Energy consumption and supply in WE-2030 Baseline ............................................. 27
Table 2-10: Oil and gas prices in the WE-2030 Baseline. ........................................................... 28
Table 2-11: Energy intensities. .................................................................................................... 29
Table 2-12: Primary energy consumption, by region................................................................... 30
Table 3-1: Classification of Physical Adsorption methods.......................................................... 49
Table 3-2: Summary of Costs and Potentials of Removal and Storage Options. ........................ 55
Table 3-3: Life cycle GHG emissions and costs. Source: IEA 1994. ........................................ 64
Table 3-4: Electricity costs of biomass, solar photovoltaic, and wind, US cents/kWh. .............. 65
Table 3-5: Cost ranges of biofuels for transportation. Source: IEA 1994. ................................ 66
Table 3-6: Fuel-cycle analysis of automotive fuels. Source: Yanagisawa 1995......................... 81
Table 4-1: Technical performance of clean coal technologies (2000)......................................... 97
Table 4-2: Clean coal technology economic data (2000-2030) ................................................... 98
Table 4-3: Clean coal technologies environmental performance - acid rain ............................... 98
Table 6-1 Market penetration of renewable technologies in 2030 (% of primary energy supply)........................................................................................................................................... 151
Table 6-2: Business as Usual Scenario - Analysis of SAFIRE Results ..................................... 154
Table 6-3: Centralised Electricity Production Scenario - Analysis of SAFIRE Results............ 156
Table 6-4: The Cleaner Fossil Fuel Based Baseload Electricity Production Scenario - Analysisof SAFIRE Results............................................................................................................. 157
Table 6-5: The Gas-induced Decentralized Power Generation System Scenario - Analysis ofSAFIRE Results ................................................................................................................. 159
Table 6-6: The Energy Efficient Decentralized Power Generation System Scenario - Analysis ofSAFIRE Results ................................................................................................................. 160

Energy Technology Strategy 1995-2030: Opportunities from the Global Warming Threat 203
Table 6-7: A Future of Renewable Energy Technologies Scenario - Analysis of SAFIRE Results........................................................................................................................................... 161
Table 7-1: POLES World Primary Energy Projection............................................................... 163
Table 7-2 POLES World Electricity Projection 1992-2030 ...................................................... 164
Table 7-3: POLES World Final Energy Projection ................................................................... 165
Table 7-4: POLES OCDE Primary Energy Projection .............................................................. 166
Table 7-5 POLES OCDE Electricity Projection 1992-2030...................................................... 167
Table 7-6: POLES OCDE Final Energy Projection................................................................... 167
Table 7-7: POLES Asia Primary Energy Projection.................................................................. 168
Table 7-8 POLES Asia Electricity Projection 1992-2030 ......................................................... 168
Table 7-9: POLES Asia Final Energy Projection ...................................................................... 169
Table 7-10: POLES Socio-economic trends .............................................................................. 169
Table 7-11: POLES Baseline oil market outlook ...................................................................... 170
Table 7-12: POLES Baseline gas market outlook ..................................................................... 170
Table 7-13: POLES Baseline oil market outlook ...................................................................... 177
Table 7-12: POLES Baseline gas market outlook ..................................................................... 178
Table 7-15 SUMMARY TABLE OF THE IMPACT OF TECHNOLOGY SCENARIOS ...... 186