Institute for International Economic Policy Working Paper ...
20
Institute for International Economic Policy Working Paper Series Elliott School of International Affairs The George Washington University Tanker Ownership in nonOECD countries and the Rise of GovernmentOwned Fleets IIEPWP201107 Al Wood George Washington University August 2011 Institute for International Economic Policy 1957 E St. NW, Suite 502 Voice: (202) 994‐5320 Fax: (202) 994‐5477 Email: [email protected] Web: www.gwu.edu/~iiep
Transcript of Institute for International Economic Policy Working Paper ...
Institute for International Economic Policy Working Paper Series Elliott School of International Affairs The George Washington University
Tanker Ownership in nonOECD countries and the Rise of GovernmentOwned Fleets
IIEPWP201107
Al Wood
George Washington University
August 2011 Institute for International Economic Policy 1957 E St. NW, Suite 502 Voice: (202) 994‐5320 Fax: (202) 994‐5477 Email: [email protected] Web: www.gwu.edu/~iiep
1
Tanker Ownership in non‐OECD countries and the Rise of Government‐Owned Fleets Al Wood PhD Candidate George Washington University [email protected] 2027364421
Abstract: This paper provides an historical perspective of the global oiltanker market, the international tanker fleet, and the major trends in tanker ownership. The available data indicate that outside the OECD, more than half of large tanker capacity is ultimately owned by governments compared to less than one percent within the OECD. A positive correlation is identified between oil imports and tanker ownership at the national level, but only for nonOECD countries. This result suggests that the forecasted increases in oil imports and exports by emerging economies over the next two decades are likely to result in higher levels of government ownership of the international oil tanker fleet.
Introduction
Oil tankers constitute roughly one third of the world’s vessels in volume terms and about the same share of all seaborne trade. In 2009 80 million barrels of crude oil were produced each day and 53 million of those barrels were traded internationally with two thirds of the traded barrels transported on oil tankers. Much of that oil is transported on tankers a second time as petroleum products, such as gasoline and diesel.i For the U.S. and other oil importing countries, oil tankers are a key link in the oil supply chain. For oil exporting countries, oil tankers connect them to international markets that monetize their valuable resource.
Most studies of oil tanker ownership have focused on the “registered” owners of
tankers, which are the companies that legally own the tankers. But the vast majority of registered owners are subsidiaries of larger companies that maintain ultimate control of the vessels. Therefore, unless otherwise noted, this analysis will focus on the ultimate owner of each tanker, which is also known as the “beneficial” or “group” owner.
Before analyzing the available data on tanker ownership at the national level, this
paper briefly explains the market for tanker services (chapter three) and provides some
2
history of the international tanker fleet (chapter four). Chapter five explores the ownership of the current tanker fleet by the type of owner, while chapter six explores the impact of changing liability laws. Chapter seven considers ownership trends by the nationality of the ultimate owner of the tanker. Chapter eight considers the growth in of the ownership by governments of tankers, while chapter nine offers some concluding remarks with regard to US energy security.
(2) Data Sources:
Two primary data sources were used for this analysis. The data for the current tanker fleet (as of late 2010) is from EA Gibbons Shipbrokers Ltd. It includes ownership information for the 2,505 oil tanker larger than 50,000 thousand deadweight ton (dwt) (365,000 barrels) that were in operation at the end of 2010. The EA Gibsons dataset also includes the “owner type” for each tanker. Seventeen different owner types are included in the EA Gibsons database, which I combined into four basic categories for the purposes of this analysis: independent shipping companies, governments, oil companies, and others. Data on every operational tanker larger than 50,000 dwt from 1986 through 2009 was obtained from Lloyds List Intelligence. In addition to the physical attributes of each tanker (age, size, hull type, etc.) the Lloyds List dataset includes the name and nationality of the owner of each tanker each year.
(3) The market for tanker services
Like oil itself, the services of oil tankers are traded on an open market. Any oil company, refinery, or trader that wishes to charter an oil tanker can do so at the going market rate for a particular route. There are two segments of the charter market – spot charters and time charters. In the spot market, tankers are chartered for a single voyage to deliver a specific volume of oil from point A to point B at an agreed price. In the time charter market, tankers are chartered for a specified number of days, months or even years. Since the early 1980s, the spot market has been much larger than the time charter market. In early 2010, around half of the world’s tankers were employed on the spot market compared to 30 percent on time charters. The remaining tankers are not available for charter. By comparison, in 1974 around half of the world’s tankers were employed on time charters compared to around 12 percent operating in the spot market.ii The tankers not employed in the charter market are owned and operated by oil companies, governments, and other direct participants in the oil trade.
(4) Changes in the fleet of large oil tankers:
There are more than 2,500 oil tankers larger than 50,000 dwt in operation around the world today. 1,iii These tankers are responsible for the vast majority of the international trade in oil. Roughly 80 percent of these large tankers transport crude oil,
1 The conversion from tons to barrels depends on the density of the individual crude oil. As a rule of thumb, one ton of oil is equal to 7.3 barrels. See BP’s conversion calculator at www.bp.com.

3
with the rest carrying petroleum products. The age profile of the this segment of the current tanker fleet is the youngest it been in the last 30 years due to a building boom over the last decade and the mandatory retirement of older single-hulled tankers under both US and international law.2
Three quarters of the large oil tankers now in service were built since the year
2000. This turnover in the international fleet has likely contributed to the changing ownership structure of the international tankers fleet, as some companies have chosen not to replace retired tankers and new companies have entered the market. The current fleet is also much safer, with only 16 percent of larger oil tankers at the end of 2009 having single hulls compared to more than half just ten years ago.
2 All of the figures presented in this section refer to tankers that are greater than 50,000 dwt. The largest tankers are called ultra large crude carriers (ULCCs), and can be as large as 500,000 dwt.

4
The size profile of the current tanker fleet has also changed, with crude oil tankers
growing in size to take advantage of economies of scale for long voyages. Better communications and integrated global markets for chartering and insuring tankers have also increased the efficiency of the global tanker fleet over the last several decades. As a result, tanker services represent a relatively small fraction of the delivered price of a barrel of oil. A the end of 2010, the cost of transporting a barrel of crude from the Persian Gulf to the United States constituted around three percent of the delivered price.
(5) Tanker ownership: By Owner Type The owners of large tankers are divided here into four broad types: independent
shipping companies, governments, oil companies, and others. The independent category includes both publically-traded and privately-owned shipping companies. The government category includes both national shipping lines and tankers owned by national oil companies. The oil company category includes the major international oil companies like Exxon and BP as well as smaller companies like Marathon or Sunoco that own tankers. The other category includes non-traditional owners such as commodity traders and financial institutions.

5
While the vast majority of tankers are owned by the independents, that has not
always been the case. In the early days of the oil industry, the major international oil companies (the majors) owned much of their own tanker capacity. The majors made a strategic decision after the Second World War not to own enough tanker capacity to meet all of their requirements. The decision was commercially driven, as independent tanker owners could operate at lower cost and maximize the utilization of their fleets by moving tankers to the most profitable routes in response to changing market conditions.iv But the oil companies maintained sizable fleets for several decades. In 1969 the majors owned 36% of the overall tanker capacity.
Changes in global oil markets are also thought to have contributed to the decision
by majors to own less oil tanker tonnage. The oil majors where heavily involved in lifting equity oil from the countries that would eventually constitute the OPEC cartel. As they gradually lost their access to OPEC crude in the 1970s, the percentage of oil they obtained on long-term supply agreements was dramatically reduced and their need for dedicated international tanker fleets was further diminished. The growth of the spot market for charters and increases in liability for oil spills further reduced the incentives for oil companies to maintain large tanker fleets, which continued to shrink through the 1990s. v Today roughly four percent of the tonnage of large tankers is owned by the majors.3
3 Very few oil tankers are owned by smaller private oil companies. In general, these companies have chosen to charter in all of their tanker requirements.

6
The 2,500 largest tankers are now owned by more than 350 different companies in
50 different countries.vi This diversity of ownership suggests a healthy level of competition for oil tankers services, which enhances US energy security by ensuring that no single entity can exercise much control over the tanker market. The largest single owner of large oil tankers is the independent Japanese shipping company Mitsui O.S.K., which owns 73 tankers larger than 50 thousand dead weight tons, which represents about four percent of the global fleet of large tanker.
Government ownership of oil tankers can either be by a national oil company or a
national shipping company.4 Identifying which shipping companies are owned by governments is not always strait forward, since governments can be the majority shareholder in publically traded shipping companies that are generally considered independent. For instance, AET (formerly American Eagle Tankers) is wholly owned by the Malaysian firm MISC Berhad, which is a publically traded in Kuala Lumpur. Sixty two percent of MISC Berhad’s shares are owned by the government of Malaysia through the national oil company Pertronas. So I include AET’s oil tankers under the government category, since the government of Malaysia is ultimately the majority owner, though it is generally considered independent.5
Nineteen percent of worldwide tanker capacity is currently owned by
governments.6 While the available data does not allow for a historical analysis of government ownership, published reports by the International Organization of Independent Tanker Owners (Intertanko) suggest that the fraction of tankers owned by governments has increased in recent years. vii
4 This study relies on industry databases and the web sites of the companies themselves to determine the whether the owner of a given tanker is ultimately a government entity. 5 Intertanko lists AET as an independent tanker company. 6 When publically traded companies in which the government is the major shareholder are not counted as government-owned companies, the figure drops to 13 percent, which is the most recent number reported by Intertanko.

7
It takes several years for a tanker to be delivered, so an analysis of the ships on order provides a glimpse into the near future for tanker ownership trends. At the end of 2010, there were 650 tankers larger than 50,000 tons on order with various shipyards around the world. Twenty six percent of the tonnage currently on order is for government-owned entities, which suggests the faction of tankers owned by governments will rise in the near term. The National Iranian Tanker Company has more tanker capacity on order than any other single company with 14 tankers. China has ordered more tankers than any other government with 28 tankers on order through six different states-owned entities. The major international oil companies (Exxon, Shell, BP, Total, etc.) had no large oil tankers on order at the end of 2010.
(6) The role of liability in tanker ownership:
Liability for an oil spill is considered higher in US waters than in the rest of the world. One and a half years after the Exxon Valdez oil spill in 1989, the US congress passed the Oil Pollution Act of 1990. Among its many provisions, the law increased liability limits eight-fold for the owners of oil tankers operating in US waters.7 OPA-90 also allows individual US states to set their own liability standards and nearly every coastal state has chosen against limiting liability for oil spills.viii Industry press from the early 1990s suggests that the threat of unlimited liability was a major concern for tanker owners whose ships were actively involved in delivering oil to the United States, with some analysis predicting that well capitalized tanker owners would stop operating in US waters.ix A government-funded analysis of OPA-90 commissioned in 1994 found that these fears were greatly exaggerated. The report concluded that the US market was simply too large for the big shipping companies to ignore.x xi
International law followed two years later with the 1992 protocol to the
International Maritime Organization’s (IMO) Convention on Civil Liability for Oil Pollution Damages (CLC), which increased liability limits for tanker owners operating in much of the rest of the world.8 In short, tanker owners around the world faced dramatically higher liability for oil spills starting in the early 1990s.
In order to shield themselves from liability many companies (including the
independent shipping companies) created subsidiaries to be the legal owners of the tankers. As shown in figure 6, this effort was already underway in the late 1980s, well before the Exxon Valdez spill. By around the year 2000, 70 percent of tankers were registered to single-vessel companies. As noted above, there are 350 different owners of the largest 2,500 tankers, but those companies have created more than 1,700 individual subsidiaries that are the legal owners of the tankers (the “registered” owners). Some shipping market analysts have argued that a second strategy employed by major private 7 Ship owners have enjoyed limited liability in US waters since the Limited Liability act of 1851. That law was passed to level the playing field between domestic and international shippers. Domestic shippers had assets in the US that could face attachment in a law suit, but international shippers did not have assets in the US and therefore face little or no liability for accidents, which allowed them to operate a lower cost. 8 There are more than 120 signatories the convention. The U.S. and Brazil are the only two major economies that have not joined.

8
oil companies to avoid liability for oil spills was to accelerate their gradual divestment tankers. xii
Under both US and international law, tanker owners and operators are the
“responsible parties” for economic and environmental damages that result from an oil spill. Neither body of law assigns liability to the cargo owners (typically an oil company) for a spill.9 But several U.S. states have chosen to explicitly extend oil spill liability to cargo owners, and a recent US law has extended cargo owner liability to single-hull tankers operating in US waters. The trend toward cargo owner liability is also happening in Europe. In 2008 a French court held the oil major Total liable for the damages resulting from an oil spill on the northern coast of France because the company was found to be negligent in its choice of the tanker it chartered.xiii
Richard Brooks of Yale University has argued that the threat of extended liability
for cargo owners caused oil companies to carry more of their own oil in US waters after the implementation of OPA-90 in order to maintain more control of tanker operations and minimize the risk of an accident. Brooks also points out that the major oil companies face “market liability” for an oil spill from any tanker they charter, even if they are not legally liable for damages. This could include damage to their reputation with customers, governments, and other companies. The threat of extended liability increases the incentives of large oil companies (with deep pockets) to charter high-quality tankers from respected independent shipping companies.xiv
Very few entities have deeper pockets, and therefore more to lose in the event of a
spill, than governments (especially the members of OPEC) so one would expect liability to be a major concern for them as well. Like the oil companies, reputational costs are likely an important consideration for the national oil companies when choosing which tankers to charter and where their vessels will operate.
9 The US Coast Guard Act of 2010 assigns cargo owner liability to single hull tankers operating in US waters, of which there are very few.
9
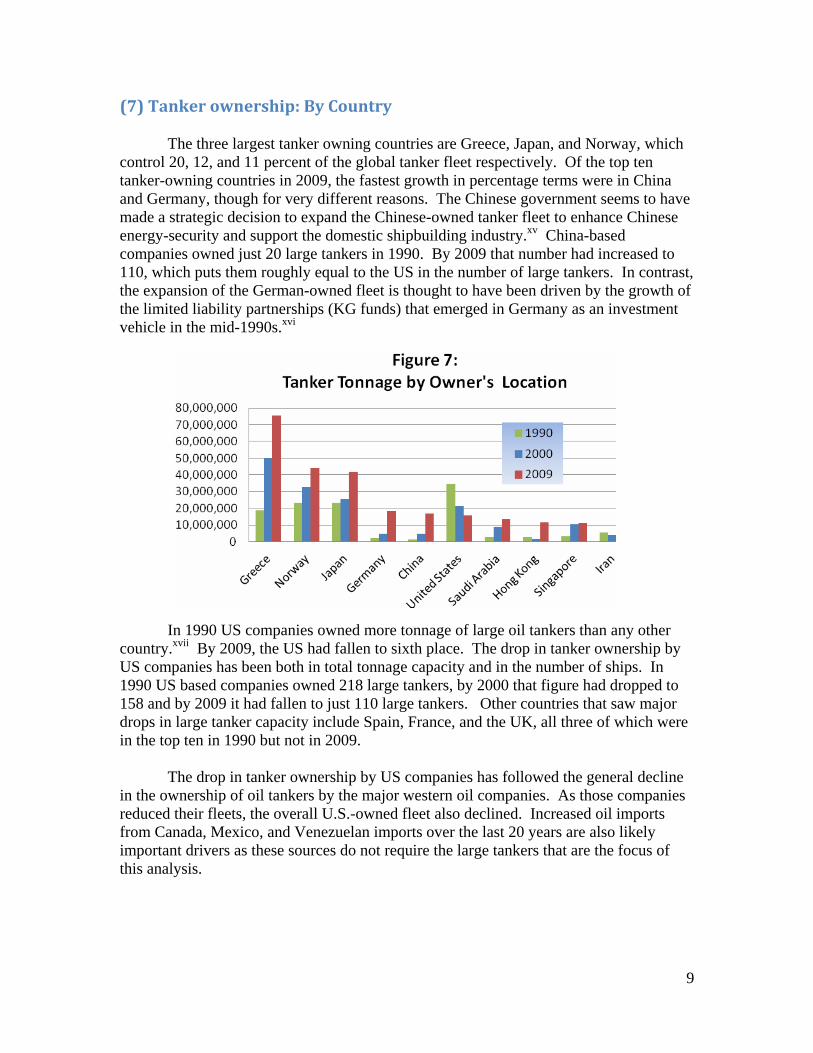
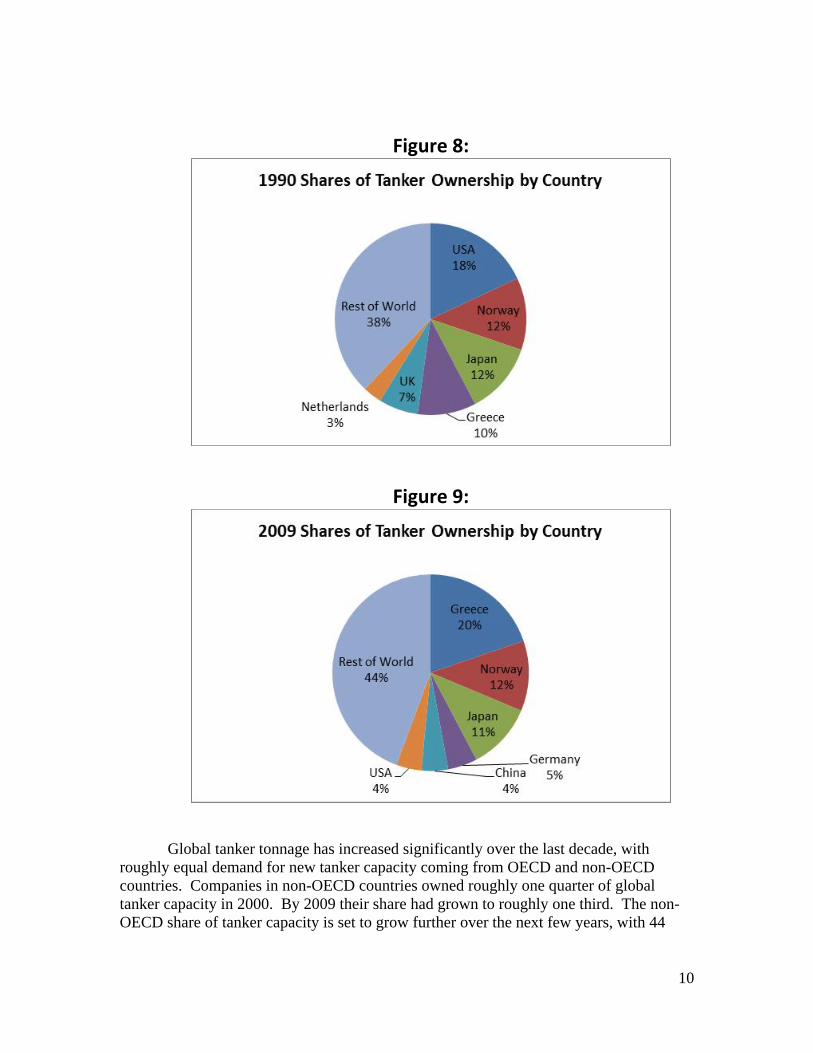
(7) Tanker ownership: By Country The three largest tanker owning countries are Greece, Japan, and Norway, which control 20, 12, and 11 percent of the global tanker fleet respectively. Of the top ten tanker-owning countries in 2009, the fastest growth in percentage terms were in China and Germany, though for very different reasons. The Chinese government seems to have made a strategic decision to expand the Chinese-owned tanker fleet to enhance Chinese energy-security and support the domestic shipbuilding industry.xv China-based companies owned just 20 large tankers in 1990. By 2009 that number had increased to 110, which puts them roughly equal to the US in the number of large tankers. In contrast, the expansion of the German-owned fleet is thought to have been driven by the growth of the limited liability partnerships (KG funds) that emerged in Germany as an investment vehicle in the mid-1990s.xvi
In 1990 US companies owned more tonnage of large oil tankers than any other
country.xvii By 2009, the US had fallen to sixth place. The drop in tanker ownership by US companies has been both in total tonnage capacity and in the number of ships. In 1990 US based companies owned 218 large tankers, by 2000 that figure had dropped to 158 and by 2009 it had fallen to just 110 large tankers. Other countries that saw major drops in large tanker capacity include Spain, France, and the UK, all three of which were in the top ten in 1990 but not in 2009.
The drop in tanker ownership by US companies has followed the general decline
in the ownership of oil tankers by the major western oil companies. As those companies reduced their fleets, the overall U.S.-owned fleet also declined. Increased oil imports from Canada, Mexico, and Venezuelan imports over the last 20 years are also likely important drivers as these sources do not require the large tankers that are the focus of this analysis.
10
Figure 8:
Figure 9:
Global tanker tonnage has increased significantly over the last decade, with
roughly equal demand for new tanker capacity coming from OECD and non-OECD countries. Companies in non-OECD countries owned roughly one quarter of global tanker capacity in 2000. By 2009 their share had grown to roughly one third. The non-OECD share of tanker capacity is set to grow further over the next few years, with 44

11
percent of tanker tonnage on order at the end of 2010 going to beneficial owners in non-OECD countries.
Figure 10
A statistical analysis of tanker ownership between 2000 and 2008 suggests that
the drivers of tanker ownership appear to be very different in the developed and developing worlds. (See the appendix for a full description of the statistical analysis.) Outside the OECD the level of oil tanker ownership for a given country is strongly correlated with the oil imports and exports levels of that country. For instance, the largest non-OECD tanker-owning countries are Saudi Arabia (a major oil exporter) and China (a major oil importer). Within the OECD the opposite is true: tanker ownership for a given country is not significantly correlated with the level of oil imports or exports for that country. For instance, Greece is neither a major importer nor exporter of oil, yet Greece is by far the largest tanker owning country in the world. The US is the largest importer of crude and those imports have grown substantially over the last twenty years, yet the size of the US-owned fleet declined over that same period.
This relationship is important to understanding the trajectory of tanker ownership
because every long-term oil demand projection suggests that non-OECD oil consumption and production will grow much faster than within the OECD. If there continues to be a strong relationship between oil tanker ownership and oil imports/exports in the non-OECD countries, we can expect much higher levels of non-OECD tanker ownership going forward. Figures 11 and 12 show Energy Information Administration (EIA) projections for OECD and non-OECD oil consumption and production projections through 2035.

12
Figure 11
Figure 12
(8) Government Ownership of Tankers: More than half of large tanker capacity outside the OECD is ultimately owned by
governments compared to less than one percent within the OECD. As tanker ownership

13
in non-OECD countries increases, as suggested by the previous section, government ownership of the international tanker fleet is also likely to increase. This trend could have important implications for the market for tanker services. If markets expect increases in government-owned tonnage to extend the recent glut of oil tanker capacity, it could discourage private sector companies from investing in tanker capacity. An increase in government tankers could, therefore, “crowd out” private shipping companies.
The strong correlation outside the OECD between oil imports and tanker ownership suggests that national security considerations are an important driver in the growth of government fleets as opposed to expected global demand for tanker services. Industry publications cite the recent growth of tanker capacity, despite lower demand for tanker services, as a major problem for the industry over the next several years.xviii In 2009 global tanker capacity increased by 7.6 million tons despite a 2.5 percent decline in global oil production.xix Unlike independent shipping companies, governments can afford to absorb financial losses year after year.
Separating commercial interests from security interests in assessing government
ownership of tankers is difficult. For instance, within China there is a long-running debate over how much of the country’s oil should be imported on Chinese owned and flagged vessels.xx xxi The expansion of the Chinese fleet seems to be driven by both concerns for energy security and a desire to support the Chinese shipbuilding industry. It is also likely that Chinese tanker companies and shipyards are using energy security arguments with policy makers in Beijing to advance their own commercial interests.xxii
(9) Conclusion
This analysis identifies a strong positive correlation between tanker ownership
and oil trade in non-OECD countries that does not exist in OECD countries. As more and more of the international oil trade involves non-OECD countries, tanker ownership will increasingly shift to outside the OECD. The high level of government ownership of tankers outside the OECD suggests that an increasing percentage of the international tanker fleet will be owned by governments.
This trend will only be a challenge to US energy security if it leads to a
concentration of tanker ownership. As the world’s largest importer of oil, the US benefits from the current high level of competition in the oil tanker market. The 2,500 largest oil tankers are owned by more than 350 different companies in 50 different countries. This diversity of ownership enhances US energy security by ensuring that no single shipping company can exert much influence on the tanker market. The tanker market is a rare example of near “perfect competition” that defines efficient markets, drives down prices, and generates innovation.xxiii
In many ways, the increase in government ownership suggested by this analysis
follows the broader trend of increased government ownership in the global oil and gas industry. For much of its history, the international tanker fleet has delivered oil from the developing countries that produce oil to the United State, Europe, and Japan where the oil

14
was consumed. That pattern has obviously changed with the rise of China, India, and other emerging markets. The oil trade is increasingly outside the OECD, where state-owned companies dominate the petroleum industry. State-owned oil companies produce half of the world’s oil and own one third of the world’s refining capacity. The fact that only 19 percent of the world’s tanker capacity is currently owned by governments indicates that this segment of the oil supply chain remains more open to private investment than other parts of the global oil industry.xxiv
15
APPENDIX
Statistical analysis of tanker ownership by country:
The data set for this analysis contains the 77 countries that were included in the Lloyds List database as having owned at least one large vessel (not necessarily a tanker) in at least one of the years of analysis. As before, ownership is defined in terms of the ultimate owner of the tanker, not the registered owner. Data on oil imports and exports for each country in each year were obtained from the Energy Information Administration. Annual data on GDP for each country are from the World Bank’s world development indicators. Unfortunately, eight countries had to be dropped from the analysis due to a lack of consistent data on oil imports, exports, or GDP. Those countries were the Aland Islands, Cayman Islands, Monaco, Myanmar, North Korea, St. Vincent, Taiwan, and Yugoslavia. The null hypothesis for the first set of regressions (tables 1 and 2) is that the relationship between tanker ownership and oil trade by tanker (imports and exports) is the same for OECD and non-OECD countries. The regressions below use cross-sectional data from 2000, 2004 and 2008 to test that hypothesis. Oil imports and exports are included as two separate variables in the regression along with a dummy variable for OECD membership. The variables of interest are the two interaction dummy variables Imports*OECD and Exports*OECD. If there is no different in the relationship between tanker ownership and oil trade for the two groups the coefficients for the two interaction variables will not be significant. Since many non-OECD countries are relatively wealthy, especially major oil exporters like Saudi Arabia and Kuwait, per capita income is included to control for the fact that richer countries might own more tanker tonnage. The base group in the analysis is non-OECD countries.

16
Table 1:
Cross sectional regressions for tanker ownership (tonnage) at the national level All Countries
Variable
OLS 2000
OLS 2004
OLS 2008
Oil Imports 4471***(3.68)
3146***(6.72)
3689***(7.42)
Oil Exports 1207***(7.44)
1248***(7.25)
1610***(6.11)
OECD 2030907(0.66)
2415473(0.73)
3723290(0.86)
Imports*OECD -2498(-1.89)*
-1043(-1.26)
-1927(-1.43)
Exports*OECD 2403(0.65)
2028(0.53)
4815(0.60)
PCGDP 69(1.06)
35.1(0.74)
43.6(0.84)
Constant -673669.6(-1.36)
-297203.8(-0.61)
-353254(-0.43)
R-squared 0.2582 0.2335 0.1813Observations 69 69 69t-scores in parentheses, robust standard errors bias correction n/(n-k)
We cannot reject the null hypothesis based on the results of table one: the relationships between oil trade and tanker ownership (the interaction terms) are not significantly different in OECD and non-OECD countries. The only exception is the interaction term for oil imports (imports*OECD) in 2000, which shows that OECD countries have a weaker relationship between oil trade and oil imports than non-OECD countries. But there are other important results in this regression. Oil imports and exports are strong predictors of tanker ownership, and there is not a significant difference in tanker ownership between OECD and non-OECD countries. But the predictive power of the regression is relatively weak based on the R2 of each regression. A potential problem is that there are a small number of countries that are outliers in the analysis. As shown in figure 9, Greece, Japan, and Norway are the three largest tanker owning countries by far and have clearly specialized in tanker ownership. There are likely important country-specific effects that have led those countries to be major tanker owners that are not captured by this regression. Their exclusion changes the result substantially. Table 2 replicates the results of table one without Greece, Japan, and Norway.

17
Table 2:
Cross sectional regressions for tanker ownership (tonnage) at the national level Dropping three outliers (Greece, Norway, and Japan)
Variable
OLS 2000
OLS 2004
OLS 2008
Oil Imports 4435***(3.59)
3095***(6.78)
3569.4***(7.43)
Oil Exports 1205***(7.36)
1246.8***(7.21)
1641.2***(6.65)
OECD 167102.2(0.35)
287086(0.44)
1339203(1.18)
Imports*OECD -2627**(-2.08)
-1194.6**(-2.56)
-2259***(-4.36)
Exports*OECD -1521***(-3.09)
-1608.0***(-3.12)
-2219*(-1.86)
PCGDP 58.8**(2.69)
22.3(1.61)
15.9(1.04)
Constant -598051.3(-3.06)
-178204.9(-0.69)
43319.02(0.09)
R-squared 0.7615 0.6844 0.4401Observations 66 66 66t-scores in parentheses, robust standard errors bias correction n/(n-k)
When the three outliers are removed from the analysis, the overall fit of the regression improves substantially. Oil imports and exports are still strong predictors of tanker ownership in non-OECD countries (the base group). More importantly, the two variables of interest (the interaction variables) are significant across all years in table 2. We can therefore reject the null hypothesis that the relationship between tanker ownership and oil trade is the same for OECD and non-OECD countries. A country’s level of oil trade is much less of a factor in determining tanker ownership for OECD countries than for non-OECD countries. This is not a surprising result. Firms based in the advanced economies of the OECD will operate large ocean-going tankers wherever they will get the highest returns. These firms are unlikely to care how much oil their home country imports or exports, except as a business decision. They are maximizing profits, not the “energy security” of their home country. In the non-OECD, by contrast, most tankers are ultimately owned by governments which are more likely to be focused on ensuring adequate tanker capacity to meet their oil import and export requirements. Per capita GDP is significant for the year 2000, but not for 2004 or 2008. The importance of per capita GDP in determining tanker ownership appears to decline from 2000 to 2008. The negative intercept term (the intercept for non-OECD countries) does

18
not have much meaning because no countries have zero values for oil imports, exports, and GDP. Table 3 presents the results of a fixed-effects regression for OECD and non-OECD countries. The two groups are regressed separately because the change in the OECD status for each country is zero between 2000 and 2008. Fixed-effects models control for country-specific effects that are assumed to not change over time. For instance, Greece’s long maritime tradition is likely an important factor in it tanker ownership level, but it not captured in the previous set of regressions. This tradition is unlikely to have changed between 2000 and 2008, however, and is therefore cannot explain changes in Greek tanker ownership. The null hypothesis for each regression is that the change in tanker ownership is not correlated to the changes in oil imports and exports. An additional variable is added to the regression: CLC membership, which changed for many of the countries between 2000 and 2008. The expectation is that CLC membership will cause countries to reduce their level of tanker ownership in order to avoid increased liability for oil spills.
Table 3: Fixed effects regressions for changes in tanker ownership (tonnage)
2000, 2004, and 2008 Variable
Fixed Effects Non-OECD
Fixed Effects OECD
Oil Imports 3628***(4.64)
-4807(-1.25)
Oil Exports 1179*(1.73)
-5949**(-2.06)
PCGDP 17.3(0.83)
63.2*(1.77)
CLC status 531684(1.61)
-529901(-0.31)
Constant -361382(-0.75)
1.08e+07(2.72)
R-squared (within) 0.2867 0.2129Observations 126 81Groups 42 27 The results in table 3 provide further evidence that non-OECD countries increase their tanker ownership as oil imports and export increase, while OECD countries do not. In fact, there is a negative relationship between tanker ownership and oil exports for OECD countries, which is hard to explain and is likely related to the fact that very few OECD countries are major oil exporters - Norway and Mexico being the obvious exceptions. The results are much stronger for oil imports than for oil exports.

19
While this model controls for country fixed effects, there are almost certainly other important variables that are not captured in this regression. There are likely dozens of different reasons firms in a given country may choose to purchase or sell a tanker. A noted above, the increase in tanker ownership for German firms over the last decade is widely believed to be a product of new financial instruments in Germany that allow individuals and firms to invest in individual tankers. That type of institutional change is not captured in this model and is a potential area for future research. i UNCTAD Review of Maritime Transport 2010 p. 7-8. ii Figures provided by Erik Ranheim, Manager for Research and Projects, Intertanko. iii Source: Lloyds List Intelligence databases. iv Tusiani, Michael. The Petroleum Shipping Industry Vol. 1. 1996. P. 25. v Pirrong, Stephen. “Contracting Practices in Bulk Shipping Markets: A Transaction Costs Explanation.” The Journal of Law and Economics. Oct. 1993. vi IHS Fairplay database: sea-web.com. Tankers limited to those larger than 50k dead weight tons. vii Intertanko Tanker Facts 2007 - 2010. viii Richard R. W. Brooks, 1.Liability and Organizational Choice Journal of Law and Economics, Vol. 45, No. 1 (Apr., 2002), pp. 91-125 ix “USCG View 'Irresponsible'” Lloyds List. September 24, 1993 p. 3. x Transporting U.S. Oil Imports: The Impact of Oil Spill Legislation on the Tanker Market. Petroleum Industry Research Foundation Inc. June 1992, p. 63. xi “Pollution rules bring a 'flight to quality'” Lloyds List. December 14, 1992. p. 6. xii Kim, Inho. “OPA 90 and the Decision to Own or Charter Tank Vessels.” Journal of Maritime Law and Commerce. April 2004. xiii Platts Oilgram News, Total fined Eur192 million over Erika spill; Found guilty of 'imprudence' over tanker chartering. January 17, 2008. xiv Richard R. W. Brooks, 1.Liability and Organizational Choice Journal of Law and Economics, Vol. 45, No. 1 (Apr., 2002), pp. 91-125 xv Andrew Erickson, Gabe Collins, Beijing's Energy Security Strategy: The Significance of a Chinese State-Owned Tanker Fleet, Orbis, Volume 51, Issue 4, 2007, Pages 665-684 xvi Martin Stopford. Maritime Economics, Third ed. London: Routledge. Pages 306-307. xvii The statistics presented in this section refer only to tankers greater than 50 thousand dead weight tons. xviii “Intertanko Forecasts Sluggish Tanker Market.” Oil and Gas Journal. August 2, 2010. xix UNCTAD pg 24 xx “China seeks oil security with new tanker fleet.” Oil and Gas Journal. October 6, 2006 xxi “Oil Security at Sea” China Daily, June 14, 2007. xxii Andrew S. Erickson and Gabriel Collins, “Beijing’s Energy Security Strategy: The Significance of a Chinese State-Owned Tanker Fleet,” Orbis, Vol. 51, No. 4 (Fall 2007), pp. 665-84. xxiii Stopford, Martin. “Maritime Economics.” 2009. Routledge. p. 135 xxiv “The Role of National Oil Companies in the International Oil Market.” Congressional Research Service. 2007 p. 6