Institute for 21st Century Energy U.S. Chamber of Commerce Karen A. Harbert President and CEO...
26
Institute for 21st Century Energy U.S. Chamber of Commerce Karen A. Harbert President and CEO Institute for 21st Century Energy U.S. Chamber of Commerce
-
Upload
mercy-anderson -
Category
Documents
-
view
217 -
download
0
Transcript of Institute for 21st Century Energy U.S. Chamber of Commerce Karen A. Harbert President and CEO...

Institute for 21st Century Energy
U.S. Chamber of CommerceKaren A. HarbertPresident and CEO
Institute for 21st Century EnergyU.S. Chamber of Commerce
U. S. C h a m b e r o f C o m m e r c e
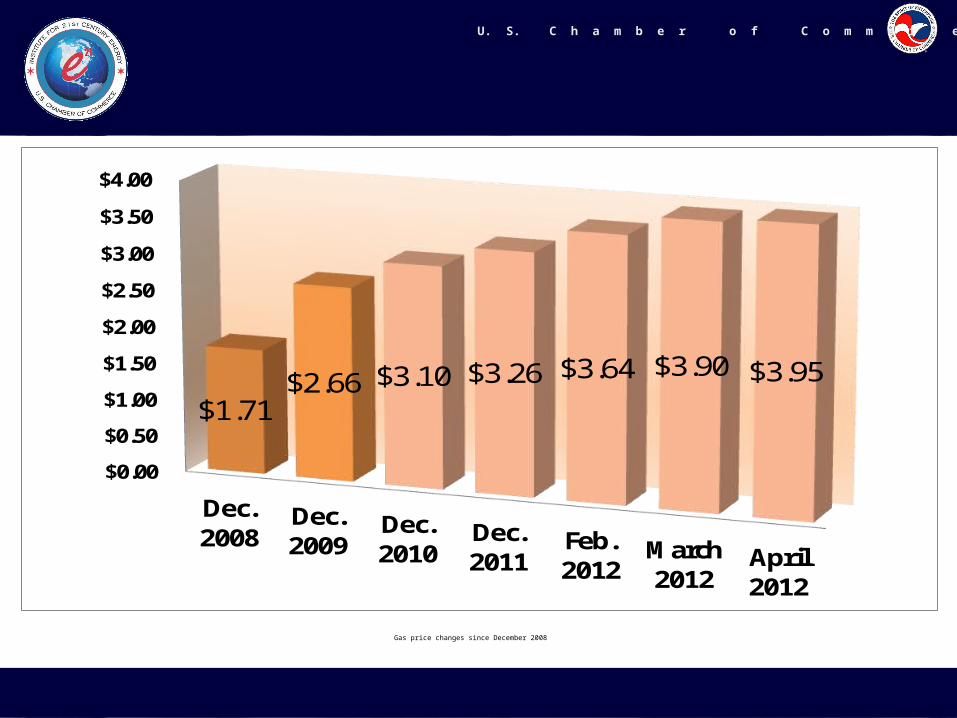
$0.00
$0.50
$1.00
$1.50
$2.00
$2.50
$3.00
$3.50
$4.00
Dec. 2008
Dec. 2009
Dec. 2010
Dec. 2011
Feb. 2012
March 2012
April 2012
$1.71$2.66 $3.10 $3.26 $3.64 $3.90 $3.95
Gas price changes since December 2008

U. S. C h a m b e r o f C o m m e r c e
The New Energy RealityEnergy Security is central to our national and economic security
Demand to increase 53% by 2035 90% in non-OECD countriesElectricity demand to increase 76%1.6 billion people without electricity$38 trillion of new investment by 2035 to meet rising demand 90% world’s oil reserves owned by national oil companies

U. S. C h a m b e r o f C o m m e r c e An Inconvenient Energy Truth

U. S. C h a m b e r o f C o m m e r c e
0
20
40
60
80
100
120
1990 2000 2010 2020 2030
mb/
dNatural gas liquids
Non-conventional oil
Crude oil - yet to be developed (inc. EOR) or found
Crude oil - currently producing fields
World oil production by World oil production by sourcesource
64 mb/d of gross capacity needs to be installed between 2007 & 2030 – six times the current capacity of Saudi Arabia – to meet demand growth & offset decline
Source: IEA 2008

U. S. C h a m b e r o f C o m m e r c e
Future U.S. Energy Demand
EIA AEO 2012
US Energy Demand INCREASES 20%

U. S. C h a m b e r o f C o m m e r c e
What’s happening in the What’s happening in the U.S.? U.S.? Future of expanded oil exploration?Impact of new natural gas findsNuclear Renaissance?New coal fired power plants stalledProspects for renewablesPeople powerBANANA Syndrome
UNPREDICTABLE INVESTMENT ENVIRONMENT

U. S. C h a m b e r o f C o m m e r c e

U. S. C h a m b e r o f C o m m e r c e


U. S. C h a m b e r o f C o m m e r c e
Fueling Our Economy
By 2030, U.S. oil and natural gas policy changes could generate more than:•1.4 million new jobs; •$800 billion in additional
government revenue;•and 10 million barrels worth of added
daily oil and natural gas production
(Woods MacKenzie September 7, 2011 U.S. Supply Forecast and Potential Jobs and Economic Impacts 2012-2030)

U. S. C h a m b e r o f C o m m e r c e
Fueling Our Economy
Shale plays are on pace to create
+200,000 jobs in OH by 2020 +115,000 jobs in PA by 2020
(140,000 existing) +100,000 jobs in TX, LA, and MS


U. S. C h a m b e r o f C o m m e r c e
$0
$4
$8
$12
$16
$20
U.S. Europe Middle India Australia Japan East
Natural Gas Futures Prices
$/million BTUs
Source: WSJ
$2.30
$11.40
$13.30$14.40 $14.50
$15.90

U. S. C h a m b e r o f C o m m e r c e
Keystone XL Pipeline proposal

U. S. C h a m b e r o f C o m m e r c e
Canadian Oil Sands Benefits
• Currently supports 80,000 U.S. jobs• Could increase to 94,000 - 600,000 U.S. jobs by 2035• Keystone XL pipeline could create 20,000 US
manufacturing jobs immediately and 250,000 by 2035
• The projected impact to U.S. GDP would be between $200 billion - $800 billion;
(Canadian Energy Research Institute June 2011 Economic Impacts of Staged Development of Oil Sands Projects in Alberta 2010 – 2035)

U. S. C h a m b e r o f C o m m e r c e
New Capacity Investments

U. S. C h a m b e r o f C o m m e r c e
US Nuclear Opportunities

U. S. C h a m b e r o f C o m m e r c e
Coal on the Rise

Rulemakings On The Runway!

U. S. C h a m b e r o f C o m m e r c e

U. S. C h a m b e r o f C o m m e r c e
-10%
0%
10%
20%
30%
40%
2007 2008 2009 2010 2011 2012
Oil and Gas Extraction Total Nonfarm Payroll
+35%
-3.2%
Percentage Change in Employment Since January 2007Oil and Gas Extraction vs. Total Nonfarm Payroll
Source: BLS
JOBS, JOBS, JOBS

U. S. C h a m b e r o f C o m m e r c e
Where’s public opinion?

U. S. C h a m b e r o f C o m m e r c e
U.S. Strategy-More Realism
““NO SILVER BULLET APPROACH”NO SILVER BULLET APPROACH”Maximize Efficiency
Increase domestic oil and gasRecognize role for nuclear and clean coalNew alternative transportation fuels Sustainable policy on renewablesModernize our infrastructure Exert authority to get beyond NOPE syndromeInvest in our technology solutions and our intellectual foundation for innovationAchievable Climate Approach

U. S. C h a m b e r o f C o m m e r c e
Time to TAKE ACTION
AT RISK: America’s national security, investment climate
and competitiveness
ENERGYXXI.ORG