Installation of two AWS on Larsen C Ice Shelf, Antarctica
13
Installation of two AWS on Larsen C Ice Shelf, Antarctica 7-28 January 2009 Michiel van den Broeke and Wim Boot Field Report Utrecht University Institute for Marine and Atmospheric Research Utrecht (IMAU)
Transcript of Installation of two AWS on Larsen C Ice Shelf, Antarctica

Installation of two AWS on Larsen C Ice Shelf, Antarctica
7-28 January 2009
Michiel van den Broeke and Wim Boot
Field Report
Utrecht University
Institute for Marine and Atmospheric Research Utrecht (IMAU)
! 2!
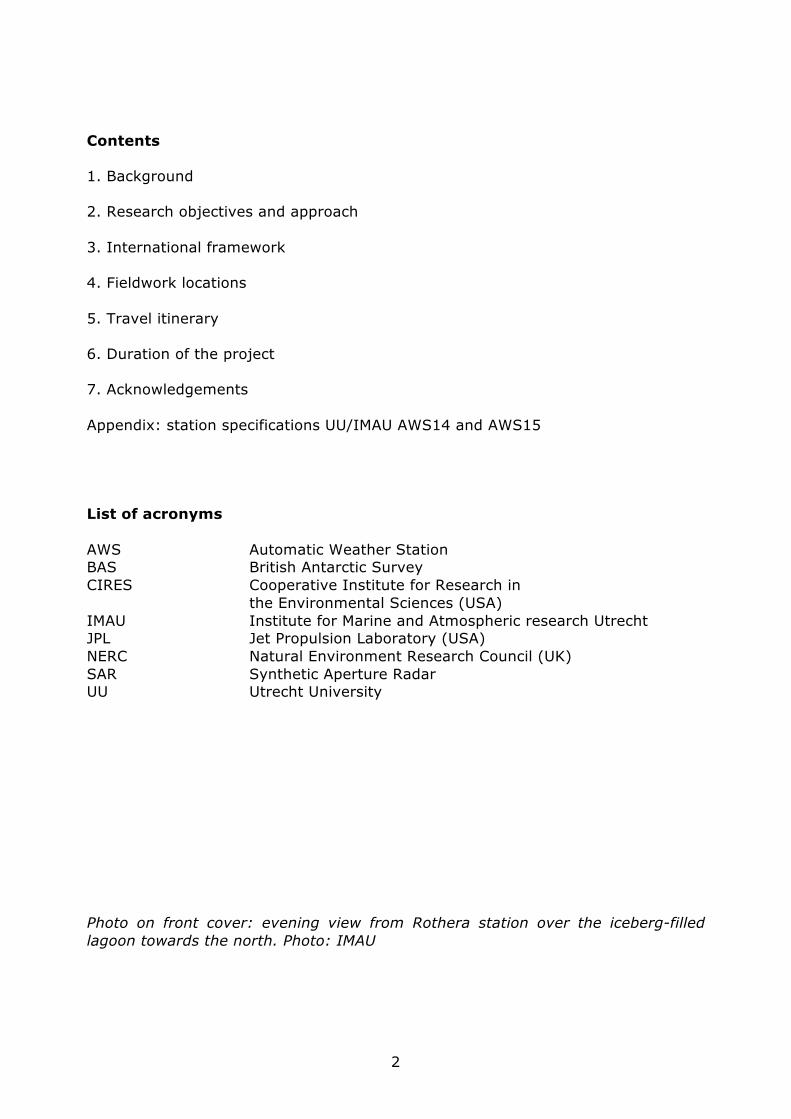
Contents
1. Background
2. Research objectives and approach
3. International framework
4. Fieldwork locations
5. Travel itinerary
6. Duration of the project
7. Acknowledgements
Appendix: station specifications UU/IMAU AWS14 and AWS15
List of acronyms
AWS Automatic Weather Station
BAS British Antarctic Survey
CIRES Cooperative Institute for Research in
the Environmental Sciences (USA)
IMAU Institute for Marine and Atmospheric research Utrecht
JPL Jet Propulsion Laboratory (USA)
NERC Natural Environment Research Council (UK)
SAR Synthetic Aperture Radar
UU Utrecht University
Photo on front cover: evening view from Rothera station over the iceberg-filled
lagoon towards the north. Photo: IMAU
! 3!
1. Background
For the cold Antarctic ice sheet, surface melt has long been considered of limited
importance. This changed with the recent discoveries that surface melt occurs up
to 2000 m elevation in West Antarctica, and that melt determines the viability of
ice shelves. Ice shelves, the 200-1000 m thick floating extensions of the ice sheet,
are situated at sea level where sustained surface melt may occur during summer
(Fig. 1). The leading hypothesis that links ice shelf viability to ambient temperature
identifies surface melt as a key process: pressure from infilling meltwater extends
fractures in the ice shelf downward, and a 90% filling of crevasses is sufficient to
completely penetrate the ice shelf. The geographical co-location of areas with
meltwater ponds (dark streaks in left panel of Fig. 2) and the final area of
disintegration provide support for the melt pond theory. Moreover, meltwater
ponds appear to drain into the ocean just prior to break-up, indicative of crevasses
that run through the entire ice shelf. If an ice shelf retreats past the stable ice front
position, further retreat occurs in a catastrophic fashion through the capsizing of
vertical ice shelf fragments (Fig. 2 right panel). Ocean warming and enhanced
basal melt have likely thinned the ice shelves prior to break-up.
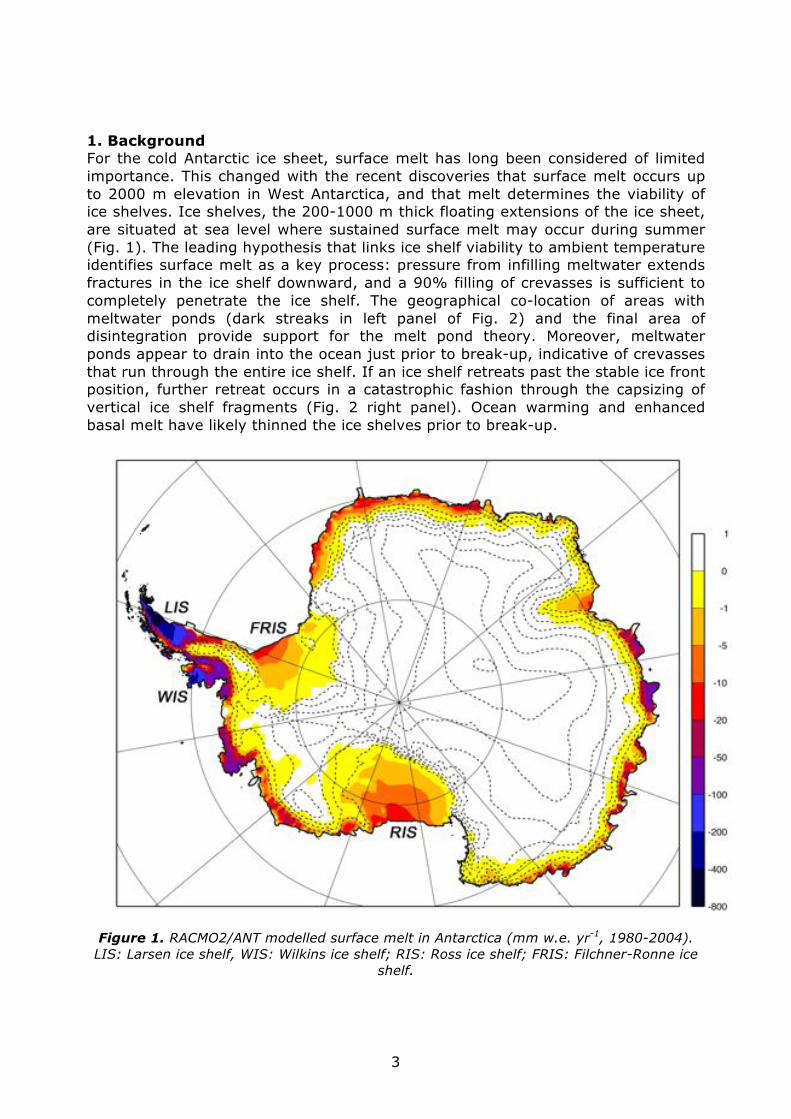
Figure 1. RACMO2/ANT modelled surface melt in Antarctica (mm w.e. yr-1, 1980-2004).
LIS: Larsen ice shelf, WIS: Wilkins ice shelf; RIS: Ross ice shelf; FRIS: Filchner-Ronne ice
shelf.
! 4!
According to Fig. 1, all ice shelves fringing the Antarctic coast experience some
melt. It has been shown that the present-day -9 °C annual isotherm represents an
approximate limit for Antarctic ice shelf viability. A 2 °C warming in the Antarctic
Peninsula (AP) since 1979 has increased summer melting intensity and forced the
limit of ice shelf viability southward by several latitudinal degrees. This was
followed by a rapid retreat of the northernmost AP ice shelves, punctuated by the
catastrophic collapse of the Larsen A ice shelf in January 1995. In February 1998,
the front of the more southerly Larsen B ice shelf retreated behind its stable
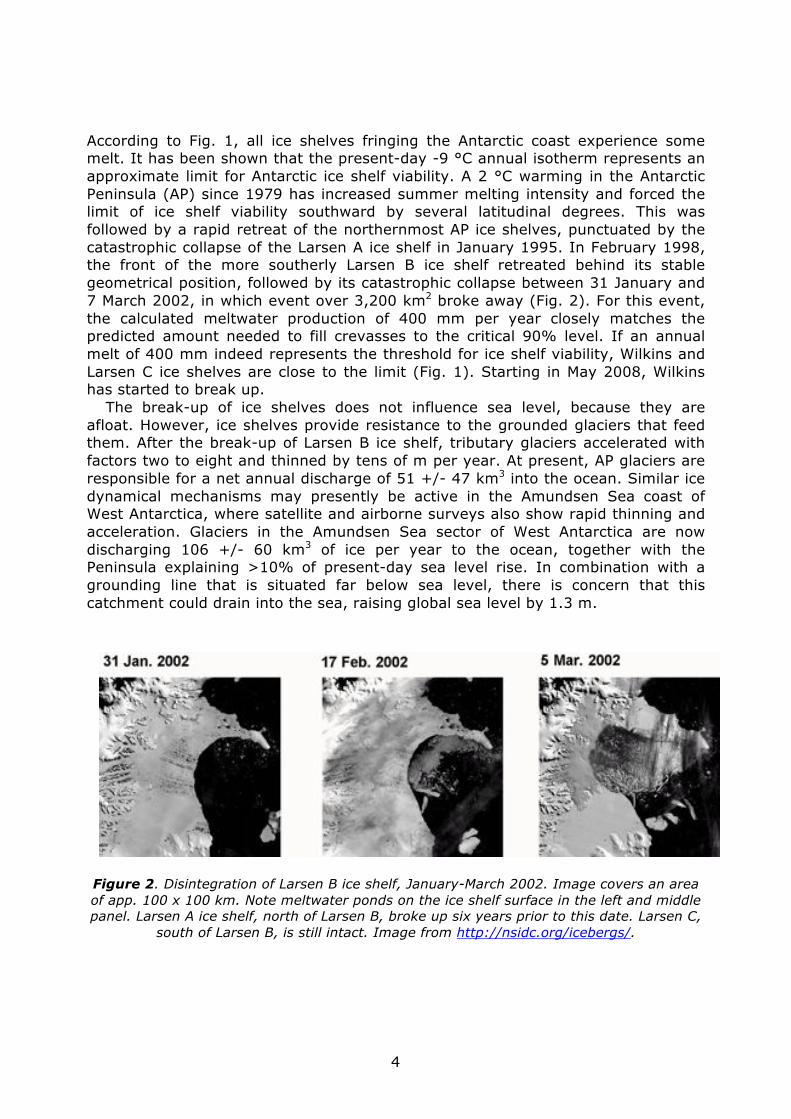
geometrical position, followed by its catastrophic collapse between 31 January and
7 March 2002, in which event over 3,200 km2 broke away (Fig. 2). For this event,
the calculated meltwater production of 400 mm per year closely matches the
predicted amount needed to fill crevasses to the critical 90% level. If an annual
melt of 400 mm indeed represents the threshold for ice shelf viability, Wilkins and
Larsen C ice shelves are close to the limit (Fig. 1). Starting in May 2008, Wilkins
has started to break up.
The break-up of ice shelves does not influence sea level, because they are
afloat. However, ice shelves provide resistance to the grounded glaciers that feed
them. After the break-up of Larsen B ice shelf, tributary glaciers accelerated with
factors two to eight and thinned by tens of m per year. At present, AP glaciers are
responsible for a net annual discharge of 51 +/- 47 km3 into the ocean. Similar ice
dynamical mechanisms may presently be active in the Amundsen Sea coast of
West Antarctica, where satellite and airborne surveys also show rapid thinning and
acceleration. Glaciers in the Amundsen Sea sector of West Antarctica are now
discharging 106 +/- 60 km3 of ice per year to the ocean, together with the
Peninsula explaining >10% of present-day sea level rise. In combination with a
grounding line that is situated far below sea level, there is concern that this
catchment could drain into the sea, raising global sea level by 1.3 m.
Figure 2. Disintegration of Larsen B ice shelf, January-March 2002. Image covers an area
of app. 100 x 100 km. Note meltwater ponds on the ice shelf surface in the left and middle
panel. Larsen A ice shelf, north of Larsen B, broke up six years prior to this date. Larsen C,
south of Larsen B, is still intact. Image from http://nsidc.org/icebergs/.

! 5!
2. Research objectives and approach
It is clear that there is an urgent need to investigate melting in Antarctica in much
greater detail than has been done thus far. The main objective of this project is
therefore to quantify surface melting in Antarctica using a combined observational
and modelling approach. We want to answer four research questions:
1. How strong is melting on Larsen C ice shelf and what are the feedbacks
(albedo)?
2. What is the spatial and temporal distribution of melting in Antarctica?
3. How do these results compare to satellite-detected melting in Antarctica?
4. How does large-scale circulation variability affect melting in Antarctica?
Figure 3. Fieldwork locations; Background: SAR image of Larsen C ice shelf (Image:
Konrad Steffen, CIRES).
! 6!
Answering research question 1 involves initiating glacio-meteorological
measurements on Larsen C ice shelf. To that end, UU/IMAU has built two dedicated
automatic weather stations (AWS), equipped with sensors to measure the full
surface energy balance (wind speed, temperature, relative humidity, shortwave
and longwave downward and upward radiation and air pressure and snow
temperatures). These AWS will provide the necessary data on the local timing and
intensity of melt on Larsen C ice shelf as well as to quantify feedbacks through
melt-related darkening of the surface (albedo). The AWS were installed on Larsen
C ice shelf in January 2009, and these activities are described in this report. The
AWS are equipped with 15 m long thermistor strings to detect meltwater
penetration and refreezing in the firn. In addition, at one site an automatic digital
camera monitors the characteristics of the ice shelf surface during the daylight
period. A sonic height ranger has been fixed to the deeper snow/ice layers to
measure surface accumulation and ablation in order to validate the AWS-derived
melt flux. In addition to the meteorological measurements, low-cost stand-alone
GPS receivers have been installed for year-round monitoring of ice velocity. Data
from both AWS and GPS are relayed to Utrecht via ARGOS, depending on the data
volume.
3. International framework
This work is part of three collaborative Antarctic research projects:
Melting in Antarctica: a combined modelling and observational approach Funded by
NOW/ALW. PI: Michiel van den Broeke (UU/IMAU) postdoc: Peter Kuipers
Munneke. Collaborators: John King (British Antarctic Survey), Konrad Steffen
(CIRES, USA), Eric Rignot (University of Irvine and JPL, USA).
Long term monitoring of Antarctic climate using Automatic Weather Stations PI:
Michiel van den Broeke (UU/IMAU).
Stability of Larsen C ice shelf in a warming climate PI: Konrad Steffen (CIRES,
USA); Collaborators: Michiel van den Broeke (UU/IMAU), Eric Rignot (University of
Irvine, Jet Propulsion Laboratory, USA), Dr. Anja Wendt, Mrs. Francisca Brown, Dr.
Gino Casassa, Dr. Andres Rivera (Centro de Estudios Cientificos, Valdivia, Chile).
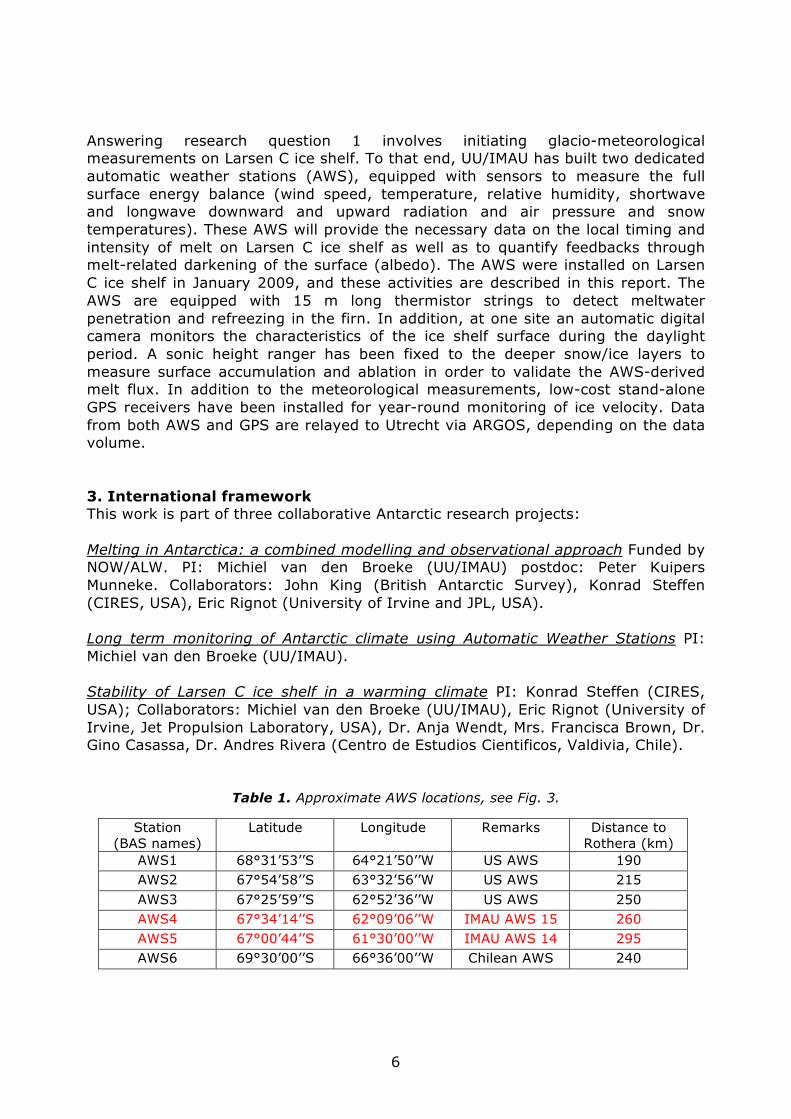
Table 1. Approximate AWS locations, see Fig. 3.
Station
(BAS names)
Latitude Longitude Remarks Distance to
Rothera (km)
AWS1 68°31’53’’S 64°21’50’’W US AWS 190
AWS2 67°54’58’’S 63°32’56’’W US AWS 215
AWS3 67°25’59’’S 62°52’36’’W US AWS 250
AWS4 67°34’14’’S 62°09’06’’W IMAU AWS 15 260
AWS5 67°00’44’’S 61°30’00’’W IMAU AWS 14 295
AWS6 69°30’00’’S 66°36’00’’W Chilean AWS 240

! 7!
4. Fieldwork locations
The two UU/IMAU AWS are part of a larger network of five AWS on the ice shelf.
The three other AWS were to be installed by the group of Konrad Steffen in
November 2008, but due to serious delays in the arrival of aircraft and equipment,
the AWS were installed by BAS personnel in December 2008 instead, after Steffen
had left Antarctica. Fig. 3 shows a map of the fieldwork area, including the location
of and flight lines from Rothera research station (UK). The UU/IMAU AWS are
located approximately 260 and 295 km distance from Rothera (see Fig. 3 and
Table 1). Both AWS sites are equipped with a GPS receiver that transmits the AWS
position to Utrecht via the ARGOS system every 6 days.
The activities described in this report coincide with enhanced research activity on
Larsen C ice shelf. In 2008/09, groups from Swansea University (UK, dr. Bernd
Kulessa), the University of Edinburgh (UK, dr. Andrew Shepherd) and CIRES (US,
dr. Konrad Steffen) were active on Larsen C ice shelf, supported by BAS personnel.
In 2009/2010, joint research flights between BAS and AWI will be conducted to
study cloud microphysical properties.
Figure 4. Embarking the British Antarctic Survey Dash-7 in Punta Arenas.

! 8!
A more extensive surface meteorological experiment will take place in 2010/11, for
which a proposal has recently been submitted to NERC, and on which Michiel van
den Broeke is a named collaborator (PI: John King, BAS). All these activities will be
coordinated so as to get optimal scientific output and data exchange.
Figure 5. View over Rothera research station towards the north.
5. Travel itinerary
Equipment was sent to BAS in Cambridge before the July 31, 2008 deadline, from
where it was shipped to Rothera research station. The original plan was for IMAU to
install the automatic weather stations (AWS) in November 2008. However, the
fieldwork was delayed at the latest moment because of problems with the
certification of the Twin Otter aircraft in the UK. It was decided to postpone the
fieldwork to January 2009. Fieldwork participants Michiel van den Broeke and Wim
Boot travelled to Rothera via Madrid, Santiago de Chili, Punta Arenas (Chili).
Wednesday January 7, 2009 15h LT: Expedition members Boot and Van den
Broeke leave for Santiago de Chili, via Madrid. Overnight in aircraft.
! 9!
Thursday January 8, 2009 14h LT: Expedition members Boot and Van den Broeke
leave for Punta Arenas. Overnight in Punta Arenas.
Friday January 9, 2009 10h LT: Expedition members Boot and Van den Broeke
leave for Rothera in British Antarctic Survey Dash-7, arrival 14h. Tour of the
station by station manager John Withers. Evening: collection and preparation of
equipment. Overnight at Rothera.
Saturday January 10, 2009 Safety and health instructions. Vehicle and
snowscooter instructions. Medical instructions, communications instructions. Walk
around Rothera Point. In the evening: preparation of equipment. Overnight at
Rothera.
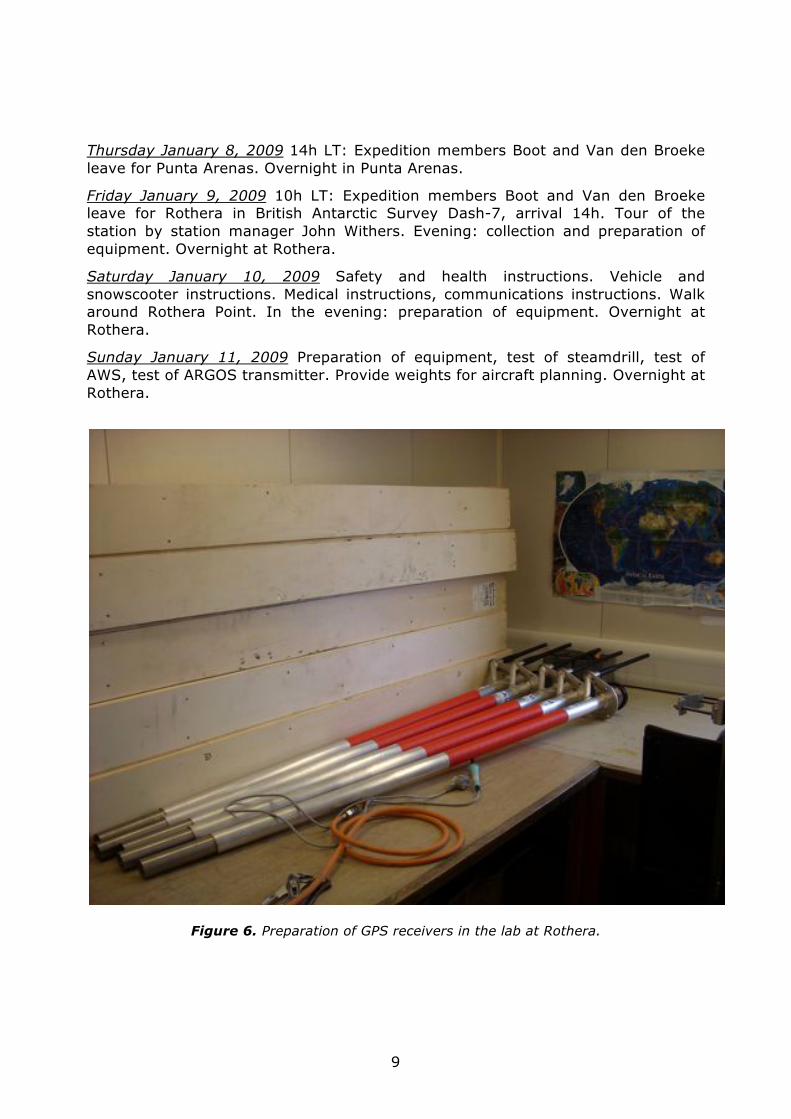
Sunday January 11, 2009 Preparation of equipment, test of steamdrill, test of
AWS, test of ARGOS transmitter. Provide weights for aircraft planning. Overnight at
Rothera.
Figure 6. Preparation of GPS receivers in the lab at Rothera.
! 10!
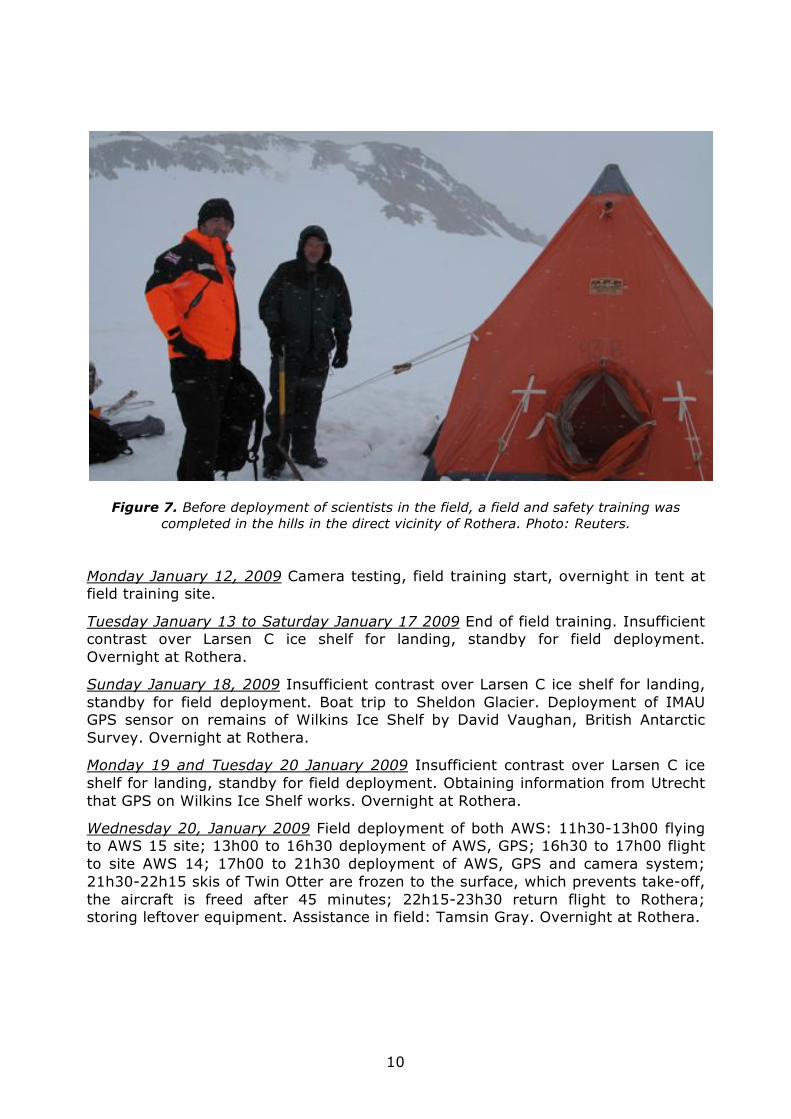
Figure 7. Before deployment of scientists in the field, a field and safety training was
completed in the hills in the direct vicinity of Rothera. Photo: Reuters.
Monday January 12, 2009 Camera testing, field training start, overnight in tent at
field training site.
Tuesday January 13 to Saturday January 17 2009 End of field training. Insufficient
contrast over Larsen C ice shelf for landing, standby for field deployment.
Overnight at Rothera.
Sunday January 18, 2009 Insufficient contrast over Larsen C ice shelf for landing,
standby for field deployment. Boat trip to Sheldon Glacier. Deployment of IMAU
GPS sensor on remains of Wilkins Ice Shelf by David Vaughan, British Antarctic
Survey. Overnight at Rothera.
Monday 19 and Tuesday 20 January 2009 Insufficient contrast over Larsen C ice
shelf for landing, standby for field deployment. Obtaining information from Utrecht
that GPS on Wilkins Ice Shelf works. Overnight at Rothera.
Wednesday 20, January 2009 Field deployment of both AWS: 11h30-13h00 flying
to AWS 15 site; 13h00 to 16h30 deployment of AWS, GPS; 16h30 to 17h00 flight
to site AWS 14; 17h00 to 21h30 deployment of AWS, GPS and camera system;
21h30-22h15 skis of Twin Otter are frozen to the surface, which prevents take-off,
the aircraft is freed after 45 minutes; 22h15-23h30 return flight to Rothera;
storing leftover equipment. Assistance in field: Tamsin Gray. Overnight at Rothera.
! 11!
Thursday 21 January 2009 Repacking of leftover equipment for sending to Utrecht.
Obtaining information from Utrecht that AWS and GPS work.
Friday 22 January 2009 Clean-up activities, preparation for departure. Van den
Broeke is interviewed by Reuters journalists about use of AWS and collaboration
between UU/IMAU and BAS. Boot supports Italian researchers by performing
reparation on their permafrost monitoring equipment.
Saturday 22 January and Sunday 23 January 2009 Waiting for departure. Gould
party. Overnights at Rothera.
Monday 24 January Travel from Rothera to Punta Arenas with BAS Dash-7.
Overnight in Punta Arenas.
Tuesday 25 January and Wednesday 26 January 2009 Travel Punta Arenas to
Amsterdam via Santiago de Chili and Madrid. Overnight in plane. Arrival
Amsterdam 18h.
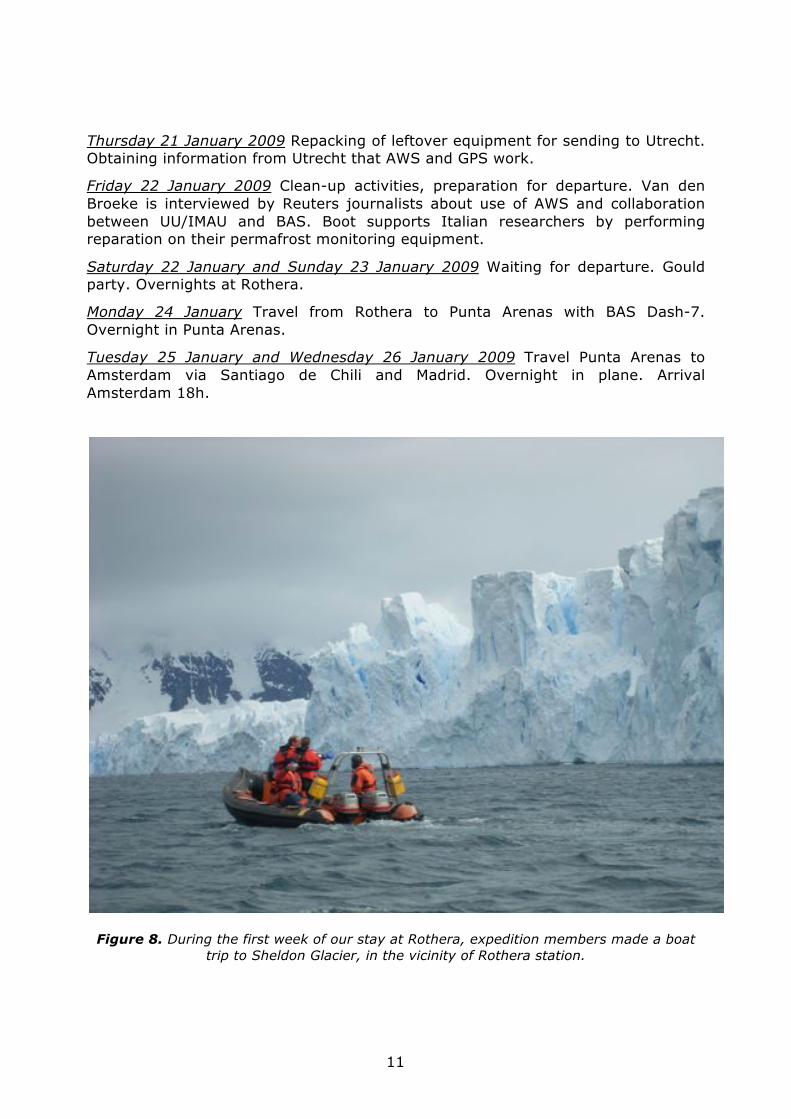
Figure 8. During the first week of our stay at Rothera, expedition members made a boat
trip to Sheldon Glacier, in the vicinity of Rothera station.

! 12!
6. Future of the project
AWS data become scientifically more valuable if the time series are long (> 5 yr).
That is why UU/IMAU has signed a Memorandum of Understanding with BAS that
ensures that the AWS will be serviced by BAS personnel in the next five years, with
the possibility to extend. If problems occur, there is also the possibility to send
IMAU personnel to Rothera, for more substantial revisions. The data of the AWS
can be viewed online at:
www.phys.uu.nl/~wwwimau/research/ice_climate/aws/antarctica_data.html
7. Acknowledgments
We would like to warmly thank all British Antarctic Survey staff for the excellent
support and facilities offered, both in the UK and in Antarctica, which made our
stay at Rothera very enjoyable. Without their help this work could not have been
completed.
Figure 9. The completed AWS15 on Larsen C ice shelf, next to the BAS Twin Otter. Right of
the AWS a stand-alone height sensor is installed as well as a stand-alone GPS receiver
(with red tape for enhanced visibility), with ARGOS antenna.
! 13!
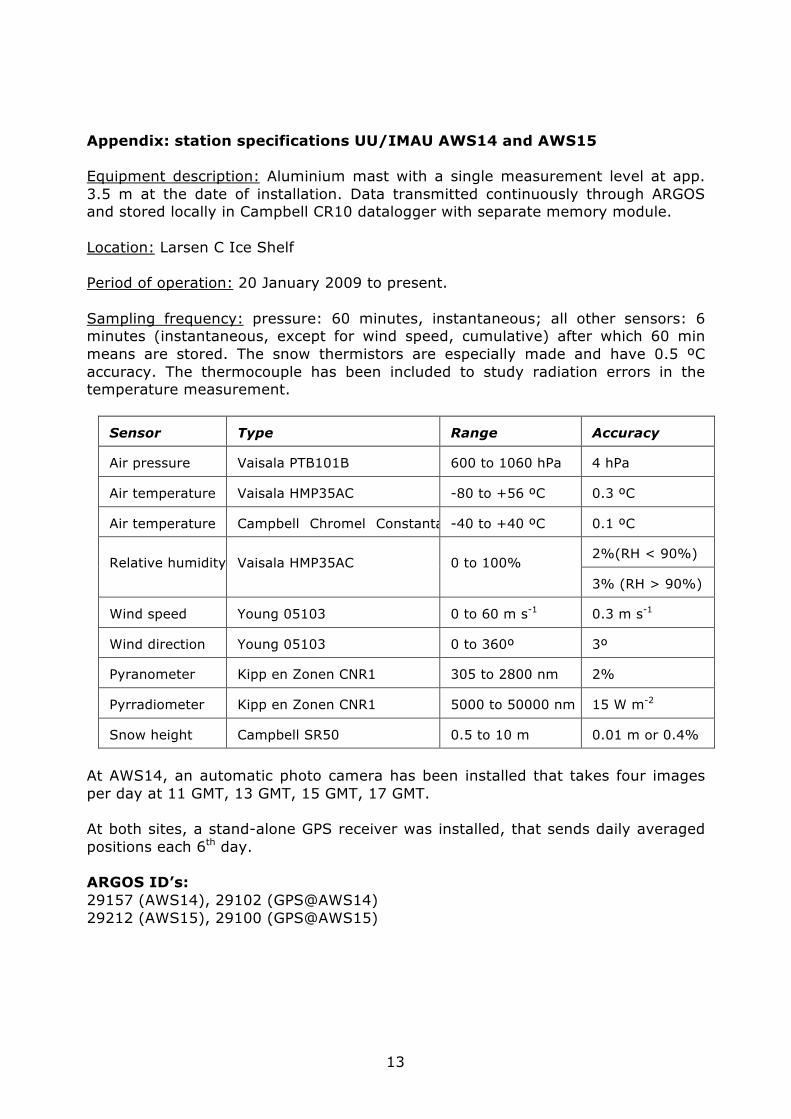
Appendix: station specifications UU/IMAU AWS14 and AWS15
Equipment description: Aluminium mast with a single measurement level at app.
3.5 m at the date of installation. Data transmitted continuously through ARGOS
and stored locally in Campbell CR10 datalogger with separate memory module.
Location: Larsen C Ice Shelf
Period of operation: 20 January 2009 to present.
Sampling frequency: pressure: 60 minutes, instantaneous; all other sensors: 6
minutes (instantaneous, except for wind speed, cumulative) after which 60 min
means are stored. The snow thermistors are especially made and have 0.5 ºC
accuracy. The thermocouple has been included to study radiation errors in the
temperature measurement.
Sensor Type Range Accuracy
Air pressure Vaisala PTB101B 600 to 1060 hPa 4 hPa
Air temperature Vaisala HMP35AC -80 to +56 ºC 0.3 ºC
Air temperature Campbell Chromel Constantan
75µ
-40 to +40 ºC 0.1 ºC
2%(RH < 90%) Relative humidity Vaisala HMP35AC 0 to 100%
3% (RH > 90%)
Wind speed Young 05103 0 to 60 m s-1 0.3 m s-1
Wind direction Young 05103 0 to 360º 3º
Pyranometer Kipp en Zonen CNR1 305 to 2800 nm 2%
Pyrradiometer Kipp en Zonen CNR1 5000 to 50000 nm 15 W m-2
Snow height Campbell SR50 0.5 to 10 m 0.01 m or 0.4%
At AWS14, an automatic photo camera has been installed that takes four images
per day at 11 GMT, 13 GMT, 15 GMT, 17 GMT.
At both sites, a stand-alone GPS receiver was installed, that sends daily averaged
positions each 6th day.
ARGOS ID’s:
29157 (AWS14), 29102 (GPS@AWS14)
29212 (AWS15), 29100 (GPS@AWS15)


![Coastal-Change and Glaciological Map of the Larsen Ice Shelf … · 2009. 2. 19. · Larsen Ice Shelf ... and Palmer Land area (map I–2600–C)], was able to utilize the abundance](https://static.fdocuments.in/doc/165x107/60bab4d79050577b4507ab97/coastal-change-and-glaciological-map-of-the-larsen-ice-shelf-2009-2-19-larsen.jpg)