Installation instructions for MARS AniMAp v0 - TU Wien · the system expect 30 seconds loading...
11
1 Installation instructions for MARS – ANIMAP File name: Installation instructions for MARS_v0.doc Date: Thursday, December 13, 2007 Author: Guenter Emberger, Institut for Transport Planning and Traffic Engineering, Vienna University of Technology Table of Contents 1 System requirements ...................................................................................................................... 2 2 Installation steps ............................................................................................................................. 2 3 How to use MARS – AniMap ........................................................................................................... 2 3.1 What is MARS .......................................................................................................................... 2 3.2 Using MARS‐FS ........................................................................................................................ 3 3.3 Read the help text ................................................................................................................... 4 3.4 Review Model structure .......................................................................................................... 4 3.5 Simulate the model ................................................................................................................. 6 4 AniMap .......................................................................................................................................... 10
Transcript of Installation instructions for MARS AniMAp v0 - TU Wien · the system expect 30 seconds loading...
1
Installation instructions for MARS – ANIMAP
File name: Installation instructions for MARS_v0.doc
Date: Thursday, December 13, 2007
Author: Guenter Emberger, Institut for Transport Planning and Traffic Engineering, Vienna University of Technology
Table of Contents
1 System requirements ...................................................................................................................... 2
2 Installation steps ............................................................................................................................. 2
3 How to use MARS – AniMap ........................................................................................................... 2
3.1 What is MARS .......................................................................................................................... 2
3.2 Using MARS‐FS ........................................................................................................................ 3
3.3 Read the help text ................................................................................................................... 4
3.4 Review Model structure .......................................................................................................... 4
3.5 Simulate the model ................................................................................................................. 6
4 AniMap .......................................................................................................................................... 10
2
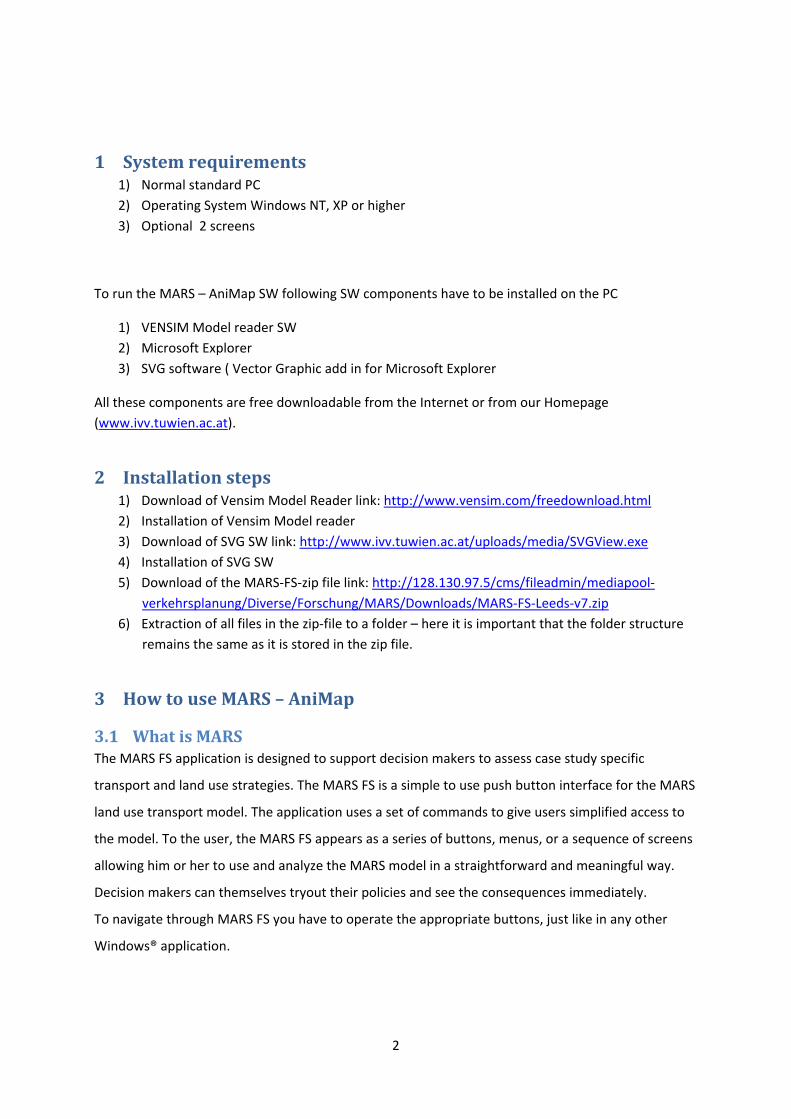
1 System requirements 1) Normal standard PC 2) Operating System Windows NT, XP or higher 3) Optional 2 screens
To run the MARS – AniMap SW following SW components have to be installed on the PC
1) VENSIM Model reader SW 2) Microsoft Explorer 3) SVG software ( Vector Graphic add in for Microsoft Explorer
All these components are free downloadable from the Internet or from our Homepage (www.ivv.tuwien.ac.at).
2 Installation steps 1) Download of Vensim Model Reader link: http://www.vensim.com/freedownload.html 2) Installation of Vensim Model reader 3) Download of SVG SW link: http://www.ivv.tuwien.ac.at/uploads/media/SVGView.exe 4) Installation of SVG SW 5) Download of the MARS‐FS‐zip file link: http://128.130.97.5/cms/fileadmin/mediapool‐
verkehrsplanung/Diverse/Forschung/MARS/Downloads/MARS‐FS‐Leeds‐v7.zip 6) Extraction of all files in the zip‐file to a folder – here it is important that the folder structure
remains the same as it is stored in the zip file.
3 How to use MARS – AniMap
3.1 What is MARS The MARS FS application is designed to support decision makers to assess case study specific
transport and land use strategies. The MARS FS is a simple to use push button interface for the MARS
land use transport model. The application uses a set of commands to give users simplified access to
the model. To the user, the MARS FS appears as a series of buttons, menus, or a sequence of screens
allowing him or her to use and analyze the MARS model in a straightforward and meaningful way.
Decision makers can themselves tryout their policies and see the consequences immediately.
To navigate through MARS FS you have to operate the appropriate buttons, just like in any other
Windows® application.
3
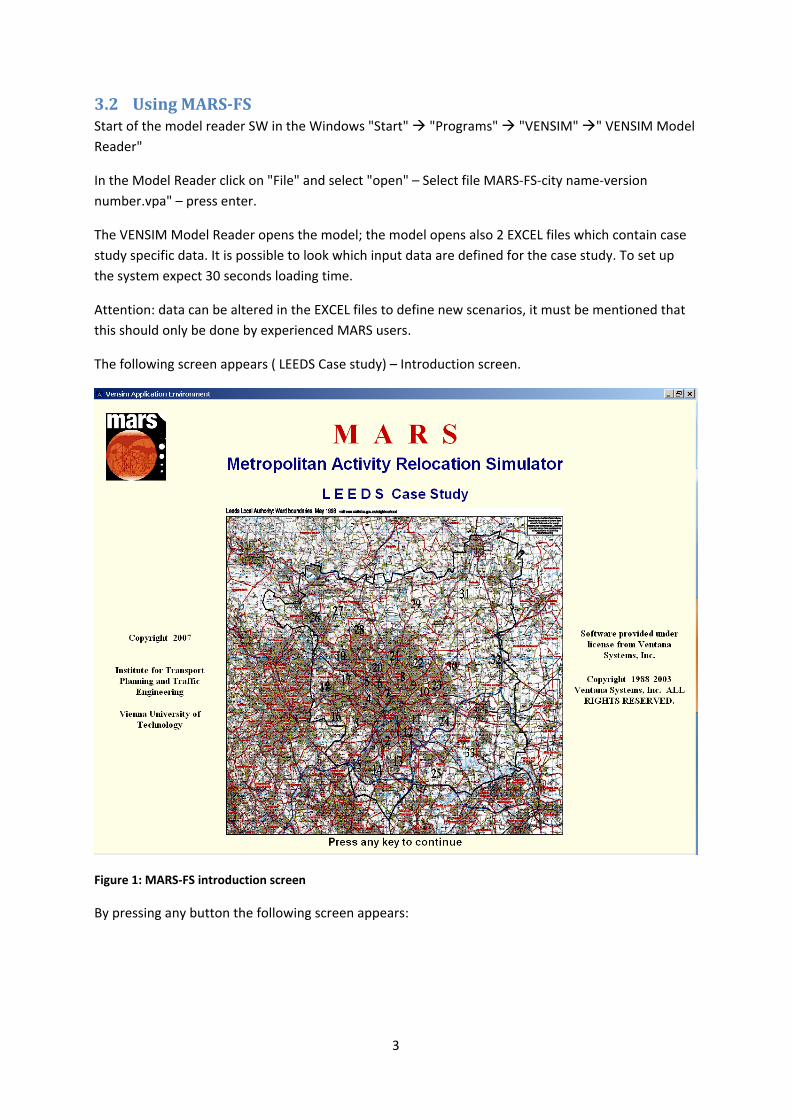
3.2 Using MARSFS Start of the model reader SW in the Windows "Start" "Programs" "VENSIM" " VENSIM Model Reader"
In the Model Reader click on "File" and select "open" – Select file MARS‐FS‐city name‐version number.vpa" – press enter.
The VENSIM Model Reader opens the model; the model opens also 2 EXCEL files which contain case study specific data. It is possible to look which input data are defined for the case study. To set up the system expect 30 seconds loading time.
Attention: data can be altered in the EXCEL files to define new scenarios, it must be mentioned that this should only be done by experienced MARS users.
The following screen appears ( LEEDS Case study) – Introduction screen.
Figure 1: MARS‐FS introduction screen
By pressing any button the following screen appears:
4
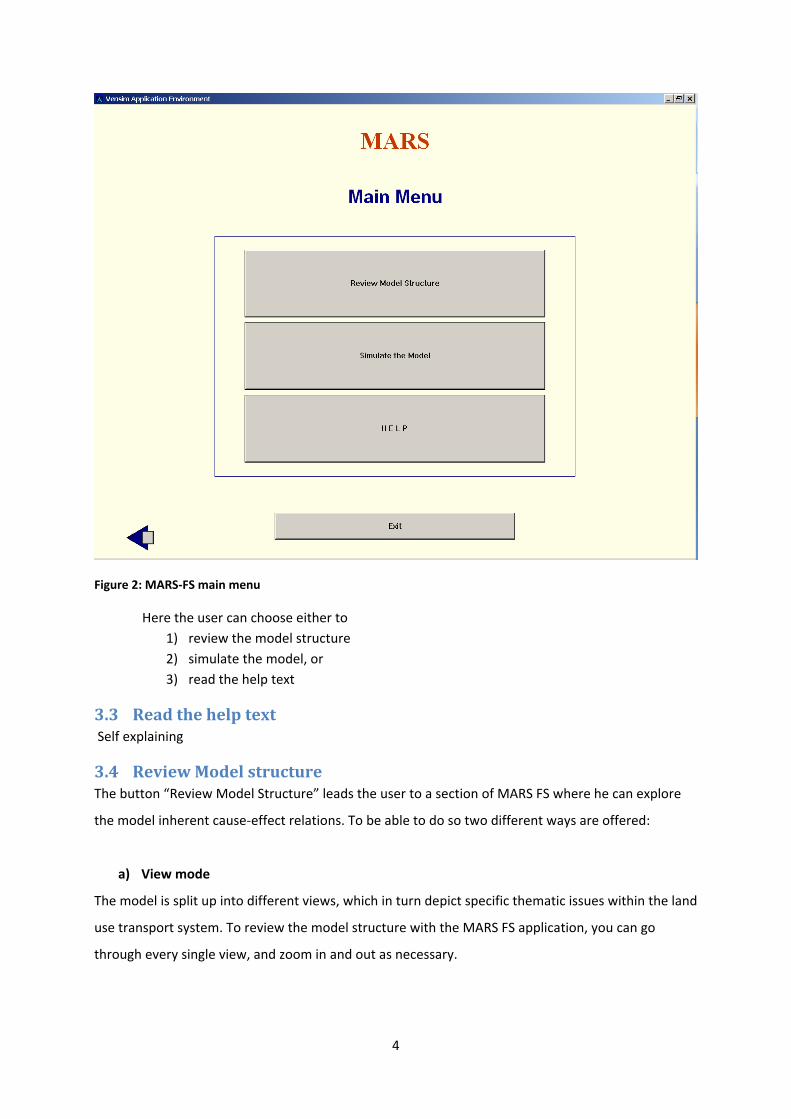
Figure 2: MARS‐FS main menu
Here the user can choose either to 1) review the model structure 2) simulate the model, or 3) read the help text
3.3 Read the help text Self explaining
3.4 Review Model structure The button “Review Model Structure” leads the user to a section of MARS FS where he can explore
the model inherent cause‐effect relations. To be able to do so two different ways are offered:
a) View mode
The model is split up into different views, which in turn depict specific thematic issues within the land
use transport system. To review the model structure with the MARS FS application, you can go
through every single view, and zoom in and out as necessary.
5
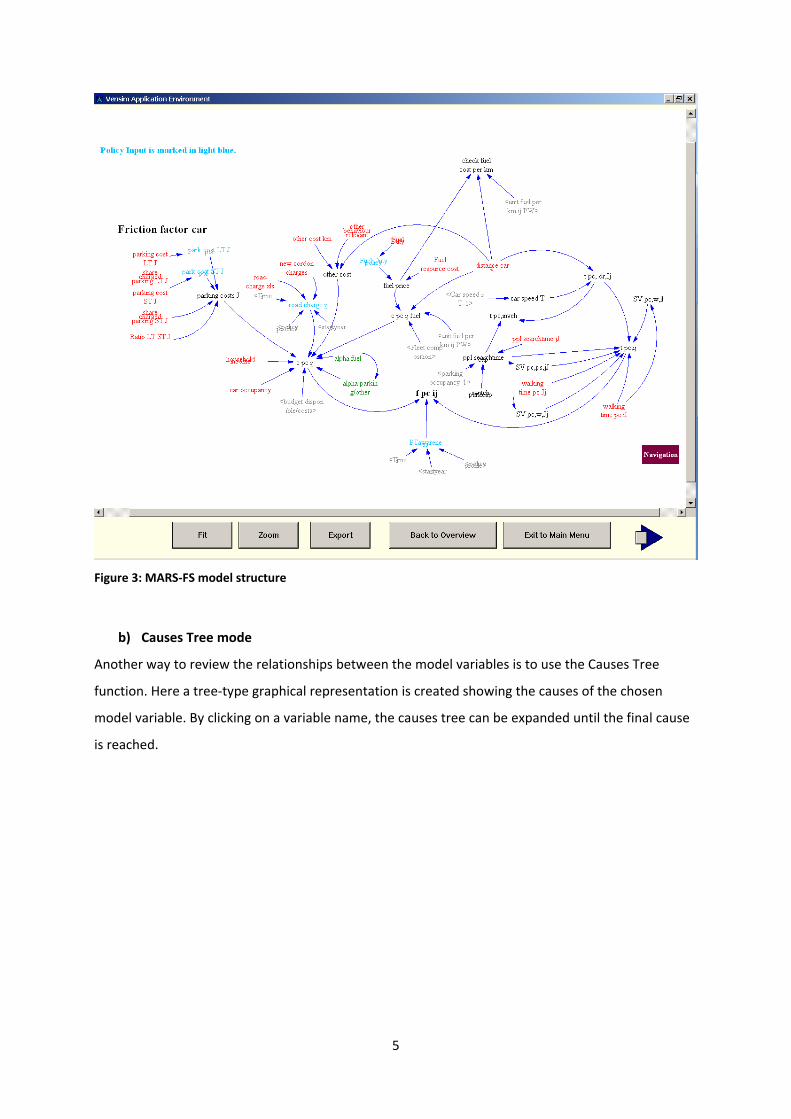
Figure 3: MARS‐FS model structure
b) Causes Tree mode
Another way to review the relationships between the model variables is to use the Causes Tree
function. Here a tree‐type graphical representation is created showing the causes of the chosen
model variable. By clicking on a variable name, the causes tree can be expanded until the final cause
is reached.
6
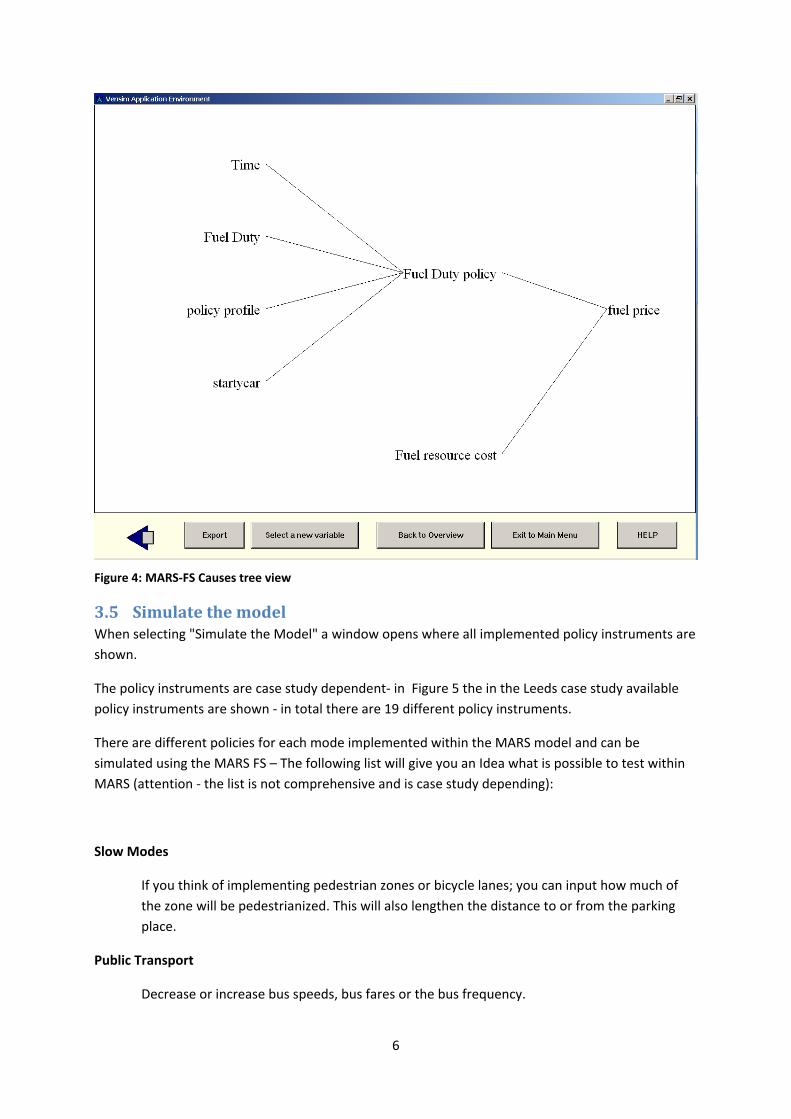
Figure 4: MARS‐FS Causes tree view
3.5 Simulate the model When selecting "Simulate the Model" a window opens where all implemented policy instruments are shown.
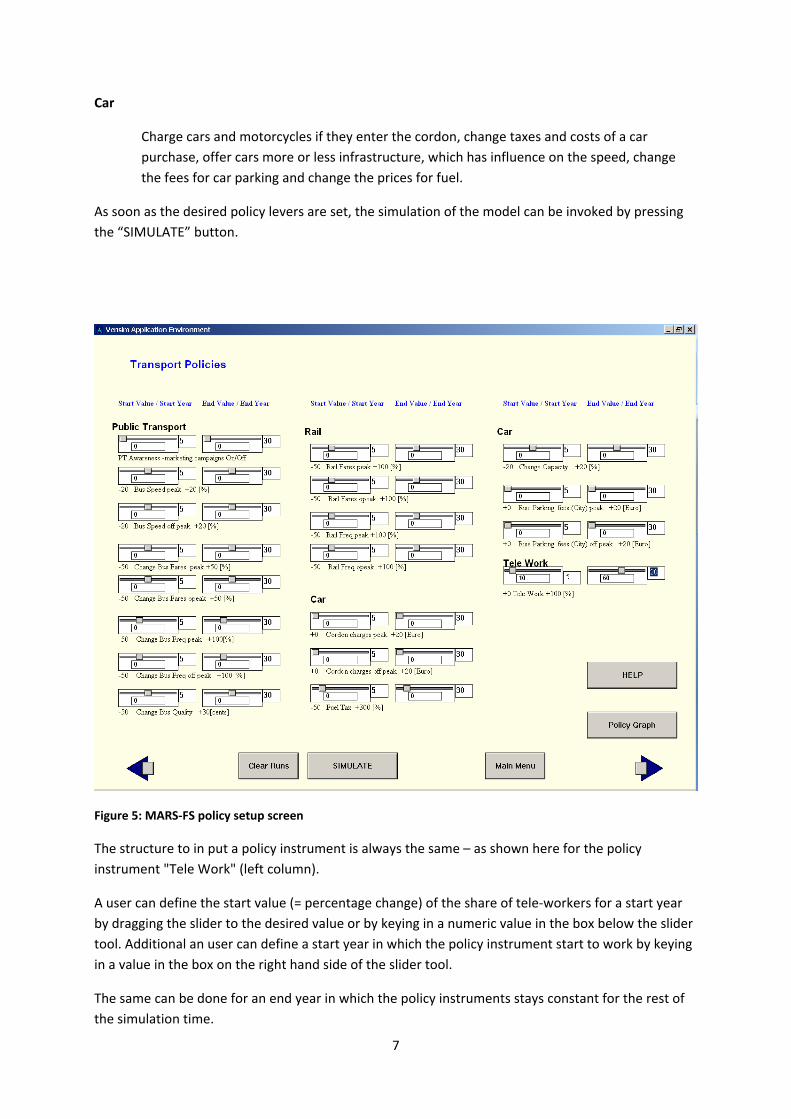
The policy instruments are case study dependent‐ in Figure 5 the in the Leeds case study available policy instruments are shown ‐ in total there are 19 different policy instruments.
There are different policies for each mode implemented within the MARS model and can be simulated using the MARS FS – The following list will give you an Idea what is possible to test within MARS (attention ‐ the list is not comprehensive and is case study depending):
Slow Modes
If you think of implementing pedestrian zones or bicycle lanes; you can input how much of the zone will be pedestrianized. This will also lengthen the distance to or from the parking place.
Public Transport
Decrease or increase bus speeds, bus fares or the bus frequency.
7
Car
Charge cars and motorcycles if they enter the cordon, change taxes and costs of a car purchase, offer cars more or less infrastructure, which has influence on the speed, change the fees for car parking and change the prices for fuel.
As soon as the desired policy levers are set, the simulation of the model can be invoked by pressing the “SIMULATE” button.
Figure 5: MARS‐FS policy setup screen
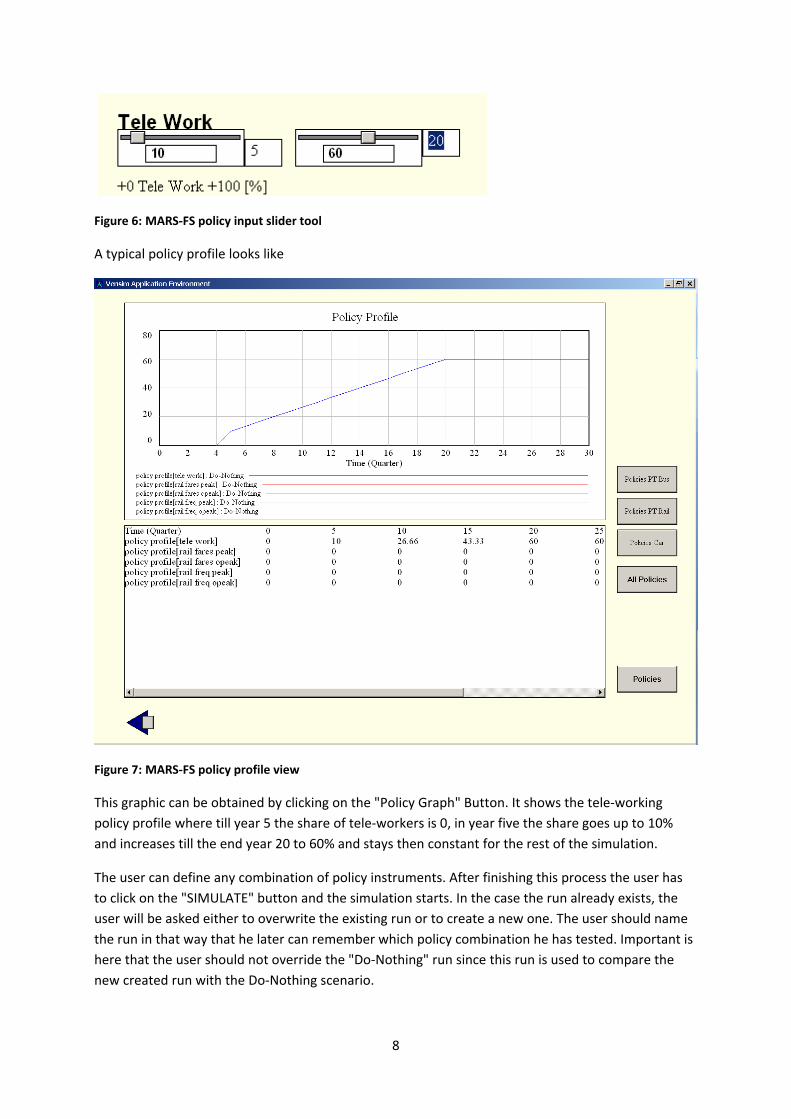
The structure to in put a policy instrument is always the same – as shown here for the policy instrument "Tele Work" (left column).
A user can define the start value (= percentage change) of the share of tele‐workers for a start year by dragging the slider to the desired value or by keying in a numeric value in the box below the slider tool. Additional an user can define a start year in which the policy instrument start to work by keying in a value in the box on the right hand side of the slider tool.
The same can be done for an end year in which the policy instruments stays constant for the rest of the simulation time.
8
Figure 6: MARS‐FS policy input slider tool
A typical policy profile looks like
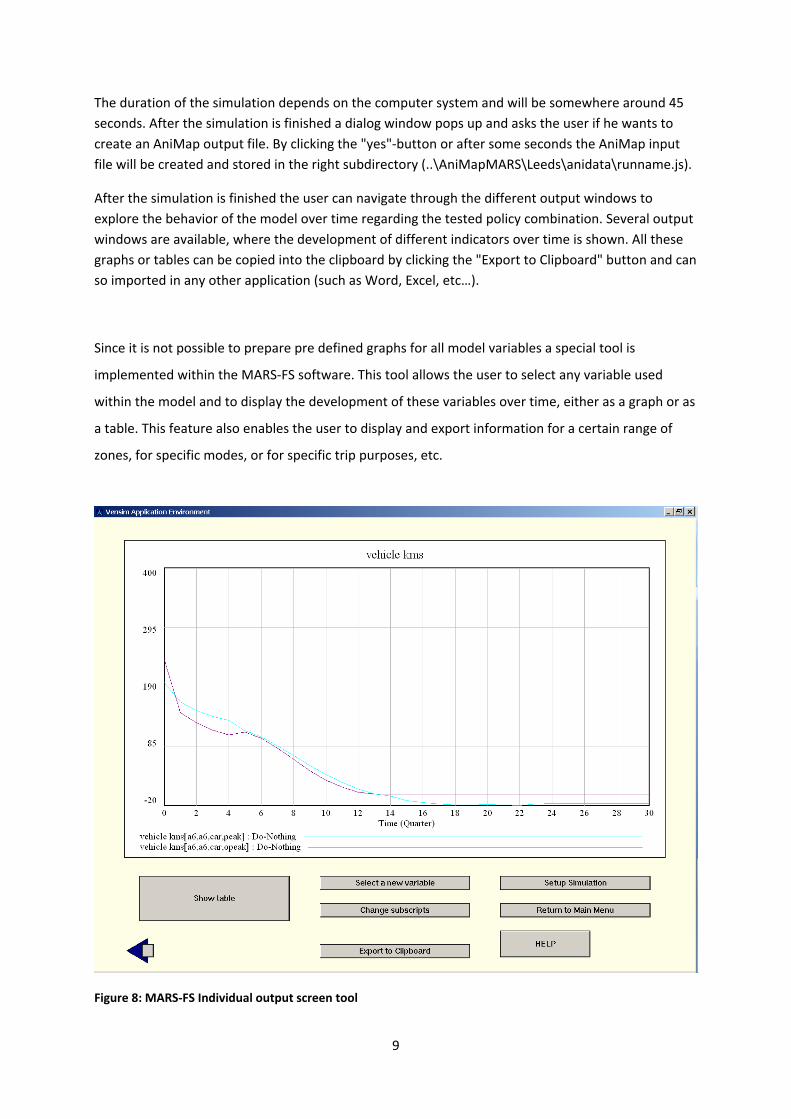
Figure 7: MARS‐FS policy profile view
This graphic can be obtained by clicking on the "Policy Graph" Button. It shows the tele‐working policy profile where till year 5 the share of tele‐workers is 0, in year five the share goes up to 10% and increases till the end year 20 to 60% and stays then constant for the rest of the simulation.
The user can define any combination of policy instruments. After finishing this process the user has to click on the "SIMULATE" button and the simulation starts. In the case the run already exists, the user will be asked either to overwrite the existing run or to create a new one. The user should name the run in that way that he later can remember which policy combination he has tested. Important is here that the user should not override the "Do‐Nothing" run since this run is used to compare the new created run with the Do‐Nothing scenario.
9
The duration of the simulation depends on the computer system and will be somewhere around 45 seconds. After the simulation is finished a dialog window pops up and asks the user if he wants to create an AniMap output file. By clicking the "yes"‐button or after some seconds the AniMap input file will be created and stored in the right subdirectory (..\AniMapMARS\Leeds\anidata\runname.js).
After the simulation is finished the user can navigate through the different output windows to explore the behavior of the model over time regarding the tested policy combination. Several output windows are available, where the development of different indicators over time is shown. All these graphs or tables can be copied into the clipboard by clicking the "Export to Clipboard" button and can so imported in any other application (such as Word, Excel, etc…).
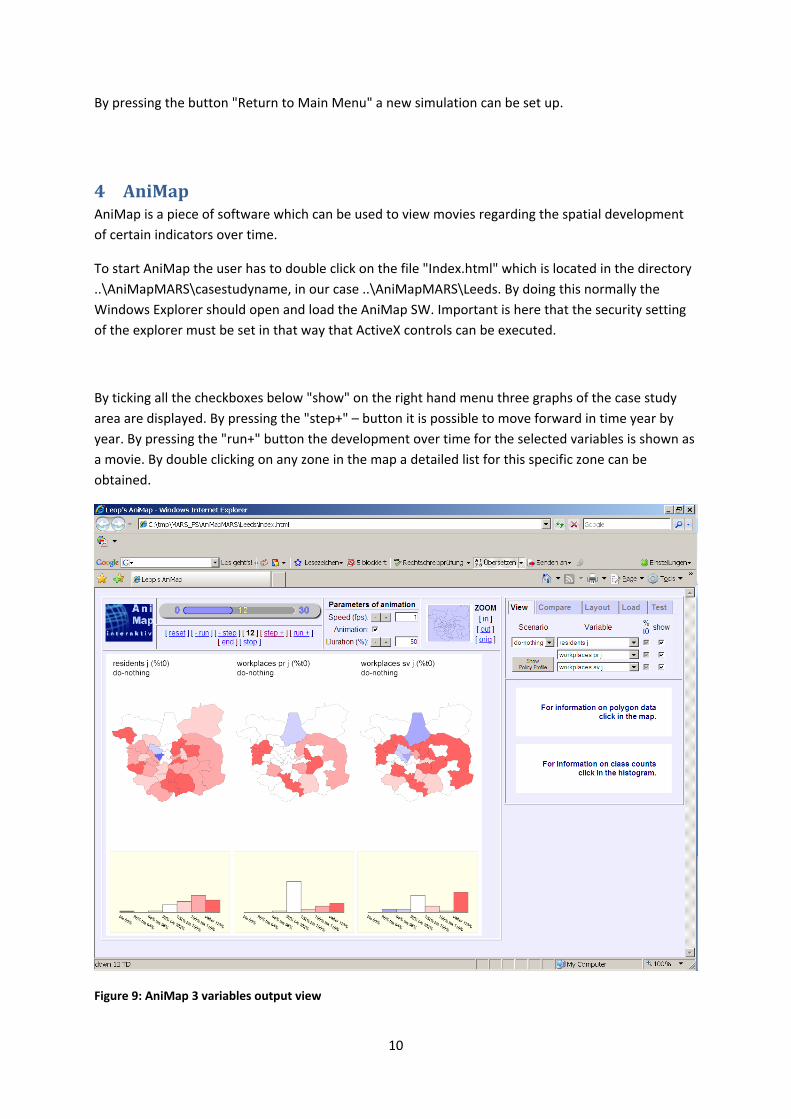
Since it is not possible to prepare pre defined graphs for all model variables a special tool is
implemented within the MARS‐FS software. This tool allows the user to select any variable used
within the model and to display the development of these variables over time, either as a graph or as
a table. This feature also enables the user to display and export information for a certain range of
zones, for specific modes, or for specific trip purposes, etc.
Figure 8: MARS‐FS Individual output screen tool
10
By pressing the button "Return to Main Menu" a new simulation can be set up.
4 AniMap AniMap is a piece of software which can be used to view movies regarding the spatial development of certain indicators over time.
To start AniMap the user has to double click on the file "Index.html" which is located in the directory ..\AniMapMARS\casestudyname, in our case ..\AniMapMARS\Leeds. By doing this normally the Windows Explorer should open and load the AniMap SW. Important is here that the security setting of the explorer must be set in that way that ActiveX controls can be executed.
By ticking all the checkboxes below "show" on the right hand menu three graphs of the case study area are displayed. By pressing the "step+" – button it is possible to move forward in time year by year. By pressing the "run+" button the development over time for the selected variables is shown as a movie. By double clicking on any zone in the map a detailed list for this specific zone can be obtained.
Figure 9: AniMap 3 variables output view
11
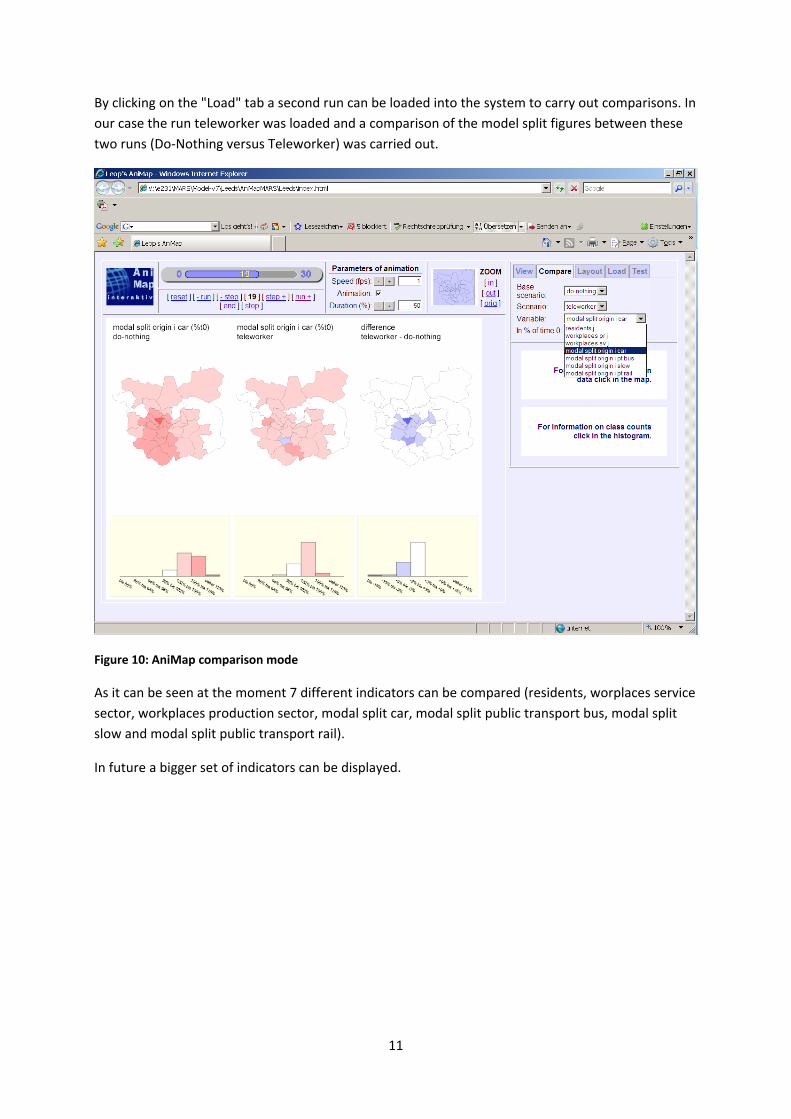
By clicking on the "Load" tab a second run can be loaded into the system to carry out comparisons. In our case the run teleworker was loaded and a comparison of the model split figures between these two runs (Do‐Nothing versus Teleworker) was carried out.
Figure 10: AniMap comparison mode
As it can be seen at the moment 7 different indicators can be compared (residents, worplaces service sector, workplaces production sector, modal split car, modal split public transport bus, modal split slow and modal split public transport rail).
In future a bigger set of indicators can be displayed.