inspiring trust with strong brand - Myirisbreport.myiris.com/SKPSEC/BAJELECT_20101021.pdf ·...
15
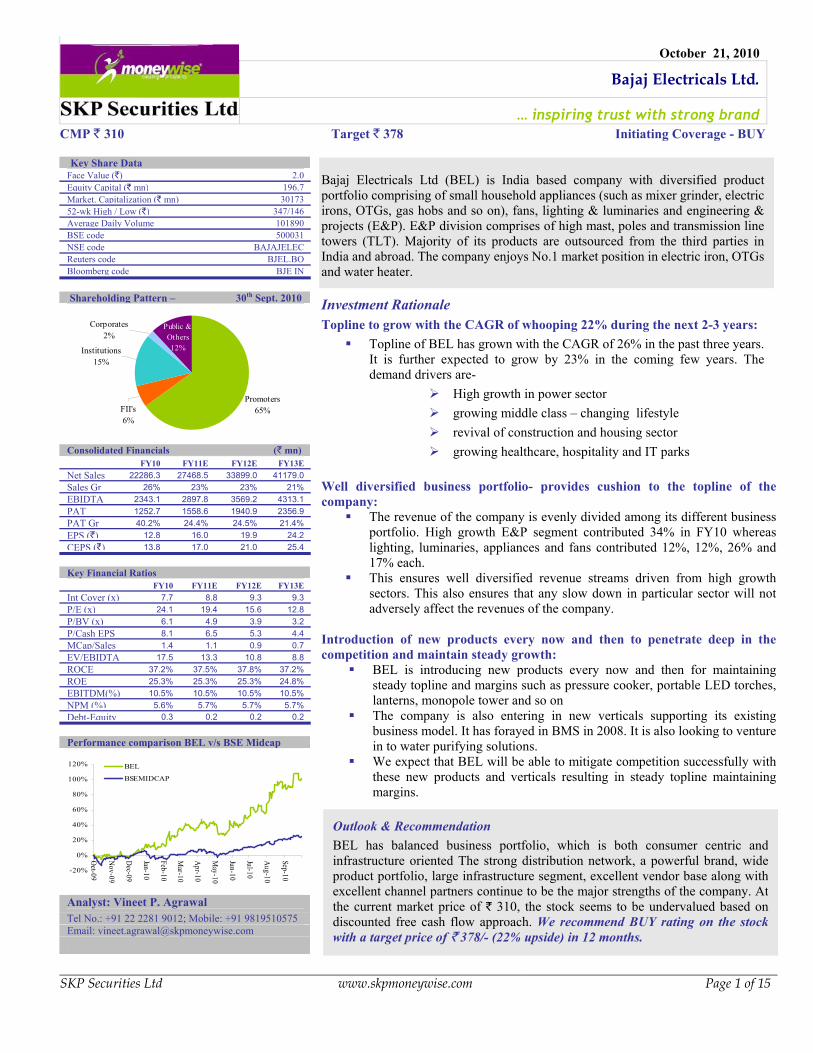
October 21, 2010 Bajaj Electricals Ltd. … inspiring trust with strong brand SKP Securities Ltd www.skpmoneywise.com Page 1 of 15 Outlook & Recommendation BEL has balanced business portfolio, which is both consumer centric and infrastructure oriented The strong distribution network, a powerful brand, wide product portfolio, large infrastructure segment, excellent vendor base along with excellent channel partners continue to be the major strengths of the company. At the current market price of ` 310, the stock seems to be undervalued based on discounted free cash flow approach. We recommend BUY rating on the stock with a target price of ` 378/- (22% upside) in 12 months. CMP ` 310 Target ` 378 Initiating Coverage - BUY Key Share Data Face Value (`) 2.0 Equity Capital (` mn) 196.7 Market. Capitalization (` mn) 30173 52-wk High / Low (`) 347/146 Average Daily Volume 101890 BSE code 500031 NSE code BAJAJELEC Reuters code BJEL.BO Bloomberg code BJE IN Shareholding Pattern – 30 th Sept. 2010 Consolidated Financials (` mn) FY10 FY11E FY12E FY13E Net Sales 22286.3 27468.5 33899.0 41179.0 Sales Gr 26% 23% 23% 21% EBIDTA 2343.1 2897.8 3569.2 4313.1 PAT 1252.7 1558.6 1940.9 2356.9 PAT Gr 40.2% 24.4% 24.5% 21.4% EPS (`) 12.8 16.0 19.9 24.2 CEPS (`) 13.8 17.0 21.0 25.4 Key Financial Ratios FY10 FY11E FY12E FY13E Int Cover (x) 7.7 8.8 9.3 9.3 P/E (x) 24.1 19.4 15.6 12.8 P/BV (x) 6.1 4.9 3.9 3.2 P/Cash EPS 8.1 6.5 5.3 4.4 MCap/Sales 1.4 1.1 0.9 0.7 EV/EBIDTA 17.5 13.3 10.8 8.8 ROCE 37.2% 37.5% 37.8% 37.2% ROE 25.3% 25.3% 25.3% 24.8% EBITDM(%) 10.5% 10.5% 10.5% 10.5% NPM (%) 5.6% 5.7% 5.7% 5.7% Debt-Equity 0.3 0.2 0.2 0.2 Performance comparison BEL v/s BSE Midcap Analyst: Vineet P. Agrawal Tel No.: +91 22 2281 9012; Mobile: +91 9819510575 Email: [email protected] Bajaj Electricals Ltd (BEL) is India based company with diversified product portfolio comprising of small household appliances (such as mixer grinder, electric irons, OTGs, gas hobs and so on), fans, lighting & luminaries and engineering & projects (E&P). E&P division comprises of high mast, poles and transmission line towers (TLT). Majority of its products are outsourced from the third parties in India and abroad. The company enjoys No.1 market position in electric iron, OTGs and water heater. Investment Rationale Topline to grow with the CAGR of whooping 22% during the next 2-3 years: Topline of BEL has grown with the CAGR of 26% in the past three years. It is further expected to grow by 23% in the coming few years. The demand drivers are- ¾ High growth in power sector ¾ growing middle class – changing lifestyle ¾ revival of construction and housing sector ¾ growing healthcare, hospitality and IT parks Well diversified business portfolio- provides cushion to the topline of the company: The revenue of the company is evenly divided among its different business portfolio. High growth E&P segment contributed 34% in FY10 whereas lighting, luminaries, appliances and fans contributed 12%, 12%, 26% and 17% each. This ensures well diversified revenue streams driven from high growth sectors. This also ensures that any slow down in particular sector will not adversely affect the revenues of the company. Introduction of new products every now and then to penetrate deep in the competition and maintain steady growth: BEL is introducing new products every now and then for maintaining steady topline and margins such as pressure cooker, portable LED torches, lanterns, monopole tower and so on The company is also entering in new verticals supporting its existing business model. It has forayed in BMS in 2008. It is also looking to venture in to water purifying solutions. We expect that BEL will be able to mitigate competition successfully with these new products and verticals resulting in steady topline maintaining margins. Promoters 65% FII's 6% Public & Others 12% Corporates 2% Institutions 15% -20% 0% 20% 40% 60% 80% 100% 120% Oct-09 Nov-09 Dec-09 Jan-10 Feb-10 Mar-10 Apr-10 May-10 Jun-10 Jul-10 Aug-10 Sep-10 BEL BSEMIDCAP
Transcript of inspiring trust with strong brand - Myirisbreport.myiris.com/SKPSEC/BAJELECT_20101021.pdf ·...
October 21, 2010
Bajaj Electricals Ltd.
… inspiring trust with strong brand
SKP Securities Ltd www.skpmoneywise.com Page 1 of 15
Outlook & Recommendation BEL has balanced business portfolio, which is both consumer centric andinfrastructure oriented The strong distribution network, a powerful brand, wideproduct portfolio, large infrastructure segment, excellent vendor base along withexcellent channel partners continue to be the major strengths of the company. Atthe current market price of ` 310, the stock seems to be undervalued based ondiscounted free cash flow approach. We recommend BUY rating on the stockwith a target price of ` 378/- (22% upside) in 12 months.
CMP ` 310 Target ` 378 Initiating Coverage - BUY
Key Share Data Face Value (`) 2.0 Equity Capital (` mn) 196.7 Market. Capitalization (` mn) 30173 52-wk High / Low (`) 347/146 Average Daily Volume 101890 BSE code 500031 NSE code BAJAJELEC Reuters code BJEL.BO Bloomberg code BJE IN
Shareholding Pattern – 30th Sept. 2010
Consolidated Financials (` mn) FY10 FY11E FY12E FY13E
Net Sales 22286.3 27468.5 33899.0 41179.0 Sales Gr 26% 23% 23% 21% EBIDTA 2343.1 2897.8 3569.2 4313.1 PAT 1252.7 1558.6 1940.9 2356.9 PAT Gr 40.2% 24.4% 24.5% 21.4% EPS (`) 12.8 16.0 19.9 24.2 CEPS (`) 13.8 17.0 21.0 25.4
Key Financial Ratios FY10 FY11E FY12E FY13E Int Cover (x) 7.7 8.8 9.3 9.3 P/E (x) 24.1 19.4 15.6 12.8 P/BV (x) 6.1 4.9 3.9 3.2 P/Cash EPS 8.1 6.5 5.3 4.4 MCap/Sales 1.4 1.1 0.9 0.7 EV/EBIDTA 17.5 13.3 10.8 8.8 ROCE 37.2% 37.5% 37.8% 37.2% ROE 25.3% 25.3% 25.3% 24.8% EBITDM(%) 10.5% 10.5% 10.5% 10.5% NPM (%) 5.6% 5.7% 5.7% 5.7% Debt-Equity 0.3 0.2 0.2 0.2
Performance comparison BEL v/s BSE Midcap
Analyst: Vineet P. Agrawal Tel No.: +91 22 2281 9012; Mobile: +91 9819510575 Email: [email protected]
Bajaj Electricals Ltd (BEL) is India based company with diversified product portfolio comprising of small household appliances (such as mixer grinder, electric irons, OTGs, gas hobs and so on), fans, lighting & luminaries and engineering & projects (E&P). E&P division comprises of high mast, poles and transmission line towers (TLT). Majority of its products are outsourced from the third parties in India and abroad. The company enjoys No.1 market position in electric iron, OTGs and water heater. Investment Rationale Topline to grow with the CAGR of whooping 22% during the next 2-3 years:
Topline of BEL has grown with the CAGR of 26% in the past three years. It is further expected to grow by 23% in the coming few years. The demand drivers are-
High growth in power sector growing middle class – changing lifestyle revival of construction and housing sector growing healthcare, hospitality and IT parks
Well diversified business portfolio- provides cushion to the topline of the company:
The revenue of the company is evenly divided among its different business portfolio. High growth E&P segment contributed 34% in FY10 whereas lighting, luminaries, appliances and fans contributed 12%, 12%, 26% and 17% each.
This ensures well diversified revenue streams driven from high growth sectors. This also ensures that any slow down in particular sector will not adversely affect the revenues of the company.
Introduction of new products every now and then to penetrate deep in the competition and maintain steady growth:
BEL is introducing new products every now and then for maintaining steady topline and margins such as pressure cooker, portable LED torches, lanterns, monopole tower and so on
The company is also entering in new verticals supporting its existing business model. It has forayed in BMS in 2008. It is also looking to venture in to water purifying solutions.
We expect that BEL will be able to mitigate competition successfully with these new products and verticals resulting in steady topline maintaining margins.
Promoters65%FII's
6%
Public & Others12%
Corporates2%
Institutions15%
-20%
0%
20%
40%
60%
80%
100%
120%
Oct-09
Nov-09
Dec-09
Jan-10
Feb-10
Mar-10
Apr-10
May-10
Jun-10
Jul-10
Aug-10
Sep-10
BEL
BSEMIDCAP

Bajaj Electricals Ltd.
SKP Securities Ltd. www.skpmoneywise.com Page 2 of 15
Business Classification
An introduction: Bajaj Electricals Ltd (BEL) is a 72 years old company, established in 1938. It commenced its operations in Lahore with the marketing of small appliances and lighting products. Today, it has interests in lighting, luminaries, electrical appliances, fans and engineering & projects. The company has also ventured in to Building Management Systems (BMS) in the year 2008. Business classification of BEL is as follows:
Source: Company & SKP Research
1. Appliances Business Unit (BU): • Wide range of products: Appliances BU offers wide range of household appliances namely
water heaters, mixer grinders, food processors, microwave oven, OTGs, air coolers, steam and dry irons, electric kettles, water filters, toasters, rice cookers, chimneys, gas stoves, hobs and so on. Recently, it has also started manufacturing pressure cookers to be marketed in Tier II cities and rural areas.
• Market share and position: BEL is one of the leading players in small appliance market with the market share of 15-30% in various categories such as such as mixer grinders (15%), irons (26%), OTGs (30%), water heater (23%), and room coolers (22%).
• It enjoys the leadership (number 1 position) in the domestic market in irons, water heaters and OTGs segment, whereas it has number 2 and 3 position in mixer grinders and coolers.
• Tie-ups: BEL has tie-ups with Morphy Richards, UK, for small appliances and Nardi, Germany for hobs.
• Morphy Richards manufactures wide range of home appliances from irons, kettles, and toasters to vacuum cleaner. 90% of the households in UK make use of at least one Morphy Richard appliance making it UK’s number 1 brand.
• Competitors: Philips, Black & Decker, Kenstar, Usha, Maharaja, Marloni, Inalsa, Prestige,
Hawkins and so on.
BEL
Consumer Durables (EBITM: 9.5%)
Lighting (EBITM: 7%)
(Revenue Contribution: 12%)
Appliances & Fans (Combined Revenue Contribution: 43%)
High Mast Poles & TLT
(Combined Revenue Contribution: 34%)
Luminaries(EBITM: 7%)
(Revenue Contribution: 12%)
BMS(Expected to contribute to the
tune of Rs 1-1.5 bn to the topline in the next 3-4 years)
Engineering and Projects
(EBIDTM: 10-10.5%)
Commercial & Industrial Lighting Projects
(Street lighting, Retail Lighting, Hazardous Area
Lighting, Office lighting etc)
Bajaj Electricals Ltd.
SKP Securities Ltd www.skpmoneywise.com Page 3 of 15
2. Fans BU:
• Products: The Fans BU of the company manufactures ceiling fans, table fans, pedestal fans, wall mounted fans, exhaust and fresh air fans. Bajaj fans are sold in almost 50,000 outlets across the country of which 18% are in rural areas and small towns with population below 50,000.
• Infrastructure: BEL has its manufacturing facility for fans at Chakan with the annual capacity
of 8 lakh units. Chakan unit has produced 3.5 lakh fans during FY10.
• Third party outsources: The Company also sources its requirements from dedicated vendors at Noida, Delhi and Himachal Pradesh. It also imports fans from China. Around 90% of its requirements are outsourced.
• Market Share: BEL has the overall market share of 16.5% in this segment and is the second
largest player in the segment after Crompton Greaves (with the market share of 24%) followed by Orient and Usha with the market share of 16% each.
• BEL enjoys leadership position in premium fan segment and is number one brand in eight
states.
• Tie-Ups: BEL has tied-up with China based Midea for marketing their fans in India. Midea is renowned for manufacturing of household appliances. It is one of the largest household appliances maker and exporter in China. Midea is also world’s largest manufacturer of TPW (Table, Pedestal and Wall) fans.
• The company has also tied up with Disney, USA for manufacturing kids fan category with
Bajaj-Disney brands.
3. Lighting BU: • The lighting business unit markets wide range of light sources such as general lighting services
(GLS) lamps, fluorescent tube lights (FTL), compact fluorescent lamps (CFL), special purpose lamps, torches etc.
• The manufacturing of GLS and FTL lamps are done at Hind Lamps Ltd (HLL), an associate
company of BEL with 50% stake, located in Shikohabad, Utter Pradesh. HLL fulfills around 70% of the requirement of BEL.
• The company has also invested in Sterlite Lighting (23% stake), which fulfills 40% of CFL
demand for the company. Rest is outsourced.
• Market Share: BEL is the third largest company in India with the market share of 8% in overall lighting segments after Philips (26%) and Surya (12%).
• Market size for CFL in India is estimated around Rs 19 bn, expected to grow @ 30% per
annum. BEL enjoys 7% market share holding third position in the organized sector in CFL segment. Philips is the market leader in the segment with 20% market share followed by Surya (8%).
• Foray in to LED portable lighting: BEL has also entered in to LED (Light Emitting Diode)
portable lights with the introduction of products such as LED torches and LED lanterns. LED lamps are preferred choice of the environmentally conscious people all over the world.

Bajaj Electricals Ltd.
SKP Securities Ltd www.skpmoneywise.com Page 4 of 15
4. Luminaries (light fittings) BU: • Commercial & Industrial Lighting: The luminaries BU market comprehensive range of
luminaries including commercial, industrial, flood lighting, street lighting and post lamp lighting. It also undertakes special luminaries for flame proof and increased safety applications.
• The luminaries are offered to suit wide variety of light sources ranging from CFL, FTL to HID
(High Intensity Discharge) lamps of various types and ratings.
• BEL gets the project directly from private players and through intermediary dealers for Government projects. It undertakes the project from designing, to erection and commissioning.
• Tie-ups: The Company has tied up with Trilux Lenze, Germany, wherein it promotes the
premium Trilux luminaries. Trilux is a leading European luminaries brand founded in 1912. It is the market leader in industrial and commercial lighting.
• BEL got major orders from Delhi PWD for street lighting for the common Wealth Games in
FY10 for Trilux luminaries. It also received orders from Volkswagen; TCS, Chennai; etc.
• This BU has also signed an agreement with Ruud Lighting Inc, USA for distributing their LED range of products in SAARC countries. It also acquired rights to manufacture the Ruud Lighting (Beta LED) range of products in India.
• Ruud Lighting, located in Racine, Wisconsin is a manufacturer and worldwide direct marketer
of industrial, commercial and residential lighting fixtures.
• Market Share: BEL is positioned next only to Philips (23% market share) with 17% of the total pie (approximately Rs 25 bn) followed by Crompton (13%) and Wipro (9%).
• Esteemed Clients: Giant Corporates like TISCO, TELCO, Reliance Group of Industries, L&T,
Aditya Birla Group, Siemens, Ranbaxy etc. are some of the esteemed clients of the company.
• Government Entities like Airport Authority of India, CONCOR, SEBs, NTPC, Municipal Corporations, Naval Dockyards, BSES, HUDA, MSRDC, BEST etc. are some of its esteemed clients.
• Building Management System (BMS): The luminaries BU have forayed in to business of BMS
in the year 2008. This is a strategic move of BEL to offer a wider product portfolio to the customers of luminaries and lighting BU. The main focus is to conserve energy through HVAC (Heating, Ventilation, Air Conditioning) controls, fire alarms, access and security controls managed by BMS.
• The BU has tied up with Delta Controls, Canada for HVAC controls and Securiton AG,
Switzerland for fire alarms, access and security controls. This is an exclusive tie-up to market Securiton and Delta Controls products in India.
• We expect that this venture will provide a competitive edge to the company and the company
will looked upon by the customers as end to end solution provider in total energy management of buildings and facilities.
5. Engineering & Projects (E&P) BU: • E&P BU was started in early 1990s to focus on turnkey lighting projects. The company was
importing high masts from UK at that time and selling them in domestic market. But, the rising pound saw the landed price of the product increasing and it was becoming an unviable to import from UK. So it decided to manufacture it in-house.

Bajaj Electricals Ltd.
SKP Securities Ltd www.skpmoneywise.com Page 5 of 15
• The company entered in to transmission line towers (TLT) business in the year 2001. Today, E&P BU of BEL can be divided in three divisions viz special projects, high mast and poles and TLT.
• The company has state-of-the-art manufacturing facility at Ranjangaon, near Pune with the
installed capacity of 24,000 MT per annum. The facility undertakes the fabrication of lattice mast and TLTs. It also have the state-of-the art galvanizing facility at Ranjangaon. The unit was commissioned in FY01. Since then it has made steady progress to achieve near 90% of capacity utilization.
• Special Projects: Special Projects includes turnkey lighting projects, factory lighting, airport
lighting, sports lighting, rural electrification and so on. Some of the successfully completed project by the BU at a glance:
Category Successful Projects Retail Lighting Ford Showroom, Chandigarh
Reliance Fresh, Belapur, Navi Mumbai Ansal Mall, Ludhiana, Punjab
Stadium Lighting Chinnaswamy Stadium, Bangluru Green Park Stadium, Kanpur SMS Stadium, Jaipur and so on.
Power Plant Lighting Thermal Power Station, Dahanu, Maharashtra BSES Power Station Chimney, Dahanu, Maharashtra Damoder Valley Corporation Power Plant, West Bengal
Airport Lighting Kochi Airport Domestic Airport Terminal building, Mumbai Cargo Airport Lighting at Sahar International Airport, Mumbai
Railway Station Lighting Howrah Railway Station Nagpur Railway Station
Street Lighting Queen’s Necklace, Mumbai Haji Ali, Mumbai Airport Approach Road, Mumbai Illumination of Bandra-Worli Sea Link bridge, Mumbai. Kharghar Street Light, Navi Mumbai Airoli Bridge, Navi Mumbai and so on.
Monument Lighting Taj Mahal and Others Source: Company & SKP Research • BEL is market leader in sports lighting projects, and power lighting projects with the
estimated market share of 70%. • Under the division, the company has executed prestigious orders from the Government
including lighting works at the Commonwealth Games stadium and the Bandra-Worli sea link. It have also received order for the illumination of Wankhede Stadium, Mumbai in FY10. The stadium is going to host World Cup Cricket finals in 2011.
• Under rural electrification BEL undertakes turnkey projects for drawing lines for distributing
cables, street lighting, installing transformers and so on. Rural Electrification business of the company received four major orders through National Electric Supply Company Ltd and NHPC totaling ` 3.6 bn in FY10.
• High Mast Lightings: BEL undertakes the projects for designing, supplying, erecting and
commissioning of high mast poles, signages on road, streetlight and poles etc.
• BEL is present in the field for over 20 years. Over the period BEL has supplied more than 20 thousand masts with different operating systems, ranging from 10 to 60 meters. Today, it is the

Bajaj Electricals Ltd.
SKP Securities Ltd www.skpmoneywise.com Page 6 of 15
market leader in high mast lightings. It has designed, developed, supplied and commissioned tallest flag post 63 meter high in Kaithal, Kurukshetra in FY10.
• Major Projects executed:
Street lighting for MADC, Nagpur, PWD, Delhi, CIDCO, Mumbai NH-45 Tamilnadu etc.
High Masts for BORL Bina – Bina Refinary; Bhilai Steel Plant; RIL, Jamnagar and so on.
Signages for HPCL, BPCL, IOC, Reliance etc. • Transmission Line Towers: BEL entered in to TLT business in 2002. The TLT manufactured at
Ranjangaon is approved by PGCIL and majority of SEBs across India. It manufactures TLTs ranging from 110-132-220-440-765 KV class.
• The division is executing EPC orders from important customers such as PGCIL, Damodar
Valley Corporation, GETCO, Andhra Pradesh Transmission Corporation, Tamilnadu Electricity Board and so on.
• TLT majors such as KEC International, Jyoti Structures, Kalpataru Power and L&T provides
competition to the company in the segment.
Sourcing Arrangement of BEL at a glance
BEL’s business model is such that it outsources its product requirements to the third parties. Some of the BEL’s outsourcing vendors are local players while some are renowned global leaders in the respective segments. A brief description of these tie-ups is as follows:
Product Category BEL’s Mfg. Base Local Outsourcing/Foreign tie-ups Country Import Appliances -- Outsource through local vendors at
Noida, Delhi and Himachal Pradesh (HP) Morphy Richards Nardi for gas hobs
India UK Germany
China
Fans Chakan Hydrabad and HP Midea for TPW fans Walt Disney for children’s fan
India China USA
China
Electrical Lamps & Tubes -- Mfg by HLL, an associate company; and outsourced from local vendors
India
--
CFL -- Mfg by Starlite Lighting at Nashik, a sister concern of BEL
India
--
Luminaries -- Local vendors at Daman and HP Trilux Lenz for premium Technical lighting Ruud Lighting Inc. for LED lighting Disano for street lighting Securiton for fire alarms, access and security control Delta Controls for HVAC
India Germany USA Italy Germany Canada
China
E&P – Special projects Abacus for sports lighting UK -- E&P – High Mast and Pole Ranjangaon
--
India
--
E&P - TLT Ranjangaon -- India -- Source: Company & SKP Research

Bajaj Electricals Ltd.
SKP Securities Ltd www.skpmoneywise.com Page 7 of 15
Raw Materials • The key raw materials for the products manufactured by BEL are ferrous and non-ferrous
metals. Metals which contains appreciable amount of Iron or its alloys such as steel, is called ferrous metal and vice versa. Aluminium, copper and zinc are non-ferrous metals used in the products by BEL.
• Metals used in appliances, fans and lighting are aluminium and copper. Plastic is also used for
making these products whereas towers and poles are fabricated with steel, which then is galvanized with zinc. Galvanization provides weatherproofing to towers and poles.
• Raw materials costs as a percentage of sales come to around 80% in the E&P business with zinc
and steel being the key inputs. • The above metals are highly price sensitive. BEL has the hedging policy in place. It buys raw
materials on a weekly basis that provides cover against price fluctuation. This limits the risk only to that consignment. It does not store raw materials. The Company also enjoys discounts from vendors on zinc.
• The Company also have price variation clause in most of its TLT orders, which makes up to 20-
22% of the total orders, where the customer compensates for the price increase in raw materials.
• The company procures both ferrous and non-ferrous metals from dedicated domestic vendors.
Investment Rationale
1. Topline to grow with the CAGR of whooping 22% during the next two years: BEL’s topline has
seen handsome CAGR growth of 26% for the past three years. Consolidated topline posted by the company for FY10 was ` 22.5 bn, which we expect to touch ` 41.6 bn by the end of FY13 with the CAGR growth rate of 23%. The growth will be fuelled by:
• Growth in Engineering & Project Segment: E&P BU has enjoyed the tremendous growth in
its topline with the CAGR growth rate of 32% in the last three years. The gross turnover during FY10 reached ` 7.5 bn from ` 3.3 bn in FY07.
The TLT division clocked the turnover of ` 2.8 bn in FY10 with he growth rate of 64% over FY09. The growth was fuelled by aggressive investment plan outlaid by the Government of India for power sector during 11th and 12th five year plan. Capacity addition targeted during 11th and 12th five years plan along with the current status is as follows:
Transmission Lines (ckm)
Target for 2007-2012
Status at March 2009
Balance for 2010-012
Target for 2012-17
Combined Target by
March 2017
Expected Demand of TLT
during 2010-17 (MT)
765 kv 7,850 3,118 4,732 8,000 12,732 348,970
400 kv 125,000 89,496 35,504 51,000 86,504 2,370,981 HVDC up to 500 kv 7,432 7172 260 4,500 4760 130,466
230/200 kv 150,000 122,960 27,040 50,000 77,040 2,111,583
Total 290,282 222,746 67,536 113,500 181,036 4,962,000 Source: Presentation of International Conclave on “Key Inputs for Accelerated Development of Indian Power Sector for 12th Plan and Beyond” and SKP Research
It is clear from the table above that 4,962,000 MT of transmission line towers will be required in the next eight years, translating in to average yearly demand of 6,20,250 MT per annum.

Bajaj Electricals Ltd.
SKP Securities Ltd www.skpmoneywise.com Page 8 of 15
• Increasing purchasing power of Indian middle class – creating demand for consumer durables: The growing middle class with its changing lifestyle is also encouraging the demand for small appliances such as microwave ovens, mixer grinders, branded gas hobs, chimneys, water coolers and so on.
India’s per capita income is increased by 10.5% to ` 44,345 in FY10 from ` 40,141 in FY09. This growth is the indicative of increased spending power of the consumer. With the rising trend of younger professionals that start earning early in life, the levels of aspirations has increased in the today’s youth.
According to a study by the McKinsey Global Institute (MGI), released in May 2007, India's middle class will swell by more than ten times—from 50 mn in 2007 to 583 mn people by 2025. By 2025, India will also become the 5th largest consumer market, moving up from the 12th position it occupied in 2007. BEL’s small appliance has grew with CAGR growth of 30% in the past three years and we further expect it to grow by CAGR of 22% for the coming three years by virtue of growing purchasing power in the hands of Indian middle class.
• Revival of construction and housing Industry: The real estate sector in the country is one of great importance. According to the report of the Technical Group on Estimation of Housing Shortage, an estimated shortage of 26.53 mn houses during the Eleventh Five Year Plan (2007-12) provides a big investment opportunity.
According to the data released by the Department of Industrial Policy and Promotion (DIPP), housing and real estate sector including cineplex, multiplex, integrated townships and commercial complexes etc, attracted a cumulative foreign direct investment (FDI) worth USD 8.4 billion from April 2000 to April 2010 wherein the sector witnessed FDI amounting USD 2.8 billion in the fiscal year 2009-10. Real estate companies are coming up with various residential and commercial projects to fulfill the demand for residential and office properties in Tier-II and Tier-III cities. Government also has plans for attaining the objective of ‘housing for all’ through PPP and joint ventures as well as exemptions in floor space index (FSI).
• Growing Retail: The increasing penetration of organized retail and the increasing preference for branded products are fuelling the demand for the products of the company. According to a report titled 'India Organised Retail Market 2010', published by Knight Frank India in May 2010 during 2010-12, around 55 mn sq ft of retail space will be ready in Mumbai, national capital region (NCR), Bengaluru, Kolkata, Chennai, Hyderabad and Pune. Besides, between 2010 and 2012, the organised retail real estate stock will grow from the existing mn sq ft to 95 mn sq ft.
• Healthcare: As per a study by an industry body and Ernst & Young, India would require
another 1.75 mn beds by the end of 2025 with the required investment of USD 86 bn. The public sector however is likely to contribute only around 15-20% of the required investment. The corporate India is therefore, leveraging on this business potential and various health care brands have started aggressive expansion in the country. Some of the companies that plan to increase their footprints include Reliance Health, the Hindujas, Sahara Group, Emami, Apollo Tyres and the Panacea Group.
• Hospitality: Indian hospitality industry is projected to grow at a rate of 8.8% during 2007-16,
placing India as the second-fastest growing tourism market in the world. Initiatives like massive investment in hotel infrastructure and open-sky policies made by the government are all aimed at propelling growth in the hospitality sector.

Bajaj Electricals Ltd.
SKP Securities Ltd www.skpmoneywise.com Page 9 of 15
According to industry data, India is expected to double the number of branded hotel rooms from 100,000 now in just three years. Leading the pack are global hotel chains, which will add over 300 hotel properties (an estimated 55,000 rooms) in the country by 2013, as per data compiled by companies.
This will boost the demand in TLT, fans, lighting and luminaries segment of the company. The Company’s fans, lighting and luminaries BU has seen a CAGR growth of 25%, 25% and 12% respectively. With the above Government and private sector efforts to boost housing and construction industry, we further expect the rise in the revenues above BUs by 20%, 23%and 18% respectively.
2. Well diversified business portfolio- provides cushion to the topline of the company: The revenues
of the company is evenly divided among its different business portfolio. As mentioned earlier company’s E&P BU comprise of three different businesses. When one product fails to bring enough orders, the other does more than enough to fill the gap. Revenue mix of the company at a glance:
High growth E&P segment contributed 34% in FY10 whereas lighting, luminaries, appliances and fans contributed 12%, 12%, 26% and 17% each. This ensures well diversified revenue streams driven from high growth sectors. This also ensures that any slow down in particular sector will not adversely affect the revenues of the company. 3. Reducing Term Loans – Favorable D/E:
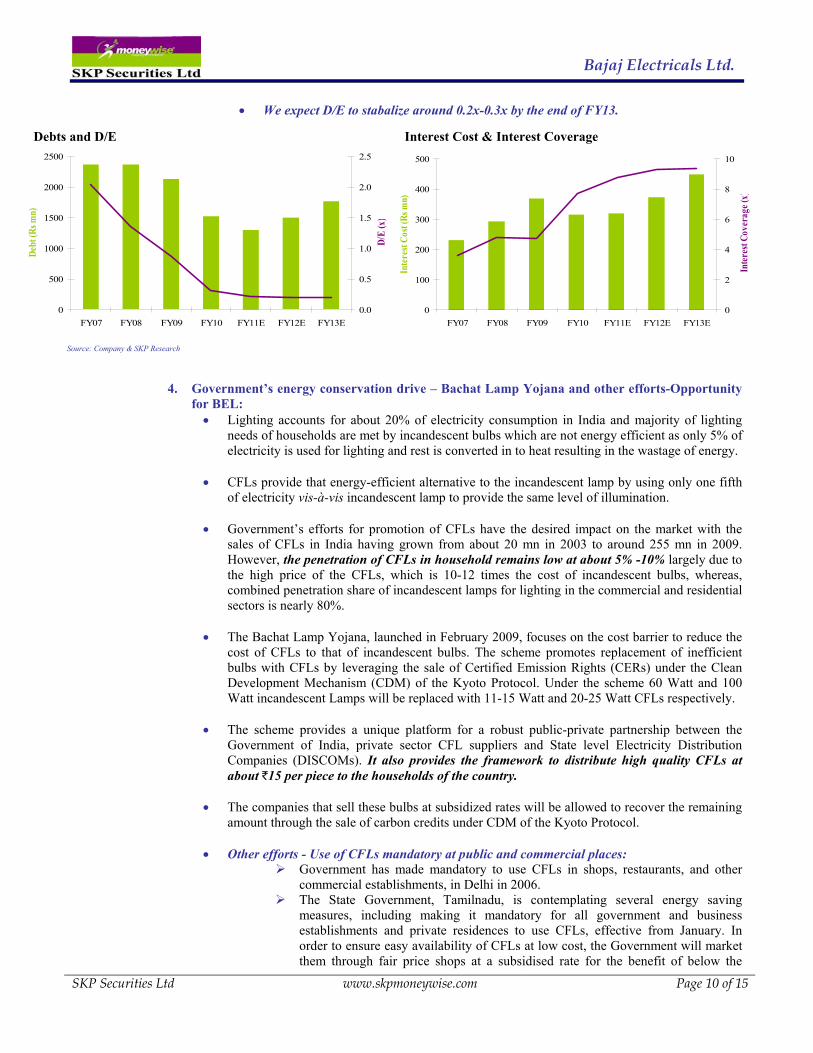
• Since BEL’s expansion plans are over and there is no further plans for expansion (till date) company is reducing its term loans from its books. Term loans, which stood at ` 493 mn in FY07, reduced to ` 110 mn in FY10. We further expect that BEL will repay its entire term loan by the end of FY13.
• Company’s foreign currency loan has also reduced to ` 573 mn in FY10 from ` 1,192 mn
in FY07. • This reduction in debt has helped the debt-equity of the company to improve significantly
from whooping 2.0x to 0.3x in FY10.
12% 12% 12% 12% 11%
16% 12% 12% 11% 11%
30% 34% 35% 36% 37%
26% 26% 25% 25% 25%
17% 17% 16% 16% 16%
0%10%
20%30%40%50%
60%70%80%
90%100%
FY09 FY10 FY11E FY12E FY13E
Fans
Appliances
E&P
Luminaries
Lighting
Source: Company & SKP Research
Bajaj Electricals Ltd.
SKP Securities Ltd www.skpmoneywise.com Page 10 of 15
• We expect D/E to stabalize around 0.2x-0.3x by the end of FY13.
4. Government’s energy conservation drive – Bachat Lamp Yojana and other efforts-Opportunity
for BEL: • Lighting accounts for about 20% of electricity consumption in India and majority of lighting
needs of households are met by incandescent bulbs which are not energy efficient as only 5% of electricity is used for lighting and rest is converted in to heat resulting in the wastage of energy.
• CFLs provide that energy-efficient alternative to the incandescent lamp by using only one fifth
of electricity vis-à-vis incandescent lamp to provide the same level of illumination.
• Government’s efforts for promotion of CFLs have the desired impact on the market with the sales of CFLs in India having grown from about 20 mn in 2003 to around 255 mn in 2009. However, the penetration of CFLs in household remains low at about 5% -10% largely due to the high price of the CFLs, which is 10-12 times the cost of incandescent bulbs, whereas, combined penetration share of incandescent lamps for lighting in the commercial and residential sectors is nearly 80%.
• The Bachat Lamp Yojana, launched in February 2009, focuses on the cost barrier to reduce the
cost of CFLs to that of incandescent bulbs. The scheme promotes replacement of inefficient bulbs with CFLs by leveraging the sale of Certified Emission Rights (CERs) under the Clean Development Mechanism (CDM) of the Kyoto Protocol. Under the scheme 60 Watt and 100 Watt incandescent Lamps will be replaced with 11-15 Watt and 20-25 Watt CFLs respectively.
• The scheme provides a unique platform for a robust public-private partnership between the
Government of India, private sector CFL suppliers and State level Electricity Distribution Companies (DISCOMs). It also provides the framework to distribute high quality CFLs at about `15 per piece to the households of the country.
• The companies that sell these bulbs at subsidized rates will be allowed to recover the remaining
amount through the sale of carbon credits under CDM of the Kyoto Protocol.
• Other efforts - Use of CFLs mandatory at public and commercial places: Government has made mandatory to use CFLs in shops, restaurants, and other
commercial establishments, in Delhi in 2006. The State Government, Tamilnadu, is contemplating several energy saving
measures, including making it mandatory for all government and business establishments and private residences to use CFLs, effective from January. In order to ensure easy availability of CFLs at low cost, the Government will market them through fair price shops at a subsidised rate for the benefit of below the
Debts and D/E Interest Cost & Interest Coverage
Source: Company & SKP Research
0
500
1000
1500
2000
2500
FY07 FY08 FY09 FY10 FY11E FY12E FY13E
Debt
(Rs m
n)
0.0
0.5
1.0
1.5
2.0
2.5
D/E
(x)
0
100
200
300
400
500
FY07 FY08 FY09 FY10 FY11E FY12E FY13E
Inte
rest
Cost
(Rs m
n)
0
2
4
6
8
10
Inte
rest
Cove
rage
(x)

Bajaj Electricals Ltd.
SKP Securities Ltd www.skpmoneywise.com Page 11 of 15
poverty line cardholders. The cost of CFLs in these outlets will be `15, whereas they cost nearly ` 100 each in the market.
Such efforts made by the Government provide huge opportunities for companies such as BEL, especially when the penetration level of the product is low.
5. Robust order book of E&P BU: E&P BU of BEL has the robust order book of ` 11.7 bn as on August 2010, which is 1.6x of FY10 revenues of E&P BU. The segment wise break-up of the same is as follows:
Segment Order Book (` bn) % Contribution TLT 6.5 55% Hugh Mast & Pole 0.9 8% Special Projects 4.3 37% Total 11.7 100%
Source: Company & SKP Research
6. Introduction of new products every now and then to penetrate deep in the competition and maintain steady growth: Competition is quite intense in consumer durables and luminaries segment putting pressure on topline and margins. BEL is introducing new products every now and then for maintaining steady topline and margins. Some of the recently introduced new products by the company are:
• Luminaries BU have successfully launched LED based luminaries for landscape and decorative lighting under the brand name ‘Green’ in FY09. The company to forayed into solid state lighting having electronic controls with this launch. This will also help LEDS for making space in general lighting.
• The luminaries BU have also forayed in to business of BMS in the year 2008. This is a strategic move of BEL to offer a wider product portfolio to the customers of luminaries and lighting BU. We expect the business to add ` 1-1.5 bn in the top line during the next 3-4 years.
• The company has also entered in to LED portable lights such as LED lanterns and torches last year. A strong network of distributors is in place to market these products in rural and urban areas.
• The company has also entered in to pressure cooker business. The company is targeting Tier-II & Tier-III cities and rural areas. Hawkins and Prestige are the strong players in the segment with the combined market share of around 45%.
• The Company has also designed, developed, type tested and supplied monopole towers (of 400
kv double circuit line with the height of 42 meter) for PGCIL for their project line from Dadri to Ballabhgarh. Advantages of monopoles over traditional lattice towers are:
ease of erection in areas where space is a constraint. Four foundations are required for the legs for lattice tower, which consumes land up to 100 sq.m. whereas a monopole can be erected in 5 sq.m. area. Such monopoles are widely used in European countries.
Margins in monopoles are three times better than traditional lattice towers.
• The Company is also looking at the water solution business.
With the help of these new products we expect that BEL will be able to mitigate the competition successfully resulting in to steady topline growth and maintaining the margins of 10.5% at EBIDTA levels.

Bajaj Electricals Ltd.
SKP Securities Ltd www.skpmoneywise.com Page 12 of 15
Key Concerns
1. Highly Competitive Industry: All the segments of BEL are highly competitive putting pressure on the topline and margins of the company. The Company is mitigating the risk by continuous introduction of new products and optimizing the utilization of its extensive distribution system of urban and rural areas.
2. Price volatility of metals: Metals (both ferrous and non ferrous) are the key raw material for the
company, which is highly price volatile. Any adverse movement in the prices may put negative impact on the margins of the company.
Financial Outlook
Top-line to grow with the CAGR of 23% in the coming 2-3 years: Net sales have gone up to ` 22.3 bn for FY10 by registering a growth of 26% due to strong distribution network, wide product portfolio and large service infrastructure. We expect the topline to grow with the CAGR of 23% in the coming two to three years, led by the growth in E&P BU (CAGR 27%) and consumer durable segment (CAGR 21%).
Maintaining margins: BEL has witnessed EBITDA margin of 10.5% in FY10. We expect margin to remain stable at 10.5% during the next 2-3 years on account of effective cost control measures taken by the company.
Source: Company & SKP Research
1822
34
41
27
0
5
10
15
20
25
30
35
40
45
FY09 FY10 FY11E FY12E FY13E
Net S
ales
(Rs b
n)
CAGR: 23%
Source: Company & SKP Research
894
1253
1559
1948
2366
5.7%
5.7%5.7%5.6%
5.1%
0
500
1000
1500
2000
2500
FY09 FY10 FY11E FY12E FY13E
PAT
(Rs m
n)
1%
2%
3%
4%
5%
6%
PAT
Mar
gin
(%)
1.8
2.3
2.9
4.33.6
10.3% 10.5% 10.5% 10.5% 10.5%
0
1
2
3
4
5
FY09 FY10 FY11E FY12E FY13E
EBID
TA (R
s m
n)
0.0%
2.0%
4.0%
6.0%
8.0%
10.0%
12.0%
EBID
TA M
argi
ns (%
)

Bajaj Electricals Ltd.
SKP Securities Ltd www.skpmoneywise.com Page 13 of 15
PAT margin has increased marginally to 5.6% in FY10 vis-à-vis 5.1% last year. We expect PAT margin to to be maintained at this level for next 2-3 years. EPS of the company is expected to grow from ` 12.8 in FY10 to ` 24.2 in FY12.
BEL has balanced business portfolio, which is both consumer centric and infrastructure oriented. The strong distribution network, a powerful brand, wide product portfolio, large infrastructure segment, excellent vendor base along with excellent channel partners continue to be the major strengths of the company. At the current market price of Rs 310, the stock seems to be undervalued based on discounted free cash flow approach. We recommend BUY rating on the stock with a target price of ` 378/- (22% upside) in 12 months.
Assumed Terminal Year FY20 Cash Flow at Terminal Year (` mn) 5,889.6 Cost of Equity (%) 12.0% WACC (%) 11.5% Discounted Terminal Value (` mn) 28,128.3 Present Value of FCFF till Terminal Year (` mn) 9,629.9 Enterprise Value to Firm (` mn) 37,758.1 Less Debt (` mn) 1,518.3 Add Cash (` mn) 612.2 Present Value of Equity (` mn) 36,852.0 No. of Equity Shares (mn) 97.5 Fair Value (`) 378.0
Valuation
Source: SKP Research Desk

Bajaj Electricals Ltd.
SKP Securities Ltd www.skpmoneywise.com Page 14 of 15
Income Statement
Particulars FY10 FY11E FY12E FY13ENet sales 22286.3 27468.5 33899.0 41179.0Growth (%) 26% 23% 23% 21%Material Consumed 16523.6 20354.1 25119.2 30513.7Personnel Expenses 971.5 1195.0 1481.8 1822.6Other Expenditure 2448.0 3021.5 3728.9 4529.7EBIDTA 2343.1 2897.8 3569.2 4313.1EBIDTA Margin (%) 10.5% 10.5% 10.5% 10.5%Growth (%) 28.9% 23.7% 23.2% 20.8%Depreciation 92.0 100.7 108.7 116.1EBIT 2406.8 2797.1 3460.4 4197.0EBIT Margin (%) 10.8% 10.2% 10.2% 10.2%Growth (%) 37.5% 16.2% 23.7% 21.3%Interest 314.5 319.0 374.0 449.1Amount Written Off 64.7 0.0 0.0 0.0Other Income 28.6 35.7 44.1 53.5EBT 2056.2 2513.8 3130.5 3801.4Tax 753.5 955.3 1189.6 1444.5PAT 1252.7 1558.6 1940.9 2356.9PAT Margin (%) 5.6% 5.7% 5.7% 5.7%Growth (%) 40.2% 24.4% 24.5% 21.4%EPS (Rs.) 12.8 16.0 19.9 24.2
Balance Sheet Particulars FY10 FY11E FY12E FY13EEquity Capital 196.7 196.7 196.7 196.7Reserves 4747.0 5960.3 7471.3 9306.0Net worth 4943.8 6157.1 7668.0 9502.7Long-term Loan 1518.3 1295.3 1496.1 1770.0Deferred Tax Liab. -5.0 -5.0 -5.0 -5.0Total Liabilities 6457.1 7447.3 9159.0 11267.7Net Fixed Assets 1016.2 1116.4 1207.7 1291.6Capital WIP 0.9 0.0 0.0 0.0Investments 365.6 365.6 365.6 365.6Inventories 2094.3 2746.9 3389.9 4323.8Accounts receivable 7506.9 9064.6 11424.0 14000.9Cash & Bank 612.2 342.1 258.3 242.0Other Current Assets 0.3 0.3 0.4 0.5Loan & Advances 1776.6 2191.2 2704.1 3284.8Current Assets 11990.3 14345.0 17776.7 21852.0Account payables 5171.3 6378.0 7871.1 9561.5Other Current Liab 1101.6 1358.6 1676.7 2036.8Provisions 643.0 643.1 643.2 643.2Curr. liab. & prov. 6915.9 8379.7 10191.0 12241.5Net Current Assets 5074.4 5965.3 7585.7 9610.5Total Assets 6457.1 7447.3 9159.0 11267.7
Cash Flow Statement Particulars FY10 FY11E FY12E FY13EProfit before Tax 2006.2 2513.9 3130.5 3801.4Add: Depreciation, Int. & Other Expenses 523.3 419.7 482.7 565.2Net changes in WC, tax interest -2481.5 -2116.4 -2893.8 -3485.7Cash flow from operating activities 48.0 817.2 719.4 881.0Capital expenditure -146.8 -200.0 -200.0 -200.0Investments, Sales of FA, Div. Recd & others -237.8 0.0 0.0 0.0Cash flow from investing activities -384.6 -200.0 -200.0 -200.0Cash flow from financing activities 410.5 -887.3 -603.2 -697.3Net Increase/Decrease in Cash & Cash Equivalents 74.0 -270.1 -83.8 -16.3Opening Cash Balance 538.2 612.2 342.1 258.3Closing Cash Balance 612.2 342.1 258.3 242.0
Key Ratios Particulars FY10 FY11E FY12E FY13EValuation Ratios P/E 24.1 19.4 15.6 12.8P/Cash EPS 8.1 6.5 5.3 4.4P/BV 6.1 4.9 3.9 3.2EV/EBIDTA 17.5 13.3 10.8 8.8EV/Sales 1.8 1.4 1.1 0.9Earnings Ratios OPM 10.8% 10.2% 10.2% 10.2%NPM 5.6% 5.7% 5.7% 5.7%ROCE 37.2% 37.5% 37.8% 37.2%ROE 25.3% 25.3% 25.3% 24.8%Balance Sheet Ratios Current Ratio 1.7 1.7 1.7 1.8Debt/Equity 0.3 0.2 0.2 0.2Debtor days 107 110 110 113Creditors Days 76 77 77 77Inventory Days 43 43 45 46FA/Turnover 22 25 28 32
Financials (` mn)
Bajaj Electricals Ltd.
SKP Securities Ltd www.skpmoneywise.com Page 13 of 15
Notes:
The above analysis and data are based on last available prices and not official closing rates. SKP Research is also available on Bloomberg, Thomson First Call & Investext Myiris, Moneycontrol, Tickerplant and ISI Securities. DISCLAIMER: This document has been issued by SKP Securities Ltd (SKP), a stock broker registered with and regulated by Securities & Exchange Board of India, for the information of its clients/potential clients and business associates/affiliates only and is for private circulation only, disseminated and available electronically and in printed form. Additional information on recommended securities may be made available on request. This document is supplied to you solely for your information and no matter contained herein may be reproduced, reprinted, sold, copied in whole or in part, redistributed or passed on, directly or indirectly, to any other person for any purpose, in India or into any other country without prior written consent of SKP. The distribution of this document in other jurisdictions may be strictly restricted and/ or prohibited by law, and persons into whose possession this document comes should inform themselves about such restriction and/ or prohibition, and observe any such restrictions and/ or prohibition. If you are dissatisfied with the contents of this complimentary document or with the terms of this Disclaimer, your sole and exclusive remedy is to stop using the document and SKP shall not be responsible and/ or liable in any manner. Neither this document nor the information or any opinion expressed therein should be construed as an investment advice or offer to anybody to acquire, subscribe, purchase, sell, dispose of, retain any securities or derivatives related to such securities or an offer to sell or the solicitation of an offer to purchase or subscribe for any investment or as an official endorsement of any investment. Any recommendation or view or opinion expressed on investments in this document is not intended to constitute investment advice and should not be intended or treated as a substitute for necessary review or validation or any professional advice. The views expressed in this document are those of the analyst which are subject to change and do not represent to be an authority on the subject. SKP may or may not subscribe to any and/ or all the views expressed herein. It is the endeavor of SKP to ensure that the analyst(s) use current, reliable, comprehensive information and obtain such information from sources, which the analyst(s) believes to be reliable. However, such information may not have been independently verified by SKP or the analyst(s). The information, opinions and views contained within this document are based upon publicly available information, considered reliable at the time of publication, which are subject to change from time to time without any prior notice. The Document may be updated anytime without any prior notice to anybody. SKP makes no guarantee, representation or warranty, express or implied; and accepts no responsibility or liability as to the accuracy or completeness or correctness of the information in this Report. SKP, its Directors, affiliates and employees do not accept any liability whatsoever, direct or indirect, that may arise from the use of the information or recommendations herein. Please note that past performance is not necessarily a guide to evaluate future performance. SKP or its affiliates, may, from time to time render advisory and other services to companies being referred to in this document and receive compensation for the same. SKP and/or its affiliates, directors and employees may trade for their own account or may also perform or seek to perform investment banking or underwriting services for or relating to those companies and may also be represented in the supervisory board or on any other committee of those companies or may sell or buy any securities or make any investment, which may be contrary to or inconsistent with this document. This document should be read and relied upon at the sole discretion and risk of the reader. The value of any investment made at your discretion based on this document or income there from may be affected by changes in economic, financial and/ or political factors and may go down as well as up and you may not get back the full or the expected amount invested. Some securities and/ or investments involve substantial risk and are not suitable for all investors. Neither SKP nor its affiliates or their directors, employees, agents or representatives/associates, shall be responsible or liable in any manner, directly or indirectly, for information, views or opinions expressed in this document or the contents or any errors or discrepancies herein or for any decisions or actions taken in reliance on the document or inability to use or access our service or this document or for any loss or damages whether direct or indirect, incidental, special or consequential including without limitation loss of revenue or profits or any loss or damage that may arise from or in connection with the use of or reliance on this document or inability to use or access our service or this document.
SKP Securities Ltd Contacts Research Sales Mumbai Kolkata Mumbai Kolkata Phone 022 2281 9012 033 4007 7000 022 2281 1015 033 4007 7400 Fax 022 2283 0932 033 4007 7007 022 2283 0932 033 4007 7007 E-mail [email protected] [email protected] [email protected]
Member: NSE BSE NSDL CDSL NCDEX* MCX* MCX-SX FPSB *Group Entities INB/INF: 230707532, BSE INB: 010707538, CDSL IN-DP-CDSL-132-2000, DPID: 021800, NSDL IN-DP-NSDL: 222-2001, DP ID: IN302646, ARN: 0006, NCDEX: 00715, MCX: 31705, MCX-SX: INE 260707532
Equities Derivatives Commodities Currency Demat Services Mutual Funds Insurance Financial Planning Online Trading
Page 15 of 15