Kindergarten PYP Unit: Growing and Changing Software: Kidspiration.
Upload
octavia-andrea-richardsonCategory
view
219download
0
InspirationInspireDataKidspiration
Available in•Tech 204•Tech 210•Success Connection

InspirationAllows students to plan, research and
complete projects visually. With the integrated Diagram and Outline
Views, students create graphic organizers and expand topics into writing. Improves skills in:Planning and organizing Researching and evaluating Comprehending and communicating

Starting a New DiagramClick Diagram
buttonType something
for main idea symbol. Main idea symbol is starting point for your work
Add ideas with RapidFire tool

Add Unlinked Ideas• Select main topic• Choose “Select
Without Links” beside the RapidFire Button
• Type ideasOR
• Simply point and type

SymbolsSelect ideaType in search
words for symbol on symbol palette
Choose symbol and it will associate with idea
ORBrowse through
the libraries

Adding Links with Link Button

Labeling Links and Adding Notes

Outline ViewClick on Outline button to switch between Outline and Diagram viewTopics and subtopics can be added in this view alsoNotes can be added

Finishing with InspirationClick on File / Export to Word Processor to move
to a Word ProcessorUse the Quick Start Tutorial for advanced
traininghttp://inspiration.com/download/pdf/
I8QuickStart.pdf

InspireDataAllows students to examine data and explore
relationships. Data moves with the click of an icon. Use dynamic Venn, bar, stack, pie and axis
plots to interpret information and draw conclusions.
InspireData helps students successfully: Build data literacy Develop analytical skills Strengthen critical thinking
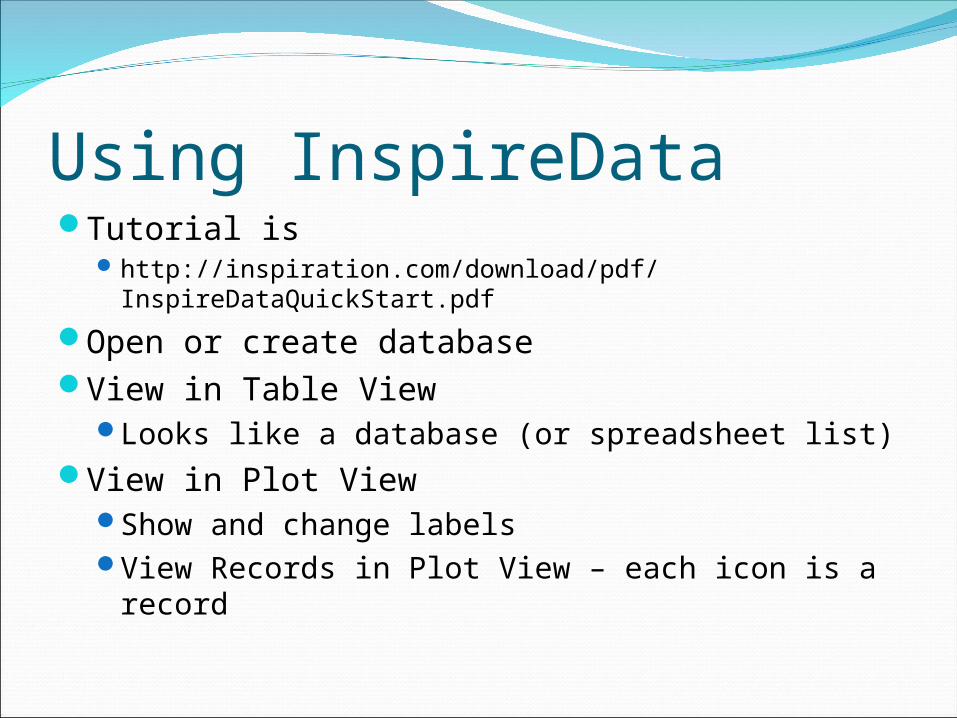
Using InspireDataTutorial is
http://inspiration.com/download/pdf/InspireDataQuickStart.pdf
Open or create databaseView in Table View
Looks like a database (or spreadsheet list)View in Plot View
Show and change labelsView Records in Plot View – each icon is a
record

Table View

Venn PlotsCompare and analyze relationships between
sets of dataClick on Venn Plot icon at bottom or screen
Change field, operator and value to desired relationships, press enter and watch icons move
Can add another Venn loop to compare two sets of data at once

Venn PlotsHours sleep less than 8
Hours sleep less than 8ANDWake process is hard

Add Color for More MeaningClick on Color by FieldChoose desired field

Stack PlotDivides the values within one field into
categories, then organizes the icons that fall into each category into stacks.
Can divide the data into categories by selecting from multiple stack plot types. By representing an additional variable on the Y
axis, students can easily see the differences between the individual groups.
To see the relationship between the length of time a student sleeps and the wake process, for example, you could use a parallel Stack plot.

Stack PlotsHours Sleep
Adding Wake Process shows that the fewer hours a student sleeps, the harder it is to wake up.

Axis PlotAxis plots let you create scatter plots, which
are a great way to find and investigate correlations.
For example, you could see if there was a relationship between amount of sleep and age.

Axis PlotsOlder students tend to get less sleep than younger Add a Line of Best Fit

Pie PlotShows how many records in your table share
a common attributeSections are determined by the values in the
field you assign to the pie, and the icons fall accordingly into these sections

Pie PlotsWake Process
Multiple pies to compare gender also

How to Get DataFrom existing databases in InspireData as we
have done in this short tutorialCreate your own database
Type in data you have collectedImport data (such as from a web site)Enter data from an e-survey created from within
InspireDataStep-by-step instructions are given in the
tutorial located at:http://inspiration.com/download/pdf/
InspireDataQuickStart.pdf

Making a Slide ShowA Slide Show is a great way to document and
present work. Each slide captures a “live” view of the data, which means that you can continue to change and work with the captured plots when viewing your slides.
Step-by-step instructions are given on the tutorial site

KidspirationCreated for K-5 learners, Kidspiration develops
thinking, literacy and numeracy skills using proven visual learning principles. In reading and writing, Kidspiration strengthens word recognition, vocabulary, comprehension and written expression. With new visual math tools, students build reasoning and problem solving skills.
Kidspiration helps K-5 learners to: Develop strong thinking skills Strengthen reading and writing skills Build conceptual understanding in math

Web CastsEngaging Students in Civics and Government with the Presidential Election and InspireData™
View this archived webcast now
Building Data Literacy Skills with Radish Plants and InspireData
View this archived webcast now