Insolation Lab Matt’s Meteorology Class. Claim With this lab you will observe how Solar Insolation...
13
Insolation Lab Insolation Lab Matt’s Meteorology Class Matt’s Meteorology Class
-
Upload
eunice-quinn -
Category
Documents
-
view
219 -
download
0
Transcript of Insolation Lab Matt’s Meteorology Class. Claim With this lab you will observe how Solar Insolation...
Insolation LabInsolation Lab
Matt’s Meteorology ClassMatt’s Meteorology Class
ClaimClaim
• With this lab you will observe how Solar Insolation affects our planet.
Definiton of Insolation: the rate of solar radiation per unit of a surface.
In other words: How much solar radiation is a spot on earth actually getting?
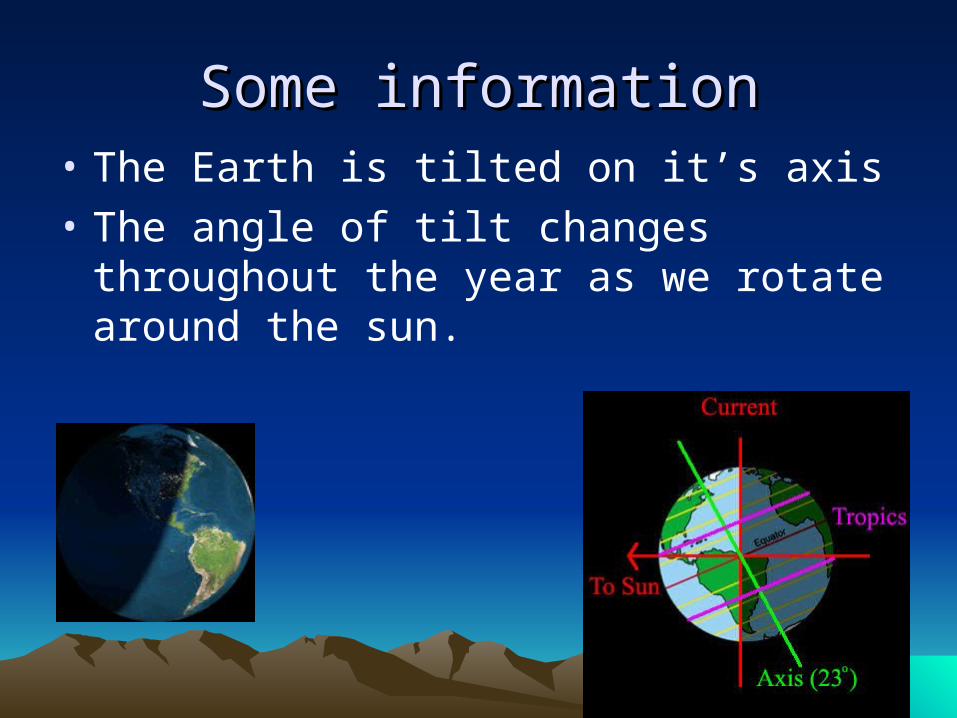
Some informationSome information• The Earth is tilted on it’s axis
• The angle of tilt changes throughout the year as we rotate around the sun.

Remember, the earth rotates around the sun once per year.
Our Summer
(More light on Northern Hemisphere)
Our Winter
(More light on Southern Hemisphere)
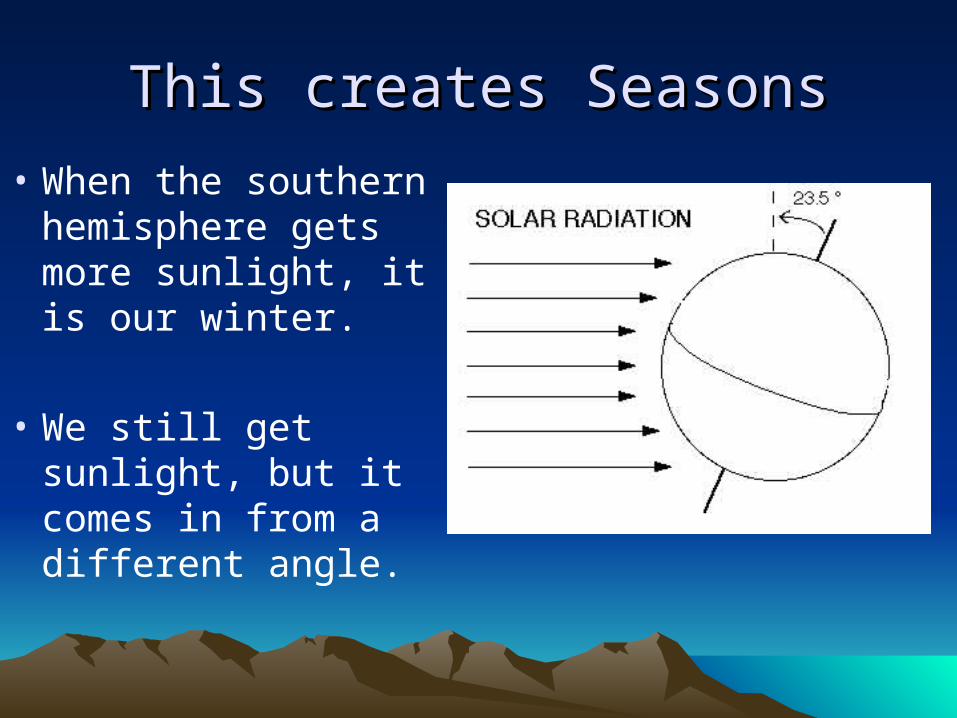
This creates SeasonsThis creates Seasons
• When the southern hemisphere gets more sunlight, it is our winter.
• We still get sunlight, but it comes in from a different angle.
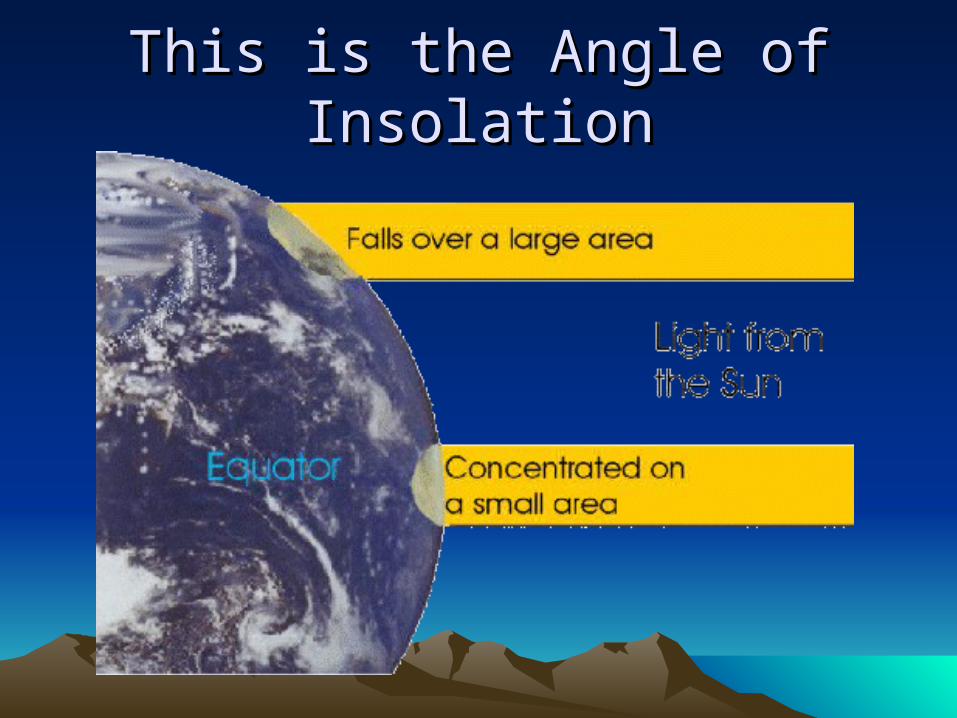
This is the Angle of InsolationThis is the Angle of Insolation
Evidence - MaterialsEvidence - Materials
This is what you need to complete this assignment:
1. Flashlight
2. Graph Paper
3. Lab report with data table
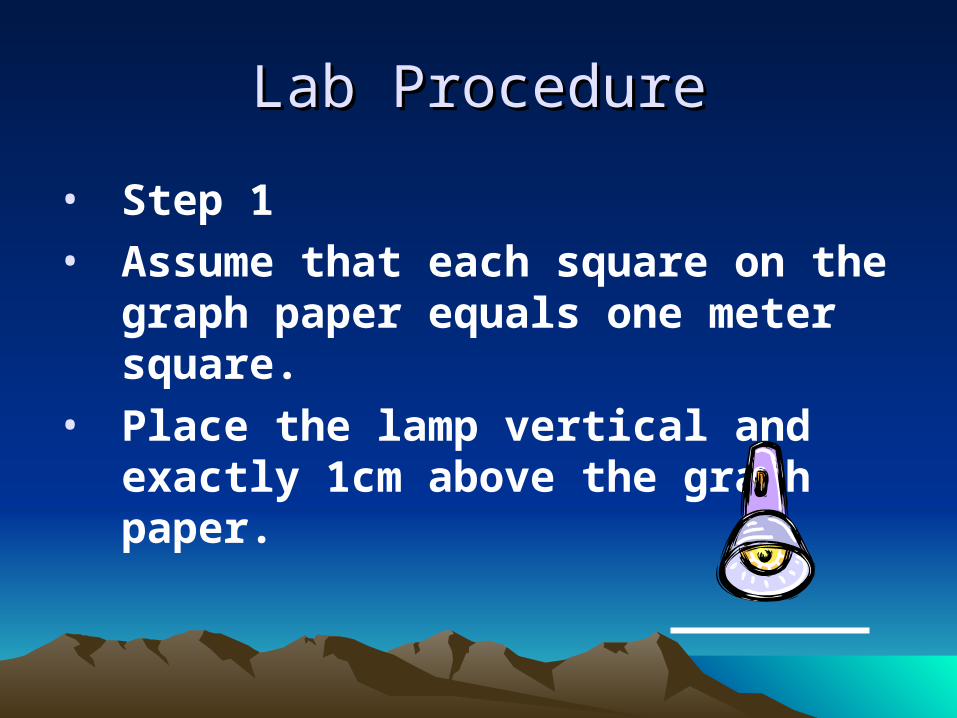
Lab ProcedureLab Procedure
• Step 1
• Assume that each square on the graph paper equals one meter square.
• Place the lamp vertical and exactly 1cm above the graph paper.
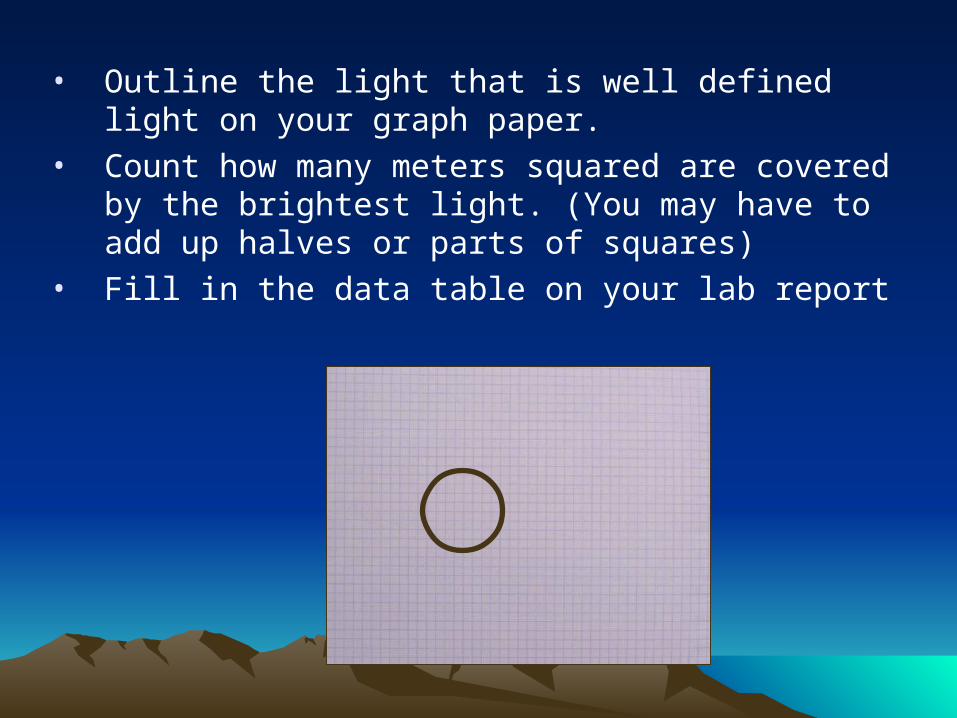
• Outline the light that is well defined light on your graph paper.
• Count how many meters squared are covered by the brightest light. (You may have to add up halves or parts of squares)
• Fill in the data table on your lab report
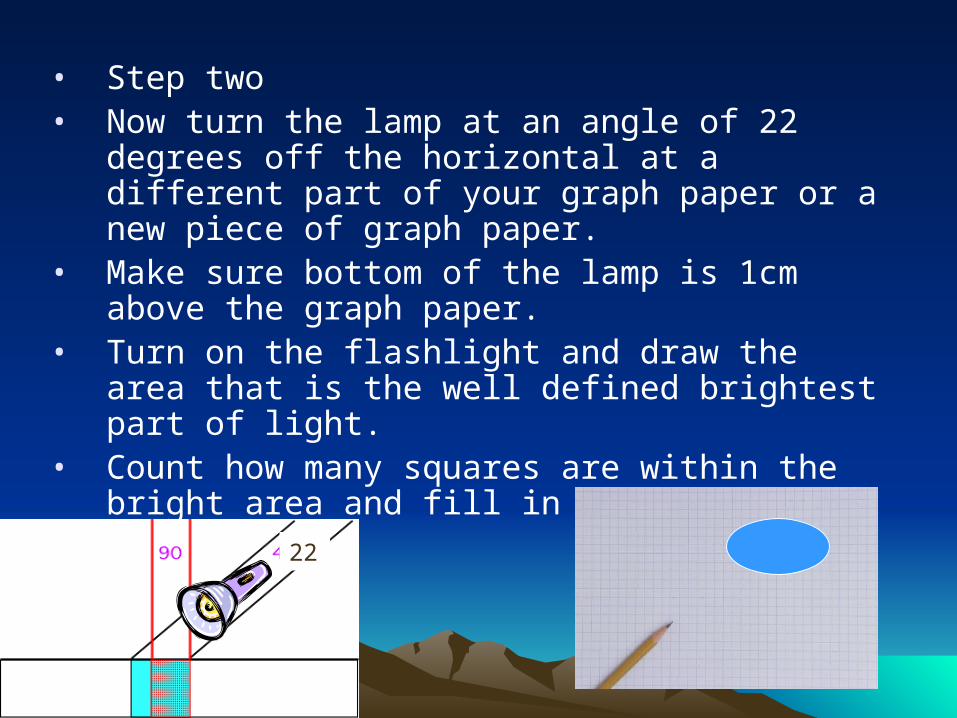
• Step two• Now turn the lamp at an angle of 22 degrees
off the horizontal at a different part of your graph paper or a new piece of graph paper.
• Make sure bottom of the lamp is 1cm above the graph paper.
• Turn on the flashlight and draw the area that is the well defined brightest part of light.
• Count how many squares are within the bright area and fill in the data table.
22
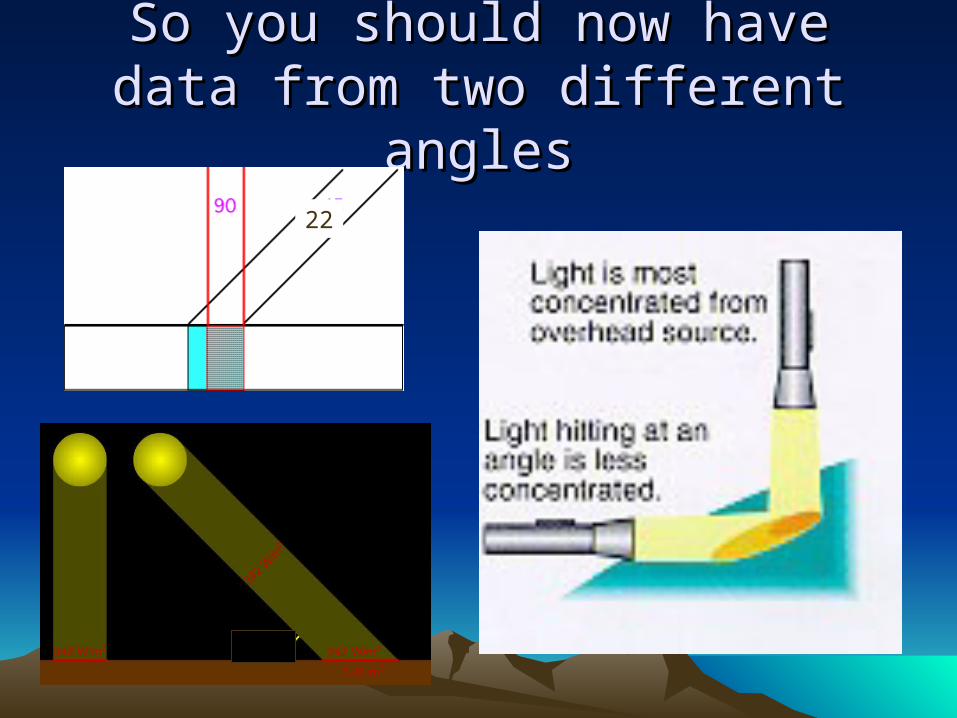
So you should now have data from So you should now have data from two different anglestwo different angles
22
• Step 3
• Assume the flashlight puts out 100 watts per day.
• Compute how many watts per meter squared per day each square of graph paper will receive.
Example:
If your light covered 5 squares on your graph paper, you would use the following equation.
100 ÷ 5 = 20 watts/ m2
ReasoningReasoning
Answer the questions.
1. How does the angle of insolation affect temperature?
2. How does the angle of insolation affect seasons?
3.Which locations on earth get more solar radiation and which get less radiation AND WHY?