Insights on Single Family Office Executive Compensation 2018... · deferred bonus/incentive...
36
Appropriate and competitive compensation is a key component of recruiting and retaining single family office (SFO) executives. This 2017/2018 report provides an update to the inaugural 2015 SFO Executive Compensation survey with enhanced peer group comparisons and practices. This data and analysis on four executive positions can serve as a valuable tool for family offices as they consider and plan for the significant expense of compensation and benefits. Insights on Single Family Office Executive Compensation Research provides peer group comparisons of compensation and benefits practices. Inside: Key Findings Profile of Participating Firms Services Provided Investment Approach Employment Practices Compensation Practices Benefit Practices Actions to Consider
Transcript of Insights on Single Family Office Executive Compensation 2018... · deferred bonus/incentive...

Appropriate and competitive compensation is a key component of recruiting and retaining single family office (SFO) executives.
This 2017/2018 report provides an update to the inaugural 2015 SFO Executive Compensation survey with enhanced peer group comparisons and practices.
This data and analysis on four executive positions can serve as a valuable tool for family offices as they consider and plan for the significant expense of compensation and benefits.
Insights on Single Family Office Executive Compensation Research provides peer group comparisons of compensation and benefits practices.
Inside:
Key Findings
Profile of Participating Firms
Services Provided
Investment Approach
Employment Practices
Compensation Practices
Benefit Practices
Actions to Consider

2
* Botoff Consulting is a third-party firm not affiliated with Fidelity.
FORGEFORGE is a national, noncommercial network of regional family office groups.
Fidelity Family Office ServicesFidelity Family Office Services was established in 2004 to serve the sophisticated needs of single family offices, wealthy families, and the advisors who serve them. We provide custody, brokerage, investment, and reporting services. Clients choose to work with us because we are cost-effective, deliver outstanding service, offer objective guidance, and provide access to institutional capabilities.
Botoff ConsultingBotoff Consulting, LLC, is an independent compensation consulting firm specializing in working with family offices, family business enterprises, foundations, and wealth management firms. The firm offers customized compensation and benefits consulting services for both executives and broad-based employee groups. Botoff Consulting was established in 2014, with a goal to bring better compensation data to the family office, private/family enterprise, and investment firm markets.
About the StudyThe 2017/2018 SFO Executive Compensation Study was conducted in conjunction with FORGE (Family Office Regional Group Executives).
Led by Fidelity Family Office Services and Botoff Consulting, LLC,* the 2017/2018 Single Family Office (SFO) Executive Compensation Survey focused on four key executive positions typically found in family offices: Chief Executive Officer (CEO), Chief Investment Officer (CIO), Chief Financial Officer (CFO), and Chief Operating Officer.
Participation was by invitation only, and respondents included 269 SFOs providing data on 408 executives. Data is presented for five categories of assets under management (AUM) by position: $1 billion or more, $500 million–$999 million, $300 million–$499 million, $100 million–$299 million, and less than $100 million. The AUM categories are slightly revised from the 2015 survey to better capture data for family offices with AUM below $100 million.
The online survey was conducted from May 12 through July 26, 2017, and was administered by an independent third-party research firm not affiliated with Fidelity Investments. The data was analyzed by Botoff Consulting, LLC.* Compensation data was collected reflecting 2017 base salary data, and bonuses paid for 2016 performance and 2015 performance.

3
Key Findings• Firms with higher AUM support more family
members but also have a higher number of employees, resulting in a greater ratio of employees to family members.
• As family office AUM grows, family offices typically will transition from family members serving in executive roles to employing non–family members.
• Compensation for executives is directly correlated with AUM, especially from a total direct compensation perspective.
• Family member compensation is generally less than non–family member—family member CEOs make 13% less base salary and 23% less total direct compensation in family offices with less than $500M in AUM than their non–family counterparts.
• Approximately one-third of executives reported in the study have employment agreements in place—resulting in a departure from best practices.
• Almost all family offices awarded base salary increases for 2017, with nearly 40% of family offices reporting increases that outpace the national average.
• Eighty-two percent of participating family offices report awarding bonuses for 2016 performance.
• The use of formalized annual incentive plans is a growing trend; however, a majority of family offices still award discretionary bonuses, creating a departure from best practices.
• Half of family offices reported the use of long-term incentives for their executives, with a majority using either one or two forms of long-term incentives.
• Overall, co-investment opportunity and deferred bonus/incentive compensation are the most prominent vehicles used for long-term incentive plans.
• Some firms report not using vesting requirements, which may lessen the value of the LTI plan as a retention vehicle.
Table of Contents
PROFILE OF PARTICIPATING FIRMS
4
SERVICES PROVIDED
7
INVESTMENT APPROACH
8
EMPLOYMENT PRACTICES
9
COMPENSATION PRACTICES
11
BENEFIT PRACTICES
18
ACTIONS TO CONSIDER
20
EXPLANATION OF DATA
21
POSITION DESCRIPTIONS
22
COMPENSATION DETAIL BY POSITION
23
EXECUTIVE BENEFITS DETAIL BY POSITION
32

4
Location There was a good geographic distribution of family offices across the country.
Northeast 26% (68)
Southeast 15% (41)
Central/Midwest 17% (45)
Southwest 17% (44)
Mountain/West 9% (23)
West Coast 17% (44)
Four firms did not report on the family office location.
FAMILY OFFICE PARTICIPANTS—BY AUM FAMILY OFFICE PARTICIPANTS—BY NET WORTH
FAMILY OFFICE AUM TOTAL NET WORTH OF FAMILY
AUM % OF PARTICIPANTS NET WORTH % OF PARTICIPANTS
$1 billion or more 25.1% $1 billion or more 40.8%
$500 million–$999 million 19.5% $500 million–$999 million 21.1%
$300 million–$499 million 15.0% $300 million–$499 million 13.6%
$100 million–$299 million 26.2% $100 million–$299 million 19.6%
Less than $100 million 14.2% Less than $100 million 4.9%
PROFILE OF PARTICIPATING FIRMS With 269 firms reporting data on 408 executives, the survey findings represent good dispersion of family offices across the AUM tiers, and a large base of family office executives that enhances the quality of the findings by position and by AUM.

5
Roles of Family Office ExecutivesFamily office executives were matched to survey positions based on primary responsibilities, as job titles vary widely. Nearly half of the family offices reported data for only one executive, while 4% reported data for all four positions.
Data on the 408 executives was reported for the following four positions:
Chief Executive Officers (CEOs): 147
Chief Investment Officers (CIOs): 92
Chief Financial Officers (CFOs): 115
Chief Operating Officers (COOs): 54
269FAMILY OFFICES REPORTING
408EXECUTIVES
ROLES OF FAMILY OFFICE EXECUTIVES
CEO/President only
CIO only
CFO only
COO only
48%
72%
62%
63%
Many family office executives wear multiple hats, and it is common for there to be a blending of roles, or for executive to hold multiple positions. In general, CEOs are the most likely to wear multiple hats, while other executive roles (CIO, CFO, COO) tend to focus on the responsibilities of that position only.
PERCENTAGE OF CEOS PERFORMING ADDITIONAL ROLES
CEO only
CEO and CIO
CEO and COO
CEO and CFO
48%
34%
31%
25%

6
Firm StructuresMost of the responding family offices are stand-alone entities, with the remainder embedded within an operating company. More than one-third have a board of advisors/directors, with more than three out of four of these boards providing oversight of compensation governance.
Firm CharacteristicsTypically, the complexity of a family office increases as AUM increases, and the average number of in-house staff and family members supported increases accordingly. However, the number of generations supported by the family offices remained relatively flat across AUM tiers.
FIRM CHARACTERISTICS
ALL$1 BILLION OR MORE
$500 MILLION– $999 MILLION
$300 MILLION– $499 MILLION
$100 MILLION– $299 MILLION
LESS THAN $100 MILLION
Average number of in-house staff 12.9 28.9 11.0 7.1 6.7 4.2
Average number of family members supported
22.0 36.4 17.5 15.6 17.7 16.4
Average ratio of staff to family members 0.6 0.8 0.6 0.5 0.4 0.3
Average number of generations supported 2.6 2.7 2.6 2.7 2.5 2.6
DIFFERENT FIRM STRUCTURES
35% HAVE A BOARD OF ADVISORS OR DIRECTORS.
88% OF PARTICIPANTS ARE STAND-ALONE ENTITIES.
12% ARE EMBEDDED WITHIN AN OPERATING COMPANY.
77% OF THE FAMILY OFFICE BOARDS PROVIDE OVERSIGHT OF COMPENSATION GOVERNANCE.
7
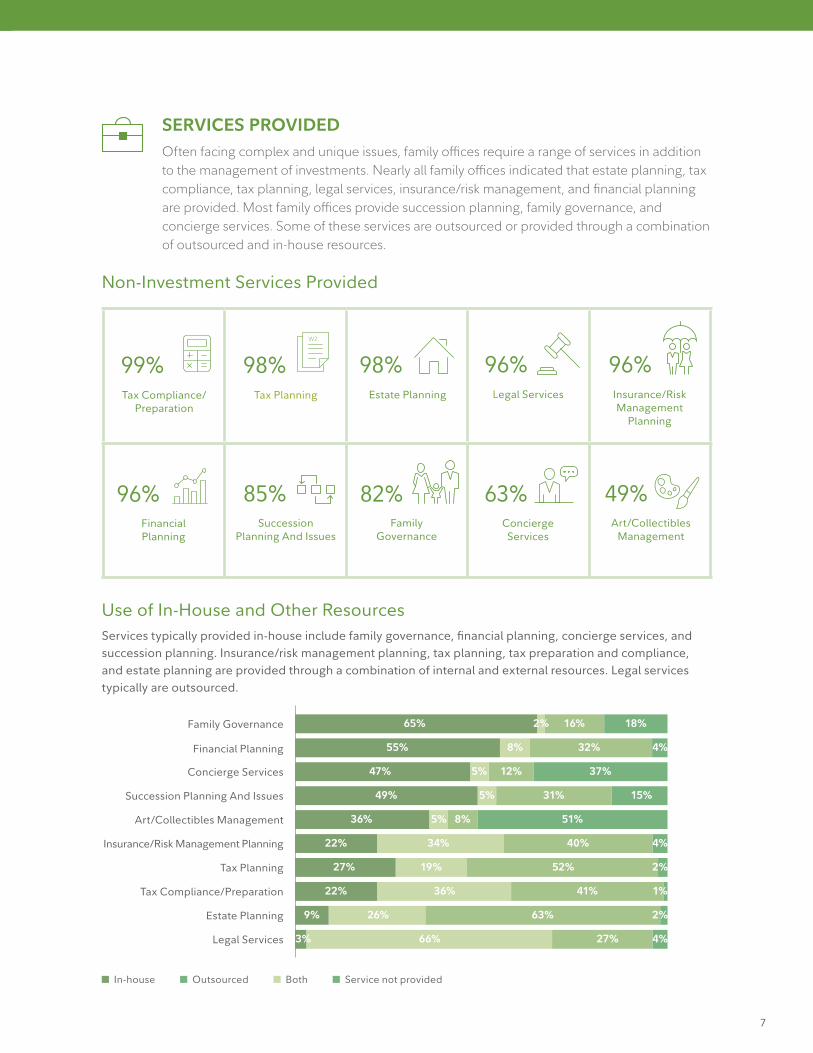
SERVICES PROVIDED Often facing complex and unique issues, family offices require a range of services in addition to the management of investments. Nearly all family offices indicated that estate planning, tax compliance, tax planning, legal services, insurance/risk management, and financial planning are provided. Most family offices provide succession planning, family governance, and concierge services. Some of these services are outsourced or provided through a combination of outsourced and in-house resources.
Non-Investment Services Provided
Concierge Services
63% Art/Collectibles
Management
49% Family
Governance
82% Succession
Planning And Issues
85% Financial Planning
96%
Use of In-House and Other ResourcesServices typically provided in-house include family governance, financial planning, concierge services, and succession planning. Insurance/risk management planning, tax planning, tax preparation and compliance, and estate planning are provided through a combination of internal and external resources. Legal services typically are outsourced.
In-house Outsourced Both Service not provided
Family Governance
Financial Planning
Concierge Services
Succession Planning And Issues
Art/Collectibles Management
Insurance/Risk Management Planning
Tax Planning
Tax Compliance/Preparation
Estate Planning
Legal Services
65%
55%
47%
49%
36%
22%
27%
22%
9%
2%
8%
5%
5%
5%
34%
19%
36%
26%
66%
16%
32%
12%
31%
8%
40%
52%
41%
63%
27%
18%
37%
15%
51%
4%
4%
2%
1%
2%
4%3%
Tax Compliance/Preparation
99% Tax Planning
98% Estate Planning
98% Legal Services
96% Insurance/Risk Management
Planning
96%
8
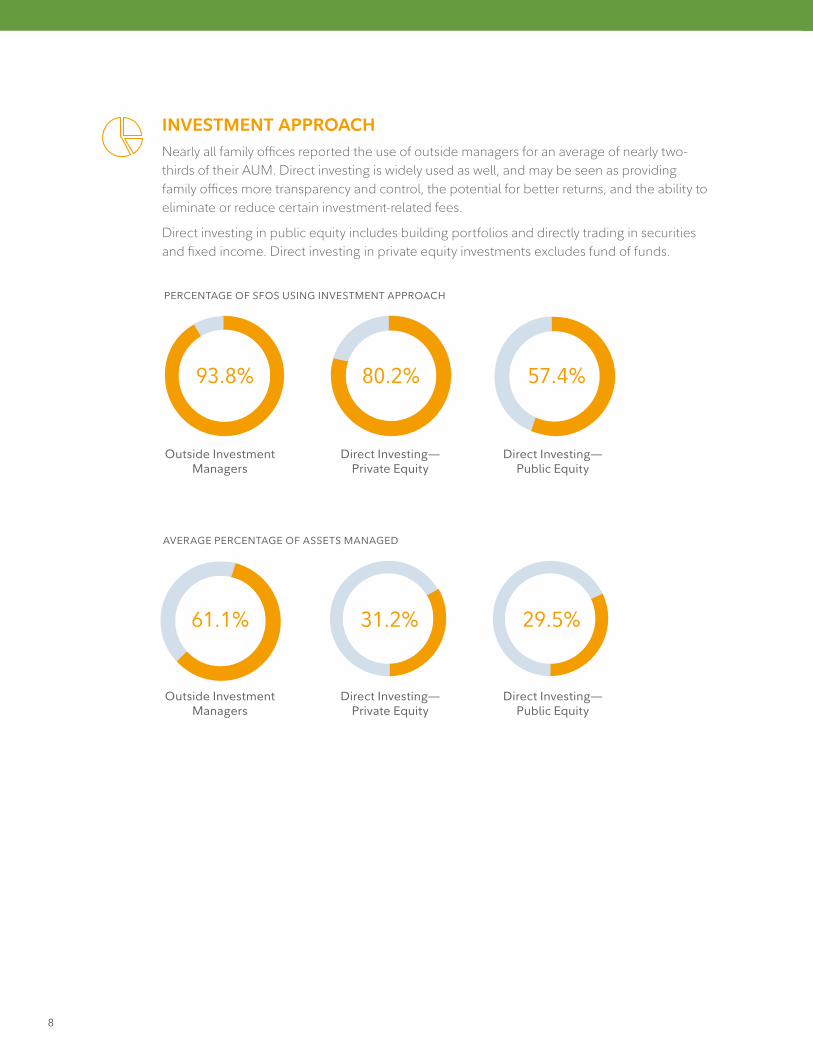
INVESTMENT APPROACH Nearly all family offices reported the use of outside managers for an average of nearly two-thirds of their AUM. Direct investing is widely used as well, and may be seen as providing family offices more transparency and control, the potential for better returns, and the ability to eliminate or reduce certain investment-related fees.
Direct investing in public equity includes building portfolios and directly trading in securities and fixed income. Direct investing in private equity investments excludes fund of funds.
AVERAGE PERCENTAGE OF ASSETS MANAGED
Direct Investing— Public Equity
Direct Investing—Private Equity
Outside Investment Managers
PERCENTAGE OF SFOS USING INVESTMENT APPROACH
Direct Investing—Private Equity
Direct Investing—Public Equity
Outside Investment Managers
80.2% 57.4%
61.1% 31.2% 29.5%
93.8%

9
EMPLOYMENT PRACTICES
Employment AgreementsEmployment agreements typically specify the obligations and expectations of the company and the employee, along with details about the structure of the compensation package. They are a recommended way to minimize potential future disputes, and are more likely to be used for executives or key employees hired from outside the firm.
According to research conducted by Botoff Consulting, the use of employment agreements is a growing trend among investment firms and family offices. These agreements are most common for CEO and CIO positions and, while considered a best practice, fewer than 40% of family offices report using employment agreements for executives. Employment agreements are often implemented with newly hired executives, so their prevalence in family offices will likely increase with staff growth and as a result of attrition.
EMPLOYEE AGREEMENTS
ALL$1 BILLION OR MORE
$500 MILLION– $999 MILLION
$300 MILLION– $499 MILLION
$100 MILLION– $299 MILLION
LESS THAN $100 MILLION
CEO 38.8% 50.0% 46.9% 18.5% 42.9% 23.5%
CIO 34.8% 30.0% 42.9% 31.3% 46.2% 25.0%
CFO 28.7% 20.0% 29.2% 17.6% 39.4% 36.4%
COO 31.5% 21.1% 12.5% 66.7% 63.6% 10.0%
Employment agreement provisions most prevalent in family offices include:*
• Employment arrangements: this will define the job title and responsibilities, terms of the agreement, and timing of renewals or extensions of the agreement.
• Compensation arrangements: this will address starting salary, but also timing of potential salary increases, use of a signing bonus, annual incentive compensation, long-term incentive compensation, and situations where compensation could potentially be decreased.
• Executive benefits: a core set of health and welfare benefits is typically offered to all employees and not defined in detail in an employment agreement, but executive benefits, such as supplemental life insurance, supplemental disability insurance or car allowance, will often be defined in an employment agreement.
• Termination and severance provisions: an important element of employment agreements is to proactively define the different types of termination that could occur, when a termination would be considered “for cause” or “not for cause,” and what impact each has on all elements of compensation and benefits. Additionally, it is important to define severance provisions up front, and how that might be impacted by different termination scenarios, including as a result of retirement, death, or disability.
• Non-competition/non-solicitation: used to create a covenant not to compete after termination of employment, or place limitations on soliciting employees, for a set amount of time. Additional considerations include enforceability and state laws that may supersede the provisions of the agreement.
• Confidentiality restrictions: often addressed by a separate confidentiality agreement, but if not, they are an important element to include in an employment agreement.
Other provisions commonly found in the employment agreements of public company executives that would less likely be used by RIAs and MFOs include golden parachute provisions, directors and officers (D&O) insurance, and incorporation of change-of-control provisions.
*Based on research by Botoff Consulting.
10
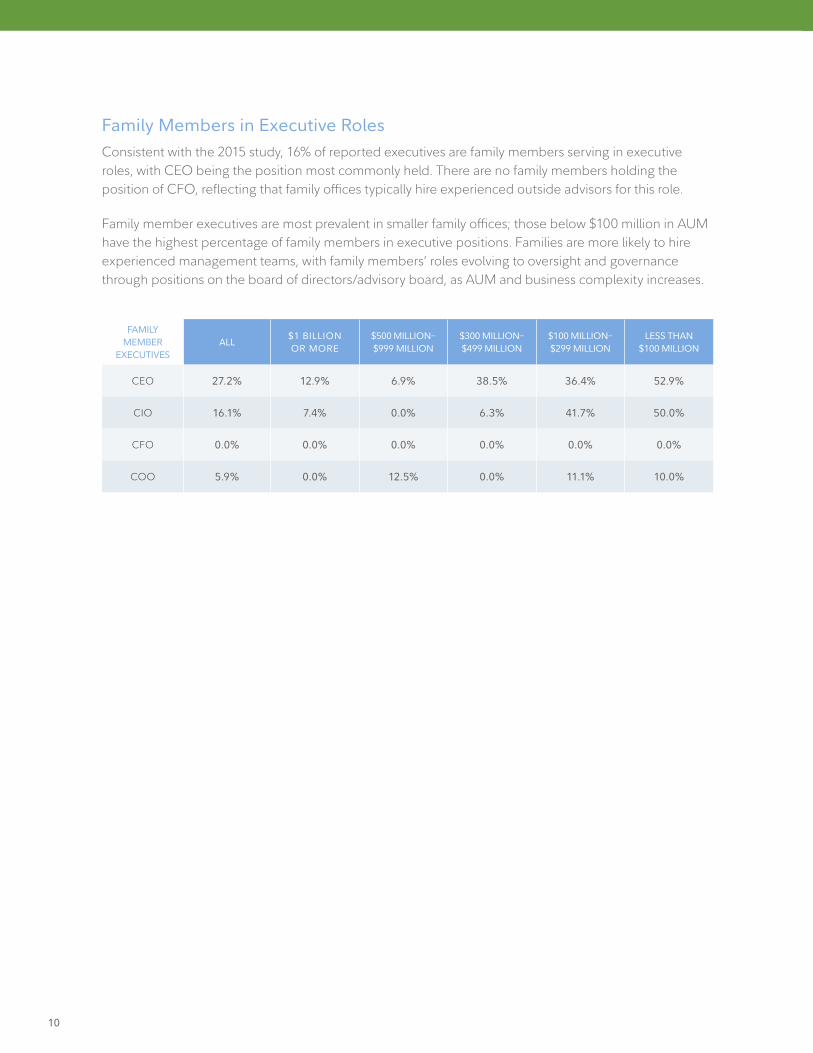
Family Members in Executive RolesConsistent with the 2015 study, 16% of reported executives are family members serving in executive roles, with CEO being the position most commonly held. There are no family members holding the position of CFO, reflecting that family offices typically hire experienced outside advisors for this role.
Family member executives are most prevalent in smaller family offices; those below $100 million in AUM have the highest percentage of family members in executive positions. Families are more likely to hire experienced management teams, with family members’ roles evolving to oversight and governance through positions on the board of directors/advisory board, as AUM and business complexity increases.
FAMILY MEMBER
EXECUTIVESALL
$1 BILLION OR MORE
$500 MILLION– $999 MILLION
$300 MILLION– $499 MILLION
$100 MILLION– $299 MILLION
LESS THAN $100 MILLION
CEO 27.2% 12.9% 6.9% 38.5% 36.4% 52.9%
CIO 16.1% 7.4% 0.0% 6.3% 41.7% 50.0%
CFO 0.0% 0.0% 0.0% 0.0% 0.0% 0.0%
COO 5.9% 0.0% 12.5% 0.0% 11.1% 10.0%

11
*WorldatWork, 2016–2017 Salary Budget Survey.
COMPENSATION PRACTICES
Annual Reviews Most family offices review and adjust base salaries each year, with the practice being most prevalent for those with AUM of $1 billion or more. This practice is consistent with the overall U.S. market, which averages just over 12 months between salary increases for all employee groups.*
ANNUAL REVIEWS
ALL$1 BILLION OR MORE
$500 MILLION– $999 MILLION
$300 MILLION– $499 MILLION
$100 MILLION– $299 MILLION
LESS THAN $100 MILLION
Annually 86.7% 93.3% 87.8% 78.9% 84.1% 86.5%
Biannually 3.6% 3.3% 2.0% 7.9% 3.2% 2.7%
Other 9.7% 3.3% 10.2% 13.2% 12.7% 10.8%
2017 Salary Increases
Nearly all family offices provided salary increases in 2017. Overall, 33% of SFOs awarded salary increases between 2% and 3.9% for 2017, consistent with the U.S. average of 3.1% reported by WorldatWork.*
However, nearly 40% of firms report salary increases between 4% and 10% or more, which outpaces the national average. This practice increases to more than half of family offices with more than $1 billion in AUM. Family offices will need to keep pace within the single family office industry if they wish to not only attract, but also retain, top talent.
2017 SALARY INCREASES
ALL$1 BILLION OR MORE
$500 MILLION– $999 MILLION
$300 MILLION– $499 MILLION
$100 MILLION– $299 MILLION
LESS THAN $100 MILLION
Increases have not yet been granted in 2017 20.2% 11.7% 20.4% 27.0% 19.0% 29.7%
Less than 2% 8.5% 5.0% 8.2% 8.1% 9.5% 10.8%
2%–3.99% 33.2% 26.7% 34.7% 40.5% 42.9% 18.9%
4%–5.99% 24.7% 33.3% 26.5% 16.2% 17.5% 29.7%
6%–9.99% 6.9% 10.0% 8.2% 2.7% 4.8% 8.1%
10% or more 6.5% 13.3% 2.0% 5.4% 6.3% 2.7%
12
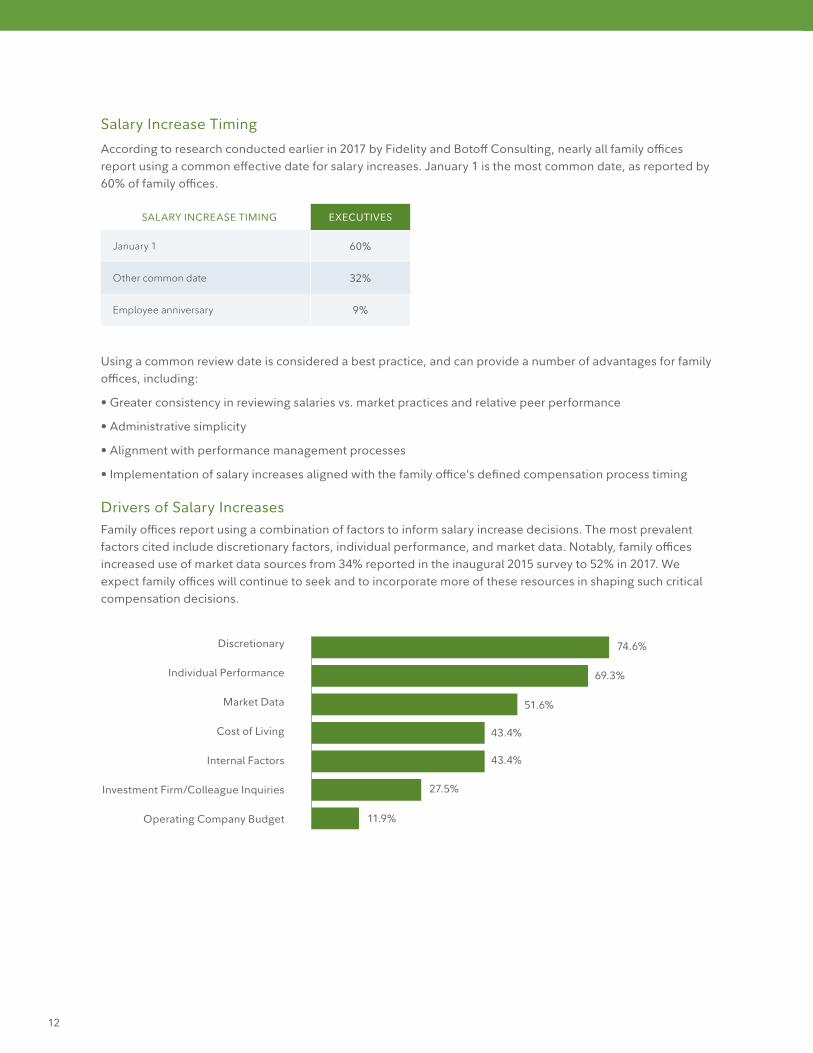
Salary Increase Timing
According to research conducted earlier in 2017 by Fidelity and Botoff Consulting, nearly all family offices report using a common effective date for salary increases. January 1 is the most common date, as reported by 60% of family offices.
SALARY INCREASE TIMING EXECUTIVES
January 1 60%
Other common date 32%
Employee anniversary 9%
Using a common review date is considered a best practice, and can provide a number of advantages for family offices, including:
• Greater consistency in reviewing salaries vs. market practices and relative peer performance
• Administrative simplicity
• Alignment with performance management processes
• Implementation of salary increases aligned with the family office’s defined compensation process timing
Drivers of Salary IncreasesFamily offices report using a combination of factors to inform salary increase decisions. The most prevalent factors cited include discretionary factors, individual performance, and market data. Notably, family offices increased use of market data sources from 34% reported in the inaugural 2015 survey to 52% in 2017. We expect family offices will continue to seek and to incorporate more of these resources in shaping such critical compensation decisions.
Discretionary
Individual Performance
Market Data
Cost of Living
Internal Factors
Investment Firm/Colleague Inquiries
Operating Company Budget
74.6%
69.3%
51.6%
43.4%
43.4%
27.5%
11.9%

13
Annual Incentives The use of annual incentives for executives in family offices has increased steadily in recent years. As we reported in 2015, 77.8% of family offices paid bonuses to executives in 2013; this increased to 81.9% for 2016.
The use of annual incentives is consistently higher in firms with AUM of $1 billion or more. This is consistent with other survey data which indicates that the larger a firm is by AUM, which typically corresponds to a greater numbers of employees, the more likely it is to adopt more structured compensation processes with less variability in timing and awarding of incentives.
ANNUAL INCENTIVES
ALL$1 BILLION OR MORE
$500 MILLION– $999 MILLION
$300 MILLION– $499 MILLION
$100 MILLION– $299 MILLION
LESS THAN $100 MILLION
Bonus Paid for 2016 81.9% 88.3% 81.6% 76.3% 79.4% 81.1%
Bonus Paid for 2015 80.6% 90.0% 79.6% 78.9% 77.8% 73.0%
Methods for Determining Annual Incentives Most family offices award annual bonuses. However, only 40% of family offices report alignment with best practices in using a formalized plan or a mix of discretionary decision-making and a formalized plan, compared to 60% of multi-family offices reporting this practice.*
The typical practice in family offices has been to award bonuses, primarily on a discretionary basis. However, as the industry matures, compensation arrangements for executives are becoming more sophisticated and practices more formalized. Using a more structured incentive plan, versus providing discretionary bonuses, is an opportunity for family offices to use compensation dollars to drive target performance and to improve alignment between the family and family office’s strategy. Use of discretionary bonuses is a missed opportunity for goal and performance alignment.
Use of formalized plans is more prevalent for executives than staff, reflecting the use of firm-level performance metrics by which executives often are measured. Where discretionary bonuses are usually determined at the end of a performance period, more formalized or structured plans will define certain criteria at the beginning of the performance period. This can include:
• Participation: Establishes which positions or individuals will participate in an incentive plan
• Incentive opportunity: Often defined as a percentage of base salary
• Performance criteria: Outlines which performance categories will be considered for earning an incentive
• Performance targets: Establishes performance expectations, potentially at threshold, target, or maximum defined performance and payout levels. Typically incorporates key financial metrics such as investment returns vs. key benchmarks, but may also include more qualitative measures. The mix of quantitative vs. qualitative metrics, as well as which financial metrics are used, is established to align with the family’s strategic direction, varying substantially between family offices
• Performance period: Defines the performance period that will be assessed (typically aligned with calendar year, but not in all cases), and the expected timing of payouts—often dependent upon the timing of investment or other year-end financial results
* Fidelity and Botoff Consulting, 2017 RIA and MFO Compensation Study.

14
TYPES OF ANNUAL
INCENTIVESALL
$1 BILLION OR MORE
$500 MILLION– $999 MILLION
$300 MILLION– $499 MILLION
$100 MILLION– $299 MILLION
LESS THAN $100 MILLION
Discretionary Bonuses 59.2% 50.0% 61.2% 58.3% 67.8% 60.0%
Formalized Incentive Plan 13.4% 17.2% 10.2% 11.1% 13.6% 14.3%
A Mix of Both 27.3% 32.8% 28.6% 30.6% 18.6% 25.7%
Long-Term Incentive Plan PrevalenceThe use of long-term incentive (LTI) plans is another growing trend. As the industry matures, compensation arrangements and practices for executives are becoming more formalized and more sophisticated. The most common LTI vehicles include:
LTI VEHICLE DESCRIPTION
Co-Investment Opportunity Allows participants to make a minority investment alongside the family into investment vehicles to which the participants would not normally have access.
Deferred Bonus/Incentive Compensation
Incentive compensation opportunity that is based on longer-term performance and typically vests over time and pays out in the future.
Carried Interest Provides participants with a share of investment profits in excess of a specified return, typically in alternative investments such as private equity or hedge funds.
Leverage The use of borrowed capital to increase the potential return of a co-investment. Leverage provided from the firm will typically be a recourse loan, which means the loan must be paid back. In rarer circumstances, the loan may be structured as non-recourse, in which the loan is not required to be repaid but collateral may be required.
Phantom Equity Provides participants some of the benefits of stock ownership without actually giving them any company stock; sometimes referred to as shadow stock.
Operating Company Equity Stock awards or other company ownership.
Overall, 51% of family offices report the use of one or more LTI vehicles. Co-investment opportunity is the most prevalent form of LTI plan used by family offices, followed by deferred bonus/incentive compensation.
Co-Investment Opportunity
Deferred Bonus/Incentive Compensation
Carried Interest
Leverage through Recourse Loans
Phantom Equity
Operating Company Equity
Leverage through Non-Recourse Loans
36.7%
24.1%
20.0%
10.6%
9.4%
4.5%
3.3%
15
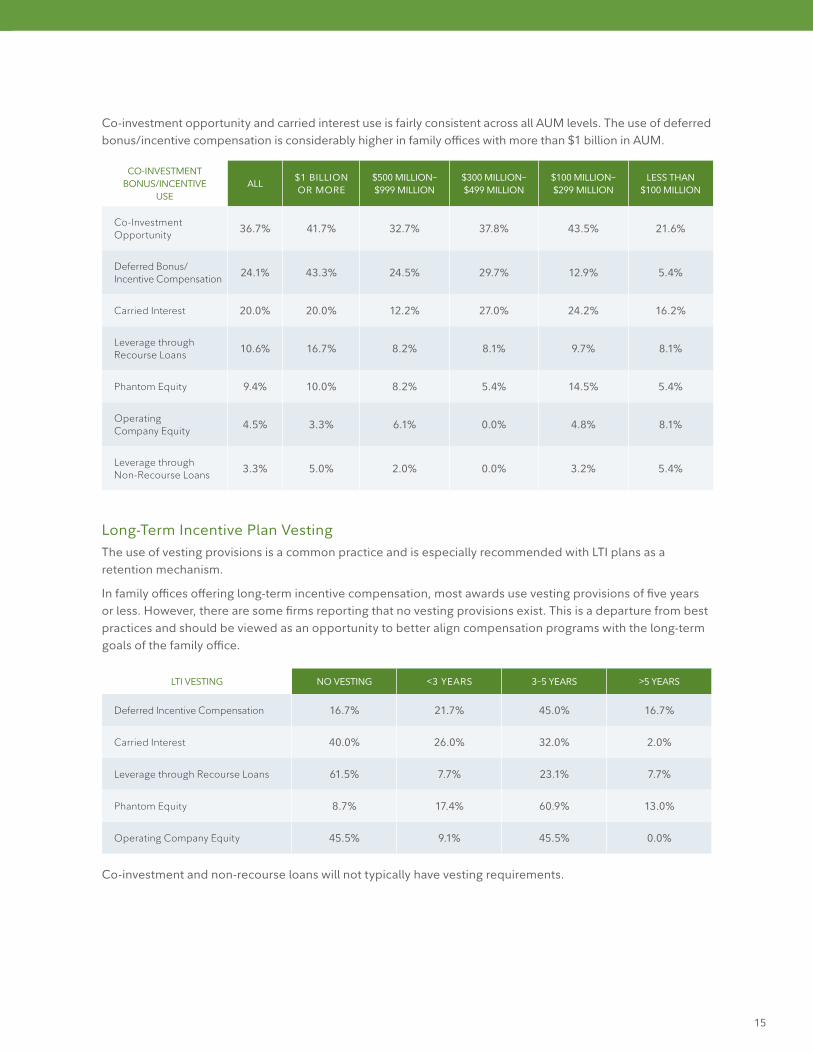
Co-investment opportunity and carried interest use is fairly consistent across all AUM levels. The use of deferred bonus/incentive compensation is considerably higher in family offices with more than $1 billion in AUM.
CO-INVESTMENT BONUS/INCENTIVE
USEALL
$1 BILLION OR MORE
$500 MILLION– $999 MILLION
$300 MILLION– $499 MILLION
$100 MILLION– $299 MILLION
LESS THAN $100 MILLION
Co-Investment Opportunity 36.7% 41.7% 32.7% 37.8% 43.5% 21.6%
Deferred Bonus/Incentive Compensation 24.1% 43.3% 24.5% 29.7% 12.9% 5.4%
Carried Interest 20.0% 20.0% 12.2% 27.0% 24.2% 16.2%
Leverage through Recourse Loans 10.6% 16.7% 8.2% 8.1% 9.7% 8.1%
Phantom Equity 9.4% 10.0% 8.2% 5.4% 14.5% 5.4%
Operating Company Equity 4.5% 3.3% 6.1% 0.0% 4.8% 8.1%
Leverage through Non-Recourse Loans 3.3% 5.0% 2.0% 0.0% 3.2% 5.4%
Long-Term Incentive Plan VestingThe use of vesting provisions is a common practice and is especially recommended with LTI plans as a retention mechanism.
In family offices offering long-term incentive compensation, most awards use vesting provisions of five years or less. However, there are some firms reporting that no vesting provisions exist. This is a departure from best practices and should be viewed as an opportunity to better align compensation programs with the long-term goals of the family office.
LTI VESTING NO VESTING <3 YEARS 3–5 YEARS >5 YEARS
Deferred Incentive Compensation 16.7% 21.7% 45.0% 16.7%
Carried Interest 40.0% 26.0% 32.0% 2.0%
Leverage through Recourse Loans 61.5% 7.7% 23.1% 7.7%
Phantom Equity 8.7% 17.4% 60.9% 13.0%
Operating Company Equity 45.5% 9.1% 45.5% 0.0%
Co-investment and non-recourse loans will not typically have vesting requirements.

16
Family Member Executive CompensationFamily member executives are often paid less than non–family member executives. However, the variance is primarily in family offices with AUM below $500 million, where family member CEOs make 13% less in base salary, and 23% less in total direct compensation than non–family member CEOs. Differences in total direct compensation are more exaggerated because family member executives typically don’t participate in annual or long-term incentive plans.
Please note that family member executives not receiving competitive compensation levels were excluded from this analysis. However, these instances were few and represented only 4.7% of reported CEOs, 2.1% of reported CIOs, and 1.8% of reported COOs.
TOTAL DIRECT COMPENSATION:
23% less
BASE SALARY:
13% less
In family offices with AUM below $500M, Family member CEOs make less than non–family member CEOs:

17
Geographic DifferentialsCompensation levels of most U.S. cities fall within 5% of the national average, and the market for executives is considered to be a more national market with a national labor pool. However, there are some locations where premiums are typical, which may reflect (though not directly align with) an increased cost of living.
Broader compensation data for positions in investment and professional services firms was compared at a national level versus key cities represented in this survey to determine representative geographic differentials.* Premiums are not consistent from city to city, so it’s important to understand practices within a local market.
These premiums, representing cities and their greater metropolitan areas, are presented to assist family offices in determining how the survey data, which is presented at a national level, can be interpreted for various locations. This is not an exhaustive report of all U.S. cities, rather it is based on the locations of survey participants. Locations with variances of more than 5% from the national average are presented; locations not indicated are within 5% of the national average.
* ERI Economic Resource Institute, Inc.
5%–10%
20%–30%
Seattle
SanFrancisco
LosAngeles
10%–15%
Dallas 5%–10%
Philadelphia 5%–10%
Washington, DC
10%–15%
New York(Manhattan)20%–30%
Greenwich15%–20%
Boston10%–15%
Chicago 5%–10%

18
Prevalence of Executive Benefits by AUM
EXECUTIVE BENEFITS ALL$1 BILLION OR MORE
$500 MILLION– $999 MILLION
$300 MILLION– $499 MILLION
$100 MILLION– $299 MILLION
LESS THAN $100 MILLION
Supplemental Life Insurance 31.4% 36.5% 28.9% 29.4% 36.7% 20.0%
Supplemental Disability Insurance 30.5% 30.8% 33.3% 23.5% 40.8% 16.7%
SERP 16.7% 23.1% 22.2% 17.6% 12.2% 3.3%
Auto/Auto Allowance 10.0% 7.7% 6.7% 8.8% 16.3% 10.0%
Club Membership 8.6% 9.6% 4.4% 8.8% 12.2% 6.7%
Use of Family’s Private Aircraft 2.4% 0.0% 2.2% 2.9% 4.1% 3.3%
BENEFIT PRACTICES
*WorldatWork, 2016–2017 Salary Budget Survey.
Supplemental Life Insurance
Supplemental Disability Insurance
SERP
Auto/Auto Allowance
Club Membership
Use of Family’s Private Aircraft
31.4%
30.5%
16.7%
10.0%
8.6%
2.4%
The use of executive-level benefits and perquisites is less prevalent in family offices when compared to other industries.* For example:
• 42% of U.S. companies provide executives with a company car or car allowance,* compared with only 10% of the participating family offices.
• 44% of U.S. companies offer a nonqualified deferred pension plan,* which can be a meaningful benefit for executives but is not provided by many family offices.
Supplemental life insurance, supplemental disability insurance, and Supplemental Executive Retirement Plan (SERP) are the most common executive benefits provided by family offices.
Percentage of Firms Offering Executive Benefits
19
*WorldatWork and American Benefits Institute, Trends in 401(k) Plans.
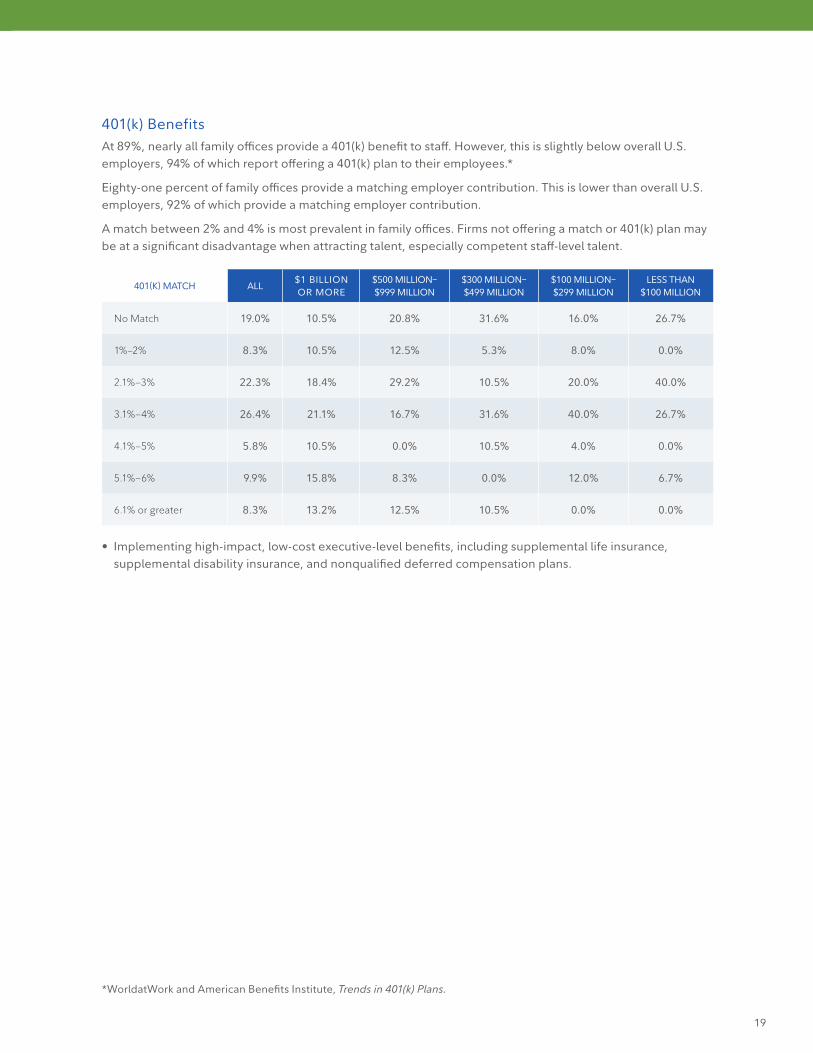
401(k) BenefitsAt 89%, nearly all family offices provide a 401(k) benefit to staff. However, this is slightly below overall U.S. employers, 94% of which report offering a 401(k) plan to their employees.*
Eighty-one percent of family offices provide a matching employer contribution. This is lower than overall U.S. employers, 92% of which provide a matching employer contribution.
A match between 2% and 4% is most prevalent in family offices. Firms not offering a match or 401(k) plan may be at a significant disadvantage when attracting talent, especially competent staff-level talent.
401(K) MATCH ALL$1 BILLION OR MORE
$500 MILLION– $999 MILLION
$300 MILLION– $499 MILLION
$100 MILLION– $299 MILLION
LESS THAN $100 MILLION
No Match 19.0% 10.5% 20.8% 31.6% 16.0% 26.7%
1%–2% 8.3% 10.5% 12.5% 5.3% 8.0% 0.0%
2.1%–3% 22.3% 18.4% 29.2% 10.5% 20.0% 40.0%
3.1%–4% 26.4% 21.1% 16.7% 31.6% 40.0% 26.7%
4.1%–5% 5.8% 10.5% 0.0% 10.5% 4.0% 0.0%
5.1%–6% 9.9% 15.8% 8.3% 0.0% 12.0% 6.7%
6.1% or greater 8.3% 13.2% 12.5% 10.5% 0.0% 0.0%
• Implementing high-impact, low-cost executive-level benefits, including supplemental life insurance, supplemental disability insurance, and nonqualified deferred compensation plans.

20
ACTIONS TO CONSIDER
The 2017 SFO Executive Compensation Study presents a level of executive compensation data specific to single family offices that was previously unavailable. While every family office has unique dynamics, this comprehensive look at the landscape enables family offices to better benchmark their organization. It is a key tool family offices can use to plan for changes and to help ensure the competitiveness of their compensation programs and processes. This can help with not only attracting new talent, but also retaining current top performers who are expensive and difficult to replace.
To put insights from this report into practice, family offices should consider:
Reviewing all positions at the family offices to assess competitiveness of overall and individual-level compensation and benefit practices.
Incorporating the use of employment agreements, especially with executive-level positions, to define both employment and termination provisions and mitigate the risk of future disputes.
Ensuring that annual salary increases are competitive, not only with the U.S. market, but also with those of other family offices that are outpacing the national average.
Transitioning from the use of discretionary bonuses to a more structured annual incentive plan to better drive performance of executives and create alignment with the family and family office strategy.
Incorporating vesting provisions into all long-term incentive plans to better serve as a retention mechanism and protect the family office from payouts related to performance gains occurring after separation from service.
Implementing high-impact, low-cost executive-level benefits, including supplemental life insurance, supplemental disability insurance, and nonqualified deferred compensation plans.

21
EXPLANATION OF DATA
This section provides some qualifying explanations of the data presented and what the calculations represent.
ANNUAL INCENTIVE: This is the annual incentive or bonus paid to employees, typically for the prior year’s performance.
ANNUAL INCENTIVE ACTUAL: Expressed as a percentage of base salary, this reflects actual practices for executives who received an annual incentive for the prior year’s performance. Calculations exclude executives who did not receive an incentive payment for the prior year, and would be reflected as 0%.
ANNUAL INCENTIVE TARGET: This is the defined opportunity level for annual bonus/incentive, expressed as a percentage of base salary for executives with an annual incentive target.
BASE SALARY: This is the annual fixed compensation paid to executives.
FAMILY OFFICE, FAMILY OFFICES: This refers to the 269 family offices that participated in the survey.
LONG-TERM INCENTIVE (LTI): This is the annualized value of a bonus payment awarded to an employee (usually an executive), which typically vests over a period of three to five years.
LTI ACTUAL: Expressed as a percentage of base salary, this reflects the annualized value of long-term incentive awards for executives who received a long-term incentive award. Calculations exclude executives who did not receive an incentive payment for the prior performance period, and would be reflected as 0%.
SUPPLEMENTAL EXECUTIVE RETIREMENT PLAN (SERP): This is a nonqualified retirement plan for key employees that provides benefits above and beyond those covered under other qualified retirement plans, e.g., 401(k) plans.
TOTAL CASH COMPENSATION: This is base salary plus the bonus paid for the prior year.
TOTAL DIRECT COMPENSATION: This is base salary plus annual bonus plus the annual value of LTI.

22
POSITION DESCRIPTIONS
As the most senior position responsible for strategy and overall direction of the family office, the CEO oversees management of the family office and staff, and serves as the primary liaison with the family.
CEO
This executive-level position is responsible for the family’s investment strategy, buys and sells, and the hiring of new managers. He or she sources potential strategic investment opportunities, understands and manages the portfolio of assets, devises strategies for growth, and manages all investment-related relationships. He or she also manages the internal investment team, which may be responsible for direct investing in private and/or public equities. The position may report to the CEO/president, family principal, or family office board.
CIO
This top financial position is responsible for formulating financial policy and plans. He or she provides overall direction for the tax, insurance, budget, credit, and treasury functions, and ensures that financial transactions, policies, and procedures meet the organization’s short- and long-term objectives and regulatory body requirements. The position typically reports to the CEO/president, or may be the most senior family office position reporting to the family or board.
CFO
This position directs, coordinates, and administers all aspects of the family office operations in compliance with established policies and strategy. He or she has responsibility for, or influences, the development of policies regarding operations, and may also have direct oversight of staff functions, such as legal, technology, and human resources. The position typically reports to the CEO/president.
COO

23
COMPENSATION DETAIL BY POSITION

24
CHIEF EXECUTIVE OFFICER
$1 BILLION OR MORE # INCUMBENTS10TH
PERCENTILE25TH
PERCENTILEMEDIAN MEAN
75TH PERCENTILE
90TH PERCENTILE
Base Salary 32 $353,300 $400,000 $555,000 $597,600 $672,500 $990,000
Total Cash Compensation 32 $501,300 $572,900 $734,500 $980,800 $1,025,000 $1,950,000
Total Direct Compensation 32 $501,300 $577,100 $822,500 $1,130,100 $1,153,600 $2,515,400
INCENTIVE COMPENSATION — THOSE RECEIVING
Annual Incentive Target — % of Base 21 15% 25% 50% 51% 65% 100%
Annual Incentive Actual— % of Base 24 8% 25% 53% 106% 98% 123%
Long-Term Incentive Actual— % of Base 10 10% 19% 50% 75% 100% 189%
$500 MILLION–$999 MILLION # INCUMBENTS10TH
PERCENTILE25TH
PERCENTILEMEDIAN MEAN
75TH PERCENTILE
90TH PERCENTILE
Base Salary 29 $245,300 $300,000 $350,000 $373,200 $455,700 $518,000
Total Cash Compensation 29 $270,000 $350,000 $526,000 $607,000 $650,000 $1,252,500
Total Direct Compensation 29 $306,700 $400,000 $605,700 $635,200 $725,000 $1,252,500
INCENTIVE COMPENSATION — THOSE RECEIVING
Annual Incentive Target — % of Base 15 22% 36% 50% 59% 95% 100%
Annual Incentive Actual— % of Base 22 14% 20% 50% 85% 104% 223%
Long-Term Incentive Actual— % of Base 4 — — 30% 59% — —
$300 MILLION–$499 MILLION # INCUMBENTS10TH
PERCENTILE25TH
PERCENTILEMEDIAN MEAN
75TH PERCENTILE
90TH PERCENTILE
Base Salary 27 $246,000 $279,200 $346,000 $384,700 $402,100 $544,800
Total Cash Compensation 27 $265,000 $330,000 $388,000 $547,300 $535,400 $805,000
Total Direct Compensation 27 $265,000 $348,000 $410,000 $557,200 $535,400 $832,600
INCENTIVE COMPENSATION — THOSE RECEIVING
Annual Incentive Target — % of Base 14 25% 25% 40% 53% 89% 100%
Annual Incentive Actual— % of Base 17 22% 24% 32% 58% 75% 94%
Long-Term Incentive Actual— % of Base 5 — 5% 17% 18% 24% —

25
$100 MILLION–$299 MILLION # INCUMBENTS10TH
PERCENTILE25TH
PERCENTILEMEDIAN MEAN
75TH PERCENTILE
90TH PERCENTILE
Base Salary 33 $200,000 $225,000 $265,000 $305,500 $395,000 $491,400
Total Cash Compensation 33 $216,200 $270,000 $330,000 $351,300 $427,000 $518,000
Total Direct Compensation 33 $226,400 $280,000 $363,500 $367,100 $457,000 $540,600
INCENTIVE COMPENSATION — THOSE RECEIVING
Annual Incentive Target — % of Base 17 10% 19% 25% 34% 50% 59%
Annual Incentive Actual— % of Base 20 9% 12% 22% 31% 40% 56%
Long-Term Incentive Actual— % of Base 7 10% 12% 25% 31% 33% 63%
LESS THAN $100 MILLION # INCUMBENTS10TH
PERCENTILE25TH
PERCENTILEMEDIAN MEAN
75TH PERCENTILE
90TH PERCENTILE
Base Salary 17 $194,400 $200,000 $258,000 $292,200 $303,000 $462,000
Total Cash Compensation 17 $200,000 $216,000 $290,000 $334,100 $400,000 $535,400
Total Direct Compensation 17 $200,000 $216,000 $290,000 $343,000 $400,000 $535,400
INCENTIVE COMPENSATION — THOSE RECEIVING
Annual Incentive Target — % of Base 6 — 9% 18% 20% 24% —
Annual Incentive Actual— % of Base 8 6% 8% 21% 23% 35% 44%
Long-Term Incentive Actual— % of Base 1 — — — — — —
CHIEF EXECUTIVE OFFICER (Continued)

26
CHIEF INVESTMENT OFFICER
$1 BILLION OR MORE # INCUMBENTS10TH
PERCENTILE25TH
PERCENTILEMEDIAN MEAN
75TH PERCENTILE
90TH PERCENTILE
Base Salary 27 $300,000 $371,500 $460,000 $552,800 $560,000 $630,000
Total Cash Compensation 27 $432,200 $550,000 $675,000 $841,000 $827,500 $1,560,600
Total Direct Compensation 27 $456,200 $553,100 $684,000 $908,900 $1,085,000 $1,684,400
INCENTIVE COMPENSATION — THOSE RECEIVING
Annual Incentive Target — % of Base 18 20% 29% 50% 55% 72% 100%
Annual Incentive Actual— % of Base 23 18% 20% 50% 74% 113% 142%
Long-Term Incentive Actual— % of Base 6 — 10% 17% 63% 130% —
$500 MILLION–$999 MILLION # INCUMBENTS10TH
PERCENTILE25TH
PERCENTILEMEDIAN MEAN
75TH PERCENTILE
90TH PERCENTILE
Base Salary 21 $200,000 $250,000 $370,000 $397,700 $500,000 $636,000
Total Cash Compensation 21 $285,000 $332,500 $500,000 $632,800 $700,000 $1,140,000
Total Direct Compensation 21 $285,000 $332,500 $500,000 $634,400 $700,000 $1,140,000
INCENTIVE COMPENSATION — THOSE RECEIVING
Annual Incentive Target — % of Base 13 13% 30% 44% 48% 50% 100%
Annual Incentive Actual— % of Base 15 20% 24% 50% 88% 174% 200%
Long-Term Incentive Actual— % of Base 2 — — — — — —
$300 MILLION–$499 MILLION # INCUMBENTS10TH
PERCENTILE25TH
PERCENTILEMEDIAN MEAN
75TH PERCENTILE
90TH PERCENTILE
Base Salary 16 $185,000 $233,800 $311,000 $355,400 $406,300 $600,000
Total Cash Compensation 16 $232,200 $263,100 $412,500 $484,600 $603,800 $725,000
Total Direct Compensation 16 $232,200 $263,100 $421,300 $503,200 $603,800 $850,000
INCENTIVE COMPENSATION — THOSE RECEIVING
Annual Incentive Target — % of Base 8 28% 37% 59% 64% 100% 100%
Annual Incentive — Actual % of Base 10 21% 32% 52% 56% 84% 100%
Long-Term Incentive Actual— % of Base 2 — — — — — —

27
CHIEF INVESTMENT OFFICER (Continued)
$100 MILLION–$299 MILLION # INCUMBENTS10TH
PERCENTILE25TH
PERCENTILEMEDIAN MEAN
75TH PERCENTILE
90TH PERCENTILE
Base Salary 12 $175,500 $195,000 $212,500 $293,000 $325,000 $490,000
Total Cash Compensation 12 $200,000 $215,000 $260,000 $348,700 $392,500 $625,000
Total Direct Compensation 12 $200,000 $215,000 $260,000 $352,300 $408,500 $628,400
INCENTIVE COMPENSATION — THOSE RECEIVING
Annual Incentive Target — % of Base 8 6% 10% 28% 34% 50% 65%
Annual Incentive Actual— % of Base 9 10% 11% 26% 23% 30% 38%
Long-Term Incentive Actual— % of Base 1 — — — — — —
LESS THAN $100 MILLION # INCUMBENTS10TH
PERCENTILE25TH
PERCENTILEMEDIAN MEAN
75TH PERCENTILE
90TH PERCENTILE
Base Salary 12 $150,000 $151,900 $200,000 $217,200 $244,200 $250,000
Total Cash Compensation 12 $200,000 $200,000 $226,000 $284,900 $316,500 $498,600
Total Direct Compensation 12 $200,000 $200,000 $226,000 $284,900 $316,500 $498,600
INCENTIVE COMPENSATION — THOSE RECEIVING
Annual Incentive Target — % of Base 6 18% 23% 30% 41% 45% 75%
Annual Incentive Actual— % of Base 8 19% 28% 32% 54% 100% 100%
Long-Term Incentive Actual— % of Base 0 — — — — — —

28
CHIEF FINANCIAL OFFICER
$1 BILLION OR MORE # INCUMBENTS10TH
PERCENTILE25TH
PERCENTILEMEDIAN MEAN
75TH PERCENTILE
90TH PERCENTILE
Base Salary 27 $223,000 $255,600 $300,000 $322,500 $361,100 $467,000
Total Cash Compensation 27 $261,400 $335,500 $385,000 $409,600 $478,000 $572,000
Total Direct Compensation 27 $277,500 $335,500 $395,000 $437,600 $523,100 $653,600
INCENTIVE COMPENSATION — THOSE RECEIVING
Annual Incentive Target — % of Base 18 9% 16% 33% 33% 50% 50%
Annual Incentive Actual— % of Base 22 5% 20% 35% 38% 50% 69%
Long-Term Incentive Actual— % of Base 7 4% 7% 10% 37% 56% 85%
$500 MILLION–$999 MILLION # INCUMBENTS10TH
PERCENTILE25TH
PERCENTILEMEDIAN MEAN
75TH PERCENTILE
90TH PERCENTILE
Base Salary 18 $214,500 $234,000 $250,000 $282,800 $331,100 $406,000
Total Cash Compensation 18 $227,100 $267,500 $349,800 $396,200 $515,000 $597,500
Total Direct Compensation 18 $227,100 $267,500 $379,700 $400,800 $515,000 $597,500
INCENTIVE COMPENSATION — THOSE RECEIVING
Annual Incentive Target — % of Base 9 12% 18% 25% 41% 75% 80%
Annual Incentive Actual— % of Base 15 13% 20% 26% 51% 66% 122%
Long-Term Incentive Actual— % of Base 2 — — — — — —
$300 MILLION–$499 MILLION # INCUMBENTS10TH
PERCENTILE25TH
PERCENTILEMEDIAN MEAN
75TH PERCENTILE
90TH PERCENTILE
Base Salary 15 $164,800 $196,100 $231,000 $259,600 $314,500 $375,000
Total Cash Compensation 15 $209,800 $250,000 $312,000 $325,800 $381,800 $457,400
Total Direct Compensation 15 $209,800 $251,000 $312,000 $337,900 $431,800 $494,000
INCENTIVE COMPENSATION — THOSE RECEIVING
Annual Incentive Target — % of Base 9 11% 15% 25% 33% 50% 54%
Annual Incentive Actual— % of Base 13 13% 16% 26% 30% 34% 58%
Long-Term Incentive Actual— % of Base 4 — — 14% 14% — —
29
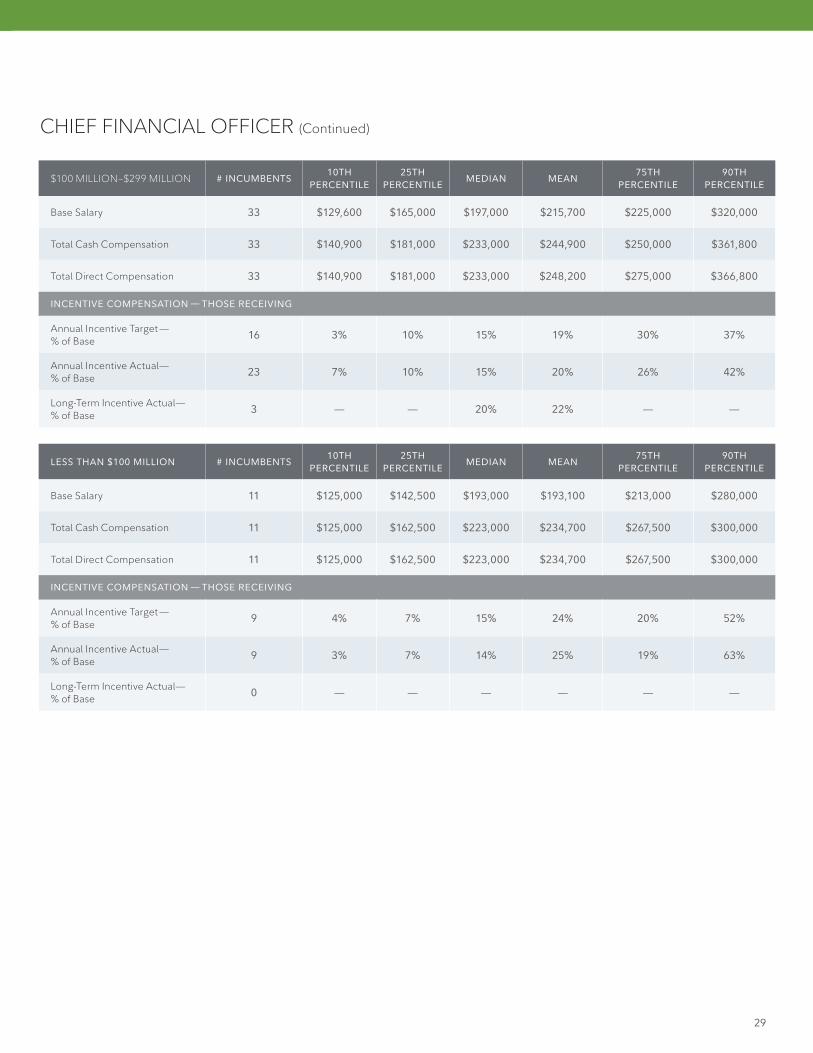
CHIEF FINANCIAL OFFICER (Continued)
$100 MILLION–$299 MILLION # INCUMBENTS10TH
PERCENTILE25TH
PERCENTILEMEDIAN MEAN
75TH PERCENTILE
90TH PERCENTILE
Base Salary 33 $129,600 $165,000 $197,000 $215,700 $225,000 $320,000
Total Cash Compensation 33 $140,900 $181,000 $233,000 $244,900 $250,000 $361,800
Total Direct Compensation 33 $140,900 $181,000 $233,000 $248,200 $275,000 $366,800
INCENTIVE COMPENSATION — THOSE RECEIVING
Annual Incentive Target — % of Base 16 3% 10% 15% 19% 30% 37%
Annual Incentive Actual— % of Base 23 7% 10% 15% 20% 26% 42%
Long-Term Incentive Actual— % of Base 3 — — 20% 22% — —
LESS THAN $100 MILLION # INCUMBENTS10TH
PERCENTILE25TH
PERCENTILEMEDIAN MEAN
75TH PERCENTILE
90TH PERCENTILE
Base Salary 11 $125,000 $142,500 $193,000 $193,100 $213,000 $280,000
Total Cash Compensation 11 $125,000 $162,500 $223,000 $234,700 $267,500 $300,000
Total Direct Compensation 11 $125,000 $162,500 $223,000 $234,700 $267,500 $300,000
INCENTIVE COMPENSATION — THOSE RECEIVING
Annual Incentive Target — % of Base 9 4% 7% 15% 24% 20% 52%
Annual Incentive Actual— % of Base 9 3% 7% 14% 25% 19% 63%
Long-Term Incentive Actual— % of Base 0 — — — — — —

30
CHIEF OPERATING OFFICER
$1 BILLION OR MORE # INCUMBENTS10TH
PERCENTILE25TH
PERCENTILEMEDIAN MEAN
75TH PERCENTILE
90TH PERCENTILE
Base Salary 19 $247,000 $287,500 $344,800 $533,300 $560,200 $1,030,000
Total Cash Compensation 19 $307,900 $384,800 $502,300 $705,400 $661,500 $1,583,000
Total Direct Compensation 19 $328,100 $393,100 $502,300 $708,200 $661,500 $1,583,000
INCENTIVE COMPENSATION — THOSE RECEIVING
Annual Incentive Target — % of Base 12 11% 24% 38% 49% 76% 100%
Annual Incentive Actual— % of Base 15 5% 13% 28% 46% 79% 99%
Long-Term Incentive Actual— % of Base 2 — — — — — —
$500 MILLION–$999 MILLION # INCUMBENTS10TH
PERCENTILE25TH
PERCENTILEMEDIAN MEAN
75TH PERCENTILE
90TH PERCENTILE
Base Salary 8 $142,700 $186,500 $200,000 $218,300 $258,800 $306,000
Total Cash Compensation 8 $192,800 $207,500 $310,000 $312,800 $334,500 $442,500
Total Direct Compensation 8 $192,800 $207,500 $310,000 $317,000 $334,500 $452,600
INCENTIVE COMPENSATION — THOSE RECEIVING
Annual Incentive Target — % of Base 5 — 25% 50% 39% 50% —
Annual Incentive Actual— % of Base 6 — 27% 41% 64% 54% —
Long-Term Incentive Actual— % of Base 1 — — — — — —
$300 MILLION–$499 MILLION # INCUMBENTS10TH
PERCENTILE25TH
PERCENTILEMEDIAN MEAN
75TH PERCENTILE
90TH PERCENTILE
Base Salary 6 $164,900 $202,500 $235,600 $244,900 $316,300 $334,200
Total Cash Compensation 6 $193,200 $259,100 $337,400 $298,700 $345,300 $365,400
Total Direct Compensation 6 $193,200 $259,100 $337,400 $298,700 $345,300 $365,400
INCENTIVE COMPENSATION — THOSE RECEIVING
Annual Incentive Target — % of Base 3 — — 33% 35% — —
Annual Incentive Actual— % of Base 5 — 15% 20% 30% 43% —
Long-Term Incentive Actual— % of Base 0 — — — — — —
31
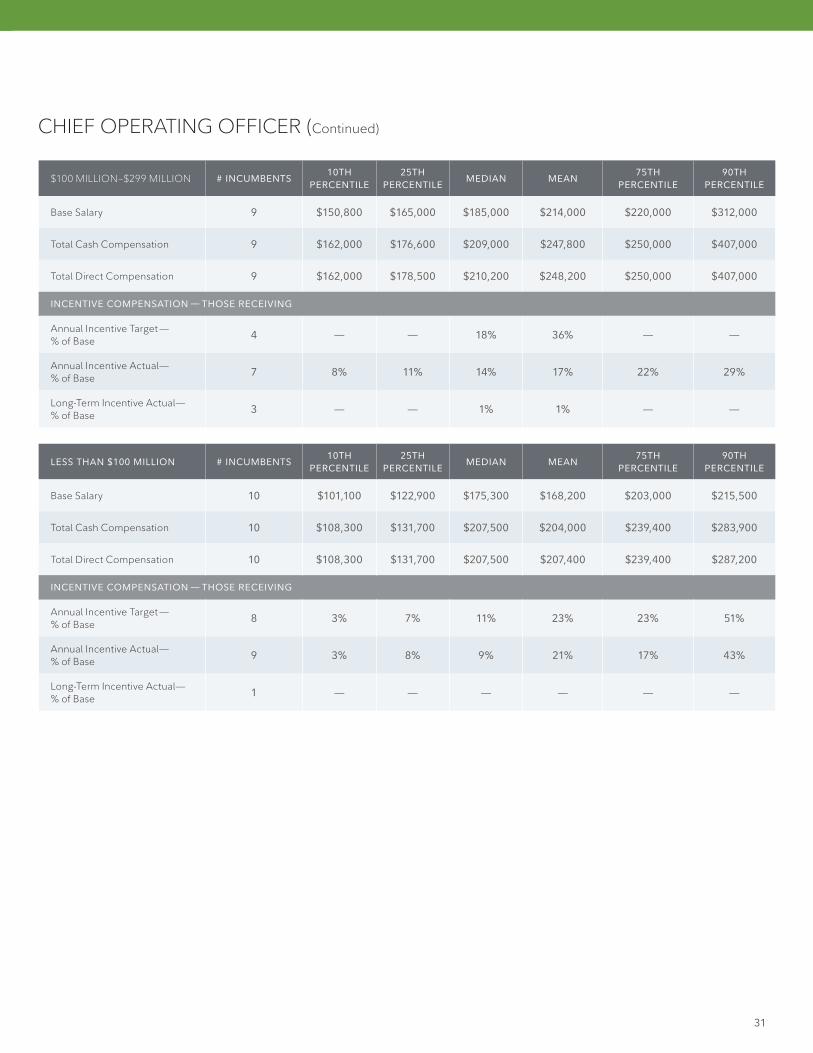
CHIEF OPERATING OFFICER (Continued)
$100 MILLION–$299 MILLION # INCUMBENTS10TH
PERCENTILE25TH
PERCENTILEMEDIAN MEAN
75TH PERCENTILE
90TH PERCENTILE
Base Salary 9 $150,800 $165,000 $185,000 $214,000 $220,000 $312,000
Total Cash Compensation 9 $162,000 $176,600 $209,000 $247,800 $250,000 $407,000
Total Direct Compensation 9 $162,000 $178,500 $210,200 $248,200 $250,000 $407,000
INCENTIVE COMPENSATION — THOSE RECEIVING
Annual Incentive Target — % of Base 4 — — 18% 36% — —
Annual Incentive Actual— % of Base 7 8% 11% 14% 17% 22% 29%
Long-Term Incentive Actual— % of Base 3 — — 1% 1% — —
LESS THAN $100 MILLION # INCUMBENTS10TH
PERCENTILE25TH
PERCENTILEMEDIAN MEAN
75TH PERCENTILE
90TH PERCENTILE
Base Salary 10 $101,100 $122,900 $175,300 $168,200 $203,000 $215,500
Total Cash Compensation 10 $108,300 $131,700 $207,500 $204,000 $239,400 $283,900
Total Direct Compensation 10 $108,300 $131,700 $207,500 $207,400 $239,400 $287,200
INCENTIVE COMPENSATION — THOSE RECEIVING
Annual Incentive Target — % of Base 8 3% 7% 11% 23% 23% 51%
Annual Incentive Actual— % of Base 9 3% 8% 9% 21% 17% 43%
Long-Term Incentive Actual— % of Base 1 — — — — — —

32
EXECUTIVE BENEFITS DETAIL BY POSITION

33
EXECUTIVE BENEFITS DETAIL BY POSITION
CHIEF EXECUTIVE OFFICER
ALL$1 BILLION OR MORE
$500 MILLION– $999 MILLION
$300 MILLION– $499 MILLION
$100 MILLION– $299 MILLION
LESS THAN $100 MILLION
Supplemental Life Insurance 27.2% 33.3% 18.8% 25.9% 34.3% 17.6%
Supplemental Disability Insurance 25.2% 22.2% 28.1% 22.2% 37.1% 5.9%
SERP 12.9% 8.3% 18.8% 18.5% 14.3% —
Auto/Auto Allowance 9.5% 8.3% — 7.4% 20.0% 11.8%
Club Membership 9.5% 8.3% 6.3% 11.1% 14.3% 5.9%
Use of Family’s Private Aircraft 3.4% — 3.1% 3.7% 5.7% 5.9%
CHIEF INVESTMENT OFFICER
ALL$1 BILLION OR MORE
$500 MILLION– $999 MILLION
$300 MILLION– $499 MILLION
$100 MILLION– $299 MILLION
LESS THAN $100 MILLION
Supplemental Life Insurance 26.1% 26.7% 38.1% 18.8% 15.4% 25.0%
Supplemental Disability Insurance 21.7% 23.3% 33.3% 12.5% 15.4% 16.7%
SERP 12.0% 20.0% 9.5% 12.5% — 8.3%
Auto/Auto Allowance 6.5% 10.0% 9.5% — 7.7% —
Club Membership 5.4% 3.3% 0.0% 6.3% 15.4% 8.3%
Use of Family’s Private Aircraft 1.1% — — 6.3% — —

34
CHIEF FINANCIAL OFFICER
ALL$1 BILLION OR MORE
$500 MILLION– $999 MILLION
$300 MILLION– $499 MILLION
$100 MILLION– $299 MILLION
LESS THAN $100 MILLION
Supplemental Life Insurance 26.1% 30.0% 25.0% 23.5% 33.3% —
Supplemental Disability Insurance 28.7% 30.0% 37.5% 17.6% 33.3% 9.1%
SERP 11.3% 13.3% 16.7% 11.8% 6.1% 9.1%
Auto/Auto Allowance 5.2% — — 11.8% 9.1% 9.1%
Club Membership 5.2% 6.7% 4.2% 11.8% 3.0% —
Use of Family’s Private Aircraft 1.7% — — 5.9% 3.0% —
CHIEF OPERATING OFFICER
ALL$1 BILLION OR MORE
$500 MILLION– $999 MILLION
$300 MILLION– $499 MILLION
$100 MILLION– $299 MILLION
LESS THAN $100 MILLION
Supplemental Life Insurance 27.8% 31.6% 12.5% 33.3% 36.4% 20.0%
Supplemental Disability Insurance 31.5% 31.6% 37.5% 33.3% 36.4% 20.0%
SERP 14.8% 21.1% 25.0% 16.7% 9.1% —
Auto/Auto Allowance 7.4% 5.3% 12.5% 16.7% 9.1% —
Club Membership 3.7% 5.3% 12.5% — — —
Use of Family’s Private Aircraft — — — — — —

35
For investment professional or institutional investor use only. Not authorized for distribution to the public as sales material in any form.
The content provided herein is general in nature and is for informational purposes only. This information is not individualized and is not intended to serve as the primary or sole basis for your decisions as there may be other factors you should consider. Fidelity Clearing & Custody Solutions does not provide financial or investment advice. You should conduct your own due diligence and analysis based on your specific needs.
This communication is provided for informational and educational purposes only. Unless otherwise disclosed to you, in providing this information, Fidelity is not undertaking to provide impartial investment advice, or to give advice in a fiduciary capacity, in connection with any investment or transaction described herein. Fiduciaries are solely responsible for exercising independent judgment in evaluating any transaction(s) and are assumed to be capable of evaluating investment risks independently, both in general and with regard to particular transactions and investment strategies. Fidelity has a financial interest in any transaction(s) that fiduciaries, and if applicable, their clients, may enter into involving Fidelity’s products or services.
The third-party providers listed herein are neither affiliated with nor agents of Fidelity, and are not authorized to make representations on behalf of Fidelity. Their input herein does not suggest a recommendation or endorsement by Fidelity. This information was provided by the third-party providers and is subject to change. There is no form of legal partnership, agency, affiliation, or similar relationship among an investment professional, the third-party service providers, and Fidelity Investments, nor is such a relationship created or implied by the information herein.
Third-party marks are the property of their respective owners; all other marks are the property of FMR LLC.
Fidelity Family Office Services is a division of Fidelity Brokerage Services LLC.
Fidelity Clearing & Custody Solutions® provides clearing, custody, or other brokerage services through National Financial Services LLC or Fidelity Brokerage Services LLC, Members NYSE, SIPC.
© 2018 FMR LLC. All rights reserved.
724753.7.0 1.9887719.100
For additional insights and resources, please visit www.familyofficebenchmarking.com.


![BENEFITS & COMPENSATION INTERNATIONAL1].pdf · qualified deferred compensation plan”. Deferred compensation arrangements issued by foreign- ... United States will be regarded as](https://static.fdocuments.in/doc/165x107/5b69676e7f8b9ab0128e2dd8/benefits-compensation-international-1pdf-qualified-deferred-compensation.jpg)