Insights into the physical and chemical properties of a ...
9
Contents lists available at ScienceDirect Cement and Concrete Composites journal homepage: www.elsevier.com/locate/cemconcomp Insights into the physical and chemical properties of a cement-polymer composite developed for geothermal wellbore applications Kenton A. Rod a , Manh-Thuong Nguyen b , Mohamed Elbakhshwan c,1 , Simerjeet Gills c,∗∗,1 , Barbara Kutchko d , Tamas Varga e , Adriana M. Mckinney e , Timothy J. Roosendaal a , M. Ian Childers a , Chonghang Zhao f,1 , Yu-chen Karen Chen-Wiegart f,g,1 , Juergen Thieme g,1 , Phillip K. Koech a , Wooyong Um h , Jaehun Chun a , Roger Rousseau b , Vassiliki-Alexandra Glezakou b , Carlos A. Fernandez a,∗ a Energy and Environment Directorate, Pacific Northwest National Laboratory, Richland, WA, USA b Physical and Computational Sciences Directorate, Pacific Northwest National Laboratory, Richland, WA, USA c Nuclear Science and Technology Department, Brookhaven National Laboratory, Brookhaven, NY, USA d National Environmental Technology Laboratory, Pittsburg, PA, USA e Environmental and Molecular Sciences Laboratory, Pacific Northwest National Laboratory, Richland, WA, USA f Department of Materials Science and Chemical Engineering, Stony Brook University, USA g National Synchrotron Light Source II, Brookhaven National Laboratory, USA h Pohang University of Science and Technology (POSTECH), Pohang, South Korea ARTICLEINFO Keywords: Cement Polymer Geothermal Wellbore Self-healing ABSTRACT To isolate injection and production zones from overlying formations and aquifers during geothermal operations, cement is placed in the annulus between well casing and the formation. However, wellbore cement eventually undergoes fractures due to chemical and physical stress with the resulting time and cost intensive production shutdowns and repairs. To address this difficult problem, a polymer-cement (composite) with self-healing properties was recently developed by our group. Short-term thermal stability tests demonstrated the potential of this material for its application in geothermal environments. In this work, the authors unveil some of the physical and chemical properties of the cement composite in an attempt to better understand its performance as compared to standard cement in the absence of the polymer. Among the properties studied include material's elemental distribution, mineral composition, internal microstructure, and tensile elasticity. Polymer-cement composites have relatively larger, though not interconnected, levels of void spaces compared to conventional cement. Most of these void spaces are filled with polymer. The composites also seem to have higher levels of uncured cement grains as the polymer seems to act as a retarder in the curing process. The presence of homogeneously-distributed more flexible polymer in the cement brings about 60–70% higher tensile elasticity to the composite material, as confirmed experimentally and by density-functional calculations. The improved tensile elasticity suggests that the composite materials can outperform conventional cement under mechanical stress. In addition, calculations indicate that the bonding interactions between the cement and polymer remain stable over the range of strain studied. The results suggest that this novel polymer-cement formulation could represent an important alternative to conventional cement for application in high-temperature subsurface set- tings. 1. Introduction The sealing of wellbores used for oil, gas, and geothermal heat production is a major environmental and practical concern. Cementing is used to fill the annulus between the geologic formation and the wellbore casing [1], with the intent to hydraulically isolate the pro- duction and injections zones the wellbore penetrates. The result con- tributes to preventing contamination of aquifers and surface waters, https://doi.org/10.1016/j.cemconcomp.2018.12.022 Received 22 June 2018; Received in revised form 8 October 2018; Accepted 25 December 2018 ∗ Corresponding author. ∗∗ Corresponding author. E-mail addresses: [email protected] (S. Gills), [email protected] (C.A. Fernandez). 1 these authors contributed equally to this work. Cement and Concrete Composites 97 (2019) 279–287 Available online 31 December 2018 0958-9465/ © 2019 Elsevier Ltd. All rights reserved. T
Transcript of Insights into the physical and chemical properties of a ...

Contents lists available at ScienceDirect
Cement and Concrete Composites
journal homepage: www.elsevier.com/locate/cemconcomp
Insights into the physical and chemical properties of a cement-polymercomposite developed for geothermal wellbore applicationsKenton A. Roda, Manh-Thuong Nguyenb, Mohamed Elbakhshwanc,1, Simerjeet Gillsc,∗∗,1,Barbara Kutchkod, Tamas Vargae, Adriana M. Mckinneye, Timothy J. Roosendaala,M. Ian Childersa, Chonghang Zhaof,1, Yu-chen Karen Chen-Wiegartf,g,1, Juergen Thiemeg,1,Phillip K. Koecha, Wooyong Umh, Jaehun Chuna, Roger Rousseaub,Vassiliki-Alexandra Glezakoub, Carlos A. Fernandeza,∗a Energy and Environment Directorate, Pacific Northwest National Laboratory, Richland, WA, USAb Physical and Computational Sciences Directorate, Pacific Northwest National Laboratory, Richland, WA, USAcNuclear Science and Technology Department, Brookhaven National Laboratory, Brookhaven, NY, USAdNational Environmental Technology Laboratory, Pittsburg, PA, USAe Environmental and Molecular Sciences Laboratory, Pacific Northwest National Laboratory, Richland, WA, USAfDepartment of Materials Science and Chemical Engineering, Stony Brook University, USAgNational Synchrotron Light Source II, Brookhaven National Laboratory, USAh Pohang University of Science and Technology (POSTECH), Pohang, South Korea
A R T I C L E I N F O
Keywords:CementPolymerGeothermalWellboreSelf-healing
A B S T R A C T
To isolate injection and production zones from overlying formations and aquifers during geothermal operations,cement is placed in the annulus between well casing and the formation. However, wellbore cement eventuallyundergoes fractures due to chemical and physical stress with the resulting time and cost intensive productionshutdowns and repairs. To address this difficult problem, a polymer-cement (composite) with self-healingproperties was recently developed by our group. Short-term thermal stability tests demonstrated the potential ofthis material for its application in geothermal environments. In this work, the authors unveil some of thephysical and chemical properties of the cement composite in an attempt to better understand its performance ascompared to standard cement in the absence of the polymer. Among the properties studied include material'selemental distribution, mineral composition, internal microstructure, and tensile elasticity. Polymer-cementcomposites have relatively larger, though not interconnected, levels of void spaces compared to conventionalcement. Most of these void spaces are filled with polymer. The composites also seem to have higher levels ofuncured cement grains as the polymer seems to act as a retarder in the curing process. The presence ofhomogeneously-distributed more flexible polymer in the cement brings about 60–70% higher tensile elasticity tothe composite material, as confirmed experimentally and by density-functional calculations. The improvedtensile elasticity suggests that the composite materials can outperform conventional cement under mechanicalstress. In addition, calculations indicate that the bonding interactions between the cement and polymer remainstable over the range of strain studied. The results suggest that this novel polymer-cement formulation couldrepresent an important alternative to conventional cement for application in high-temperature subsurface set-tings.
1. Introduction
The sealing of wellbores used for oil, gas, and geothermal heatproduction is a major environmental and practical concern. Cementing
is used to fill the annulus between the geologic formation and thewellbore casing [1], with the intent to hydraulically isolate the pro-duction and injections zones the wellbore penetrates. The result con-tributes to preventing contamination of aquifers and surface waters,
https://doi.org/10.1016/j.cemconcomp.2018.12.022Received 22 June 2018; Received in revised form 8 October 2018; Accepted 25 December 2018
∗ Corresponding author.∗∗ Corresponding author.E-mail addresses: [email protected] (S. Gills), [email protected] (C.A. Fernandez).
1 these authors contributed equally to this work.
Cement and Concrete Composites 97 (2019) 279–287
Available online 31 December 20180958-9465/ © 2019 Elsevier Ltd. All rights reserved.
T

extending the lifetime of the wellbore and, as a result, increasing theproduction efficiency. Leak risk can limit the development of cleanenergy alternatives, for example, there are large geothermal energyreserves in the United States and around the globe that are not in use todate due to the need of advanced technologies to make its productionviable [2]. This is partially due to the failure of the wellbore cementused in geothermal wells caused by the high temperature (up to 400 °C)and chemically corrosive (typically hypersaline, CO2 and H2S rich)environments [3]. Failure of wellbore seals necessitates expensive andtime intensive production shutdowns and repairs. With improvementsin wellbore cement technologies, geothermal energy has the potentialto be a sustainable energy source, which can deliver significant energywith minimal carbon release to the atmosphere.
Both inorganic and organic cement formulations have been devel-oped to be deployed for geothermal wellbore operations but althoughthey have high compressive strength, they tend to have low tensilestrength and are vulnerable to cracking [4–6]. There has been ad-vancement for development of self-healing cement for geothermalwellbore applications, but their physical attributes can be limitedespecially with respect to multiple fracturing events and separationfrom casing and/or formation [7,8]. Additionally, self-healing polymer-cement blends developed for the oil and gas industry often have poormechanical properties and cannot withstand the high-temperature en-vironments found in geothermal wells [9–17]. Therefore, the develop-ment of a self-healing polymer-cement composite which is functional ingeothermal environments could represent a game-changing technologytowards the growth of the geothermal energy industry.
A self-healing polymer has been developed by the authors and de-tails of its healing mechanisms and proof of ability to heal fractures hasrecently been published [18,19]. In brief, this research demonstratedthat on fractured surfaces, the polymer strongly anchors through hy-drogen bonding and ionic CaeO bonds which results from the depro-tonation of polymer hydroxyl groups while the polymer SeS groups areturned away from the cement−polymer interface, thus allowing for theself-healing function within the polymer [19]. Fracture apertures aslarge as 0.3–0.5mm were self-healed resulting in a permeability re-duction of up to 87% when the novel polymer was present in the ce-ment composite (Fig. 1) [18].
The objective of this paper was to investigate this novel self-healingcement-polymer composite further to learn about the elemental dis-tribution, mineral composition and internal microstructure of thecomposite and how the material's characteristics influence its me-chanical performance, specifically the tensile elasticity. To do so, theauthors performed a series of tests on cement-polymer composites andcompared the results to the results obtained when performing the sametests on conventional cement in the absence of polymer. These testsincluded scanning electron microscopy-energy dispersive X-ray spec-troscopy (SEM-EDS), X-ray fluorescence (XRF) spectroscopy, X-ray
microtomography (XMT), specific surface area analysis, compressivestrength and Young's modulus analysis. This study demonstrates thatthis novel cement-polymer composite appears to be a more ductilematerial which can outperform conventional cement under mechanicalstress. The homogeneous distribution of self-healing polymerthroughout the cement matrix demonstrated in this work is the mainreason for the recently reported self-healing behavior [18]. Both, duc-tility and autonomous healing, makes this cement-polymer composite asignificant alternative material to conventional cement for applicationin geothermal wellbores.
2. Methods
2.1. Cement synthesis
Class H cement was supplied by LaFarge from the Joppa Plant. Silicaflour (200 mesh) was obtained from U.S. Silica. Thioplast EPS 25 (EPS25; 0.373 of total polymer) (640 g/1 equivalent epoxide) was suppliedby Akzo Nobel, and poly(ethylene glycol) diglycidyl ether (PEO; 0.373of total polymer) (250 g/1 equivalent epoxide) and pentaerythritoltetrakis (3-mercaptopropionate) (4SH; 0.253 of total polymer) werepurchased from Sigma-Aldrich. All materials were used as received. Thecontrol and polymer-cement composites were synthesized as previouslyreported (Table S1) [18]. Briefly, cement samples were synthesized bymixing the class H cement powder (70% of solid powder) and silicaflour (30% of solid powder) in a poly(propylene) beaker, then addingdeionized (DI) H2O and mixing to give a cement slurry. To maintainsimilar rheological properties of the slurry additional water was addedwhen polymers were used so that water to class H cement ratio was0.54 for control, 0.71 for 10% polymer, and 0.86 for 25% polymerformulations. The slurry was transferred to plastic molds approximately2.54 cm in diameter by 10.16 cm in length. Molds were placed in asmall container and this container inside a larger container containingwater and covered in Al foil. This setup was placed inside an oven andthe samples were cured at 85 °C for 24 h. Polymer-cement compositeswere synthesized by adding the monomers mixture to the cement slurryand thoroughly mixing to give polymer-cement slurries (Table S1). Si-milarly, the polymer-cement mixtures were cured in a high humidityenvironment at 85 °C for 24 h to simulate the initial temperatures thecement would be exposed to while being pumped into the wellbore.Both cement and polymer-cement composite samples were then re-moved from the molds and cured in a 2L autoclave vessel with 30mL ofH2O at 200 °C for an additional 5 days. The higher temperature wasselected as an extreme temperature expected to be in a subsurfacegeothermal setting. The polymer concentration in the polymer-cementcomposites was 10wt% for all tests. A polymer-cement composite with25% polymer by weight of sample was also synthesized to comparewith the control cement and the 10wt% polymer-cement samples in thefollowing analyses; X-ray fluorescence (XRF) microscopy and Full-fieldX-ray Micro-tomography.
2.2. SEM-EDS
Characterization of polished cement samples (surfaceroughness < 1 μm) was conducted on a FEI Quanta 600 FEG en-vironmental – scanning electron microscope (FE-SEM) equipped withenergy dispersive X-ray spectroscopy (EDS). A backscatter electron(BSE) detector was used to generate images at a working distance of10mm and beam spot size of 4mm with voltages of 10 kV and 20 keV toaccommodate sample charging. EDS was used to determine elementalcomposition. BSE gray-scale intensity coupled with EDS were used todistinguish phases within the cement samples. Brightness in a BSEimage is proportional to the average atomic number of a given phasecomposition [20,21].
Fig. 1. Pictures of control (base cement) and composite cement taken after ahealing event of a shear fracture. Note how more brittle base cement is irre-versibly damaged in several pieces.
K.A. Rod et al. Cement and Concrete Composites 97 (2019) 279–287
280

To supplement the information provided by the BSE images, EDS wascollected at each point identified in the backscattered electron (BSE)images. It is important to note that quantification of carbon and oxygenby EDS is not reliable as its emitted X-rays have low energy and may beabsorbed by either the sample specimen or the detector window [22].
2.3. XRF spectroscopy
To prepare for tomography and XRF analysis the cement sampleswere cut into columns with approximately 2mm×2mm cross sectionand with a length of 20mm using a diamond coated wire (∼0.5mmdiameter) at low speed. The surface of all four (long) sides of thesamples was ground with 600 and 1200 grit silicon carbide papers.Water was used as the cooling fluid in both cutting and grinding/pol-ishing. After grinding, a 1 μm lapping film was used on the flat surfaces,again using water as cooling fluid. No oils or solvents were used toavoid contamination. The polishing was done rapidly and at low tem-perature, so the assumption was made that minimal geochemical al-terations would have occurred to the polished surface. The XRF mapswere collected at the SRX beamline (5-ID) in the National SynchrotronLight Source II (NSLS-II) in Brookhaven National Laboratory [23,24].The energy of the incident beam was 9.6 keV, with the beam size of1× 1 μm2. The use of a synchrotron-based X-ray source allowed for∼1 μm2 resolution, but a 5 μm scanning step size was used in bothlateral and vertical directions because it was better suited to the scale ofelemental distributions or interest.
2.4. XMT
Tomography of cement samples were conducted at bothEnvironmental and Molecular Sciences Laboratory (EMSL; RichlandWA) and at the SRX Beamline (Brookhaven NY). At EMSL a Nikon XTH320/225 X-ray CT instrument was used to obtain 3D volume data at upto 20–50 μm resolution on sections of cement cores (depending onspecimen size), which can then be viewed as sliceable images on thecomputer and analyzed for structural and density changes. X-raycomputed tomography (XCT) images of each piece were collected athigh resolution, so that each exposed and unexposed sample could becompared. The 3D data on the cement was then processed in ImageJ(ImageJ: Image Processing and Analysis in Java. Available from: http://imagej.nih.gov/ij/(2017)) to enhance contrast, and the density orstructural changes were emphasized with the WEKA segmentation toolin ImageJ/Fiji. The different colors of the segmentation classes’ showwere the treatment effects the samples.
Full-field tomography experiments were conducted at the SRXBeamline (5-ID, NSLS-II). A monochromatic X-ray beam with 20 kVenergy was selected using Si (111) double-crystal monochromator. Atotal of 1441 image projects were collected on the sample in each to-mographic measurement, over 180° angular range (0.125° step size),using pco.edge 5.5 CMOS camera. The images were corrected by darkfield images, normalized by white field images, and then aligned usinga tomographic data collected on a calibration pin to remove the sys-tematic lateral and vertical displacements.
Tomographic reconstruction of SRX Beamline data was conductedwith filtered back projection algorithm using TomoPy, a python basedsoftware [25] to reconstruct each set of projections into a 3-dimen-sional (3D) tomographic dataset. Each reconstructed 3D XCT imagedataset was cropped to a volume of 665×715×880 pixels (Eachvoxel size is 2.03× 2.03× 3 μm) for analysis. A median filter-basedsmoothing algorithm was then applied to the reconstructed 3D imagesin freeware Image J [26]. Segmentation was conducted with a thresh-olding value determined from the histogram of reconstructed images.Ring and streak artifacts [27] in the segmented 3D images were
removed in software Avizo (v.9.0, FEI). The artifact removed 3D imageswere imported to ImageJ for measuring porosity by voxel counting andto dragonfly software (v.2.0, ORS) for analyzing the pore/particle sizedistribution. The 3D volume visualization was conducted in Avizo.
2.5. Specific surface area analysis
Samples were broken and sieved to 0.5–1mm diameter fractionbefore analysis for specific surface area. Surface area was determinedusing the Micrometrics Surface Area Analyzer, (Model 2020Micrometrics Instrument Corp., Norcross, Ga). The approach is basedon the multi point Brunauer–Emmett–Teller (BET) adsorption equationusing nitrogen. A detailed description of the procedure to determinesurface area is presented in the operating manual (Micromeritics,2006). Briefly, an air-dried sediment sample, which will provide at leastten square meters of total surface area, is placed in a surface area flaskand out gassed for a minimum of 3 h at 150 °C and at 3 μm Hg. The outgassing temperature was chosen to minimize altering the surfacestructure as discussed by Davis and Leckie [28]. During this time,physiosorbed water and volatile organics are removed. To determinedryness, the vacuum pumps were isolated and if a vacuum change ofless than 2 μm Hg in 5min occurred, the sample was considered cleanand dry. After out gassing, the adsorption isotherm of nitrogen at−196 °C is used to determine the surface area of the sample. Theequipment uses an imbalance of atomic forces on the surface of a cleanevacuated solid to attract gas molecules. The gas molecules collide withthe surface of the sediment and either bounce off or adsorb onto thesurface. When the molecules leave the bulk gas to adsorb onto the se-diment surface, the number of molecules in the gas decreases, thus thegas pressure decreases. By knowing the temperature, volume of thecontainer, and the change in pressure, the number of molecules ad-sorbed can be determined. From the number of adsorbed molecules, thesurface area can be calculated.
2.6. Compressive strength
Cement monoliths with an average length of 8.2 cm (±0.5) anddiameter of 2.5 cm (±0.03) were tested for compressive strength usingstandard methods (ASTM C39/C39M-15a). Before conducting tests, themonolith ends were cut, using a rock saw, perpendicular to the lengthto provide a flat surface minimizing point loading during tests. Testswere performed using an MTS model 312.31 servohydraulic frame witha 55-kip actuator and load cell. The loading rate was 0.24MPa/s andcardboard shims were placed between the plate and sample on bothends to absorb potential point loading from sample defects that couldincrease the risk of test failure. Tests were conducted in triplicate foreach condition tested.
2.7. Young's modulus
To calculate Young's Modulus, stress and strain were measuredduring mechanical testing of the specimens. Tests were performed usingan MTS 312.21 servohydraulic universal test frame controlled byInstron Bluehill 2 software. Samples were spatter painted before testing,creating dark contrasting speckles on light colored surface. Stress-straindata was collected using video capture of compression tests with theprepared samples, measuring movements of speckles relative to eachother. Load and displacement data is collected during testing and usedto calculate stress and strain in the sample throughout the test. Thestress-strain curve generated was used to determine the Young's mod-ulus. The elastic modulus of the sample is the ratio of stress to strain inthe sample which was calculated by determining the slope of the curvein the elastic region of the test.
K.A. Rod et al. Cement and Concrete Composites 97 (2019) 279–287
281
2.8. Computational details
Density-functional calculations have been carried out using the CP2Kcode [29], using the PBE density-functional [30] with the D2 van der Waalscorrection [31]. The GTH family of pseudopotentials [32], within theGaussian plane wave hybrid basis set scheme [33] in which double-ζGaussian basis sets [34] and 400 Ry cutoff for the plane wave expansion ofthe auxiliary charge density were used for the simulations. The Brillouinzone was sampled with only the Γ points in self-consistent calculations.
For the computational investigation in this paper, a simulation cellwith 902 (Si, Ca, O, H) atoms and with volumetric mass density of2.33 g cm−3 was adopted based on by a CeSeH model proposed in aprevious study [35]. This modified model was used in a recent com-putational study [19] with good results. A short polymer of 116 (C, H,O, S) atoms [19] was also added between two cement with the polymerrepresenting ∼6% in weight (Fig. S1). The equilibrium bulk latticeconstants were determined first. The unit cell optimization of theCeSeH polymer complex was started with a 2 ps ab initio moleculardynamics run (NVT, T=300 K) which was followed by zero tempera-ture calculations, resulting in a volumetric mass density of 2.14 g cm−3.The strain along a direction was introduced by changing the corre-sponding lattice constant, the stress was then computed by geometryoptimization. The elastic constant was then computed by the evaluatingthe stress-strain response along the Z direction.
3. Results and discussion
3.1. Mineralogy and chemistry
To seal wellbores class G and the chemically identical class H ce-ments are commonly used [36]. For the samples tested in this manu-script class H Portland cement was used which commonly contains62.9–64.2 wt % of calcium oxide, 21.7–21.9 wt % of SiO2, 3.2–4.2 wt %of Al2O3, 3.7–5 wt % of Fe2O3, 1.1–4.3 wt % of MgO, and 2.2–2.4 wt %of gypsum [1]. The primary identifiable crystalline phases in Portlandcement include: tricalcium silicate (Ca3SiO5), dicalcium silicate(Ca2SiO4), tricalcium aluminate (Ca3Al2O6), and tetracalcium alumi-noferrite (Ca4Al2Fe2O10) [1]. Silicate minerals make up over 80wt % ofthe cement mass in Portland cement [37]. Based on previously pub-lished X-ray diffraction results, the minerals identified when curingcement H with silica flour in a mass ratio 70:30 at 200 °C are the cal-cium silicate mineral xonotlite [Ca6Si6O17(OH)2] and quartz (SiO2)[18]. Furthermore, the mineral composition is similar for both thecontrol cement and the cement-polymer combination.
An initial investigation of polymer influence on the mineralogy was
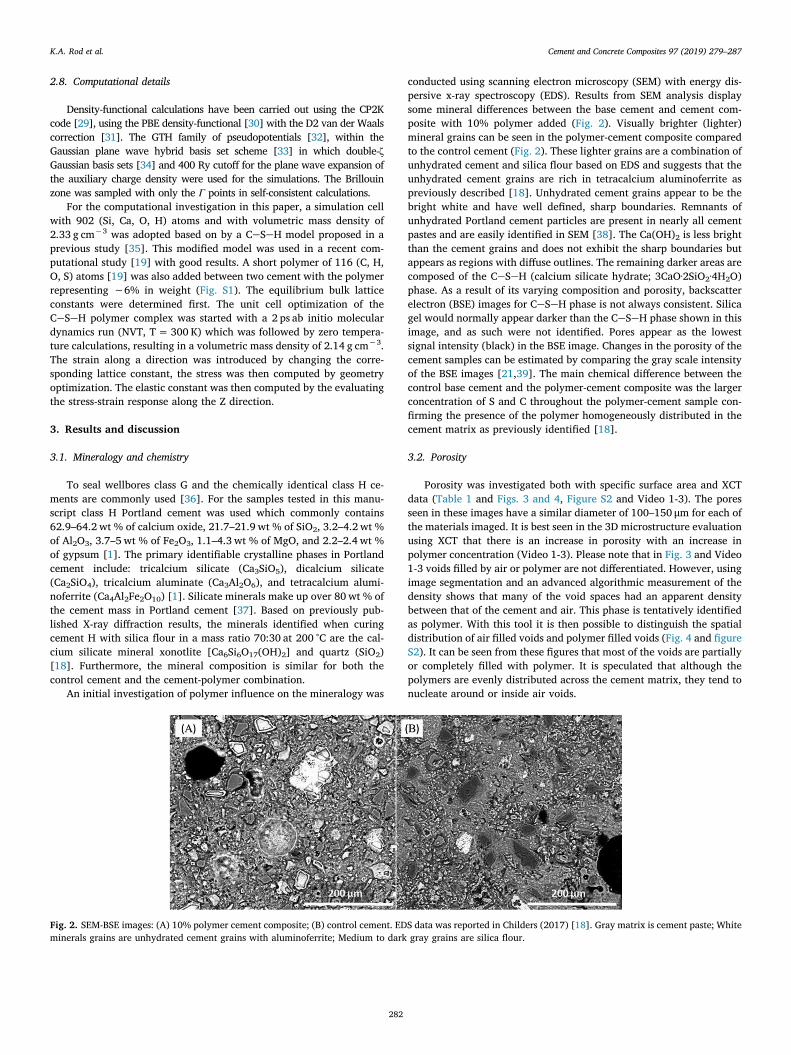
conducted using scanning electron microscopy (SEM) with energy dis-persive x-ray spectroscopy (EDS). Results from SEM analysis displaysome mineral differences between the base cement and cement com-posite with 10% polymer added (Fig. 2). Visually brighter (lighter)mineral grains can be seen in the polymer-cement composite comparedto the control cement (Fig. 2). These lighter grains are a combination ofunhydrated cement and silica flour based on EDS and suggests that theunhydrated cement grains are rich in tetracalcium aluminoferrite aspreviously described [18]. Unhydrated cement grains appear to be thebright white and have well defined, sharp boundaries. Remnants ofunhydrated Portland cement particles are present in nearly all cementpastes and are easily identified in SEM [38]. The Ca(OH)2 is less brightthan the cement grains and does not exhibit the sharp boundaries butappears as regions with diffuse outlines. The remaining darker areas arecomposed of the CeSeH (calcium silicate hydrate; 3CaO·2SiO2·4H2O)phase. As a result of its varying composition and porosity, backscatterelectron (BSE) images for CeSeH phase is not always consistent. Silicagel would normally appear darker than the CeSeH phase shown in thisimage, and as such were not identified. Pores appear as the lowestsignal intensity (black) in the BSE image. Changes in the porosity of thecement samples can be estimated by comparing the gray scale intensityof the BSE images [21,39]. The main chemical difference between thecontrol base cement and the polymer-cement composite was the largerconcentration of S and C throughout the polymer-cement sample con-firming the presence of the polymer homogeneously distributed in thecement matrix as previously identified [18].
3.2. Porosity
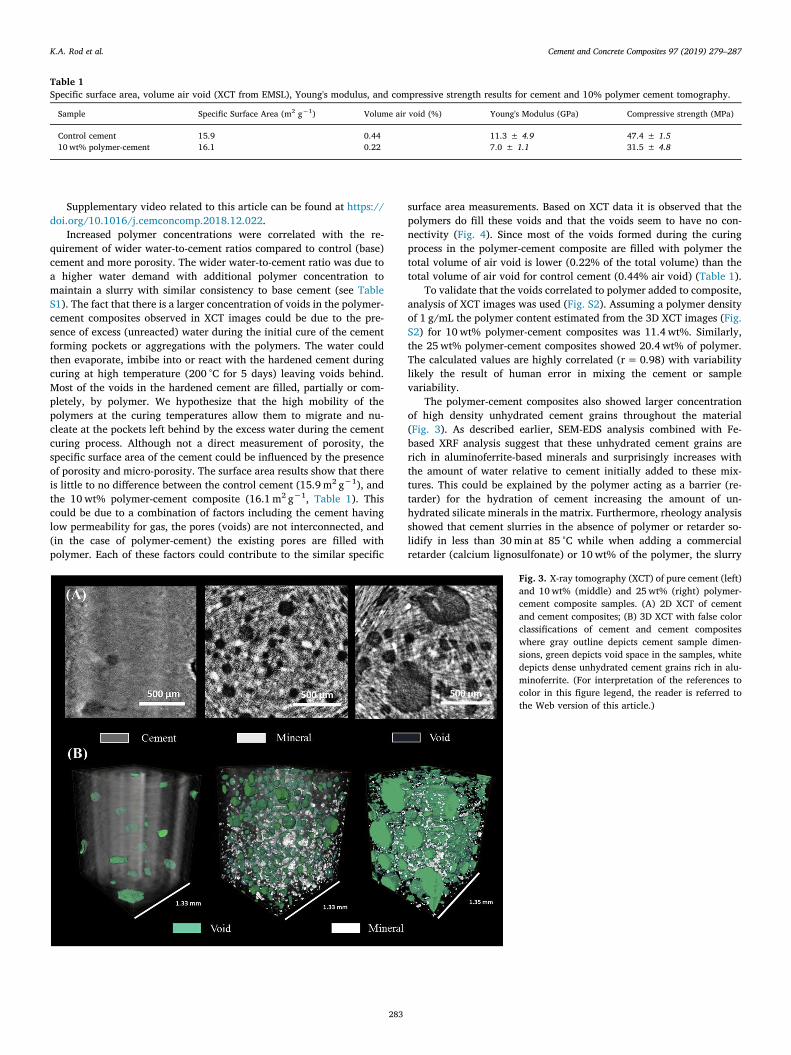
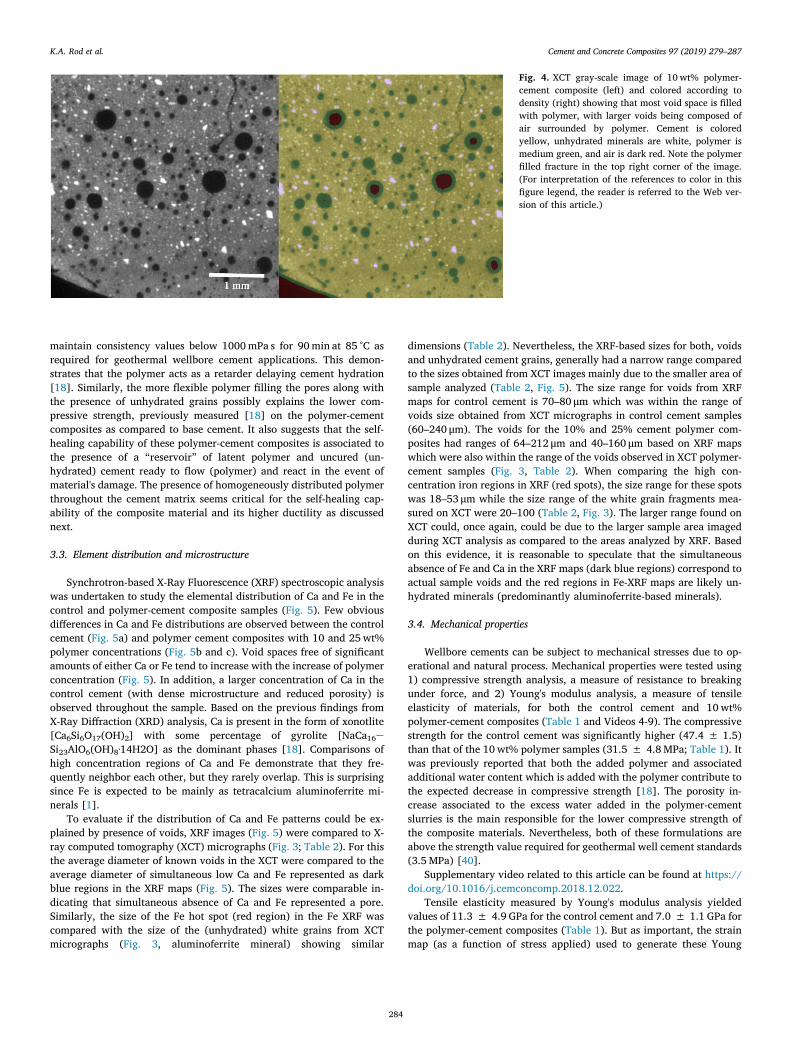
Porosity was investigated both with specific surface area and XCTdata (Table 1 and Figs. 3 and 4, Figure S2 and Video 1-3). The poresseen in these images have a similar diameter of 100–150 μm for each ofthe materials imaged. It is best seen in the 3D microstructure evaluationusing XCT that there is an increase in porosity with an increase inpolymer concentration (Video 1-3). Please note that in Fig. 3 and Video1-3 voids filled by air or polymer are not differentiated. However, usingimage segmentation and an advanced algorithmic measurement of thedensity shows that many of the void spaces had an apparent densitybetween that of the cement and air. This phase is tentatively identifiedas polymer. With this tool it is then possible to distinguish the spatialdistribution of air filled voids and polymer filled voids (Fig. 4 and figureS2). It can be seen from these figures that most of the voids are partiallyor completely filled with polymer. It is speculated that although thepolymers are evenly distributed across the cement matrix, they tend tonucleate around or inside air voids.
Fig. 2. SEM-BSE images: (A) 10% polymer cement composite; (B) control cement. EDS data was reported in Childers (2017) [18]. Gray matrix is cement paste; Whiteminerals grains are unhydrated cement grains with aluminoferrite; Medium to dark gray grains are silica flour.
K.A. Rod et al. Cement and Concrete Composites 97 (2019) 279–287
282
Supplementary video related to this article can be found at https://doi.org/10.1016/j.cemconcomp.2018.12.022.
Increased polymer concentrations were correlated with the re-quirement of wider water-to-cement ratios compared to control (base)cement and more porosity. The wider water-to-cement ratio was due toa higher water demand with additional polymer concentration tomaintain a slurry with similar consistency to base cement (see TableS1). The fact that there is a larger concentration of voids in the polymer-cement composites observed in XCT images could be due to the pre-sence of excess (unreacted) water during the initial cure of the cementforming pockets or aggregations with the polymers. The water couldthen evaporate, imbibe into or react with the hardened cement duringcuring at high temperature (200 °C for 5 days) leaving voids behind.Most of the voids in the hardened cement are filled, partially or com-pletely, by polymer. We hypothesize that the high mobility of thepolymers at the curing temperatures allow them to migrate and nu-cleate at the pockets left behind by the excess water during the cementcuring process. Although not a direct measurement of porosity, thespecific surface area of the cement could be influenced by the presenceof porosity and micro-porosity. The surface area results show that thereis little to no difference between the control cement (15.9 m2 g−1), andthe 10wt% polymer-cement composite (16.1m2 g−1, Table 1). Thiscould be due to a combination of factors including the cement havinglow permeability for gas, the pores (voids) are not interconnected, and(in the case of polymer-cement) the existing pores are filled withpolymer. Each of these factors could contribute to the similar specific
surface area measurements. Based on XCT data it is observed that thepolymers do fill these voids and that the voids seem to have no con-nectivity (Fig. 4). Since most of the voids formed during the curingprocess in the polymer-cement composite are filled with polymer thetotal volume of air void is lower (0.22% of the total volume) than thetotal volume of air void for control cement (0.44% air void) (Table 1).
To validate that the voids correlated to polymer added to composite,analysis of XCT images was used (Fig. S2). Assuming a polymer densityof 1 g/mL the polymer content estimated from the 3D XCT images (Fig.S2) for 10 wt% polymer-cement composites was 11.4 wt%. Similarly,the 25wt% polymer-cement composites showed 20.4 wt% of polymer.The calculated values are highly correlated (r= 0.98) with variabilitylikely the result of human error in mixing the cement or samplevariability.
The polymer-cement composites also showed larger concentrationof high density unhydrated cement grains throughout the material(Fig. 3). As described earlier, SEM-EDS analysis combined with Fe-based XRF analysis suggest that these unhydrated cement grains arerich in aluminoferrite-based minerals and surprisingly increases withthe amount of water relative to cement initially added to these mix-tures. This could be explained by the polymer acting as a barrier (re-tarder) for the hydration of cement increasing the amount of un-hydrated silicate minerals in the matrix. Furthermore, rheology analysisshowed that cement slurries in the absence of polymer or retarder so-lidify in less than 30min at 85 °C while when adding a commercialretarder (calcium lignosulfonate) or 10wt% of the polymer, the slurry
Table 1Specific surface area, volume air void (XCT from EMSL), Young's modulus, and compressive strength results for cement and 10% polymer cement tomography.
Sample Specific Surface Area (m2 g−1) Volume air void (%) Young's Modulus (GPa) Compressive strength (MPa)
Control cement 15.9 0.44 11.3 ± 4.9 47.4 ± 1.510wt% polymer-cement 16.1 0.22 7.0 ± 1.1 31.5 ± 4.8
Fig. 3. X-ray tomography (XCT) of pure cement (left)and 10wt% (middle) and 25wt% (right) polymer-cement composite samples. (A) 2D XCT of cementand cement composites; (B) 3D XCT with false colorclassifications of cement and cement compositeswhere gray outline depicts cement sample dimen-sions, green depicts void space in the samples, whitedepicts dense unhydrated cement grains rich in alu-minoferrite. (For interpretation of the references tocolor in this figure legend, the reader is referred tothe Web version of this article.)
K.A. Rod et al. Cement and Concrete Composites 97 (2019) 279–287
283
maintain consistency values below 1000mPa s for 90min at 85 °C asrequired for geothermal wellbore cement applications. This demon-strates that the polymer acts as a retarder delaying cement hydration[18]. Similarly, the more flexible polymer filling the pores along withthe presence of unhydrated grains possibly explains the lower com-pressive strength, previously measured [18] on the polymer-cementcomposites as compared to base cement. It also suggests that the self-healing capability of these polymer-cement composites is associated tothe presence of a “reservoir” of latent polymer and uncured (un-hydrated) cement ready to flow (polymer) and react in the event ofmaterial's damage. The presence of homogeneously distributed polymerthroughout the cement matrix seems critical for the self-healing cap-ability of the composite material and its higher ductility as discussednext.
3.3. Element distribution and microstructure
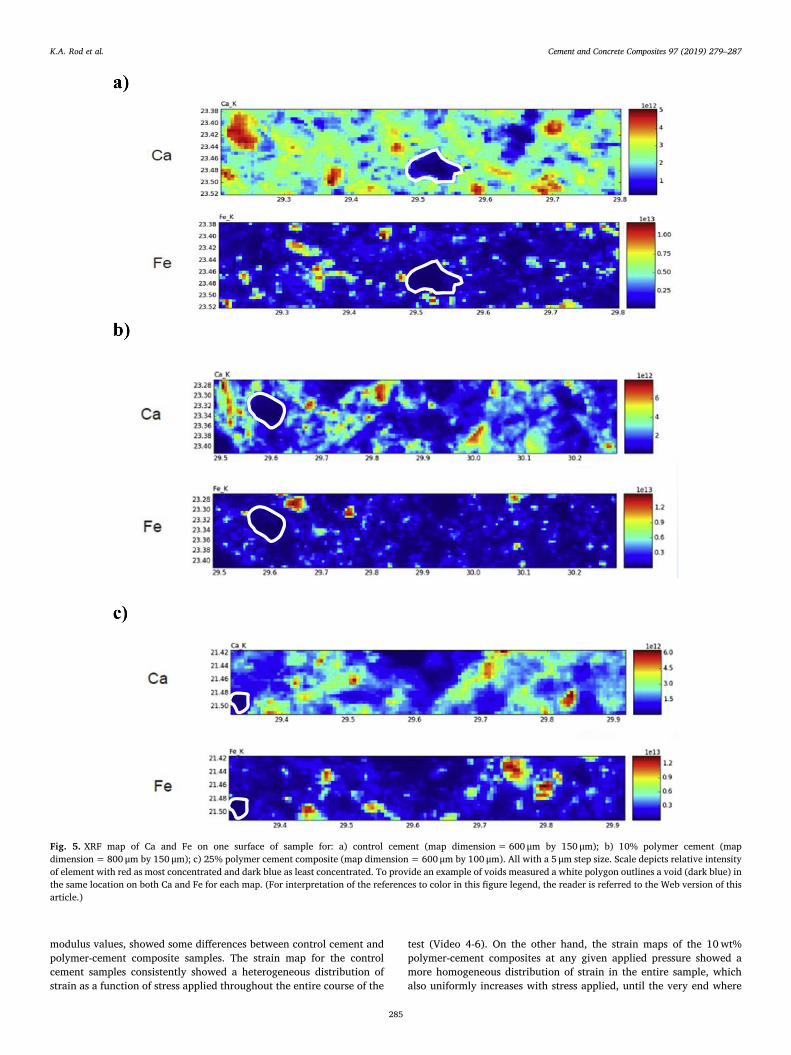
Synchrotron-based X-Ray Fluorescence (XRF) spectroscopic analysiswas undertaken to study the elemental distribution of Ca and Fe in thecontrol and polymer-cement composite samples (Fig. 5). Few obviousdifferences in Ca and Fe distributions are observed between the controlcement (Fig. 5a) and polymer cement composites with 10 and 25wt%polymer concentrations (Fig. 5b and c). Void spaces free of significantamounts of either Ca or Fe tend to increase with the increase of polymerconcentration (Fig. 5). In addition, a larger concentration of Ca in thecontrol cement (with dense microstructure and reduced porosity) isobserved throughout the sample. Based on the previous findings fromX-Ray Diffraction (XRD) analysis, Ca is present in the form of xonotlite[Ca6Si6O17(OH)2] with some percentage of gyrolite [NaCa16eSi23AlO6(OH)8·14H2O] as the dominant phases [18]. Comparisons ofhigh concentration regions of Ca and Fe demonstrate that they fre-quently neighbor each other, but they rarely overlap. This is surprisingsince Fe is expected to be mainly as tetracalcium aluminoferrite mi-nerals [1].
To evaluate if the distribution of Ca and Fe patterns could be ex-plained by presence of voids, XRF images (Fig. 5) were compared to X-ray computed tomography (XCT) micrographs (Fig. 3; Table 2). For thisthe average diameter of known voids in the XCT were compared to theaverage diameter of simultaneous low Ca and Fe represented as darkblue regions in the XRF maps (Fig. 5). The sizes were comparable in-dicating that simultaneous absence of Ca and Fe represented a pore.Similarly, the size of the Fe hot spot (red region) in the Fe XRF wascompared with the size of the (unhydrated) white grains from XCTmicrographs (Fig. 3, aluminoferrite mineral) showing similar
dimensions (Table 2). Nevertheless, the XRF-based sizes for both, voidsand unhydrated cement grains, generally had a narrow range comparedto the sizes obtained from XCT images mainly due to the smaller area ofsample analyzed (Table 2, Fig. 5). The size range for voids from XRFmaps for control cement is 70–80 μm which was within the range ofvoids size obtained from XCT micrographs in control cement samples(60–240 μm). The voids for the 10% and 25% cement polymer com-posites had ranges of 64–212 μm and 40–160 μm based on XRF mapswhich were also within the range of the voids observed in XCT polymer-cement samples (Fig. 3, Table 2). When comparing the high con-centration iron regions in XRF (red spots), the size range for these spotswas 18–53 μm while the size range of the white grain fragments mea-sured on XCT were 20–100 (Table 2, Fig. 3). The larger range found onXCT could, once again, could be due to the larger sample area imagedduring XCT analysis as compared to the areas analyzed by XRF. Basedon this evidence, it is reasonable to speculate that the simultaneousabsence of Fe and Ca in the XRF maps (dark blue regions) correspond toactual sample voids and the red regions in Fe-XRF maps are likely un-hydrated minerals (predominantly aluminoferrite-based minerals).
3.4. Mechanical properties
Wellbore cements can be subject to mechanical stresses due to op-erational and natural process. Mechanical properties were tested using1) compressive strength analysis, a measure of resistance to breakingunder force, and 2) Young's modulus analysis, a measure of tensileelasticity of materials, for both the control cement and 10wt%polymer-cement composites (Table 1 and Videos 4-9). The compressivestrength for the control cement was significantly higher (47.4 ± 1.5)than that of the 10wt% polymer samples (31.5 ± 4.8MPa; Table 1). Itwas previously reported that both the added polymer and associatedadditional water content which is added with the polymer contribute tothe expected decrease in compressive strength [18]. The porosity in-crease associated to the excess water added in the polymer-cementslurries is the main responsible for the lower compressive strength ofthe composite materials. Nevertheless, both of these formulations areabove the strength value required for geothermal well cement standards(3.5MPa) [40].
Supplementary video related to this article can be found at https://doi.org/10.1016/j.cemconcomp.2018.12.022.
Tensile elasticity measured by Young's modulus analysis yieldedvalues of 11.3 ± 4.9 GPa for the control cement and 7.0 ± 1.1 GPa forthe polymer-cement composites (Table 1). But as important, the strainmap (as a function of stress applied) used to generate these Young
Fig. 4. XCT gray-scale image of 10wt% polymer-cement composite (left) and colored according todensity (right) showing that most void space is filledwith polymer, with larger voids being composed ofair surrounded by polymer. Cement is coloredyellow, unhydrated minerals are white, polymer ismedium green, and air is dark red. Note the polymerfilled fracture in the top right corner of the image.(For interpretation of the references to color in thisfigure legend, the reader is referred to the Web ver-sion of this article.)
K.A. Rod et al. Cement and Concrete Composites 97 (2019) 279–287
284
modulus values, showed some differences between control cement andpolymer-cement composite samples. The strain map for the controlcement samples consistently showed a heterogeneous distribution ofstrain as a function of stress applied throughout the entire course of the
test (Video 4-6). On the other hand, the strain maps of the 10wt%polymer-cement composites at any given applied pressure showed amore homogeneous distribution of strain in the entire sample, whichalso uniformly increases with stress applied, until the very end where
Fig. 5. XRF map of Ca and Fe on one surface of sample for: a) control cement (map dimension= 600 μm by 150 μm); b) 10% polymer cement (mapdimension=800 μm by 150 μm); c) 25% polymer cement composite (map dimension=600 μm by 100 μm). All with a 5 μm step size. Scale depicts relative intensityof element with red as most concentrated and dark blue as least concentrated. To provide an example of voids measured a white polygon outlines a void (dark blue) inthe same location on both Ca and Fe for each map. (For interpretation of the references to color in this figure legend, the reader is referred to the Web version of thisarticle.)
K.A. Rod et al. Cement and Concrete Composites 97 (2019) 279–287
285
mechanical failure occurs (Video 7-9). We hypothesize that this is dueto the polymer-cement composites being relatively more elastic/ductilethan pure cement samples which allow them to better respond againstmechanical stress.
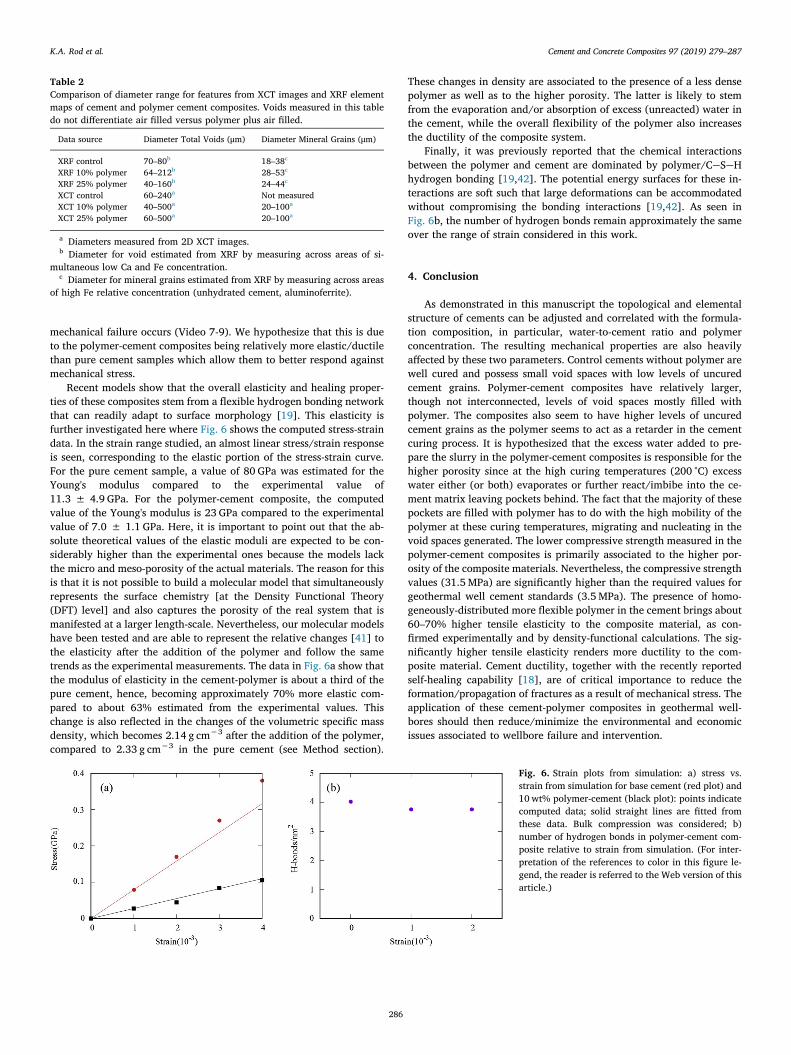
Recent models show that the overall elasticity and healing proper-ties of these composites stem from a flexible hydrogen bonding networkthat can readily adapt to surface morphology [19]. This elasticity isfurther investigated here where Fig. 6 shows the computed stress-straindata. In the strain range studied, an almost linear stress/strain responseis seen, corresponding to the elastic portion of the stress-strain curve.For the pure cement sample, a value of 80 GPa was estimated for theYoung's modulus compared to the experimental value of11.3 ± 4.9 GPa. For the polymer-cement composite, the computedvalue of the Young's modulus is 23 GPa compared to the experimentalvalue of 7.0 ± 1.1 GPa. Here, it is important to point out that the ab-solute theoretical values of the elastic moduli are expected to be con-siderably higher than the experimental ones because the models lackthe micro and meso-porosity of the actual materials. The reason for thisis that it is not possible to build a molecular model that simultaneouslyrepresents the surface chemistry [at the Density Functional Theory(DFT) level] and also captures the porosity of the real system that ismanifested at a larger length-scale. Nevertheless, our molecular modelshave been tested and are able to represent the relative changes [41] tothe elasticity after the addition of the polymer and follow the sametrends as the experimental measurements. The data in Fig. 6a show thatthe modulus of elasticity in the cement-polymer is about a third of thepure cement, hence, becoming approximately 70% more elastic com-pared to about 63% estimated from the experimental values. Thischange is also reflected in the changes of the volumetric specific massdensity, which becomes 2.14 g cm−3 after the addition of the polymer,compared to 2.33 g cm−3 in the pure cement (see Method section).
These changes in density are associated to the presence of a less densepolymer as well as to the higher porosity. The latter is likely to stemfrom the evaporation and/or absorption of excess (unreacted) water inthe cement, while the overall flexibility of the polymer also increasesthe ductility of the composite system.
Finally, it was previously reported that the chemical interactionsbetween the polymer and cement are dominated by polymer/CeSeHhydrogen bonding [19,42]. The potential energy surfaces for these in-teractions are soft such that large deformations can be accommodatedwithout compromising the bonding interactions [19,42]. As seen inFig. 6b, the number of hydrogen bonds remain approximately the sameover the range of strain considered in this work.
4. Conclusion
As demonstrated in this manuscript the topological and elementalstructure of cements can be adjusted and correlated with the formula-tion composition, in particular, water-to-cement ratio and polymerconcentration. The resulting mechanical properties are also heavilyaffected by these two parameters. Control cements without polymer arewell cured and possess small void spaces with low levels of uncuredcement grains. Polymer-cement composites have relatively larger,though not interconnected, levels of void spaces mostly filled withpolymer. The composites also seem to have higher levels of uncuredcement grains as the polymer seems to act as a retarder in the cementcuring process. It is hypothesized that the excess water added to pre-pare the slurry in the polymer-cement composites is responsible for thehigher porosity since at the high curing temperatures (200 °C) excesswater either (or both) evaporates or further react/imbibe into the ce-ment matrix leaving pockets behind. The fact that the majority of thesepockets are filled with polymer has to do with the high mobility of thepolymer at these curing temperatures, migrating and nucleating in thevoid spaces generated. The lower compressive strength measured in thepolymer-cement composites is primarily associated to the higher por-osity of the composite materials. Nevertheless, the compressive strengthvalues (31.5MPa) are significantly higher than the required values forgeothermal well cement standards (3.5MPa). The presence of homo-geneously-distributed more flexible polymer in the cement brings about60–70% higher tensile elasticity to the composite material, as con-firmed experimentally and by density-functional calculations. The sig-nificantly higher tensile elasticity renders more ductility to the com-posite material. Cement ductility, together with the recently reportedself-healing capability [18], are of critical importance to reduce theformation/propagation of fractures as a result of mechanical stress. Theapplication of these cement-polymer composites in geothermal well-bores should then reduce/minimize the environmental and economicissues associated to wellbore failure and intervention.
Table 2Comparison of diameter range for features from XCT images and XRF elementmaps of cement and polymer cement composites. Voids measured in this tabledo not differentiate air filled versus polymer plus air filled.
Data source Diameter Total Voids (μm) Diameter Mineral Grains (μm)
XRF control 70–80b 18–38c
XRF 10% polymer 64–212b 28–53c
XRF 25% polymer 40–160b 24–44c
XCT control 60–240a Not measuredXCT 10% polymer 40–500a 20–100a
XCT 25% polymer 60–500a 20–100a
a Diameters measured from 2D XCT images.b Diameter for void estimated from XRF by measuring across areas of si-
multaneous low Ca and Fe concentration.c Diameter for mineral grains estimated from XRF by measuring across areas
of high Fe relative concentration (unhydrated cement, aluminoferrite).
Fig. 6. Strain plots from simulation: a) stress vs.strain from simulation for base cement (red plot) and10wt% polymer-cement (black plot): points indicatecomputed data; solid straight lines are fitted fromthese data. Bulk compression was considered; b)number of hydrogen bonds in polymer-cement com-posite relative to strain from simulation. (For inter-pretation of the references to color in this figure le-gend, the reader is referred to the Web version of thisarticle.)
K.A. Rod et al. Cement and Concrete Composites 97 (2019) 279–287
286
Acknowledgements
Funding provided by the Department of Energy’s GeothermalTechnology Office. PNNL is operated by Battelle for the U.S. DOE underContract DE-AC06-76RLO 1830. Work at Brookhaven NationalLaboratory was performed using funding from Laboratory DirectedResearch and Development (LDRD) Program under project no 16-019.Part of this research was performed at the W.R. Wiley EnvironmentalMolecular Sciences Laboratory (EMSL), a national scientific user facilityat PNNL managed by the Department of Energy's Office of Biologicaland Environmental Research, and simulations were performed usingPNNL Institutional Computing. This research used resources of theNational Energy Research Scientific Computing Center, a DOE Office ofScience User Facility supported by the Office of Science of the U.S.Department of Energy under Contract No. DE-AC02-05CH11231. Thisresearch used resources and SRX beamline (5-ID) of the NationalSynchrotron Light Source II, a U.S. Department of Energy Office ofScience User Facility operated for the DOE Office of Science byBrookhaven National Laboratory under Contract No. DE-SC0012704. K.Chen-Wiegart and C Zhao acknowledge the support by the Departmentof Materials Science and Chemical Engineering, the College ofEngineering and Applied Sciences, and the Stony Brook University, aswell as by the Brookhaven National Laboratory under Contract No. DE-SC0012704.
Appendix A. Supplementary data
Supplementary data to this article can be found online at https://doi.org/10.1016/j.cemconcomp.2018.12.022.
References
[1] E.B. Nelson, D. Guillot (Eds.), Well Cementing, second ed., Schlumberger, SugarLand, TX, 2006.
[2] R. Shortall, B. Davidsdottir, G. Axelsson, Geothermal energy for sustainable de-velopment: a review of sustainability impacts and assessment frameworks, Renew.Sustain. Energy Rev. 44 (2015) 391–406.
[3] R. Kiran, C. Teodoriu, Y. Dadmohammadi, R. Nygaard, D. Wood, M. Mokhtari,S. Salehi, Identification and evaluation of well integrity and causes of failure of wellintegrity barriers (A review), J. Nat. Gas Sci. Eng. 45 (2017) 511–526.
[4] A.N. Zeldin, L.E. Kukacka, N. Carciello, Polymer-cement-geothermal-well-comple-tion Materials, Brookhaven National Laboratory/U.S. Department of Energy,Washington, DC, 1980.
[5] T.J. Rockett, E.E. McEwen, J.P. Clappin, S.S. Feng, A.J. Ouellette, N.C. Thakore,S.J. Yuh, Phosphate-bonded Glass Cements for Geothermal Wells, BNL 51153,Brookhaven National Laboratory/U.S. Department of Energy, Washington, DC,1979.
[6] T. Sugama, Advanced Cements for Geothermalwells, BNL 77901-2007, BrookhavenNational Laboratory/U.S. Department of Energy, Washington, DC, 2006.
[7] K. Van Tittelboom, N. De Belie, Self-healing in cementitious materials-A review,Materials 6 (2013) 2182–2217.
[8] M. Wu, B. Johannesson, M. Geiker, A review: self-healing in cementitious materialsand engineered cementitious composite as a self-healing material, Constr. Build.Mater. 28 (2012) 571–583.
[9] P.H. Cavanagh, C.R. Johnson, S.L. Roy-Delage, G.G. DeBruijn, I. Cooper,D.J. Guillot, H. Bulte, B. Dargaud, Self-healing cement - novel technology to achieveleak-free wells, SPE/IADC, SPE/IADC Drilling Conference, Amsterdam, TheNetherlands, Richardson, TX, 2007.
[10] B.R. Reddy, F. Liang, R.M. Fitzgerald, D. Meadows, Self repairing cement compo-sites and methods of using same, U.S. Patent 7 (530) (2009) 396B1.
[11] B.R. Reddy, F. Liang, R.M. Fitzgerald, Self-healing cements that heal without de-pendance on fluid contact: a laboratory study, SPE Drill. Complet. 25 (2010)309–313.
[12] S.L. Roy-Delage, M. Martin-Beurel, K. Dismuke, E.B. Nelson, Self Adaptive CementSystems, U.S. Patent 8,469,095B2, 2013.
[13] H.X.D. Lee, H.S. Wong, N.R. Buenfeld, Self-sealing of cracks in concrete using su-perabsorbent polymers, Cement Concr. Res. 79 (2016) 194–208.
[14] W.T. Li, Z.W. Jiang, Z.H. Yang, H.T. Yu, Effective mechanical properties of self-healing cement matrices with microcapsules, Mater. Des. 95 (2016) 422–430.
[15] D. Snoeck, J. Dewanckele, V. Cnudde, N. De Belie, X-ray computed micro-tomography to study autogenous healing of cementitious materials promoted by
superabsorbent polymers, Cement Concr. Compos. 65 (2016) 83–93.[16] J. Todorovic, M. Raphaug, E. Lindeberg, T. Vralstad, M.L. Buddensiek, Remediation
of leakage through annular cement using a polymer resin: a laboratory study, in:R. Aarlien, N.A. Rokke, H.F. Svendsen (Eds.), 8th Trondheim Conference on Co2Capture, Transport and Storage, Elsevier Science Bv, Amsterdam, 2016, pp.442–449.
[17] H.L. Zhao, H.T. Yu, Y. Yuan, H.B. Zhu, Blast mitigation effect of the foamed cement-base sacrificial cladding for tunnel structures, Constr. Build. Mater. 94 (2015)710–718.
[18] M.I. Childers, M.T. Nguyen, K.A. Rod, P.K. Koech, W. Um, J. Chun, V.A. Glezakou,D. Linn, T.J. Roosendaal, T.W. Wietsma, N.J. Huerta, B.G. Kutchko, C.A. Fernandez,Polymer-cement composites with self-healing ability for geothermal and fossil en-ergy applications, Chem. Mater. 29 (2017) 4708–4718.
[19] M.T. Nguyen, Z.M. Wang, K.A. Rod, M.I. Childers, C. Fernandez, P.K. Koech,W.D. Bennett, R. Rousseau, V.A. Glezakou, Atomic origins of the self-healingfunction in cement-polymer, Compos. ACS Appl. Mater. Interfaces 10 (2018)3011–3019.
[20] P.E. Stutzman, J.R. Clifton, Specimen preparation for scanning electron microscopy,Proceedings of the 21st International Conference on Cement Microscopy,International Cement Microscopy Association, Las Vegas, NV, 1999, pp. 10–22.
[21] N. Thaulow, S. Sahu, S.R. Badger, Identification of phases in cement and concreteusing backscattered electron imaging, Proceedings of the 24th InternationalConference on Cement Microscopy, International Cement Microscopy Association,San Diego, CA, 2002, pp. 214–223.
[22] P.T. Durdzinski, C.F. Dunant, M. Ben Haha, K.L. Scrivener, A new quantificationmethod based on SEM-EDS to assess fly ash composition and study the reaction ofits individual components in hydrating cement paste, Cement Concr. Res. 73 (2015)111–122.
[23] Y.C.K. Chen-Wiegart, G. Williams, C.H. Zhao, H. Jiang, L. Li, M. Demkowicz,M. Seita, M. Short, S. Ferry, T. Wada, H. Kato, K.W. Chou, S. Petrash, J. Catalano,Y. Yao, A. Murphy, N. Zumbulyadis, S.A. Centeno, C. Dybowski, J. Thieme, Earlyscience commissioning results of the sub-micron resolution X-ray spectroscopybeamline (SRX) in the field of materials science and engineering, in: J. Thieme,D.P. Siddons (Eds.), Icxom23: International Conference on X-Ray Optics andMicroanalysis, 2016.
[24] Y.C.K. Chen-Wiegart, G. Williams, J. Thieme, https://www.bnl.gov/ps/beamlines/beamline.php?b=SRX, Brookhaven National Laboratory.
[25] D. Gursoy, F. De Carlo, X.H. Xiao, C. Jacobsen, TomoPy: a framework for theanalysis of synchrotron tomographic data, J. Synchrotron Radiat. 21 (2014)1188–1193.
[26] C.A. Schneider, W.S. Rasband, K.W. Eliceiri, NIH Image to ImageJ: 25 years ofimage analysis, Nat. Methods 9 (2012) 671–675.
[27] J.F. Barrett, N. Keat, Artifacts in CT: recognition and avoidance, Radiographics 24(2004) 1679–1691.
[28] J.A. Davis, J.O. Leckie, Surface ionization and complexation at oxide-water inter-face. 2. Surface propertire of amorphous iron oxyhydroxide and adsorption ofmetal-ions, J. Colloid Interface Sci. 67 (1978) 90–107.
[29] J. VandeVondele, M. Krack, F. Mohamed, M. Parrinello, T. Chassaing, J. Hutter,Quickstep: fast and accurate density functional calculations using a mixed Gaussianand plane waves approach, Comput. Phys. Commun. 167 (2005) 103–128.
[30] J.P. Perdew, K. Burke, M. Ernzerhof, Generalized gradient approximation madesimple, Phys. Rev. Lett. 77 (1996) 3865–3868.
[31] S. Grimme, Semiempirical GGA-type density functional constructed with a long-range dispersion correction, J. Comput. Chem. 27 (2006) 1787–1799.
[32] S. Goedecker, M. Teter, J. Hutter, Separable dual-space Gaussian pseudopotentials,Phys. Rev. B 54 (1996) 1703–1710.
[33] B.G. Lippert, J.H. Parrinello, Michele, A hybrid Gaussian and plane wave densityfunctional scheme, Mol. Phys. 92 (1997) 477–488.
[34] J. VandeVondele, J. Hutter, Gaussian basis sets for accurate calculations on mole-cular systems in gas and condensed phases, J. Chem. Phys. 127 (2007) 114105.
[35] G. Kovacevic, B. Persson, L. Nicoleau, A. Nonat, V. Veryazov, Atomistic modeling ofcrystal structure of Ca1.67SiHx, Cement Concr. Res. 67 (2015) 197–203.
[36] J.-P.L. Brunet, L. Li, Z.T. Karpyn, B.G. Kutchko, B. Strazisar, G. Bromhal, Dynamicevolution of cement composition and transport properties under conditions relevantto geological carbon sequestration, Energy Fuel. 27 (2013) 4208–4220.
[37] H.F.W. Taylor, Cement Chemistry, second ed., Thomas Telford, London, UK, 1997.[38] S. Diamond, The microstructure of cement paste and concrete - a visual primer,
Cement Concr. Compos. 26 (2004) 919–933.[39] B.G. Kutchko, B.R. Strazisar, D.A. Dzombak, G.V. Lowry, N. Thaulow, Degradation
of well cement by CO2 under geologic sequestration conditions, Environ. Sci.Technol. 41 (2007) 4787–4792.
[40] T. Sugama, Advanced Cements for Geothermal Wells, Brookhaven NationalLaboratory, 2006.
[41] R. Alizadeh, J.J. Beaudoin, L. Raki, Mechanical properties of calcium silicate hy-drates, Mater. Struct. 44 (2011) 13–28.
[42] M.-T.W. Nguyen, Zheming, Kenton A. Rod, M. Ian Childers, Carlos Fernandez,Phillip K. Koech, Wendy D. Bennett, Roger Rousseau, Glezakou, Vassiliki-alexandraatomic origins of self-healing function in cement-polymer composites, ACS Appl.Mater. Interfaces 10 (3) (2018) 3011–3019.
K.A. Rod et al. Cement and Concrete Composites 97 (2019) 279–287
287