Insights into the electrochemical reduction of CO2 on ...
32
GLOBAL CLIMATE AND ENERGY PROJECT | STANFORD UNIVERSITY Insights into the electrochemical reduction of CO 2 on metal surfaces Kendra Kuhl Etosha R. Cave, David N. Abram, Toru Hatsukade Prof. Thomas F. Jaramillo Chemical Engineering Stanford University GLOBAL CHALLENGES – GLOBAL SOLUTIONS – GLOBAL OPPORTUNITIES GCEP RESEARCH SYMPOSIUM 2012 | STANFORD, CA
Transcript of Insights into the electrochemical reduction of CO2 on ...

GLOBAL CLIMATE AND ENERGY PROJECT | STANFORD UNIVERSITY
Insights into the electrochemical reduction of CO2 on metal surfaces
Kendra Kuhl Etosha R. Cave, David N. Abram, Toru Hatsukade
Prof. Thomas F. Jaramillo
Chemical Engineering
Stanford University
GLOBAL CHALLENGES – GLOBAL SOLUTIONS – GLOBAL OPPORTUNITIES
GCEP RESEARCH SYMPOSIUM 2012 | STANFORD, CA
Chemicals
Reduction
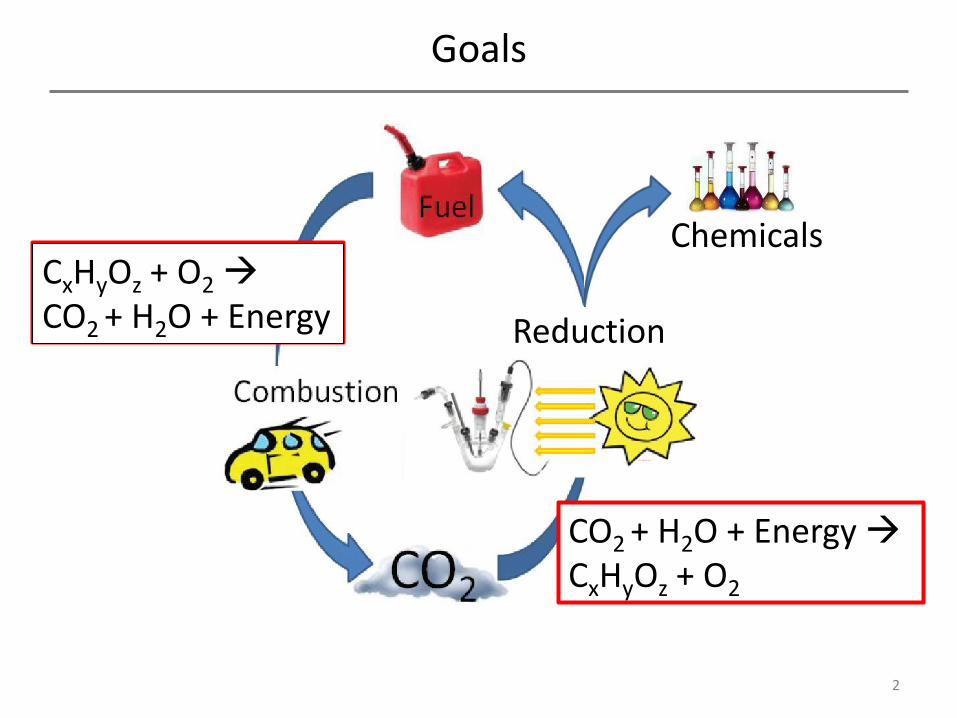
Goals
CxHyOz + O2 CO2 + H2O + Energy
CO2 + H2O + Energy CxHyOz + O2
2
CxHyOz + O2 CO2 + H2O + Energy

Electrochemistry
3
Water Oxidation (Anode) CO2 Reduction (Cathode)
Eο 1.23 V ~0 V
Overall Reaction:
O OHC Energy OH CO 2zyx22
)e 4(H O O2H -
22
OnH OHC )e m(H CO 2zyx
-
2
Need a Catalyst: Efficient + Selective
Fuels + Chemicals Overpotential:
-1 V
H )e 2(H 2
- 0 V Hydrogen Evolution:

CO2 Electroreduction Literature
4
Products determined by CO binding energy
X
Metals that bind CO strongly: Pt, Ni, Fe
Hydrocarbons, Alcohols
Metals that bind CO weakly: Au, Ag, Zn Intermediate CO binding: Cu
Andrew A. Peterson , Frank Abild-Pedersen , Felix Studt , Jan Rossmeisl and Jens K. Nørskov Energy Environ. Sci., 2010,3, 1311-1315
2e-, 2H+ Reduction
ne-, nH+ Reduction
Goal: better understanding of mechanism
CO2 Metal Surface
CO
H2

Electrolysis
5
Anode H2O O2 + 4(H+ + e-)
Cathode CO2 + m(H+ + e-) CxHyOz + H2O
4.5 cm2
electrode area 8 mL electrolyte volume
0.1 M KHCO3 electrolyte pH 6.8
Gas chromatograph for gas phase products
NMR for liquid phase products
Anode H2O O2 + 4(H+ + e-)
Cathode CO2 + m(H+ + e-) CxHyOz + H2O
0.1 M KHCO3 electrolyte pH 6.8
Gas chromatograph for gas phase products
NMR for liquid phase products

Transition Metals
• Cu, Ag, Au, Zn show good current efficiency for CO2 reduction
6 Increasing Overpotential
Weak CO binding
Strong CO binding
Intermediate CO binding

Metal H2 CO CH4 CH3OH C2’s HCOO-
Au
Ag
Zn
Cu
Pt
Ni
Fe
Products
• Major products match literature reports
• Hydrocarbon and/or alcohol production detected on all metals due to increased sensitivity of experimental setup
7
+
Major Products
Minor Products
Novel Products

2
6
8
10
12
14
16
18
4
Products on Cu
Reported Few Reports Novel
8
e-’s C1 C2 C3
Useful products!

2
6
8
10
12
14
16
18
4
Products on Cu
Reported Few Reports Novel
9
e-’s C1 C2 C3
Methane: main component of natural gas Ethylene: used to produce plastics

2
6
8
10
12
14
16
18
4
10
# e-’s C1 C2 C3
Acetic Acid 6.5 billion kg/yr ~$3.4 billion/yr
Acetone 6.7 billion kg/yr ~$8.0 billion/yr
Ethylene Glycol 6.7 billion kg/yr ~$8.7 billion/yr

Cu Tafel Plot
11
Energy Environ. Sci., 2012,5, 7050-7059
Methane and ethylene formed
via different pathways
C2 and C3
products share a similar formation
pathway
Increasing Overpotential

Proposed Pathway
12 Energy Environ. Sci., 2012,5, 7050-7059

Proposed Pathway
13
Dehydroxylation of enol and diol surface species responsible for C2 and C3 chemistry
Energy Environ. Sci., 2012,5, 7050-7059
Glyoxal
Acetate
Glycolaldehyde
Acetaldehyde
Ethylene
2H+, 2e- dehydroxylation
Conversion to diol
Ethylene Glycol
Ethanol

Summary
• Experimental setup allowed for sensitive product detection
• Hydrocarbon and/or alcohol production occured on all metals tested
• Suggested a pathway for C2 and C3 product formation on copper metal
http://duelingfuels.com/wp-content/uploads/2009/02/alternative-fuel.jpg 14
Basic understanding of CO2 reduction chemistry is needed to guide the design of improved catalysts

Questions?
Etosha R. Cave David N. Abram Toru Hatsukade Prof. Thomas F. Jaramillo
Thanks to:
And the rest of the Jaramillo lab

16

Energy Efficiency
• Energy input is determined by the difference between the anode and cathode potentials
• Thermodynamically:
• Water oxdation = 1.23 V
• CO2 reduction = 0 V
• Because of kinetics, actual applied potentials are much higher:
• Water oxidation = 1.6 V
• CO2 reduction = -1.1 V
• Energy efficiency is the ratio of thermodynamically require V / actual V:
• Thermodynamically: Vcell = 1.23
• Actually: Vcell = 2.7
• 1.23/2.7 ~ 45% efficiency
17

Possible CO2 Sources
• Fermentation
• Underground reservoirs
18
• Fossil fuel usage
• Air capture
O
OHH
HH
OHOH
H OH
H
OH
Ethanol + 2 CO2

Future Directions
• In-situ SERS to identify surface intermediates
• Effect of pH, temperature, and pressure
10 µm
• Reactivity of proposed intermediates
• Novel Materials
• Alloys
• Carbon nitrides
• Nanoparticles
?
pH C2H4

Proposed Pathway
20 Enol-like surface species responsible for C2 and C3 chemistry
Energy Environ. Sci., 2012,5, 7050-7059

Cu Surface Preparation
21

CO2 reduction on copper
22
Andrew A. Peterson , Frank Abild-Pedersen , Felix Studt , Jan Rossmeisl and Jens K. Nørskov Energy Environ. Sci., 2010,3, 1311-1315

Product Quantification/Detection
CH4 ~ 4.5 min
CO ~ 5.5 min CO2 ~ 10.5 min
CH2CH2 ~ 14 min
Gas chromatography for gas phase products
H2 ~ 1.5 min
NMR for liquid phase products 1H NMR for quantitation 600 MHz Varian Inova Water suppression
O O
H H
O
H H
O O
O-
O-
1H NMR detection limits: No protons Protons covered by water peak
13CO2 used to get higher signal for 13C NMR
23

24
NMR Stds
• Made 2-3 stds curves / product
• Error between different curves < 5%
• Acetaldehyde and propionaldehyde too volatile, used the avg m/H
Avg m % Err # protons m/H
Formate 0.19 1.2%
Allyl Alcohol 1.07 1.4% 2 0.54
Ethylene Glycol 2.10 1.1% 4 0.53
nPrOH 1.06 1.3% 2 0.53
Glycolaldehyde 0.94 0.5% 2 0.47
MeOH 1.57 3.2% 3 0.52
Acetone 3.20 1.4% 6 0.53
Hydroxy Acetone 1.41 4.1% 3 0.47
Acetate 1.64 2.9% 3 0.55
Acetaldehyde
EtOH 1.72 2.4% 3 0.57
Propionaldehyde
AVERAGE 0.52
ERR 6.9%
Peaks used to quantify

Product Detection Limitations
Low concentration
No proton signal Proton signal masked by water peak in NMR
Insoluble in water
O O
H H
Glyoxal
O
H HFormaldehyde
O O
O-
O-
Oxalate
Hydrocarbons with solubility below 100 µM
> 50 µA/cm2 for liquid phase products
> 10 µA/cm2 for gas phase products
25

Benchmarking
• Hori, Murata, Takahashi. J. Chem. Soc. Farad. Trans. 1 85:2309 1989.
• A.A. Peterson, F. Abild-Pedersen, F. Studt, J. Rossmeisl, and J.K. Norskov, Energy & Environ. Sci. 3 (2010) 1311-1315.
• K.P. Kuhl & T.F. Jaramillo
-0.6 -0.7 -0.8 -0.9 -1.0 -1.1 -1.2
0
10
20
30
40
50
60
70
80
Fa
rad
aic
Yie
ld (
%)
V vs. RHE
Hydrogen
Methane
Formate
CO
Ethylene
26

Current Efficiency
27
Energy Environ. Sci., 2012,5, 7050-7059
Low overpotential:
H2, CO, Formate
Intermediate overpotential
Methane and ethylene with many other minor products
High overpotential
Methane continues to increase while C2 and C3 products decrease

Tafel Plot
• H2, CO and formate pull near constant current across voltage range
• C2 and C3 products clearly rise and fall together suggesting a shared rate determining step
• Methane and ethylene slopes are different suggesting different rate determining steps
28 Kendra Kuhl - ECS 2011

CO2 Electroreduction Literature
29
• Hori, Y. (2003). CO2-reduction, catalyzed by metal electrodes. Handbook of Fuel Cells: Fundamentals,
Technology and Application. A. L. Wolf Vielstich, Hubert A. Gasteiger. Chichester, VHC-Wiley. 2: 720-
733.
CO2 CO Hydrocarbons/Alcohols Products determined by CO binding energy

Electrochemical Methods
• Hold at the desired potential for 1 hour
• Measure Products
• Determine current efficiency 30

Transition Metals
-1.4 -1.2 -1.0 -0.8 -0.6 -0.4 -0.2
-16
-12
-8
-4
0
Cu
Au
Pt
Ag
Ni
Fe
Zn
Cu
rre
nt
De
nsity (
mA
/cm
2)
V vs. RHE
-1.4 -1.2 -1.0 -0.8 -0.6 -0.4 -0.2 0.0
0
20
40
60
80
100
CO
2 R
ed
uctio
n E
ffic
ien
cy
V vs. RHE
Ni
Ag
Pt
Au
Cu
Fe
Zn
Cu, Ag, Au, Zn show good current efficiency for CO2 reduction
31
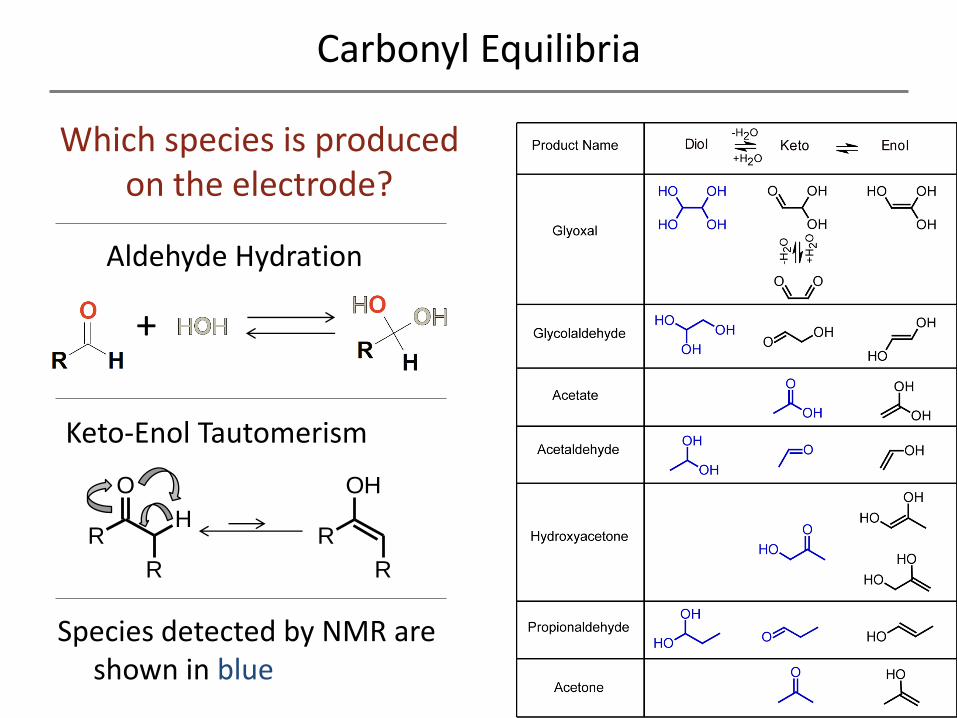
Carbonyl Equilibria
Species detected by NMR are shown in blue
RH
O
R
R
R
OH
Keto-Enol Tautomerism
Aldehyde Hydration
+
Which species is produced on the electrode?


![Electrochemical CO2 Reduction: A Classification Problem · 2017-10-26 · Electrochemical CO 2 Reduction: A Classification Problem Alexander Bagger, [a]Wen Ju, [b]Ana Sofia Varela,[c]](https://static.fdocuments.in/doc/165x107/5e53ef70e8b45b2fcc01a017/electrochemical-co2-reduction-a-classification-problem-2017-10-26-electrochemical.jpg)