Insights into hydroxyl measurements and atmospheric...
12
Atmos. Chem. Phys., 12, 8009–8020, 2012 www.atmos-chem-phys.net/12/8009/2012/ doi:10.5194/acp-12-8009-2012 © Author(s) 2012. CC Attribution 3.0 License. Atmospheric Chemistry and Physics Insights into hydroxyl measurements and atmospheric oxidation in a California forest J. Mao 1,2 , X. Ren 3 , L. Zhang 4 , D. M. Van Duin 4 , R. C. Cohen 5 , J.-H. Park 6 , A. H. Goldstein 6 , F. Paulot 7,* , M. R. Beaver 7,** , J. D. Crounse 7 , P. O. Wennberg 7 , J. P. DiGangi 8,*** , S. B. Henry 8 , F. N. Keutsch 8 , C. Park 9,**** , G. W. Schade 9 , G. M. Wolfe 10,***** , J. A. Thornton 10 , and W. H. Brune 4 1 Program in Atmospheric and Oceanic Sciences, Princeton University, Princeton, NJ, USA 2 Geophysical Fluid Dynamics Laboratory, NOAA, Princeton, NJ, USA 3 Air Resources Laboratory, NOAA, Silver Spring, MD, USA 4 Department of Meteorology, Pennsylvania State University, University Park, PA, USA 5 Department of Chemistry and Department of Earth and Planetary Science, University of California Berkeley, Berkeley, CA, USA 6 Department of Environmental Science, Policy, and Management, University of California Berkeley, Berkeley, CA, USA 7 Environmental Science and Engineering, California Institute of Technology, Pasadena, CA, USA 8 Department of Chemistry, University of Wisconsin-Madison, Madison, Wisconsin, USA 9 Department of Atmospheric Sciences, Texas A&M University, College Station, TX, USA 10 Department of Atmospheric Sciences, University of Washington, Seattle, WA, USA * now at: School of Engineering and Applied Sciences, Harvard University, Cambridge, MA, USA ** now at: National Exposure Research Laboratory, Environmental Protection Agency, Research Triangle Park, NC, USA *** now at: Department of Civil and Environmental Engineering, Princeton University, Princeton, NJ, USA **** now at: Department of Atmospheric Environmental Sciences, Pusan National University, South Korea ***** now at: Department of Chemistry, University of Wisconsin-Madison, Madison, Wisconsin, USA Correspondence to: J. Mao ([email protected]) Received: 22 February 2012 – Published in Atmos. Chem. Phys. Discuss.: 2 March 2012 Revised: 17 August 2012 – Accepted: 28 August 2012 – Published: 7 September 2012 Abstract. The understanding of oxidation in forest atmo- spheres is being challenged by measurements of unexpect- edly large amounts of hydroxyl (OH). A significant number of these OH measurements were made by laser-induced flu- orescence in low-pressure detection chambers (called Fluo- rescence Assay with Gas Expansion (FAGE)) using the Penn State Ground-based Tropospheric Hydrogen Oxides Sensor (GTHOS). We deployed a new chemical removal method to measure OH in parallel with the traditional FAGE method in a California forest. The new method gives on average only 40–60 % of the OH from the traditional method and this dis- crepancy is temperature dependent. Evidence indicates that the new method measures atmospheric OH while the tradi- tional method is affected by internally generated OH, possi- bly from oxidation of biogenic volatile organic compounds. The improved agreement between OH measured by this new technique and modeled OH suggests that oxidation chem- istry in at least one forest atmosphere is better understood than previously thought. 1 Introduction Forests emit copious amounts of biogenic volatile organic compounds (BVOCs) that react with ozone (O 3 ) and the hydroxyl radical (OH), thus creating many more oxidized volatile and semi-volatile chemicals. In the absence of ni- tric oxide (NO), a condition typical for remote forests, the oxidation chemistry removes ozone, regenerates some OH, removes hydrogen oxides by reactions among hydroper- oxyl (HO 2 ) and organoperoxyl (RO 2 ) radicals, and pro- duces semi-volatile secondary organic aerosols (SOA). The Published by Copernicus Publications on behalf of the European Geosciences Union.
Transcript of Insights into hydroxyl measurements and atmospheric...

Atmos. Chem. Phys., 12, 8009–8020, 2012www.atmos-chem-phys.net/12/8009/2012/doi:10.5194/acp-12-8009-2012© Author(s) 2012. CC Attribution 3.0 License.
AtmosphericChemistry
and Physics
Insights into hydroxyl measurements and atmosphericoxidation in a California forest
J. Mao1,2, X. Ren3, L. Zhang4, D. M. Van Duin4, R. C. Cohen5, J.-H. Park6, A. H. Goldstein6, F. Paulot7,*,M. R. Beaver7,** , J. D. Crounse7, P. O. Wennberg7, J. P. DiGangi8,*** , S. B. Henry8, F. N. Keutsch8, C. Park9,**** ,G. W. Schade9, G. M. Wolfe10,***** , J. A. Thornton10, and W. H. Brune4
1Program in Atmospheric and Oceanic Sciences, Princeton University, Princeton, NJ, USA2Geophysical Fluid Dynamics Laboratory, NOAA, Princeton, NJ, USA3Air Resources Laboratory, NOAA, Silver Spring, MD, USA4Department of Meteorology, Pennsylvania State University, University Park, PA, USA5Department of Chemistry and Department of Earth and Planetary Science, University of California Berkeley, Berkeley,CA, USA6Department of Environmental Science, Policy, and Management, University of California Berkeley, Berkeley, CA, USA7Environmental Science and Engineering, California Institute of Technology, Pasadena, CA, USA8Department of Chemistry, University of Wisconsin-Madison, Madison, Wisconsin, USA9Department of Atmospheric Sciences, Texas A&M University, College Station, TX, USA10Department of Atmospheric Sciences, University of Washington, Seattle, WA, USA* now at: School of Engineering and Applied Sciences, Harvard University, Cambridge, MA, USA** now at: National Exposure Research Laboratory, Environmental Protection Agency, Research Triangle Park, NC, USA*** now at: Department of Civil and Environmental Engineering, Princeton University, Princeton, NJ, USA**** now at: Department of Atmospheric Environmental Sciences, Pusan National University, South Korea***** now at: Department of Chemistry, University of Wisconsin-Madison, Madison, Wisconsin, USA
Correspondence to:J. Mao ([email protected])
Received: 22 February 2012 – Published in Atmos. Chem. Phys. Discuss.: 2 March 2012Revised: 17 August 2012 – Accepted: 28 August 2012 – Published: 7 September 2012
Abstract. The understanding of oxidation in forest atmo-spheres is being challenged by measurements of unexpect-edly large amounts of hydroxyl (OH). A significant numberof these OH measurements were made by laser-induced flu-orescence in low-pressure detection chambers (called Fluo-rescence Assay with Gas Expansion (FAGE)) using the PennState Ground-based Tropospheric Hydrogen Oxides Sensor(GTHOS). We deployed a new chemical removal method tomeasure OH in parallel with the traditional FAGE method ina California forest. The new method gives on average only40–60 % of the OH from the traditional method and this dis-crepancy is temperature dependent. Evidence indicates thatthe new method measures atmospheric OH while the tradi-tional method is affected by internally generated OH, possi-bly from oxidation of biogenic volatile organic compounds.The improved agreement between OH measured by this new
technique and modeled OH suggests that oxidation chem-istry in at least one forest atmosphere is better understoodthan previously thought.
1 Introduction
Forests emit copious amounts of biogenic volatile organiccompounds (BVOCs) that react with ozone (O3) and thehydroxyl radical (OH), thus creating many more oxidizedvolatile and semi-volatile chemicals. In the absence of ni-tric oxide (NO), a condition typical for remote forests, theoxidation chemistry removes ozone, regenerates some OH,removes hydrogen oxides by reactions among hydroper-oxyl (HO2) and organoperoxyl (RO2) radicals, and pro-duces semi-volatile secondary organic aerosols (SOA). The
Published by Copernicus Publications on behalf of the European Geosciences Union.

8010 J. Mao et al.: Insights into hydroxyl measurements and atmospheric oxidation
extensive global coverage of remote forests (Hansen et al.,2003) means that atmospheric chemistry of remote forestsinfluences the global oxidation capacity, ozone budget, SOAdistribution, and atmospheric lifetime of methane.
OH plays a central role in these atmosphere-biosphere in-teractions because OH oxidizes most of the BVOCs emittedin remote forests. However, several field studies in terrestrialvegetation have shown that measured OH exceeds modeledOH by a factor of 2 to 10 (Tan et al., 2001; Carslaw et al.,2001; Thornton et al., 2002; Lelieveld et al., 2008; Ren etal., 2008; Hofzumahaus et al., 2009; Whalley et al., 2011),thus indicating the chemistry of BVOCs is poorly under-stood. This discrepancy presents a challenge: the OH pro-duction rate needed to maintain these measured OH abun-dances is 2–10 times larger than current model mechanismscan support and would produce large amounts of HO2 andRO2 radicals (Faloona et al., 2001; Tan et al., 2001; Stone etal., 2011). However, such high levels of HO2 and RO2 werenot observed (Ren et al., 2008; Hofzumahaus et al., 2009;Whalley et al., 2011). These OH discrepancies helped mo-tivate the development of new improved isoprene oxidationmechanisms, but they generally have not been able to explainthe OH measurements (Butler et al., 2008; Hofzumahaus etal., 2009; Paulot et al., 2009a; Paulot et al., 2009b; Peeters etal., 2009; Peeters and Muller, 2010).
An alternate explanation is that our OH measurements arewrong in forests when alkene chemistry dominates. The ma-jority of all OH measurements in and above remote forestshave been made with laser induced fluorescence in low-pressure detection cells (often called Fluorescence Assaywith Gas Expansion (FAGE)) (Hard et al., 1984), and sev-eral of them by the Penn State instrument, the Ground-basedTropospheric Hydrogen Oxides Sensor (GTHOS). In thismethod, air is sampled through a pinhole. The OH absorbslight from a tunable, pulsed UV laser and then its fluores-cence is detected tens of nanoseconds later with a gateddetector. The OH fluorescence signal is separated from thebackground signal by periodically shifting the laser wave-length from an OH absorption line to nearby wavelengthswhere OH does not absorb (off-line). Interferences from OHgenerated by the laser have been ruled out by laboratory andfield studies for GTHOS (Ren et al., 2004) and the fluores-cence spectrum of the signal matches that of OH. However,it is possible that BVOC oxidation products form OH afterentering the instrument inlet and that this conversion is re-sponsible for the inexplicably high OH measurements in ourprior studies.
To test this possibility, we added a second method for de-tecting OH for a multi-investigator field campaign in a SierraNevada forest during summer 2009. In the second method,a chemical that removes OH was periodically added to theair just before it was sampled by the instrument. This zero-ing method has been used previously by Chemical IonizationMass Spectrometer instruments (Tanner et al., 1997) with thechemical being either propane or hexafluoropropene (C3F6).
We primarily used C3F6 because of its chemical and opticalproperties (Dubey et al., 1996), but also used propane dur-ing one day of the study. Here, we discuss the comparison ofthese two methods of determining OH from GTHOS with aphotochemical box model that has recent updates in BVOCoxidation mechanisms. Simultaneous measurements of theOH reactivity and of the hydroperoxyl radical (HO2) provideadditional information about the comparisons.
2 Methodology
2.1 Site description
The Biosphere Effects on Aerosols and Photochemistry Ex-periment II (BEARPEX09) was designed to examine thephotochemistry in and above the forest canopy with a widerange of state-of-the-art measurements. The field site was aPonderosa pine plantation near the Blodgett Forest ResearchStation (BFRS) in the California Sierra Nevada Moun-tains. BFRS is located 75 km northeast of Sacramento, CA(1315 m a.s.l., 38.9◦ N, 120.6◦ W). The mean canopy heightwas 8.9 m. The site included one 15 m walk-up tower inthe south and one 18 m scaffolding tower in the north. Twotowers were separated by 10 m. Most instruments were in-stalled on the north tower, including meteorological sensorsfor temperature, pressure, relative humidity and wind speed.An electric boom lift, on which OH, HO2 and OH reactivityinstruments were installed, was adjacent to the north tower.A propane generator was located 125 m north of the northtower. The sampling site could be intermittently influencedby generator plumes at night (but not daytime). Typical me-teorological conditions at the site are characterized by a dryseason from May to September with high daytime tempera-ture, low rainfall and low humidity, and consistent southwest-erly (upslope) wind during the day and northeasterly (downs-lope) wind at night.
Local biogenic VOC emission at BFRS consists mainlyof 2-methyl-3-buten-2-ol (MBO) (Schade et al., 2000),monoterpenes (particularlyβ-pinene) (Bouvier-Brown et al.,2009a), sesquiterpenes (Bouvier-Brown et al., 2009b), andrelated oxygenated compounds (Holzinger et al., 2005). Re-cent studies also identified a number of previously un-measured VOCs, such as sesquiterpenes, methyl chavicol(estragole), and related oxygenated compounds at BFRS(Bouvier-Brown et al., 2009c). Due to consistent south-westerly wind during daytime, BFRS is influenced by an-thropogenic emissions from the Greater Sacramento Area(∼75 km SW) and biogenic emissions from a 20–25 km wideband of oak woodlands (∼30 km SW) during daytime (Drey-fus et al., 2002). The biogenic plume usually arrives at 12:00-14:00 Pacific Standard Time (PST) with relatively high levelsof isoprene and its oxygenated products. The anthropogenicplume arrives at late afternoon between 18:00–20:00 PSTwith elevated levels of anthropogenic tracers (LaFranchi et
Atmos. Chem. Phys., 12, 8009–8020, 2012 www.atmos-chem-phys.net/12/8009/2012/

J. Mao et al.: Insights into hydroxyl measurements and atmospheric oxidation 8011
al., 2009). Thus the mixture of biogenic and anthropogenicinfluences changes during the day.
2.2 Two methods of OH measurements
Observations of OH, HO2 and OH reactivity were madefrom 20 June (day of year (DOY) = 171) to 30 July(DOY = 211) of 2009. OH and HO2 were measured by thePenn State Ground-based Tropospheric Hydrogen OxidesSensor (GTHOS) (Faloona et al., 2004) and OH reactivitywas measured by the OH reactivity instrument from the samegroup (Mao et al., 2009). GTHOS and OH reactivity instru-ment were both installed on the lift. This lift was manuallycontrolled to move from the ground to 17 m high (stopped atvarious heights) for the purpose of measuring vertical pro-file of radicals. Vertical profiling was conducted two to threetimes per day. For the rest of the time, the lift was mainly keptat a height of 9 m, 12 m, or 15 m. Little variability was foundfor OH, HO2 and OH reactivity at these three heights (lessthan 20 %), which is consistent with a model study (Wolfe etal., 2011), so we here use the measurements from all threeheights to improve measurement statistics.
OH was measured by Laser Induced Fluorescence (LIF)technique in a low pressure chamber (Faloona et al., 2004).OH absorbs laser light at a wavelength near 308 nm and theexcited OH emits fluorescence in the wavelength range from307 nm to 311 nm simultaneously. The fluorescence photonsare captured by a gated microchannel plate (MCP) detec-tor, which is set perpendicular to the airflow and the laserbeam. HO2 is converted to OH via its reaction with NO fol-lowed by the LIF measurement in a second detection axis ofthe GTHOS system. The laser system consists of a dye laserthat is pumped by a diode-pumped Nd:YAG laser (Spectra-Physics, X30SC-1060A) at 3 kHz pulse repetition. The out-put of the dye laser is used to excite OH. Tuning of the laserwavelength is achieved by an etalon. The etalon is tuned sothat the laser wavelength remains on-line of an OH absorp-tion line for 10 s and then nearby off-line wavelengths for10 s to measure the background. The difference in the aver-age on-line and average off-line signals is the OH fluores-cence signal, which is converted to an OH mixing ratio bycalibrations with a known amount of OH. The measured OHin this approach is called “OHwave”.
The second approach to measure OH is chemical modula-tion using the signal difference with and without the additionof high-purity gaseous hexafluoropropene (C3F6) to removeOH prior to the detection by LIF (Fig. 1). C3F6 is ideal as anOH scrubber as it reacts fast enough to remove OH and itsoptical absorption around 308 nm is also negligible (Dubeyet al., 1996). In order to inject C3F6 upstream of inlet flow,a 4 cm-long aluminum cylinder (OD 5.1cm and ID 2.5 cm)was installed on top of the GTHOS inlet. A 5-cm long PFAtube with ID of 1.9 cm was installed inside this cylinder toreduce the residence time of ambient air inside the cylin-der to∼100 ms. The flow through cylinder consisted of 7000
Figure 1. Schematic diagram of the detection system cross section. Gaseous C3F6 was injected simultaneously through four 0.25 mm needles pointed toward the center, which were located about 4 cm above the inlet. Hg lamp 1 was deployed in the field to ensure that the C3F6 or propane removed most of the externally generated OH. Hg lamp 2 and 3 were installed only in the lab to determine how much OH is removed internally with the external C3F6 addition. Hg lamp 2 was added just under the inlet cone and was shrouded so that it shone only across the flow and not up or down. Hg lamp 3 was inserted in the ring just above the OH detection cell and shone light into the sheath flow and the detection axis.
Fig. 1. Schematic diagram of the detection system cross section.Gaseous C3F6 was injected simultaneously through four 0.25 mmneedles pointed toward the center, which were located about 4 cmabove the inlet. Hg lamp 1 was deployed in the field to ensure thatthe C3F6 or propane removed most of the externally generated OH.Hg lamp 2 and 3 were installed only in the lab to determine howmuch OH is removed internally with the external C3F6 addition.Hg lamp 2 was added just under the inlet cone and was shrouded sothat it shone only across the flow and not up or down. Hg lamp 3was inserted in the ring just above the OH detection cell and shonelight into the sheath flow and the detection axis.
standard cubic centimeters per minute (sccm) that was sam-pled by the inlet and another 2000 sccm that was pulled bya vacuum pump through a ring-shaped gap between the tubeand the inlet. This “ring” flow minimized the sampling of airthat had been near the cylinder walls. Gaseous C3F6 was in-jected simultaneously through four 0.25 mm needles pointedtoward the center, which were located about 1 cm above theinlet (Fig. 1). C3F6 was added for two minutes every fourminutes; four different flow rates (1.1, 1.7, 2.2, and 3.3 sccm)were used during the study. An N2 flow of 100 sccm was con-tinuously added through the needles so that the periodic C3F6addition did not perturb the flow. This injection system, with-out C3F6 addition, caused negligible OH loss according toseveral laboratory and field tests in which the injection sys-tem was removed for an hour and the OHwave signal did notchange. On one day, propane was substituted for C3F6 withsimilar results. The difference in signal with and without the
www.atmos-chem-phys.net/12/8009/2012/ Atmos. Chem. Phys., 12, 8009–8020, 2012
8012 J. Mao et al.: Insights into hydroxyl measurements and atmospheric oxidation
addition of C3F6 is used to calculate the measured OH that isdefined as “OHchem”.
In some instrument configurations, OH can be generatedby the 308 nm laser beam inside the instrument. This OH isproduced in some LIF systems, including a previous versionof GTHOS, from the photolysis of ozone followed by the re-action of excited state oxygen atoms with H2O (Smith andCrosley, 1990). The OH generation by the laser can be testedby varying the laser power because laser-generated OH re-quires two photons – one to make OH and one to detect it – sothat the amount of detected laser-generated OH depends onthe square of the laser power. The current version of GTHOSwas designed and tested to minimize laser-generated OH.Also, a filter wheel has been used to suddenly attenuate thelaser power to the OH detection axis so that the laser powerdependence of the OH signal can always be tested.
2.3 Model simulation
A photochemical box model is used to examine the OH andHO2 measurements during BEARPEX09. The model usesthe Regional Atmospheric Chemistry Mechanism, Version 2(RACM2) (Henderson et al., 2011). Compared to the orig-inal RACM mechanism (Stockwell et al., 1997), RACM2now includes 117 total species (77 in RACM) and incorpo-rates large number of updates from Master Chemical Mech-anism (MCM), JPL and IUPAC kinetics updates. The orig-inal version of RACM2 is further modified with isoprenenitrate chemistry (Paulot et al., 2009a) and isoprene epox-ide chemistry (Paulot et al., 2009b), reduced unimolecularisomerization of isoprene hydroxyperoxy radicals (Peeters etal., 2009; Peeters and Muller, 2010; Crounse et al., 2011),terpene oxidation (Wolfe and Thornton, 2011), and MBOoxidation (Carrasco et al., 2007; Steiner et al., 2007; Chanet al., 2009). Photolysis rates were calculated by the Tropo-spheric Ultraviolet and Visible (TUV) radiation model (http://www.acd.ucar.edu/TUV) and then scaled based on the localPhotosynthetically Active Radiation (PAR) measurements.The model was constrained by measured meteorological pa-rameters and chemical species (Table S1) and run one day foreach data point, long enough to allow most calculated speciesto reach steady state but short enough to prevent the buildupof secondary products. Dry deposition was assumed for alde-hydes and peroxides with a lifetime of 30 hours (Karl et al.,2010). This box model is similar to other commonly used boxmodels. The model simulation used in the main body repre-sents the best knowledge of the current understanding of bio-genic oxidation chemistry. In addition, we have conductedmodel simulations with a variety of chemical mechanisms,which can be found in the supplement material.
Following the discovery by Fuchs et al.(2011) that RO2from BVOCs can be detected as HO2 in LIF systems, weconducted RO2 interference tests in the laboratory with thesame configuration deployed in the field for isoprene and sev-eral alkenes. The relative detection sensitivities are roughly
0.6, with a range from 0.45 to 0.75. Therefore we correctedHO2 measurements based on modeled isoprene peroxy rad-ical (ISOP), peroxy radicals from MACR (MACRO2 andMAO3) and peroxy radical from MVK (MVKO2) with a rel-ative sensitivity of 0.6. RO2 from MBO is not included, asmeasurements from MBO hydroperoxide indicates a muchlower level of MBO peroxy radical than model calculations,likely due to unknown removal mechanism of MBO RO2.We find that modeled HOx concentrations are relatively in-sensitive to the level of MBO RO2.
3 Results
3.1 Diurnal cycle
Figure 2 shows the diurnal cycle of measured and modeledOH between 20 June and 30 July 2009 near the Blodgett For-est Research Station (BFRS). While OHwave and OHchemshow a similar diurnal pattern, OHchem is only about 40–60 % of OHwave during daytime and 50 % at night, on aver-age. The question is then “Which one is the real OH?”
We first quantify the extent to which external OH is re-moved with the external C3F6 addition. Here external OH isambient atmospheric OH before sampling and internal OHis OH that is generated inside the low-pressure region ofGTHOS, from the inlet to the detection axis. A mercury lampwith 185 nm UV light emission was placed on the outer wallof the aluminum cylinder (Hg lamp 1 in Fig. 1). This lampwas turned on for 10 minutes every 4 h to produce OH byphotolyzing ambient water vapor: H2O + hν → OH + H,where H immediately combines with O2 to form HO2. Thisexternally generated OH signal was two orders of magnitudelarger than ambient OH and C3F6 addition removed about80 % at the 1.1 sccm C3F6 flow rate and 94 % at 3.3 sccm(Fig. 3). OHchem data were corrected for incomplete re-moval in the analysis program. The near-complete removalof OH generated by the Hg lamp 1 is the primary evidencethat OHchem is a measure of the real OH and that OHwaveis influenced by OH generated within GTHOS.
We then quantify the internal OH removal with the exter-nal C3F6 addition, by generating OH in two locations abovethe OH detection axis during laboratory studies. One lampwas placed just below the inlet (Hg lamp 2 in Fig. 1), gener-ating OH in the sampled flow and a second lamp was addedjust above the detection axis (Hg lamp 3 in Fig. 1) generat-ing OH in the detection axis itself. The lamp near the inletwas shrouded so that its light shone only across the flowtube and not up into the inlet or down into the detectioncell. C3F6 addition removed 3–10 % of the OH generatedin the OH detection axis but removed 25–60 % of the OHgenerated just below the instrument pinhole inlet, dependingon the C3F6 flow. Laboratory studies provide solid evidencethat internal OH is being generated primarily near and in theOH detection axis and quantify the amount of internal OH
Atmos. Chem. Phys., 12, 8009–8020, 2012 www.atmos-chem-phys.net/12/8009/2012/

J. Mao et al.: Insights into hydroxyl measurements and atmospheric oxidation 8013
Fig. 2. Diurnal cycle of measured and modeled OH between 20June and 30 July 2009 near the Blodgett Forest Research Sta-tion (BFRS). “OHwave” (blue line) is statistically different from“OHchem” (black line) and modeled OH (red line). The model in-corporates the current understanding of BVOC oxidation chemistry(see text for details). The vertical bars indicate OHchem’s absoluteuncertainty of± 45 % (2σ confidence), which comes from com-bining the uncertainty from the internally generated OH removedby the C3F6 addition used to measure OHchem (± 20 %) and theabsolute uncertainty of the OH measurements (± 40% at 2σ con-fidence). Note that OHchem here is corrected by 0.80 to accountfor the removal of internal OH by C3F6 addition (see supplementalmaterial). OHchem is similar to modeled OH, indicating a generallygood understanding of oxidation in this forest atmosphere.
remaining, which is 0.83± 0.08. To account for the small in-ternal OH removal, the difference between OH without andwith C3F6 must be multiplied by (0.80± 0.12) (see supple-mentary material). We retain the name “OHchem” for thiscorrected value, which is a quantitative measure of the realatmospheric OH.
Three lines of evidence indicate that the signals observedin BEARPEX09 were not laser generated. First, the observedOH signal was proportional to the laser power, not quadratic.Second, the difference for OH removal for the internal OHgeneration between near the inlet and near the detection axisindicates that the difference between OHwave and OHchemis not generated by the UV laser in the detection axis. Third,a recent laboratory test forα-pinene, MBO, andβ-pineneunder high ozone showed no laser power dependence of theOH signal with C3F6 on or off. Thus, any differences ob-served between OHwave and OHchem are not due to laser-generated OH.
Daytime OHchem is in much better agreement with mod-eled OH than is OHwave (Fig. 2). The ratio of OHwave tomodeled OH is 3.1± 0.7, while ratio of OHchem to modeledOH is 1.4± 0.3, both for hourly averages. The difference
Figure 3. Example of OH measurement with an external mercury lamp (Hg lamp 1 in Figure 1) producing OH and periodic C3F6 addition (3.3 sccm). The large OH value is when C3F6 is not added and the small value occurs when it is. The removal efficiency for this example is 94%.
Fig. 3.Example of OH measurement with an external mercury lamp(Hg lamp 1 in Fig. 1) producing OH and periodic C3F6 addition(3.3 sccm). The large OH value is when C3F6 is not added and thesmall value occurs when it is. The removal efficiency for this exam-ple is 94 %.
between OHwave and the model is statistically significantwhile the difference between OHchem and the modeled OHis not. Thus the modeled OH is consistent with the OHchem.
Nighttime OHchem also agrees better with modeled OH.A discrepancy between measured and modeled OH at nighthas been widely observed with the Penn State Ground-based Tropospheric Hydrogen Oxides Sensor (GTHOS) forOHwave, for which the measurement is typically 3 to 10times the modeled nighttime OH (Faloona et al., 2001). SinceOHchem (2.7± 1.8×10⁵ molecules cm−3) is somewhat lessthan half of OHwave (7.5± 0.8×10⁵ molecules cm−3) dur-ing night (22:00 to 04:00 PST), the discrepancy betweenmeasured and modeled OH (2.4± 0.6×10⁵ molecules cm−3)is largely improved.
Figure 4 shows the diurnal cycle of measured and mod-eled HO2 and OH reactivity between 20 June and 30 July2009 near BFRS. In general both measured HO2 and OH re-activity are in good agreement with modeled values, althoughsome large overestimates of HO2 were found for the modelusing the fast isomerization rates calculated by Peeters et al.(Peeters et al., 2009; Peeters and Muller, 2010) (Fig. S2).The difference between measured OH reactivity and the cal-culated OH reactivity from available measurements can besignificantly improved by the inclusion of oxidation prod-ucts from the model. We will further discuss these model-to-observation comparisons of HO2 and OH reactivity in thenext section.
www.atmos-chem-phys.net/12/8009/2012/ Atmos. Chem. Phys., 12, 8009–8020, 2012
8014 J. Mao et al.: Insights into hydroxyl measurements and atmospheric oxidation
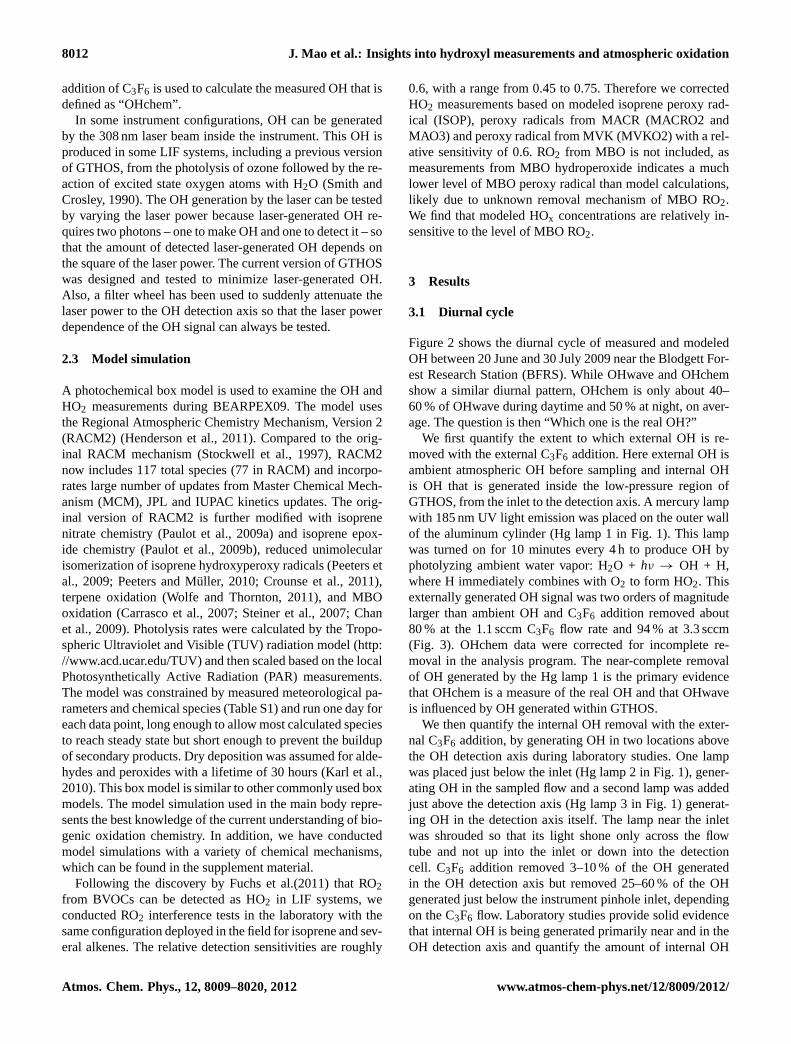
Fig. 4. Diurnal cycle of HO2 (a) and OH reactivity(b) between 20June and 30 July 2009 near the Blodgett Forest Research Station(BFRS). In the top panel, the shaded area below measured HO2(blue solid line) indicates the contribution to measured HO2 froman RO2 interference from isoprene, MVK and MACR (Fuchs et al.,2011). In the bottom panel, the calculated OH reactivity from avail-able measurements (LOH) is represented by a yellow line. The ab-solute uncertainty of the HO2 measurements is± 40 % at 2σ con-fidence. The absolute uncertainty of OH reactivity measurement is1 s−1 at 2σ confidence (Mao et al., 2009). The model incorporatesthe current understanding of BVOC oxidation chemistry (see textfor details).
3.2 Temperature dependence
Another remarkable feature is the observed temperature de-pendence for the discrepancy between OHwave and OHchem(Fig. 5a). OHwave agrees with OHchem for temperaturesnear 295K but becomes more than twice as large above300K. The modeled OH has a smaller temperature depen-dence similar to that of OHchem. Interestingly, the differencebetween OHwave and OHchem correlates with the OH reac-tivity (r2 = 0.94 for binned median values in Fig. 6), suggest-ing that laboratory studies should focus on BVOCs or theiroxidation products in a search to explain this interference. Aquestion is “What causes this interference signal?”
The spectrum of the interference signal matched the OHspectrum, implying that some chemical enters the GTHOSand then rapidly produces OH. After passing through the in-let hole, the sampled air experiences a supersonic isentropic
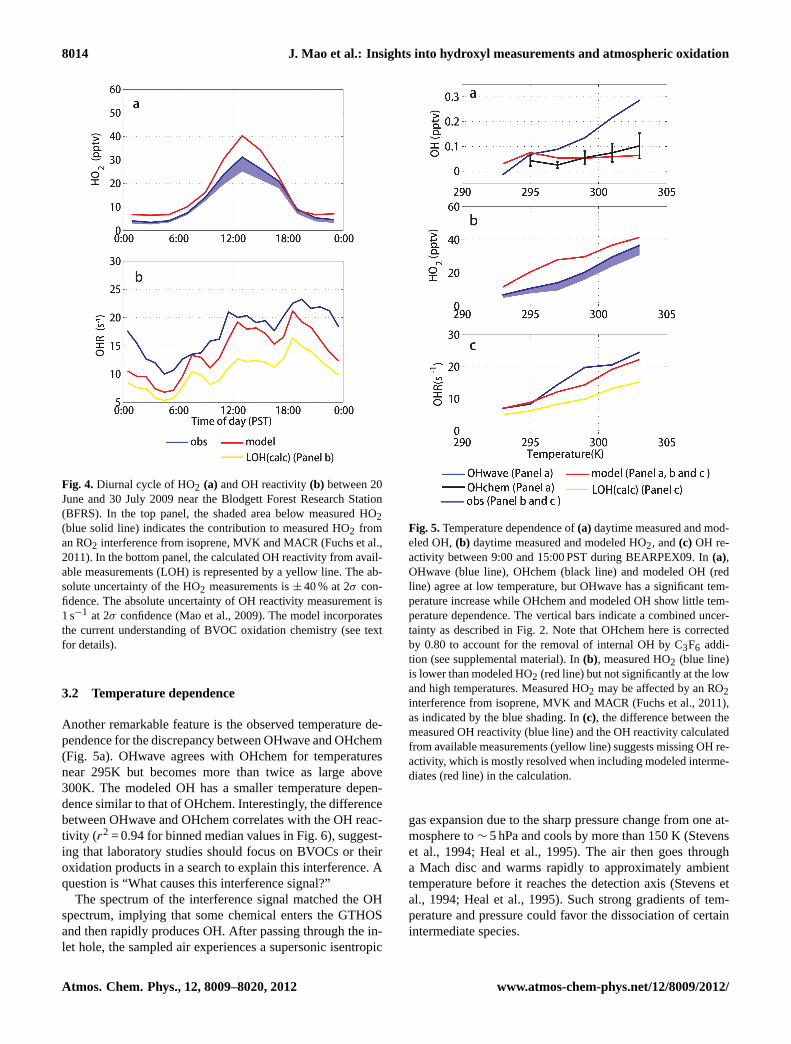
Fig. 5.Temperature dependence of(a) daytime measured and mod-eled OH,(b) daytime measured and modeled HO2, and(c) OH re-activity between 9:00 and 15:00 PST during BEARPEX09. In(a),OHwave (blue line), OHchem (black line) and modeled OH (redline) agree at low temperature, but OHwave has a significant tem-perature increase while OHchem and modeled OH show little tem-perature dependence. The vertical bars indicate a combined uncer-tainty as described in Fig. 2. Note that OHchem here is correctedby 0.80 to account for the removal of internal OH by C3F6 addi-tion (see supplemental material). In(b), measured HO2 (blue line)is lower than modeled HO2 (red line) but not significantly at the lowand high temperatures. Measured HO2 may be affected by an RO2interference from isoprene, MVK and MACR (Fuchs et al., 2011),as indicated by the blue shading. In(c), the difference between themeasured OH reactivity (blue line) and the OH reactivity calculatedfrom available measurements (yellow line) suggests missing OH re-activity, which is mostly resolved when including modeled interme-diates (red line) in the calculation.
gas expansion due to the sharp pressure change from one at-mosphere to∼ 5 hPa and cools by more than 150 K (Stevenset al., 1994; Heal et al., 1995). The air then goes througha Mach disc and warms rapidly to approximately ambienttemperature before it reaches the detection axis (Stevens etal., 1994; Heal et al., 1995). Such strong gradients of tem-perature and pressure could favor the dissociation of certainintermediate species.
Atmos. Chem. Phys., 12, 8009–8020, 2012 www.atmos-chem-phys.net/12/8009/2012/

J. Mao et al.: Insights into hydroxyl measurements and atmospheric oxidation 8015
Fig. 6. Scatter plot between the measured OH reactivity and thedifference between OHchem and OHwave between 09:00 and15:00 PST. The 10-min averaged points are colored by the ambi-ent temperature. The shaded blue area is the interquartile range ofthe data and the open circles are the median values in temperaturebins.
Laboratory evidence indicates that some intermediatespecies from ozonolysis (Kurpius and Goldstein, 2003; Fareset al., 2010) tend to promptly decompose and produce OH atlow pressure (Kroll et al., 2001; Donahue et al., 2011). Ex-amples are the Criegee Intermediates and vinyl hydroperox-ide (Herrmann et al., 2010), which promptly decompose on ashort time scale (< 10 µs) (Zhang et al., 2002). It is also pos-sible that such intermediate species come from other path-ways. For instance, C5-hydroperoxyaldehydes (HPALDs),proposed by Peeters et al. (2009), appear to preferentiallyform at higher temperatures via peroxy radical isomerizationfor isoprene (Crounse et al., 2011). Of all of these possi-bilities, the decomposition of the stable Criegee Intermedi-ate inside GTHOS appears to be the most likely candidate(Mauldin et al., 2012).
Such behavior may not be limited to isoprene. InBEARPEX09, MBO is the dominant species for OHloss due its local emission and high reactivity with OH(6.3× 10⁻¹¹ molecules cm−3 s−1 at 300 K) (Baasandorj andStevens, 2007). Despite the similar structure to isoprene, themodel treatment of MBO photooxidation is completely dif-ferent in terms of radical propagation. No OH-regeneratingmechanism has been reported for the oxidation of MBO byOH (Carrasco et al., 2007; Chan et al., 2009). The mecha-nism proposed by Peeters et al. (Peeters et al., 2009; Peetersand Muller, 2010) is not applicable for MBO peroxy radi-cals as the H-shift isomerization (the main pathway for pro-ducing HPALDs and HOx) requires that a 6- or 7-memberedring transition state can be formed between the peroxy radi-cal and a labile hydrogen atom. Although no laboratory evi-dence currently supports any of these possibilities, a reason-
able hypothesis is that the discrepancy between OHwave andOHchem is due to intermediate products that are commonlyproduced in the oxidation of different BVOCs.
Comparison of the measured and modeled HO2 providesan additional constraint on the model (Fig. S3b). Using thefast isomerization rates calculated by Peeters et al. (2009)and Peeters and Muller (2010), the box model calculatedHO2 mixing ratios which are up to 3 times greater than theHO2 measurements (Fig. S3 in the Supplement), consistentwith recent model-to-observation comparisons in other foreststudies (Kanaya et al., 2012; Lu et al., 2011; Whalley et al.,2011). However, when the isomerization rate is reduced forthe unimolecular isomerization channel in accordance withrecent laboratory studies (Crounse et al., 2011), the HO2from the Peeters mechanism comes into better agreementwith the HO2 measurements (Fig. S3b in the Supplement).Slight overestimation of HO2 could be attributed to an effi-cient aerosol reactive uptake (Mao et al., 2012), which is notincluded in the box model.
Comparison of the measured and calculated OH reactiv-ity, the inverse of the OH lifetime, is another constraint.In a previous forest field campaign (PROPHET, 1998 and2000), the measured OH reactivity was greater than the OHreactivity calculated using all available measurements (DiCarlo et al., 2004). This “missing OH reactivity” had a tem-perature dependence that matched the temperature depen-dence commonly used for the emission of terpenes, which ismOHR(T) = mOHR(293)·exp(0.11·(T-293)), where mOHRrepresents missing OH reactivity. During BEARPEX09, themeasured OH reactivity also exceeded that of the calculatedOH reactivity from individual measured species (Fig. 5c).The difference between the measured OH reactivity and thatcalculated using only measured species during BEARPEX09is mOHR(T) = mOHR(293)·exp(0.168·(T-293)). However, ifthe calculated OH reactivity includes reactions with modeledBVOC oxidation products (Table 1), then the measured andmodeled OH reactivity agree well within the uncertainties(Fig. 5c). Although MBO chemistry may not be well un-derstood, the contribution of OH reactivity from modeledMBO oxidation products can still provide a useful and rea-sonable metric to constrain OH loss in the model. This agree-ment provides evidence that the missing OH reactivity isnot mainly due to unmeasured BVOCs, such as unmeasuredsesquiterpenes, but instead is due to oxidation products ofmeasured BVOCs, consistent with recent investigations inthe missing OH reactivity (Lou et al., 2010; Kim et al., 2011;Wolfe et al., 2011).
4 Discussion and conclusions
Several instrument comparisons for OH measurements havebeen conducted in the past two decades to quantify the pos-sible errors in the understanding of radical chemistry. Theairborne comparisons suggest a relatively good agreement
www.atmos-chem-phys.net/12/8009/2012/ Atmos. Chem. Phys., 12, 8009–8020, 2012

8016 J. Mao et al.: Insights into hydroxyl measurements and atmospheric oxidation
Table 1. VOCs and other chemical species measured and used inthe OH reactivity calculation. Also listed are the unmeasured butmodeled species that could be major contributors to OH reactivity.
Measured species
α−Pinene HCHO Acetonitrileβ-Pinene Acetaldehyde HNO3Isoprene Isoprene MPAN
hydroxyhydroperoxideMethylbutenol (MBO) Glyoxal PANMethyl vinyl ketone (MVK) Glycolaldehyde PPNMethacrolein (MACR) Hydroxyacetone NO2Unidentified sesquiterpenes Methanol COMethyl Chavicol Ethanol HONOCamphene Butanol NOAcetone Isobutyl alcohol O3Benzene Toluene Butane
Unmeasured species as major contributors to OH reactivity
MBO oxidation products (2.2)∗
Isoprene epoxides (0.9)C3 and higher aldehydes (1.6)
∗ The numbers in the brackets indicate the median OH loss rates at 303 K in themodel with the units of s−1.
between two OH instruments. During the NASA PEM Trop-ics B aircraft campaign in 1999, OH was measured byboth Penn State LIF instrument on the NASA DC-8 air-craft and NCAR CIMS instrument on the NASA P-3B air-craft. These side-by-side flight intercomparisons show a ra-tio of LIF/CIMS OH from 0.8 near surface to 1.6 at 8 km(Eisele et al., 2001). During the NASA TRACE-P aircraftcampaign in 2001, the same two instruments show a ratioof LIF/CIMS OH roughly 0.7 for three legs of flight inter-comparisons between 0.2 and 5.3 m (Eisele et al., 2003), al-though this bias from TRACE-P intercomparisons is resolvedby the revision of the ATHOS calibration factor by a fac-tor of 1.64 for measurements from 2001 to 2006 (Ren et al.,2008; Mao et al., 2010). A more recent aircraft intercom-parison was conducted during the NASA ARTCAS aircraftcampaign, in which the same two instruments were both in-stalled on NASA DC-8 aircraft and therefore provides a farmore detailed examination. During ARCTAS, the campaign-average ratio of LIF/CIMS OH is 1.27, suggesting a reason-ably good agreement for the two instruments in a clean at-mosphere (Ren et al., 2012).
Ground comparisons for OH measurements were con-ducted in both ambient air and chamber tests. For cham-ber tests and clean air in rural sites, good agreement wasachieved between LIF instruments and DOAS instruments,including POPCORN field campaign (Brauers et al., 1996),and SAPHIR chamber tests (Schlosser et al., 2007; Schlosseret al., 2009). In addition, these intercomparisons provide ev-idence for no interference from ozone photolysis inside theLIF instruments, consistent with our tests. For a forest atmo-sphere, however, a persistent discrepancy was revealed be-tween CIMS instrument and three LIF instruments, in whichCIMS measured OH is less than all other LIF measured OH
by 30–40 % (Table 4 in Schlosser et al. 2009). In fact, iso-prene concentrations mainly ranged between 0.3 and 0.6 ppbduring the intercomparison period for that study (Schlosser etal. 2009), far less than the biogenic VOC level encounteredin BEARPEX09 (Table S1). Therefore it is possible that thediscrepancy could be larger in a BEARPEX09-like forest.
Furthermore, a recent intercomparison study in SAPHIRchamber between LIF and DOAS instrument also shows apositive bias by 30–40 % from LIF instrument for severalVOC species (MVK and aromatics), but not others (isopreneand MACR) (Fuchs et al., 2012). Further tests for terpenesand other BVOCs are required to quantify the possible inter-ference.
Another difference between our study and these chambertests could be the level of scavengers for stable Criegee In-termediates, including NO2 and SO2. A recent laboratorystudy suggests unexpectedly rapid reactions of Criegee In-termediates with NO2 and SO2 (Welz et al., 2012). Giventhat NO2 amounts in the chamber tests (1-2 ppb) (Fuchs etal., 2012) were significantly higher than the amounts duringBEARPEX09 (∼200 ppt), the stable Criegee Intermediatescould be suppressed by NO2 in those chamber tests, leadingto a smaller interference to be detected by their instruments.
The conclusion that OHchem is a measure of thereal atmospheric OH is supported by indirect evidencefrom the BEARPEX07 study (http://www.ocf.berkeley.edu/∼bearpex/), including the greatly improved agreement foracyl peroxy nitrates (LaFranchi et al., 2009) and glyoxal(Huisman et al., 2011) when the model is constrained with ascaled OHwave using the measured OHchem to OHwave ra-tios during BEARPEX09. Thus, these measurements of OH,HO2, and OH reactivity are generally consistent with our un-derstanding of BVOC oxidation chemistry as represented inthe model with recent updates in BVOC oxidation mecha-nisms.
Laboratory studies are underway to identify the sourceof the difference between OHwave and OHchem. However,identifying the cause of the OH interference and determin-ing its possible relevance to atmospheric processes will takesome time. On the other hand, it is important for the chem-istry modeling community to know that measurements of un-expectedly large OH may not be correct for all forested envi-ronments and that they should wait before implementing newBVOC oxidation chemistry in their models until the mea-surement issues are resolved.
Caution must be taken for applying this discrepancy toother LIF instruments. Instrument designs differ significantlyamong LIF instruments in terms of flow geometry, pump-ing speed, cell pressure, laser frequency and optical paths inthe detection cell. These differences can cause differences insupersonic expansion, temperature profiles from inlet to thedetection region, and flow residence time, which will lead todifferences in the amount of internally produced OH. Thisquestion could be answered by deploying the second methodof OH measurement on other LIF instruments.
Atmos. Chem. Phys., 12, 8009–8020, 2012 www.atmos-chem-phys.net/12/8009/2012/

J. Mao et al.: Insights into hydroxyl measurements and atmospheric oxidation 8017
This discrepancy may also vary across different forestedenvironments. The levels of ozone, OH, and amount andmix of BVOCs may all play a role in determining the dif-ference between OHwave and OHchem and the ratio ofOHchem/OHwave. In particular, in contrast to a mean of54 ppb ozone in BEARPEX09, observed daytime ozone intropical forests can be as low as 10 to 20 ppb (Lelieveld etal., 2008; Stone et al., 2011). Further investigation in a va-riety of forests with the same instruments is needed to testthese hypotheses.
This consistency between measured OH, HO2, and OHreactivity applies only to the Sierra Nevada forest in theBEARPEX09 study. It is not clear whether these findingsalso apply to other forest atmospheres or to the OH measure-ments with other FAGE-type instruments in other forests.Only measurements in those forest atmospheres with otherFAGE-type instruments will resolve this question.
Supplementary material related to this article isavailable online at:http://www.atmos-chem-phys.net/12/8009/2012/acp-12-8009-2012-supplement.pdf.
Acknowledgements.We thank the reviewers for their insightfulcomments. We acknowledge the contributions from Philip Feiner,Jennifer Gielen, and Josh Magerman for HOx measurementsand from Robin Weber for CO and O3 measurements duringBEARPEX09 study. We also acknowledge William Stockwell andWendy Goliff for the RACM2 mechanism. We thank Sierra PacificIndustries for the use of their land and the University of California,Berkeley, Center for Forestry, Blodgett Forest Research Stationfor cooperation in facilitating this research. We acknowledge theNSF Atmospheric Chemistry Program for the following grants:#0849475 (WHB); #0922562 (AHG); #0852406 (FNK); #0934408(POW, JDC, and MRB).
Edited by: J. Williams
References
Bouvier-Brown, N. C., Goldstein, A. H., Gilman, J. B., Kuster,W. C., and de Gouw, J. A.: In-situ ambient quantificationof monoterpenes, sesquiterpenes, and related oxygenated com-pounds during BEARPEX 2007: implications for gas- andparticle-phase chemistry, Atmos. Chem. Phys., 9, 5505–5518,doi:10.5194/acp-9-5505-2009, 2009a.
Bouvier-Brown, N. C., Goldstein, A. H., Worton, D. R., Matross, D.M., Gilman, J. B., Kuster, W. C., Welsh-Bon, D., Warneke, C.,de Gouw, J. A., Cahill, T. M., and Holzinger, R.: Methyl chav-icol: characterization of its biogenic emission rate, abundance,and oxidation products in the atmosphere, Atmos. Chem. Phys.,9, 2061–2074,doi:10.5194/acp-9-2061-2009, 2009b.
Bouvier-Brown, N. C., Holzinger, R., Palitzsch, K., and Goldstein,A. H.: Large emissions of sesquiterpenes and methyl chavicolquantified from branch enclosure measurements, Atmos. Envi-ron., 43, 389–401,doi:10.1016/j.atmosenv.2008.08.039, 2009c.
Brauers, T., Aschmutat, U., Brandenburger, U., Dorn, H., P, Haus-mann, M., Heßling, M., Hofzumahaus, A., Holland, F., Plass-Dulmer, C., and Ehhalt, D. H.: Intercomparison of troposphericOH radical measurements by multiple folded long path laser ab-sorption and laser induced fluorescence, Geophys. Res. Lett., 23,2545–2548,doi:10.1029/96gl02204, 1996.
Butler, T. M., Taraborrelli, D., Fischer, C. B. H., Harder, H., Mar-tinez, M., Williams, J., Lawrence, M. G., and Lelieveld, J.:Improved simulation of isoprene oxidation chemistry with theECHAM5/MESSy chemistry-climate model: lessons from theGABRIEL airborne field campaign, Atmos. Chem. Phys., 8,4529–4546,doi:10.5194/acp-8-4529-2008, 2008.
Carrasco, N., Doussin, J. F., O’Connor, M., Wenger, J. C., Picquet-Varrault, B., Durand-Jolibois, R., and Carlier, P.: Simulationchamber studies of the atmospheric oxidation of 2-methyl-3-buten-2-ol: Reaction with hydroxyl radicals and ozone un-der a variety of conditions, J. Atmos. Chem., 56, 33–55,doi:10.1007/s10874-006-9041-y, 2007.
Carslaw, N., Creasey, D. J., Harrison, D., Heard, D. E., Hunter, M.C., Jacobs, P. J., Jenkin, M. E., Lee, J. D., Lewis, A. C., Pilling,M. J., Saunders, S. M., and Seakins, P. W.: OH and HO2 radicalchemistry in a forested region of north-western Greece, Atmos.Environ., 35, 4725–4737, 2001.
Chan, A. W. H., Galloway, M. M., Kwan, A. J., Chhabra, P. S.,Keutsch, F. N., Wennberg, P. O., Flagan, R. C., and Seinfeld, J.H.: Photooxidation of 2-Methyl-3-Buten-2-ol (MBO) as a Poten-tial Source of Secondary Organic Aerosol, Environ. Sci. Tech-nol., 43, 4647–4652,doi:10.1021/es802560w, 2009.
Crounse, J. D., Paulot, F., Kjaergaard, H. G., and Wennberg,P. O.: Peroxy radical isomerization in the oxidation ofisoprene, Phys. Chem. Chem. Phys., 13, 13607–13613,doi:10.1039/C1CP21330J, 2011.
Di Carlo, P., Brune, W. H., Martinez, M., Harder, H., Lesher, R.,Ren, X. R., Thornberry, T., Carroll, M. A., Young, V., Shepson,P. B., Riemer, D., Apel, E., and Campbell, C.: Missing OH reac-tivity in a forest: Evidence for unknown reactive biogenic VOCs,Science, 304, 722–725, 2004.
Donahue, N. M., Drozd, G. T., Epstein, S. A., Presto, A. A., andKroll, J. H.: Adventures in ozoneland: down the rabbit-hole,Phys. Chem. Chem. Phys., 13, 10848–10857, 2011.
Dreyfus, G. B., Schade, G. W., and Goldstein, A. H.: Observationalconstraints on the contribution of isoprene oxidation to ozoneproduction on the western slope of the Sierra Nevada, California,J. Geophys. Res.-Atmos., 107, 4365,doi:10.1029/2001jd001490,2002.
Dubey, M. K., Hanisco, T. F., Wennberg, P. O., and Anderson,J. G.: Monitoring potential photochemical interference in laser-induced fluorescence measurements of atmospheric OH, Geo-phys. Res. Lett., 23, 3215–3218, 1996.
Eisele, F. L., Mauldin, R. L., Tanner, D. J., Cantrell, C., Kosci-uch, E., Nowak, J. B., Brune, B., Faloona, I., Tan, D., Davis, D.D., Wang, L., and Chen, G.: Relationship between OH measure-ments on two different NASA aircraft during PEM Tropics B, J.Geophys. Res.-Atmos., 106, 32683–32689, 2001.
www.atmos-chem-phys.net/12/8009/2012/ Atmos. Chem. Phys., 12, 8009–8020, 2012

8018 J. Mao et al.: Insights into hydroxyl measurements and atmospheric oxidation
Eisele, F. L., Mauldin, L., Cantrell, C., Zondlo, M., Apel, E., Fried,A., Walega, J., Shetter, R., Lefer, B., Flocke, F., Weinheimer, A.,Avery, M., Vay, S., Sachse, G., Podolske, J., Diskin, G., Barrick,J. D., Singh, H. B., Brune, W., Harder, H., Martinez, M., Bandy,A., Thornton, D., Heikes, B., Kondo, Y., Riemer, D., Sandholm,S., Tan, D., Talbot, R., and Dibb, J.: Summary of measurementintercomparisons during TRACE-P, J. Geophys. Res., 108, 8791,doi:10.1029/2002jd003167, 2003.
Faloona, I., Tan, D., Brune, W., Hurst, J., Barket, D., Couch, T. L.,Shepson, P., Apel, E., Riemer, D., Thornberry, T., Carroll, M.A., Sillman, S., Keeler, G. J., Sagady, J., Hooper, D., and Pater-son, K.: Nighttime observations of anomalously high levels ofhydroxyl radicals above a deciduous forest canopy, J. Geophys.Res.-Atmos., 106, 24315–24333, 2001.
Faloona, I. C., Tan, D., Lesher, R. L., Hazen, N. L., Frame, C. L.,Simpas, J. B., Harder, H., Martinez, M., Di Carlo, P., Ren, X. R.,and Brune, W. H.: A laser-induced fluorescence instrument fordetecting tropospheric OH and HO2: Characteristics and calibra-tion, J. Atmos. Chem., 47, 139–167, 2004.
Fares, S., McKay, M., Holzinger, R., and Goldstein, A. H.:Ozone fluxes in a Pinus ponderosa ecosystem are dominatedby non-stomatal processes: Evidence from long-term con-tinuous measurements, Agric. For. Meteorol., 150, 420–431,doi:10.1016/j.agrformet.2010.01.007, 2010.
Fuchs, H., Bohn, B., Hofzumahaus, A., Holland, F., Lu, K. D.,Nehr, S., Rohrer, F., and Wahner, A.: Detection of HO2 by laser-induced fluorescence: calibration and interferences from RO2radicals, Atmos. Meas. Tech., 4, 1209–1225,doi:10.5194/amt-4-1209-2011, 2011.
Fuchs, H., Dorn, H.-P., Bachner, M., Bohn, B., Brauers, T., Gomm,S., Hofzumahaus, A., Holland, F., Nehr, S., Rohrer, F., Tillmann,R., and Wahner, A.: Comparison of OH concentration measure-ments by DOAS and LIF during SAPHIR chamber experimentsat high OH reactivity and low NO concentration, Atmos. Meas.Tech., 5, 1611–1626,doi:10.5194/amt-5-1611-2012, 2012.
Hansen, M. C., DeFries, R. S., Townshend, J. R. G., Carroll, M.,Dimiceli, C., and Sohlberg, R. A.: Global Percent Tree Cover ata Spatial Resolution of 500 Meters: First Results of the MODISVegetation Continuous Fields Algorithm, Earth Interactions, 7,1–15, 2003.
Hard, T. M., O’Brien, R. J., Chan, C. Y., and Mehrabzadeh, A.A.: Tropospheric free radical determination by fluorescence as-say with gas expansion, Environ. Sci. Technol., 18, 768–777,doi:10.1021/es00128a009, 1984.
Heal, M. R., Heard, D. E., Pilling, M. J., and Whitaker, B. J.: On theDevelopment and Validation of FAGE for Local Measurement ofTropospheric OH and H02, J. Atmos. Sci., 52, 3428–3441, 1995.
Henderson, B. H., Pinder, R. W., Crooks, J., Cohen, R. C., Hutzell,W. T., Sarwar, G., Goliff, W. S., Stockwell, W. R., Fahr,A., Mathur, R., Carlton, A. G., and Vizuete, W.: Evaluationof simulated photochemical partitioning of oxidized nitrogenin the upper troposphere, Atmos. Chem. Phys., 11, 275–291,doi:10.5194/acp-11-275-2011, 2011.
Herrmann, F., Winterhalter, R., Moortgat, G. K., and Williams, J.:Hydroxyl radical (OH) yields from the ozonolysis of both doublebonds for five monoterpenes, Atmos. Environ., 44, 3458–3464,doi:10.1016/j.atmosenv.2010.05.011, 2010.
Hofzumahaus, A., Rohrer, F., Lu, K. D., Bohn, B., Brauers, T.,Chang, C. C., Fuchs, H., Holland, F., Kita, K., Kondo, Y., Li,
X., Lou, S. R., Shao, M., Zeng, L. M., Wahner, A., and Zhang, Y.H.: Amplified Trace Gas Removal in the Troposphere, Science,324, 1702–1704,doi:10.1126/science.1164566, 2009.
Holzinger, R., Lee, A., Paw, K. T., and Goldstein, U. A. H.: Ob-servations of oxidation products above a forest imply biogenicemissions of very reactive compounds, Atmos. Chem. Phys., 5,67–75,doi:10.5194/acp-5-67-2005, 2005.
Huisman, A. J., Hottle, J. R., Galloway, M. M., DiGangi, J. P., Co-ens, K. L., Choi, W., Faloona, I. C., Gilman, J. B., Kuster, W. C.,de Gouw, J., Bouvier-Brown, N. C., Goldstein, A. H., LaFranchi,B. W., Cohen, R. C., Wolfe, G. M., Thornton, J. A., Docherty, K.S., Farmer, D. K., Cubison, M. J., Jimenez, J. L., Mao, J., Brune,W. H., and Keutsch, F. N.: Photochemical modeling of glyoxalat a rural site: observations and analysis from BEARPEX 2007,Atmos. Chem. Phys., 11, 8883–8897,doi:10.5194/acp-11-8883-2011, 2011.
Kanaya, Y., Hofzumahaus, A., Dorn, H.-P., Brauers, T., Fuchs, H.,Holland, F., Rohrer, F., Bohn, B., Tillmann, R., Wegener, R.,Wahner, A., Kajii, Y., Miyamoto, K., Nishida, S., Watanabe, K.,Yoshino, A., Kubistin, D., Martinez, M., Rudolf, M., Harder,H., Berresheim, H., Elste, T., Plass-Dulmer, C., Stange, G., Kl-effmann, J., Elshorbany, Y., and Schurath, U.: Comparisons ofobserved and modeled OH and HO2 concentrations during theambient measurement period of the HOxComp field campaign,Atmos. Chem. Phys., 12, 2567–2585,doi:10.5194/acp-12-2567-2012, 2012.
Karl, T., Harley, P., Emmons, L., Thornton, B., Guenther, A.,Basu, C., Turnipseed, A., and Jardine, K.: Efficient AtmosphericCleansing of Oxidized Organic Trace Gases by Vegetation, Sci-ence, 330, 816–819,doi:10.1126/science.1192534, 2010.
Kim, S., Guenther, A., Karl, T., and Greenberg, J.: Contributions ofprimary and secondary biogenic VOC tototal OH reactivity dur-ing the CABINEX (Community Atmosphere-Biosphere INterac-tions Experiments)-09 field campaign, Atmos. Chem. Phys., 11,8613–8623,doi:10.5194/acp-11-8613-2011, 2011.
Kroll, J. H., Sahay, S. R., Anderson, J. G., Demerjian, K. L., andDonahue, N. M.: Mechanism of HOx Formation in the Gas-PhaseOzone-Alkene Reaction. 2. Prompt versus Thermal Dissociationof Carbonyl Oxides to Form OH, J. Phys. Chem. A, 105, 4446–4457,doi:10.1021/jp004136v, 2001.
Kurpius, M. R. and Goldstein, A. H.: Gas-phase chemistry domi-nates O3 loss to a forest, implying a source of aerosols and hy-droxyl radicals to the atmosphere, Geophys. Res. Lett., 30, 1371,doi:10.1029/2002gl016785, 2003.
LaFranchi, B. W., Wolfe, G. M., Thornton, J. A., Harrold, S. A.,Browne, E. C., Min, K. E., Wooldridge, P. J., Gilman, J. B.,Kuster, W. C., Goldan, P. D., de Gouw, J. A., McKay, M., Gold-stein, A. H., Ren, X., Mao, J., and Cohen, R. C.: Closing theperoxy acetyl nitrate budget: observations of acyl peroxy nitrates(PAN, PPN, and MPAN) during BEARPEX 2007, Atmos. Chem.Phys., 9, 7623–7641,doi:10.5194/acp-9-7623-2009, 2009.
Lelieveld, J., Butler, T. M., Crowley, J. N., Dillon, T. J., Fis-cher, H., Ganzeveld, L., Harder, H., Lawrence, M. G., Martinez,M., Taraborrelli, D., and Williams, J.: Atmospheric oxidationcapacity sustained by a tropical forest, Nature, 452, 737–740,doi:10.1038/nature06870, 2008.
Lou, S., Holland, F., Rohrer, F., Lu, K., Bohn, B., Brauers, T.,Chang, C. C., Fuchs, H., Haseler, R., Kita, K., Kondo, Y.,Li, X., Shao, M., Zeng, L., Wahner, A., Zhang, Y., Wang,
Atmos. Chem. Phys., 12, 8009–8020, 2012 www.atmos-chem-phys.net/12/8009/2012/

J. Mao et al.: Insights into hydroxyl measurements and atmospheric oxidation 8019
W., and Hofzumahaus, A.: Atmospheric OH reactivities inthe Pearl River Delta – China in summer 2006: measurementand model results, Atmos. Chem. Phys., 10, 11243–11260,doi:10.5194/acp-10-11243-2010, 2010.
Lu, K. D., Rohrer, F., Holland, F., Fuchs, H., Bohn, B., Brauers, T.,Chang, C. C., Haseler, R., Hu, M., Kita, K., Kondo, Y., Li, X.,Lou, S. R., Nehr, S., Shao, M., Zeng, L. M., Wahner, A., Zhang,Y. H., and Hofzumahaus, A.: Observation and modelling of OHand HO2 concentrations in the Pearl River Delta 2006: a missingOH source in a VOC rich atmosphere, Atmos. Chem. Phys., 12,1541–1569,doi:10.5194/acp-12-1541-2012, 2012.
Mao, J., Ren, X., Brune, W. H., Olson, J. R., Crawford, J. H., Fried,A., Huey, L. G., Cohen, R. C., Heikes, B., Singh, H. B., Blake,D. R., Sachse, G. W., Diskin, G. S., Hall, S. R., and Shetter, R.E.: Airborne measurement of OH reactivity during INTEX-B,Atmos. Chem. Phys., 9, 163–173,doi:10.5194/acp-9-163-2009,2009.
Mao, J., Ren, X., Chen, S., Brune, W. H., Chen, Z., Martinez,M., Harder, H., Lefer, B., Rappenglueck, B., Flynn, J., andLeuchner, M.: Atmospheric oxidation capacity in the summerof Houston 2006: Comparison with summer measurements inother metropolitan studies, Atmos. Environ., 44, 4107–4115,doi:10.1016/j.atmosenv.2009.01.013, 2010.
Mao, J., Fan, S., Jacob, D., and Travis, K.: Radical loss in the atmo-sphere from Cu-Fe redox coupling in aerosols, submitted, 2012.
Mauldin, R. L., Berndt, T., Sipila, M., Paasonen, P., Petaja, T., Kim,S., Kurten, T., Stratmann, F., Kerminen, V. M., and Kulmala, M.:A new atmospherically relevant oxidant of sulphur dioxide, Na-ture, 488, 193–196, 2012.
Paulot, F., Crounse, J. D., Kjaergaard, H. G., Kroll, J. H., Seinfeld, J.H., and Wennberg, P. O.: Isoprene photooxidation: new insightsinto the production of acids and organic nitrates, Atmos. Chem.Phys., 9, 1479–1501,doi:10.5194/acp-9-1479-2009, 2009a.
Paulot, F., Crounse, J. D., Kjaergaard, H. G., Kurten, A., St Clair,J. M., Seinfeld, J. H., and Wennberg, P. O.: Unexpected EpoxideFormation in the Gas-Phase Photooxidation of Isoprene, Science,325, 730–733,doi:10.1126/science.1172910, 2009b.
Peeters, J., Nguyen, T. L., and Vereecken, L.: HOx radical regener-ation in the oxidation of isoprene, Phys. Chem. Chem. Phys., 11,5935–5939,doi:10.1039/b908511d, 2009.
Peeters, J. and Muller, J. F.: HOx radical regeneration in isopreneoxidation via peroxy radical isomerisations. II: experimental ev-idence and global impact, Phys. Chem. Chem. Phys., 12, 14227–14235,doi:10.1039/c0cp00811g, 2010.
Ren, X., Mao, J., Brune, W. H., Cantrell, C. A., Mauldin III, R. L.,Hornbrook, R. S., Kosciuch, E., Olson, J. R., Crawford, J. H.,Chen, G., and Singh, H. B.: Airborne intercomparison of HOxmeasurements using laser-induced fluorescence and chemicalionization mass spectrometry during ARCTAS, Atmos. Meas.Tech., 5, 2025–2037,doi:10.5194/amt-5-2025-2012, 2012.
Ren, X. R., Harder, H., Martinez, M., Faloona, I. C., Tan, D., Lesher,R. L., Di Carlo, P., Simpas, J. B., and Brune, W. H.: Interferencetesting for atmospheric HOx measurements by laser-induced flu-orescence, J. Atmos. Chem., 47, 169–190, 2004.
Ren, X. R., Olson, J. R., Crawford, J. H., Brune, W. H., Mao, J. Q.,Long, R. B., Chen, Z., Chen, G., Avery, M. A., Sachse, G. W.,Barrick, J. D., Diskin, G. S., Huey, L. G., Fried, A., Cohen, R. C.,Heikes, B., Wennberg, P. O., Singh, H. B., Blake, D. R., and Shet-ter, R. E.: HOx chemistry during INTEX-A 2004: Observation,
model calculation, and comparison with previous studies, J. Geo-phys. Res.-Atmos., 113, D05310,doi:10.1029/2007jd009166,2008.
Schade, G. W., Goldstein, A. H., Gray, D. W., and Lerdau, M. T.:Canopy and leaf level 2-methyl-3-buten-2-ol fluxes from a pon-derosa pine plantation, Atmos. Environ., 34, 3535–3544, 2000.
Schlosser, E., Bohn, B., Brauers, T., Dorn, H.-P., Fuchs, H., Haseler,R., Hofzumahaus, A., Holland, F., Rohrer, F., Rupp, L., Siese,M., Tillmann, R., and Wahner, A.: Intercomparison of TwoHydroxyl Radical Measurement Techniques at the AtmosphereSimulation Chamber SAPHIR, J. Atmos. Chem., 56, 187–205,doi:10.1007/s10874-006-9049-3, 2007.
Schlosser, E., Brauers, T., Dorn, H. P., Fuchs, H., Haseler, R.,Hofzumahaus, A., Holland, F., Wahner, A., Kanaya, Y., Kajii,Y., Miyamoto, K., Nishida, S., Watanabe, K., Yoshino, A., Ku-bistin, D., Martinez, M., Rudolf, M., Harder, H., Berresheim, H.,Elste, T., Plass-Dulmer, C., Stange, G., and Schurath, U.: Techni-cal Note: Formal blind intercomparison of OH measurements: re-sults from the international campaign HOxComp, Atmos. Chem.Phys., 9, 7923–7948,doi:10.5194/acp-9-7923-2009, 2009.
Smith, G. P. and Crosley, D. R.: A Photochemical Modelof Ozone Interference Effects in Laser Detection ofTropospheric OH, J. Geophys. Res., 95, 16427–16442,doi:10.1029/JD095iD10p16427, 1990.
Steiner, A. L., Tonse, S., Cohen, R. C., Goldstein, A. H., andHarley, R. A.: Biogenic 2-methyl-3-buten-2-ol increases regionalozone and HOx sources, Geophys. Res. Lett., 34, L15806,doi:10.1029/2007gl030802, 2007.
Stevens, P. S., Mather, J. H., and Brune, W. H.: Measure-ment of tropospheric OH and HO2 by laser-induced fluo-rescence at low pressure, J. Geophys. Res., 99, 3543–3557,doi:10.1029/93jd03342, 1994.
Stockwell, W. R., Kirchner, F., Kuhn, M., and Seefeld, S.: Anew mechanism for regional atmospheric chemistry modeling,J. Geophys. Res.-Atmos., 102, 25847–25879, 1997.
Stone, D., Evans, M. J., Edwards, P. M., Commane, R., Ingham,T., Rickard, A. R., Brookes, D. M., Hopkins, J., Leigh, R. J.,Lewis, A. C., Monks, P. S., Oram, D., Reeves, C. E., Stewart, D.,and Heard, D. E.: Isoprene oxidation mechanisms: measurementsand modelling of OH and HO2 over a South-East Asian tropicalrainforest during the OP3 field campaign, Atmos. Chem. Phys.,11, 6749–6771,doi:10.5194/acp-11-6749-2011, 2011.
Tan, D., Faloona, I., Simpas, J. B., Brune, W., Shepson, P. B.,Couch, T. L., Sumner, A. L., Carroll, M. A., Thornberry, T., Apel,E., Riemer, D., and Stockwell, W.: HOx budgets in a deciduousforest: Results from the PROPHET summer 1998 campaign, J.Geophys. Res.-Atmos., 106, 24407–24427, 2001.
Tanner, D. J., Jefferson, A., and Eisele, F. L.: Selected ion chemicalionization mass spectrometric measurement of OH, J. Geophys.Res., 102, 6415–6425,doi:10.1029/96jd03919, 1997.
Thornton, J. A., Wooldridge, P. J., Cohen, R. C., Martinez, M.,Harder, H., Brune, W. H., Williams, E. J., Roberts, J. M., Fehsen-feld, F. C., Hall, S. R., Shetter, R. E., Wert, B. P., and Fried, A.:Ozone production rates as a function of NOx abundances andHOx production rates in the Nashville urban plume, J. Geophys.Res., 107, 4146,doi:10.1029/2001jd000932, 2002.
Welz, O., Savee, J. D., Osborn, D. L., Vasu, S. S., Perci-val, C. J., Shallcross, D. E., and Taatjes, C. A.: Direct Ki-netic Measurements of Criegee Intermediate (CH2OO) Formed
www.atmos-chem-phys.net/12/8009/2012/ Atmos. Chem. Phys., 12, 8009–8020, 2012

8020 J. Mao et al.: Insights into hydroxyl measurements and atmospheric oxidation
by Reaction of CH2I with O2, Science, 335, 204–207,doi:10.1126/science.1213229, 2012.
Whalley, L. K., Edwards, P. M., Furneaux, K. L., Goddard, A., In-gham, T., Evans, M. J., Stone, D., Hopkins, J. R., Jones, C. E.,Karunaharan, A., Lee, J. D., Lewis, A. C., Monks, P. S., Moller,S. J., and Heard, D. E.: Quantifying the magnitude of a missinghydroxyl radical source in a tropical rainforest, Atmos. Chem.Phys., 11, 7223–7233,doi:10.5194/acp-11-7223-2011, 2011.
Wolfe, G. M. and Thornton, J. A.: The Chemistry of Atmosphere-Forest Exchange (CAFE) Model – Part 1: Model descrip-tion and characterization, Atmos. Chem. Phys., 11, 77–101,doi:10.5194/acp-11-77-2011, 2011.
Wolfe, G. M., Thornton, J. A., Bouvier-Brown, N. C., Goldstein, A.H., Park, J. H., McKay, M., Matross, D. M., Mao, J., Brune, W.H., LaFranchi, B. W., Browne, E. C., Min, K. E., Wooldridge,P. J., Cohen, R. C., Crounse, J. D., Faloona, I. C., Gilman, J.B., Kuster, W. C., de Gouw, J. A., Huisman, A., and Keutsch,F. N.: The Chemistry of Atmosphere-Forest Exchange (CAFE)Model – Part 2: Application to BEARPEX-2007 observations,Atmos. Chem. Phys., 11, 1269–1294,doi:10.5194/acp-11-1269-2011, 2011.
Zhang, D., Lei, W. F., and Zhang, R. Y.: Mechanism of OH for-mation from ozonolysis of isoprene: kinetics and product yields,Chem. Phys. Lett., 358, 171–179, 2002.
Atmos. Chem. Phys., 12, 8009–8020, 2012 www.atmos-chem-phys.net/12/8009/2012/