insights in recent guidelines in management of diabetic hypertensive dyslipidemic

24thInternational Conference on Structural Mechanics in Reactor Technology (SMiRT 24) - 15th International Post-Conference Seminar on “FIRE SAFETY IN NUCLEAR POWER PLANTS AND INSTALLATIONS“
INSIGHTS FROM RECENT FIRE TESTING – CURRENT TRANSFORMERS AND INSTRUMENTATION CIRCUIT
RESPONSE TO FIRE
Gabriel Taylor1, Alice Muna2, Chris LaFleur2
1 U.S. Nuclear Regulatory Commission (NRC), Washington, DC, United States of America 2 Sandia National Laboratories (SNL), Albuquerque, NM, United States of America
*This report was prepared as an account of work sponsored by an agency of the U.S. Government. Neither the U.S. Government nor any agency thereof, nor any of their employees, make any warranty, expressed or implied, or assume any legal liability or responsibility for any third party’s use, or the results of such use, of any information, apparatus, product, or process disclosed in this report, or represents that its use by such third party would not infringe privately owned rights. The views expressed in this paper are not neces-sarily those of the U.S. Nuclear Regulatory Commission. Official contribution of Sandia National Laborato-ries (SNL) and U.S. Nuclear Regulatory Commission are not subject to copyright in the United States. ABSTRACT Fire testing has played a pivotal role in advancing the knowledge-base and state-of-the-art methods for quantifying fire-induced electrical circuit failures. These advancements have supported revisions to regulatory guidance and risk assessment methods. While much is known on the response of control and power circuits to the effects of fire, recent collabora-tive efforts have identified several areas where additional research via testing could provide justification for updating guidance and methods. Under two separate efforts, the U.S. Nucle-ar Regulatory Commission (NRC) has sponsored limited scope testing efforts to understand the failure modes of current transformers and instrumentation cables from thermally damag-ing conditions. Secondary fires caused by fire-induced failure of current transformers (CTs) were postulated in the 1980s and are assumed to occur in industry guidance. While theoretically possible, differing views exist on the possibility of such phenomena actually occurring. In an effort to fully understand this concern and to resolve long standing debate of the issue, the NRC, in cooperation with the Electric Power Research Institute (EPRI) working under a Memoran-dum of Understanding (MOU), sponsored Brookhaven National Laboratory (BNL) to perform a series of experiments involving CTs. Sixty-three test configurations were performed. These experiments confirmed that the open secondary crest voltage was dependent on CT core design, primary voltage, primary current, and the CTs turns ratio. None of the experi-ments demonstrate the possibility of an open CT secondary resulting in a secondary fire. In no instance overheating or arcing were observed on any portion of the CT or secondary ca-ble’s insulating system. Given the nature of this testing, these results provide a strong tech-nical basis that the postulated safety concern does not pose a secondary fire risk. The failure behaviour of instrumentation cables and circuits from the effects of fire is not well understood. A handful of tests performed by the NRC as part of a nuclear industry testing program in 2001 demonstrated mixed results. To better understand instrumentation circuit failure modes, the NRC sponsored Sandia National Laboratories (SNL) to perform a limited set of experiments on instrumentation cables and circuits. A total of 39 small-scale tests were conducted. Ten different instrumentation cables were tested, ranging from one con-ductor to eight-twisted pairs. Three test circuits were used to simulate typical instrumenta-tion circuits present in nuclear power plants: a 4 – 20 mA current loop, a 10 – 50 mA current loop, and a 1 – 5 VDC voltage loop. A regression analysis was conducted to determine key variables affecting signal decay time. The tests provided evidence that instrumentation ca-

2
ble can experience slow signal decay under fire-exposure conditions. The signal decay times ranged from 0 to 2 minutes for one cable type and 0 to 21 minutes for another. Findings from this research also identified key variables that influence the signal decay time to be time to failure (dependent variable) and number of conductors (independent variable). INTRODUCTION The U.S. NRC conducts experimental investigations to support successful regulation and oversight. Over time, the purpose of testing has changed to meet the specific needs of the NRC. Early fire research focused on confirming the correctness of regulatory requirements (1975 - 1987). Next came a period of time where select topical areas were evaluated to support fire-risk analyses being performed at several nuclear power plants (NPPs) (1987 - 1993). Subsequent research focused on specific fire-induced safety hazards such as the ef-fects of smoke on digital equipment, performance of penetration seals, turbine building risk, and fire-related operational experience review (1994 - 1998). The 1995 Commission Policy statement on the use of probabilistic risk assessment (PRA) shifted the focus of fire research to fill gaps in the four functional areas of Fire PRA, namely prevention, detection and sup-pression, mitigation, and quantitative evaluation of fire safety (1998 - 2005). This research culminated with the development of the keystone document describing the methodology to perform fire PRAs for nuclear facilities (i.e., NUREG/CR-6850, “Fire PRA Methodology”). As the methodologies have matured and been applied in regulatory application, a need for addi-tional research has risen to bridge knowledge gaps. Recently, the NRC performed a series of research projects involving expert judgement in the area of fire-induced circuit response [1], [2]. One insight from this work was a need for addi-tional research to address a knowledge gap related to current transformers and to better un-derstand the failure modes of instrumentation cable damaged under severe fire conditions. This paper summarizes the results from these two programs. Each program is described separately with a discussion of the background of the issue, experimental approach, and conclusions presented. CURRENT TRANSFORMERS Background and Safety Concern Current transformers (CTs) are used in NPPs to monitor current in electrical distribution sys-tems. Different types of CTs are available including wound, bar, window, bushing, auxiliary, and ground sensor types. However, the window-type dominates the types of CTs used in NPP’s AC power distribution system applications and is the focus of this research. The win-dow-type CTs considered here have a laminated core of high-permeability steel with a sec-ondary winding insulated from and permanently assembled on the core. The window-type CTs have no primary winding as an integral part of the CT structure. The primary winding (bus bar or cable) is located through the window of the CT. Figure 1 shows typical window-type CTs installed on three-phase conductors inside an electrical enclosure. Under normal operating conditions, a CT reproduces a scaled-down current waveform of the current flowing in the primary circuit. This scaled-down current can then be used by protec-tive relays, metering, and other applications. The alternating current in the primary winding (known as excitation current) produces an alternating magnetic field in the core, which then induces an alternating current in the secondary winding circuit. The primary and secondary circuits are magnetically coupled so that the secondary current is linearly proportional to the primary current over an intended normal operational range.

3
Figure 1 Window-type CTs shown with bus bar as primary circuit [3]. Electromagnetic principles establish the importance of operating the CT core in a specific zone of its excitation curve. Figure 2 shows the excitation curve and associated zones of op-eration. Normally the CT operates in the linear portion (Non-saturated Zone 1) of the excita-tion curve (i.e., primary current = secondary current x turns ratio); while under open second-ary condition, it operates near or above its knee (Intermediate Zone 2 or Saturated Zone 3). However, under this abnormal condition, the CT still attempts to maintain the current ratio (i.e., primary ÷ secondary). Under open-circuit conditions on the CT secondary circuit, a high crest (or peak) voltage on the secondary circuit would occur. The high crest voltage is due to the electromagnetic coupling of the CT, which causes the CT to attempt to maintain the current relationship dictated by the CTs turns ratio. Provided that current is flowing in the primary circuit, this condition can result in CT damage, potentially generating voltages that may exceed the dielectric strength of the CT’s insulating materials and may cause arcing to connected or nearby components.
Figure 2 Excitation curve [3].
In a letter to the NRC dated July 21, 1983 [4], Brookhaven National Laboratory (BNL) raised a potential concern associated with fire-induced open-circuit in a CT’s secondary circuit. The letter postulated the scenario in which potentially high voltage induced on the secondary winding of a CT as a result of open-circuiting the CT’s secondary circuit due to a fire ulti-mately causes the CT and/or the connected components to fail in a manner that could poten-tially start a secondary fire. A secondary fire, as used in this report, refers to a fire at a loca-tion remote from the original fire that is responsible for the initial open-circuit in the CT’s sec-
1
23
Vs
I
Intermediate Zone
Non-saturated Zone
Saturated Zone
Excitation Curve
m

4
ondary circuit. This secondary fire would defeat the design fire assumption of a single fire occurring. From the CT’s physical location in the plant to the main control room instrument indications, the secondary circuit may consist of long (e.g., hundreds of feet) instrument wires whose in-sulation is susceptible to both initial and secondary fires. The resulting high voltage condition in the secondary from an open-circuited CT introduces a potential concern for fire protection strategies in NPPs. Because the post-fire safe shutdown analysis is based on postulating a fire in one fire area at a time, the possibility of a second fire in a separate fire area can im-pact the final outcome of the fire protection strategies. Currently, NRC-endorsed [5] industry guidance [6] for conducting a post-fire safe shutdown circuit analysis identifies circuit failures due to an open circuit. An example provided in Section 3.5.2.1 of NEI 00-01, Rev. 2 [6] in-cludes: Open circuits on a high voltage (e.g., 4.16 kV) ammeter current transformer (CT) cir-cuit may result in secondary damage, possibly resulting in occurrence of an additional fire in the location of the CT itself. Joint research performed by the NRC collaboratively with the Electric Power Research Insti-tute (EPRI) concluded that this safety concern is not credible for CTs with turns-ratios of 1200:5. Although a belief was held by most that this conclusion could be extended to CTs with larger turns ratios, data were not available. As such, the group of experts recommended that testing was warranted to the range of CT turns rations found in the plant electrical distri-bution system [1], [2]. This work was subsequently performed by BNL in 2016 under NRC and EPRI direction. Approach The testing evaluated the possibility of larger turns ratio CTs (i.e., > 1200:5) to create a sec-ondary fire when the CTs secondary is operating under open-circuited conditions with cur-rent flowing in the CT primary. The testing focused on characterizing the transition of the ex-citing (or magnetizing) current from the very low magnitude under normal operating condi-tions to an open secondary condition with no current in the secondary but high voltages that could act as a fire ignition source. The testing assumed that an open-circuit condition of an energized CT occurred (due to fire damage); however, the open was created mechanically rather the from fire damage. The open-circuit is expected to cause abnormally high voltages in the secondary circuit, provided that the flow of the primary current continues. Two scenarios were postulated that could be affected by the saturation of the CT’s magnetic core and the high voltage in the open secondary circuit:
1. The open secondary crest voltage in the secondary circuit exceeds the breakdown voltage of the cable’s insulating system.
2. The CT itself gets overheated after being exposed to a very long core saturation pe-riod, or an arcing occurs at the CT’s secondary taps that may need over 20 – 40 kV crest voltage for an air gap of 1 - 2 inches [7].
Test variations included: • Primary voltages: 500 V, 250 V, 125 V. • Two AMRAN CT types: fixed-ratio 2000:5 CT; multi-ratio 4000:5 CT. • Primary current 60 A to 4,000 A for fixed-ratio of 2000:5 CT. • Turn ratios of 500:5 to 4000:5 for multi-ratio CT. • Fast, intermittent opening, and arcing simulations for open circuit configuration.
Testing was conducted at a BNL facility equipped with configurable three-phase low-voltage power sources and state-of-the-art high-speed data acquisition systems. Figure 3 shows the testing power supply used for the CT testing. The power supply was configured as a three-phase delta/wye source connected to a variable load bank to control the amount of current flowing in the test circuit. The CT under test was connected to one leg of the supply.

5
Figure 3 Test power supply configuration.
Two different models of AMRAN CTs were tested. A 2000:5 CT (identified as “AM2CT”) was of the fixed-ratio type, while the 4000:5 CT (identified as “AM4CT”) is a multi-ratio CT. Both CTs meet the ANSI/IEEE C57.13 Standard, and their outer encapsulations were enclosed in plastic-cases. Numerous measurements were made during each test. Figure 4 illustrates the instrumenta-tion and test setup used. The ‘A’ phase of the power supply serves as the primary circuit of the CT. The secondary side of the CT is connected to a high-voltage relay, a shunt, and an ampere meter. The burden resistor (i.e., an ammeter) and about 100 feet of secondary cable were used to simulate an actual plant’s typical configuration. The CT’s secondary side was instrumented with a relay to create the open circuit configuration. The increase in the sec-ondary voltage and decrease in secondary current was recorded via high-voltage isolation modules connected to a high-speed data acquisition system. Other parameters monitored during testing included primary current (harmonics and RMS values) and primary voltage and the surface temperature of the CT. A high-speed video camera also was used to capture the arcing and fire formation (if any) at several strategic locations. These cameras were syn-chronized with the high-speed data acquisition system to get secondary circuit characteris-tics during the arcing process (if any). Baseline tests were performed using the 2000:5 CT without creating an open circuit. The baseline tests were used to verify the correct voltage and current configuration. Following successful baseline testing, 51 open secondary test configurations were performed using both fixed-ratio CT 2000:5 (AM2CT) and multi-ratio CT 4000:5 (AM4CT). Table 1 presents the test matrix. Additional tests of certain test configurations were performed to simulate the effects of long duration, test repeatability, intermittent relay opening, time step optimization, and other conditions such as arcing. Thus, a total of 63 tests involving two CTs
.78 Ohm.78 Ohm
.78 Ohm
Three Phase480VAC,
1600 AmpSwitch
C
B
A
700 AmpCircuit
Breaker
700 AmpCircuit Breaker
2nd System
800:5AC Current
Transformers
Remote Controlled700 amp
Contactor
400 Amp Resistor
Load Bank
CT UnderTest
400 Amp
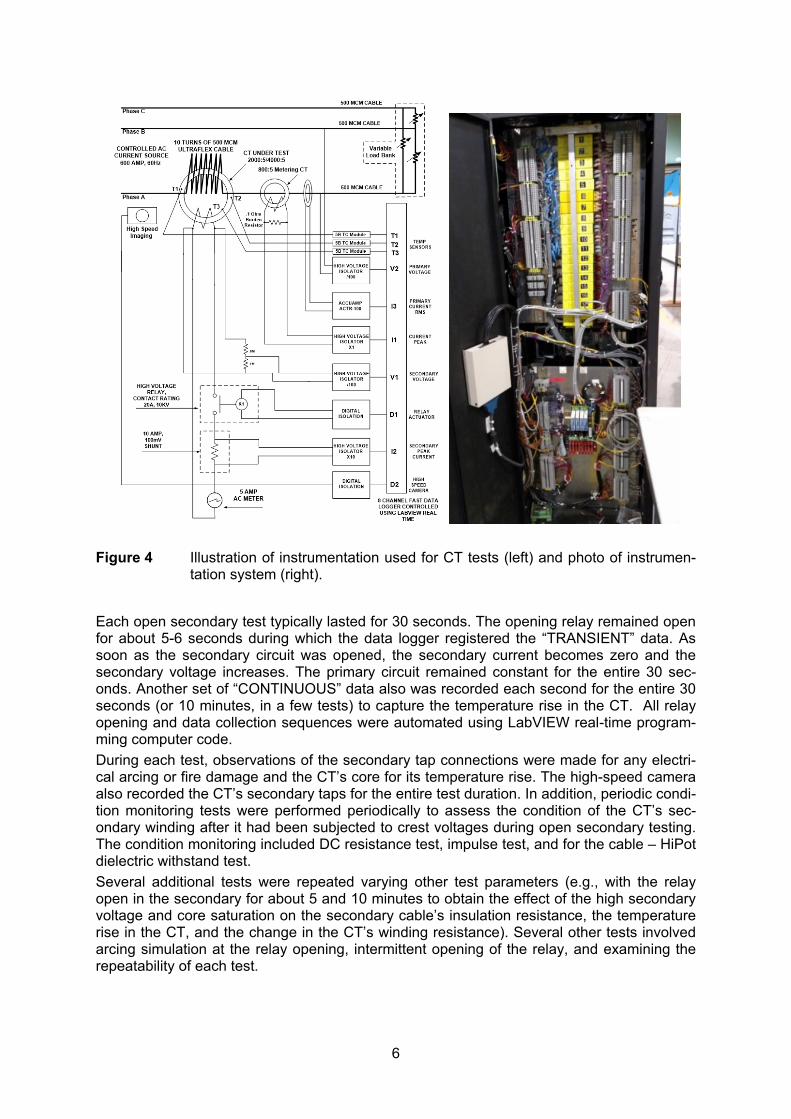
6
Figure 4 Illustration of instrumentation used for CT tests (left) and photo of instrumen-tation system (right).
Each open secondary test typically lasted for 30 seconds. The opening relay remained open for about 5-6 seconds during which the data logger registered the “TRANSIENT” data. As soon as the secondary circuit was opened, the secondary current becomes zero and the secondary voltage increases. The primary circuit remained constant for the entire 30 sec-onds. Another set of “CONTINUOUS” data also was recorded each second for the entire 30 seconds (or 10 minutes, in a few tests) to capture the temperature rise in the CT. All relay opening and data collection sequences were automated using LabVIEW real-time program-ming computer code. During each test, observations of the secondary tap connections were made for any electri-cal arcing or fire damage and the CT’s core for its temperature rise. The high-speed camera also recorded the CT’s secondary taps for the entire test duration. In addition, periodic condi-tion monitoring tests were performed periodically to assess the condition of the CT’s sec-ondary winding after it had been subjected to crest voltages during open secondary testing. The condition monitoring included DC resistance test, impulse test, and for the cable – HiPot dielectric withstand test. Several additional tests were repeated varying other test parameters (e.g., with the relay open in the secondary for about 5 and 10 minutes to obtain the effect of the high secondary voltage and core saturation on the secondary cable’s insulation resistance, the temperature rise in the CT, and the change in the CT’s winding resistance). Several other tests involved arcing simulation at the relay opening, intermittent opening of the relay, and examining the repeatability of each test.

7
Table 1 Test Matrix
Test # CT Turns Ratio
Primary Voltage
Primary Current
Secondary Current
Test # CT Turns Ratio
Primary Voltage
Primary Current
Secondary Current
2CT01 2000:5 480-500 2000 5.00 4CT06 1500:5 480-500 1500 5.00
2CT02 2000:5 480-500 1500 3.75 4CT07 1000:5 480-500 1000 5.00
2CT03 2000:5 480-500 1000 2.50 4CT08 500:5 480-500 500 5.00
2CT04 2000:5 480-500 500 1.25 4CT09 2000:5 220-250 2000 5.00
2CT05 2000:5 480-500 250 0.62 4CT10 1500:5 220-250 1500 5.00
2CT06 2000:5 480-500 125 0.31 4CT11 1000:5 220-250 1000 5.00
2CT07 2000:5 220-250 2000 5.00 4CT12 500:5 220-250 500 5.00
2CT08 2000:5 220-250 1500 3.75 4CT13 1000:5 110-125 1000 5.00
2CT09 2000:5 220-250 1000 2.50 4CT14 500:5 110-125 500 5.00
2CT10 2000:5 220-250 500 1.25 4CT15 4000:5 480-500 4000 5.00
2CT11 2000:5 220-250 250 0.62 4CT16 4000:5 480-500 3000 3.75
2CT12 2000:5 220-250 125 0.31 4CT17 4000:5 480-500 2000 2.50
2CT13 2000:5 220-250 62 0.15 4CT18 4000:5 480-500 1000 1.25
2CT14 2000:5 110-125 1000 2.50 4CT19 4000:5 480-500 500 0.62
2CT15 2000:5 110-125 500 1.25 4CT20 4000:5 480-500 2500 0.31
2CT16 2000:5 110-125 250 0.62 4CT21 4000:5 480-500 125 0.16
2CT17 2000:5 110-125 125 0.31 4CT22 4000:5 480-500 62 0.08
2CT18 2000:5 110-125 62 0.16 4CT23 2000:5 480-500 4000 10.0
2CT19 2000:5 480-500 2500 6.25 4CT24 2000:5 480-500 3000 7.50
2CT20 2000:5 480-500 3000 7.50 4CT25 2000:5 480-500 2000 5.00
2CT21 2000:5 480-500 4000 10.00 4CT26 2000:5 480-500 1000 2.50
4CT01 4000:5 480-500 4000 5.00 4CT27 2000:5 480-500 500 1.25
4CT02 3500:5 480-500 3500 5.00 4CT28 2000:5 480-500 250 0.62
4CT03 3000:5 480-500 3000 5.00 4CT29 2000:5 480-500 125 0.31
4CT04 2500:5 480-500 2500 5.00 4CT30 2000:5 480-500 62 0.16
4CT05 2000:5 480-500 2000 5.00
Results Out of 51 test conditions, 21 tests on 2000:5 CT (AM2CT) and 30 test conditions on 4000:5 CT (AM4CT) were conducted. In each test, the primary voltage and primary current re-mained constant and independent of what was happening in the secondary circuit (i.e., from a closed secondary circuit to an open secondary configuration). When the relay opened the secondary circuit, the secondary current dropped to zero amperes, and the secondary volt-age increased from zero to several thousand volts. Figure 5 presents a typical current and voltage waveform response. Temperature measurements made on the CT demonstrated minimal temperature rise (less than 5 °C increase per test).

8
Figure 5 Typical waveforms for secondary circuit current (left) and voltage (right).
Unlike a voltage transformer (VT), under normal conditions, CT’s primary voltage has a min-imal effect on its operation. However, because of the CT’s inherent turn ratio the primary cur-rent level has significant effect on the instrumentation readout of the secondary current. The primary voltage, along with the primary current and the turn ratio, has an effect on the CT’s behaviour under an abnormal open secondary condition. Figure 6 illustrates the dependen-cies of the open secondary crest voltage with the primary voltage and primary current levels keeping the turn ratio constant. The results presented here are taken from the AM2CT tests. This clearly indicates that the open secondary crest voltage is dependent on the primary cur-rent as well as the primary voltage.
Figure 6 Open secondary crest voltage versus primary voltage/current (2000:5 turns ratio).
Based on the testing performed under this effort, no single test produced signs of arcing or explosive failure nor was there sufficient temperature increase to cause ignition of surround-ing materials. The testing clearly demonstrated the initial assumed fire protection guidance to postulate a secondary fire caused by an open circuit in a window-type CT secondary cir-cuit is unsubstantiated.

9
INSTRUMENTATION CIRCUITS Background and Project Need Development and maintenance of a fire probabilistic risk assessment (PRA) involves per-forming circuit analysis and circuit failure mode likelihood analysis to support realistic esti-mates of plant risk from fire. Significant research efforts have been performed in this area since the early 2000s [8], [9], [10], [11]. The results from these efforts provide a strong tech-nical basis for the different modes of failure of power and control cables exposed to fire con-ditions. Instrumentation circuit on the other hand are less understood with regard to their re-sponse to fire damage. Of the several hundred tests performed in recent times, less than 10 have focused on the circuit response of instrumentation circuits. That test series was per-formed by the Nuclear Energy Institute (NEI) and the Electric Power Research Institute (EPRI) in 2001 [8]. For instrumentation circuits, these early tests concluded that thermo-plastic (TP) insulated cables generally displayed no characteristics of signal degradation pri-or to complete loss of signal and thermoset (TS) insulated cables displayed up to 10 minutes of signal degradation prior to complete loss of signal. Instrumentation circuits provide critical information to operators regarding the status of plant conditions. Circuit fault effects on instrument systems are unique and can be more complex than power and control circuits. Instrument sensors typically convert process variable values (temperature, pressure, level, flow, etc.) to an electric signal (e.g., voltage and current) for transmission to a remote readout or display. Instrumentation readings can also be used to actuate an automatic plan response because instrumentation circuits can be tied to process equipment such as the reactor protection system and the engineering safeguard feature ac-tuation system. The chaotic nature of fire and the lack of empirical data in this area have resulted in the use of worst-case assumptions for circuit analysis of instrumentation circuits. In addition, opera-tor response may be impacted for some response conditions if fire-induced damage results in signal degradation that causes inaccurate indication. Better understanding of the failure modes and effects of instrumentation circuits could support a stronger basis for performing a more realistic fire PRA and operator response procedures for fire scenarios involving instru-mentation cable and circuits. To evaluate these phenomena, the NRC sponsored SNL to perform a scoping study to better understand the fire-induced failure modes of instrumenta-tion cables. This research is intended to better quantify the cable failure modes (i.e., leaks in current) that may occur before catastrophic failure in instrumentation circuits. This work in-cluded initial bench-scale testing necessary to identify focus areas for further study to fully address the research question and to support refinement/development of implementation guidance. The Typical Instrumentation Circuit Current loops typically used in nuclear power plants exist in two forms: 10-50 mA (old stand-ard) and 4 - 20 mA (new standard). In either case, the principle of operation is the same: cur-rent produced by the loop power supply is sent around the loop, flowing through every de-vice and load or burden device in the circuit. The current is modulated into a process varia-ble by a transmitter, which converts a sensor’s measurement into a current signal and ampli-fies and conditions the output. A sensor typically measures parameters such as tempera-ture, humidity, flow, level, or pressure. The current loop has a receiver, a device that inter-prets the current signal into units that can be easily understood by the operators. The re-ceiver converts the 4 – 20 mA current back into a voltage that can be displayed, or can actu-ate another component based on its start/stop logic. In this example, 4 mA represents 0 percent of the measurement, and 20 mA represents 100 percent; when the current is be-
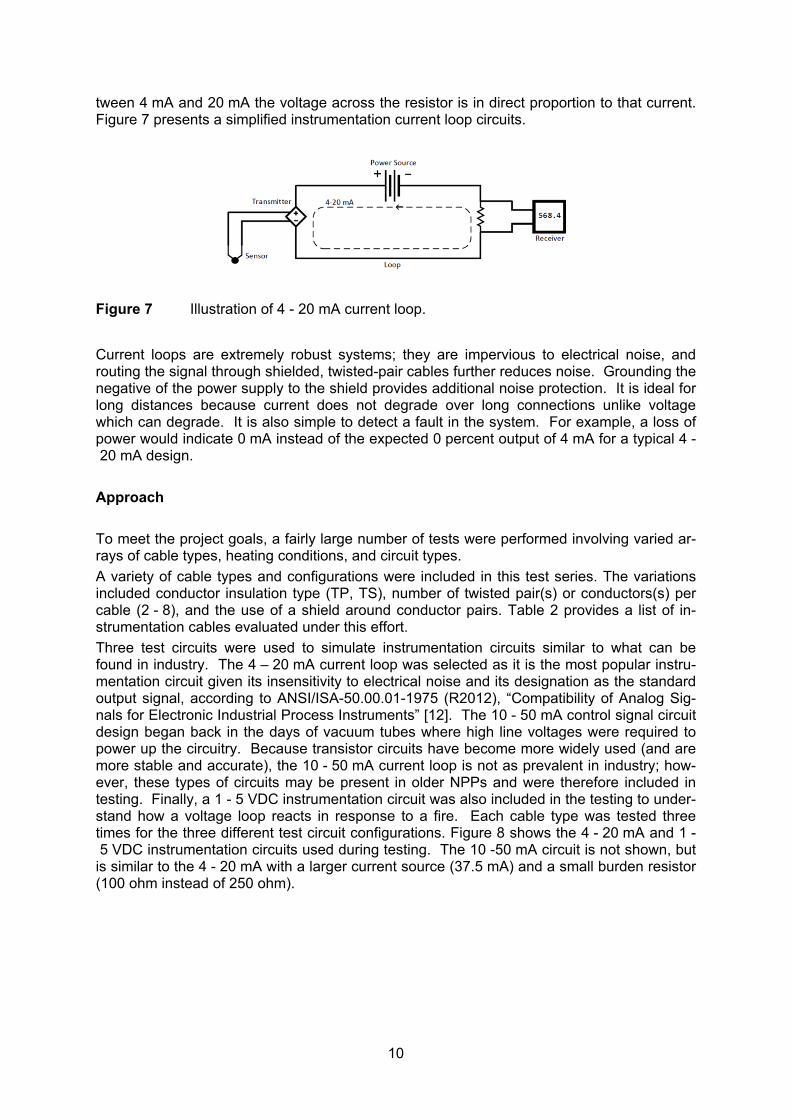
10
tween 4 mA and 20 mA the voltage across the resistor is in direct proportion to that current. Figure 7 presents a simplified instrumentation current loop circuits.
Figure 7 Illustration of 4 - 20 mA current loop.
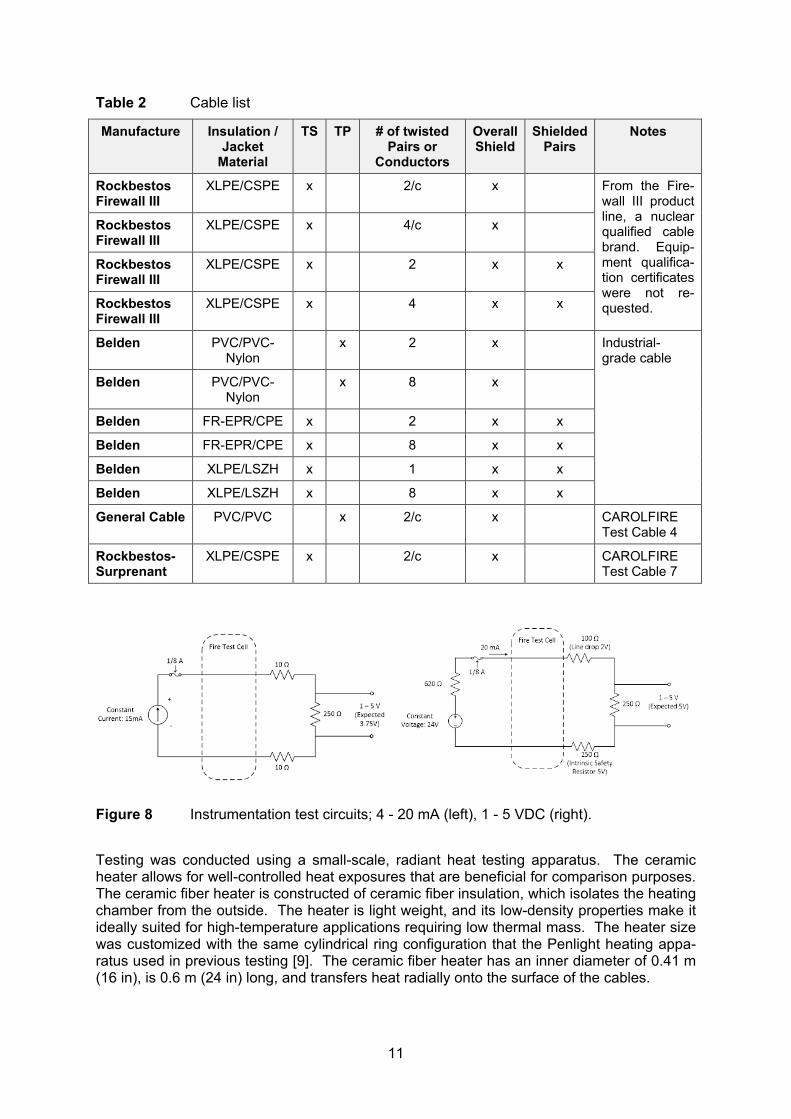
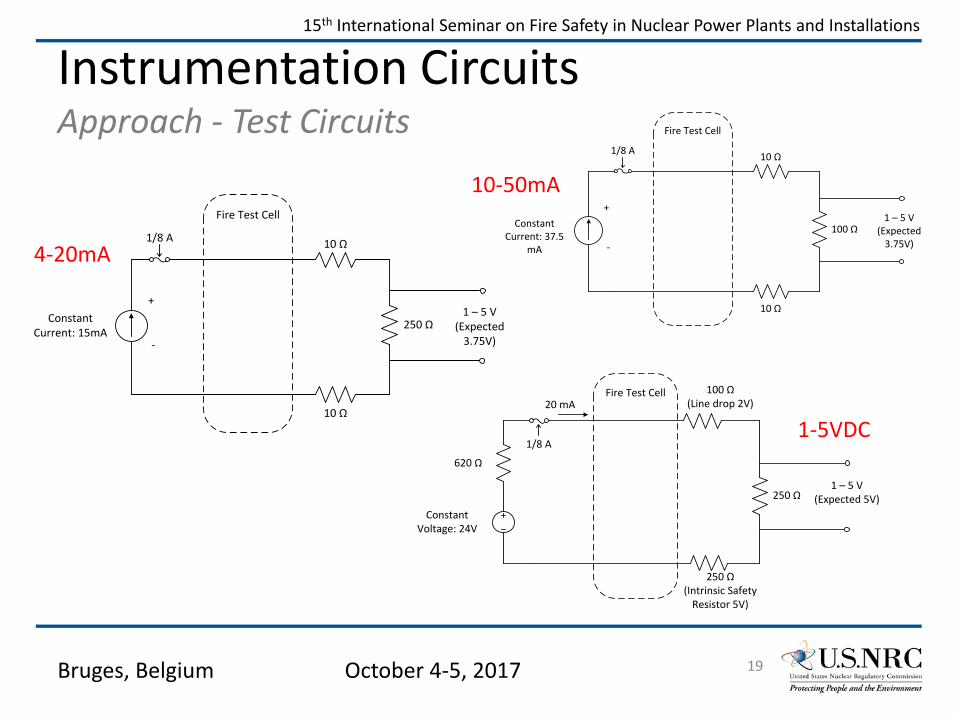
Current loops are extremely robust systems; they are impervious to electrical noise, and routing the signal through shielded, twisted-pair cables further reduces noise. Grounding the negative of the power supply to the shield provides additional noise protection. It is ideal for long distances because current does not degrade over long connections unlike voltage which can degrade. It is also simple to detect a fault in the system. For example, a loss of power would indicate 0 mA instead of the expected 0 percent output of 4 mA for a typical 4 - 20 mA design. Approach To meet the project goals, a fairly large number of tests were performed involving varied ar-rays of cable types, heating conditions, and circuit types. A variety of cable types and configurations were included in this test series. The variations included conductor insulation type (TP, TS), number of twisted pair(s) or conductors(s) per cable (2 - 8), and the use of a shield around conductor pairs. Table 2 provides a list of in-strumentation cables evaluated under this effort. Three test circuits were used to simulate instrumentation circuits similar to what can be found in industry. The 4 – 20 mA current loop was selected as it is the most popular instru-mentation circuit given its insensitivity to electrical noise and its designation as the standard output signal, according to ANSI/ISA-50.00.01-1975 (R2012), “Compatibility of Analog Sig-nals for Electronic Industrial Process Instruments” [12]. The 10 - 50 mA control signal circuit design began back in the days of vacuum tubes where high line voltages were required to power up the circuitry. Because transistor circuits have become more widely used (and are more stable and accurate), the 10 - 50 mA current loop is not as prevalent in industry; how-ever, these types of circuits may be present in older NPPs and were therefore included in testing. Finally, a 1 - 5 VDC instrumentation circuit was also included in the testing to under-stand how a voltage loop reacts in response to a fire. Each cable type was tested three times for the three different test circuit configurations. Figure 8 shows the 4 - 20 mA and 1 - 5 VDC instrumentation circuits used during testing. The 10 -50 mA circuit is not shown, but is similar to the 4 - 20 mA with a larger current source (37.5 mA) and a small burden resistor (100 ohm instead of 250 ohm).
11
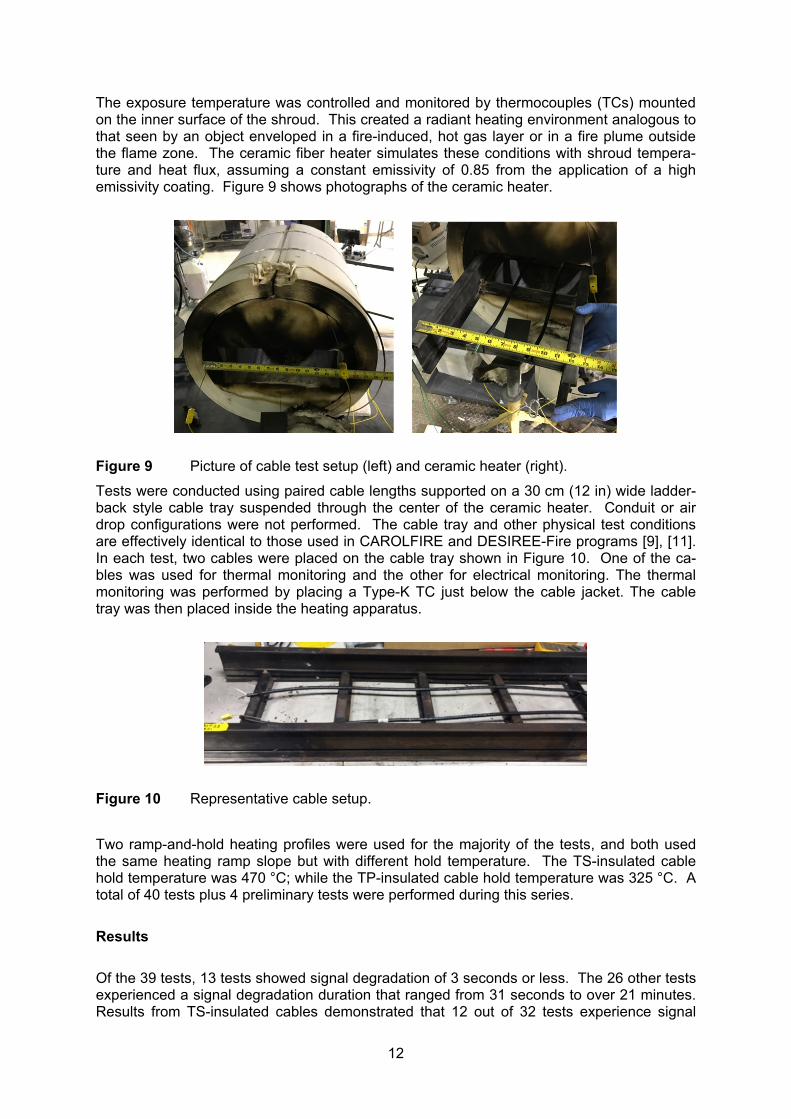
Table 2 Cable list
Manufacture Insulation / Jacket
Material
TS TP # of twisted Pairs or
Conductors
Overall Shield
Shielded Pairs
Notes
Rockbestos Firewall III
XLPE/CSPE x 2/c x From the Fire-wall III product line, a nuclear qualified cable brand. Equip-ment qualifica-tion certificates were not re-quested.
Rockbestos Firewall III
XLPE/CSPE x 4/c x
Rockbestos Firewall III
XLPE/CSPE x 2 x x
Rockbestos Firewall III
XLPE/CSPE x 4 x x
Belden PVC/PVC-Nylon
x 2 x Industrial-grade cable
Belden PVC/PVC- Nylon
x 8 x
Belden FR-EPR/CPE x 2 x x
Belden FR-EPR/CPE x 8 x x
Belden XLPE/LSZH x 1 x x
Belden XLPE/LSZH x 8 x x
General Cable PVC/PVC x 2/c x CAROLFIRE Test Cable 4
Rockbestos-Surprenant
XLPE/CSPE x 2/c x CAROLFIRE Test Cable 7
Figure 8 Instrumentation test circuits; 4 - 20 mA (left), 1 - 5 VDC (right).
Testing was conducted using a small-scale, radiant heat testing apparatus. The ceramic heater allows for well-controlled heat exposures that are beneficial for comparison purposes. The ceramic fiber heater is constructed of ceramic fiber insulation, which isolates the heating chamber from the outside. The heater is light weight, and its low-density properties make it ideally suited for high-temperature applications requiring low thermal mass. The heater size was customized with the same cylindrical ring configuration that the Penlight heating appa-ratus used in previous testing [9]. The ceramic fiber heater has an inner diameter of 0.41 m (16 in), is 0.6 m (24 in) long, and transfers heat radially onto the surface of the cables.
12
The exposure temperature was controlled and monitored by thermocouples (TCs) mounted on the inner surface of the shroud. This created a radiant heating environment analogous to that seen by an object enveloped in a fire-induced, hot gas layer or in a fire plume outside the flame zone. The ceramic fiber heater simulates these conditions with shroud tempera-ture and heat flux, assuming a constant emissivity of 0.85 from the application of a high emissivity coating. Figure 9 shows photographs of the ceramic heater.
Figure 9 Picture of cable test setup (left) and ceramic heater (right).
Tests were conducted using paired cable lengths supported on a 30 cm (12 in) wide ladder-back style cable tray suspended through the center of the ceramic heater. Conduit or air drop configurations were not performed. The cable tray and other physical test conditions are effectively identical to those used in CAROLFIRE and DESIREE-Fire programs [9], [11]. In each test, two cables were placed on the cable tray shown in Figure 10. One of the ca-bles was used for thermal monitoring and the other for electrical monitoring. The thermal monitoring was performed by placing a Type-K TC just below the cable jacket. The cable tray was then placed inside the heating apparatus.
Figure 10 Representative cable setup.
Two ramp-and-hold heating profiles were used for the majority of the tests, and both used the same heating ramp slope but with different hold temperature. The TS-insulated cable hold temperature was 470 °C; while the TP-insulated cable hold temperature was 325 °C. A total of 40 tests plus 4 preliminary tests were performed during this series. Results Of the 39 tests, 13 tests showed signal degradation of 3 seconds or less. The 26 other tests experienced a signal degradation duration that ranged from 31 seconds to over 21 minutes. Results from TS-insulated cables demonstrated that 12 out of 32 tests experience signal

13
degradation of less than 1 minute, while 4 tests experienced durations in excess of 10 minutes. One TP-insulated cable experienced signal degradation that lasted for 2 minutes and 36 seconds. Figure 11 presents the results from Test 4A where the signal duration last-ed about 10 minutes. In this figure, the signal (voltage across burden resistor) is shown in blue while the cable and ceramic heater shroud temperatures are shown as green and red, respectively.
Figure 11 Test 4A temperature and voltage measurement.
Figure 12 presents the results showing signal leakage duration by cable material.
Figure 12 Signal leakage time by cable material.
For TP-insulated cables, the signal degradation duration was not always instantaneous as previously identified during the industry test series [8]. However, the limited number of tests performed in this series could not conclude the prevalence of TP-insulated cables experienc-ing signal degradation. To provide some insight on the variable that may affect signal deg-radation, a regression analysis was performed. Variables evaluated included:
• Manufacturer; • Insulation/jacket material; • Thermoset or Thermoplastic; • Number of conductors;

14
• Shielding; • Circuit type; • Circuit grounding; • Shield grounding; • Circuit fusing.
Quantitative regression analysis was only able to identify with statistical confidence that a re-lationship exists between the number of conductors and the signal leakage time. Qualitative regression analysis via a decision tree indicated that insulation/jacket cable material was a key variable with the highest four leakage current times all occurring with cables with fire re-tardant ethylene-propylene rubber insulation and chloro-sulphonated polyethylene (FR-EPR/CPE) jacket material. The decision tree regression analysis did not find the cables insu-lation type (i.e., TS vs. TP) to be a key variable. This research provides insights into the signal degradation and performance of low-voltage instrumentation circuits in fire conditions. A total of 39 small-scale tests were conducted, primarily on TS cables because the earlier testing indicated significant signal delay time was not seen in TP cables. The tests provided evidence that, under the appropriate circum-stances, instrumentation cables can have a slow signal leakage time under fire-exposure conditions. The signal leakage time varied from 0 seconds to over 2 minutes for TP cables. The signal leakage time for TS cables ranged from 0 seconds to over 21 minutes. At first glance, the FR-EPR/CPE 8-twisted pair cable had a significant signal leakage time com-pared to the other cables. However, a regression analysis was performed to better under-stand the key variables that drove signal leakage time. From this testing, three note-worthy general observations on the performance of instrumen-tation cables can be drawn: • The results from the testing of TP cables contradicted the findings from prior, limited
testing that stated TP cables had no signal leakage characteristics prior to signal loss. TP cables were found to have a smaller leakage time on average with TS cables; how-ever, one TP test experienced a leakage time of 2.6 minutes. Therefore, TP cables may have some signal degradation prior to failure.
• The main focus of this series of testing has been on TS cables. Industry testing conclu-sions stated that TS cables displayed some amount of signal leakage before the signal failed. During this series of testing, 12 out of the 32 tests had less than 1 minute of sig-nal leakage before failure. Only 4 of the tests had a signal leakage longer than 10 minutes. Therefore, it is difficult to conclude that TS cables will always experience sig-nal leakage before failure, contrary to what was concluded in earlier testing.
• A regression analysis was performed on the test data to determine key variables that contributed to longer leakage times. The dependent variable for this analysis is the time it takes for the cable to lose signal below a certain threshold (signal leakage time). The key independent variable was the number of conductors, which aligns with an increase in cable mass per unit length.
CONCLUSIONS Fire science, engineering principle, and sound judgement are some of the main tools that fire protection engineers can use to solve complex technical problems. However, gaps in knowledge and the unique fire protection applications found in nuclear facilities necessitate the use of empirical approaches. This paper has presented two cases where experimental work was performed to address specific applications. In the case of current transformers, the research demonstrated the difficulty in developing conditions that support ignition of ma-terials and components in a secondary location from the induced open circuit fault. This evi-dence, along with electrical engineering principles and expert judgement, provides a strong

15
technical basis to support revisions to current guidance. These revisions would eliminate the consideration of secondary fire as a result of open circuit, fire-induced failures for most win-dow-type current transformers. The second case confirmed that the slow degradation of in-strumentation cables is a credible failure mode and is applicable to both thermoset-insulated and thermoplastic-insulated instrumentation cables. These results could subsequently be used to focus additional testing or to support revision to fire protection methods. REFERENCES [1] U.S. Nuclear Regulatory Commission (NRC) / Electric Power Research Institute
(EPRI): Joint Assessment of Cable Damage and Quantification of Effects from Fire (JACQUE-FIRE), Volume 1: Phenomena Identification and Ranking Table (PIRT) Ex-ercise for Nuclear Power Plant Fire-Induced Electrical Circuit Failure, NUREG/CR-7150, BNL-NUREG-98204-2012, and EPRI 1026424, Washington, DC, USA, 2012.
[2] U.S. Nuclear Regulatory Commission (NRC) / Electric Power Research Institute (EPRI): Joint Assessment of Cable Damage and Quantification of Effects from Fire (JACQUE-FIRE), Volume 2: Expert Elicitation Exercise for Nuclear Power Plant Fire-Induced Electrical Circuit Failure, NUREG/CR-7150, BNL-NUREG-98204-2012, and EPRI 3002001989, Washington, DC, USA, 2014.
[3] U.S. Nuclear Regulatory Commission (NRC): Open Secondary Testing of Window-Type Current Transformers, NUREG/CR-7228, Washington, DC, USA, 2017.
[4] Brookhaven National Laboratory (BNL), Letter from Mr. E. A. MacDougall to Nicholas S. Fiorante of the U.S. Nuclear Regulatory Commission, dated July 21, 1983.
[5] Regulatory Guide 1.189, “Fire Protection for Nuclear Power Plants,” Revision 2, 2009. [6] Nuclear Energy Institute (NEI): Guidance for Post-Fire Safe Shutdown Circuit Analysis,
Revision 2, NEI 00-01, Washington, DC, USA 2009. [7] Chemlec: A Basic Stun Gun Concept, © 2007 & 2011,
http://chemelec.com/Projects/Stun-Gun-1/Stun-Gun.htm. [8] Electric Power Research Institute (EPRI): Characterization of Fire-Induced Circuit
Faults, Results of Cable Fire Testing, EPRI 1003326, Palo Alto, CA, 2002. [9] U.S. Nuclear Regulatory Commission (NRC): Cable Response to Live Fire
(CAROLFIRE), NUREG/CR-6931, Washington, DC, USA, 2008. [10] U.S. Nuclear Regulatory Commission (NRC): Kerite Analysis in Thermal Environment
of FIRE (KATE-Fire): Test Results, NUREG/CR-7102, Washington, DC, USA, 2011. [11] U.S. Nuclear Regulatory Commission (NRC): Direct Current Electrical Shorting in Re-
sponse to Exposure Fire (DESIREE-Fire): Test Results, NUREG/CR-7100, Washing-ton, DC, USA, 2012.
[12] American National Standard Institute (ANSI) / Instrumentation, Systems and Automa-tion Society (ISA) : Compatibility of Analog Signals for Electronic Industrial Process In-struments, ANSI/ISA-50.00.01-1975 (R2012), Research Triangle Park, North Carolina …, 2012.
Insights from Recent Fire TestingCurrent Transformers
and Instrumentation Circuit Response to Fire
Gabriel Taylor PE, NRC/RESAlice Muna, SNL
Chris LaFleur, PhD. ,PE, SNL

Empirical StudiesWhy do we still need testing in the year 2017?
• Fires is chaotic• Fire safety science relatively new• Unique Reactor safety Fire interactions• NRC Mission/Principles of Good Regulation
– Independence – Reliability
• Regulatory policy changes
15th International Seminar on Fire Safety in Nuclear Power Plants and Installations
Bruges, Belgium October 4-5, 2017 2

NRC Fire Research Changes over time• Early research : 1975 – 1987
– Adequacy of deterministic requirements• Equipment separation, automatic suppression, detection, shields, barriers,
coatings• Post regulatory implementation : 1987-1993
– Evaluation of specific topical areas• GI-57 system actuation on safety related equipment, fire risk of LaSalle, Peach
Bottom, Surry• Early risk-focused research : 1993 – 1998
– Better understand risk results from three sites• Smoke on digital equipment, penetration seals, turbine fire risk
• Post – Commission Policy on PRA : 1998 - now– Fill risk-significant gaps in fire PRA methods
• Tools for circuit failure mode and likelihood analysis, fire detection/suppression tools, fire modeling tools, and experience from major fires
15th International Seminar on Fire Safety in Nuclear Power Plants and Installations
Bruges, Belgium October 4-5, 2017 3
Fire TestingOrigin of need• Past Empirical Studies
– Nuclear Energy Institute (NEI) / Electric Power Research Institute (EPRI) : 2001
– U.S. NRC – NUREG/CR-6931, CAROLFIRE : 2008– U.S. NRC – NUREG/CR-7102, KATE-FIRE : 2011– U.S. NRC – NUREG/CR-7100, DESIREE-FIRE : 2012
• Expert Judgment– Phenomena Identification and Ranking Table (PIRT)
• NRC / EPRI, NUREG/CR-7150, JACQUE-FIRE Vol. 1 : 2014– Expert Elicitation
• NRC / EPRI, NUREG/CR-7150, JACQUE-FIRE Vol. 2 : 2016• Future Research
– Open Circuit failure modes for current transformers (CTs)– Instrumentation Circuit response to fire damage
15th International Seminar on Fire Safety in Nuclear Power Plants and Installations
Bruges, Belgium October 4-5, 2017 4
Current Transformers (CTs)Operation under normal conditions
• CTs monitor current in electricaldistribution systems by transforming current in a primarycircuit into a scaled-down current in secondary circuit
• CT core magnetically couples primary and secondary circuit by the number of turns on the secondary circuit around the core, commonly referred to as the turns ratio
primary current = secondary current x turns ratio
15th International Seminar on Fire Safety in Nuclear Power Plants and Installations
Bruges, Belgium October 4-5, 2017 5

Current Transformers (CTs) Operation under ABNORMAL conditions• An “open circuit” on the CT secondary can cause
abnormal operation of a CT– Operation in zones 2 and 3 of excitation curve– CT attempts to maintain current ratio, resulting in a
high crest voltage on the secondary circuit• High crest voltage may,
– exceed dielectric strength of CT or connected components resulting in• Damage to CT• Damage to connected devices• Initiation of fire at CT or along
CT secondary circuit
15th International Seminar on Fire Safety in Nuclear Power Plants and Installations
Bruges, Belgium October 4-5, 2017 6
1
23
Vs
I
Intermediate Zone
Non-saturated Zone
Saturated Zone
Excitation Curve
m

Current Transformers (CTs) Safety Concern• 1983: Brookhaven National Laboratories raised a potential
safety concern associated with fire-induced open-circuit of CT’s secondary circuit– Appendix R and other regulatory guidance requires evaluating open
circuits , hot shorts, and shorts to ground
• Safety concern identified that a secondary fire could occur in a remote location from the primary fire damage that caused the open circuit
• Industry guidance identifies the concern in Section 3.5.2.1 of NEI 00-02 Revision 2.– This part is endorsed by NRC Regulatory Guide 1.189, Revision 2.
15th International Seminar on Fire Safety in Nuclear Power Plants and Installations
Bruges, Belgium October 4-5, 2017 7

Current Transformers (CTs)Expert Judgement
• Partially solved concern in JACQUE-FIRE Vol. 1 by using existing test data, expert judgement and engineering principles.– CT’s with turn ratios of 1200:5 or less, are not
credible secondary fire ignition sources
• What about CT’s with turn ratios greater than 1200:5?– Recommended more testing
15th International Seminar on Fire Safety in Nuclear Power Plants and Installations
Bruges, Belgium October 4-5, 2017 8

Current Transformers (CTs)Testing - Approach
• Characterize transition of the magnetizing current from normal conditions (low current) to open circuit conditions (no current)
• Evaluate high crest voltage impact on CT and secondary circuit– Does ignition occur or conditions that could
support ignition?
15th International Seminar on Fire Safety in Nuclear Power Plants and Installations
Bruges, Belgium October 4-5, 2017 9

Current Transformers (CTs)Testing – Approach – Test Variables• Primary Voltages: 500V, 250V, 125V• Two AMRAN CT Types: Fixed-Ratio 2000:5 CT;
Multi-Ratio 4000:5 CT• Primary current 60A to 4,000A for fixed-ratio
of 2000:5 CT• Turn ratios of 500:5 to 4000:5 for multi-ratio
CT• Fast, intermittent opening, and arcing
simulations for open circuit configuration
15th International Seminar on Fire Safety in Nuclear Power Plants and Installations
Bruges, Belgium October 4-5, 2017 10
Current Transformers (CTs)Testing – Approach – Test Circuit Power Supply
15th International Seminar on Fire Safety in Nuclear Power Plants and Installations
Bruges, Belgium October 4-5, 2017 11
.78 Ohm.78 Ohm
.78 Ohm
Three Phase480VAC,
1600 AmpSwitch
C
B
A
700 AmpCircuit
Breaker
700 AmpCircuit Breaker
2nd System
800:5AC Current
Transformers
Remote Controlled700 amp
Contactor
400 Amp Resistor
Load Bank
CT UnderTest
400 Amp

Current Transformer (CTs) Testing – Approach - Instrumentation
15th International Seminar on Fire Safety in Nuclear Power Plants and Installations
Bruges, Belgium October 4-5, 2017 12

CTs Test Matrix
Test # CT Turns Ratio
Primary Voltage
Primary Current
Secondary Current
Test # CT Turns Ratio
Primary Voltage
Primary Current
Secondary Current
2CT01 2000:5 480-500 2000 5.00 4CT06 1500:5 480-500 1500 5.00
2CT02 2000:5 480-500 1500 3.75 4CT07 1000:5 480-500 1000 5.00
2CT03 2000:5 480-500 1000 2.50 4CT08 500:5 480-500 500 5.00
2CT04 2000:5 480-500 500 1.25 4CT09 2000:5 220-250 2000 5.00
2CT05 2000:5 480-500 250 0.62 4CT10 1500:5 220-250 1500 5.00
2CT06 2000:5 480-500 125 0.31 4CT11 1000:5 220-250 1000 5.00
2CT07 2000:5 220-250 2000 5.00 4CT12 500:5 220-250 500 5.00
2CT08 2000:5 220-250 1500 3.75 4CT13 1000:5 110-125 1000 5.00
2CT09 2000:5 220-250 1000 2.50 4CT14 500:5 110-125 500 5.00
2CT10 2000:5 220-250 500 1.25 4CT15 4000:5 480-500 4000 5.00
2CT11 2000:5 220-250 250 0.62 4CT16 4000:5 480-500 3000 3.75
2CT12 2000:5 220-250 125 0.31 4CT17 4000:5 480-500 2000 2.50
2CT13 2000:5 220-250 62 0.15 4CT18 4000:5 480-500 1000 1.25
2CT14 2000:5 110-125 1000 2.50 4CT19 4000:5 480-500 500 0.62
2CT15 2000:5 110-125 500 1.25 4CT20 4000:5 480-500 2500 0.31
2CT16 2000:5 110-125 250 0.62 4CT21 4000:5 480-500 125 0.16
2CT17 2000:5 110-125 125 0.31 4CT22 4000:5 480-500 62 0.08
2CT18 2000:5 110-125 62 0.16 4CT23 2000:5 480-500 4000 10.0
2CT19 2000:5 480-500 2500 6.25 4CT24 2000:5 480-500 3000 7.50
2CT20 2000:5 480-500 3000 7.50 4CT25 2000:5 480-500 2000 5.00
2CT21 2000:5 480-500 4000 10.00 4CT26 2000:5 480-500 1000 2.50
4CT01 4000:5 480-500 4000 5.00 4CT27 2000:5 480-500 500 1.25
4CT02 3500:5 480-500 3500 5.00 4CT28 2000:5 480-500 250 0.62
4CT03 3000:5 480-500 3000 5.00 4CT29 2000:5 480-500 125 0.31
4CT04 2500:5 480-500 2500 5.00 4CT30 2000:5 480-500 62 0.16
4CT05 2000:5 480-500 2000 5.00
15th International Seminar on Fire Safety in Nuclear Power Plants and Installations
Bruges, Belgium October 4-5, 2017 13
• 63 total tests• 51 test conditions

Current Transformers (CTs)Results
• No secondary fires• No secondary damage• Temperature rise < 5°C
15th International Seminar on Fire Safety in Nuclear Power Plants and Installations
Bruges, Belgium October 4-5, 2017 15
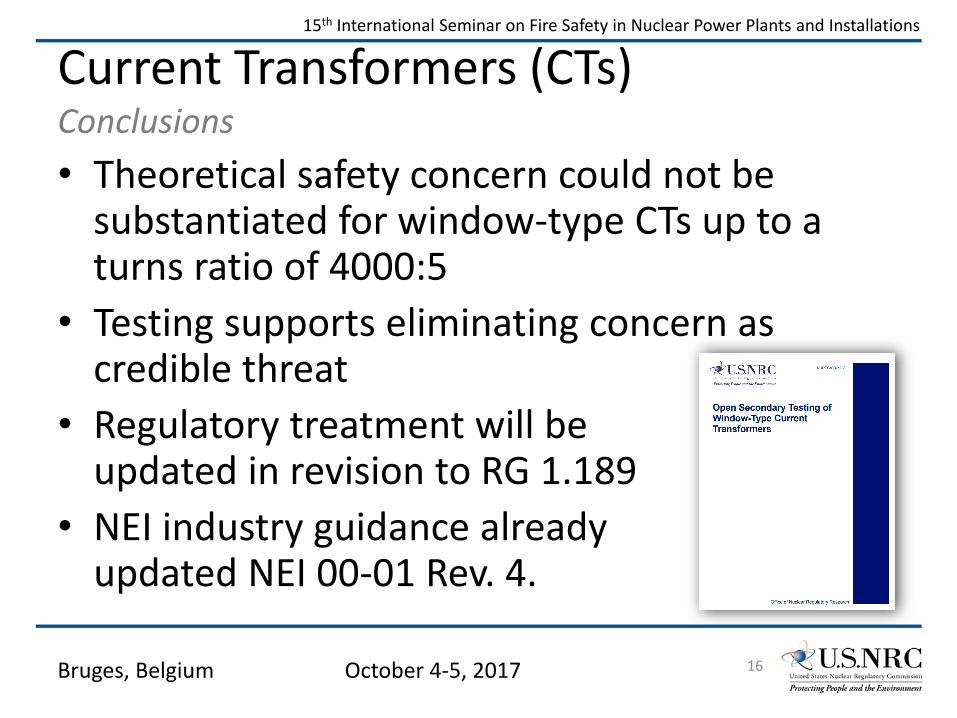
Current Transformers (CTs) Conclusions• Theoretical safety concern could not be
substantiated for window-type CTs up to a turns ratio of 4000:5
• Testing supports eliminating concern as credible threat
• Regulatory treatment will be updated in revision to RG 1.189
• NEI industry guidance already updated NEI 00-01 Rev. 4.
15th International Seminar on Fire Safety in Nuclear Power Plants and Installations
Bruges, Belgium October 4-5, 2017 16

Instrumentation Circuits Need for testing
• Lack of data– Previous efforts focused on control and power– Less than 10 tests evaluated instrumentation circuits
performance when exposed to fire conditions (see NUREG/CR-6776)
• Use of worst-case assumptions in safety analysis• Existing failure modes may not be directly applicable
due to unique and more complex instrumentation circuits
15th International Seminar on Fire Safety in Nuclear Power Plants and Installations
Bruges, Belgium October 4-5, 2017 17
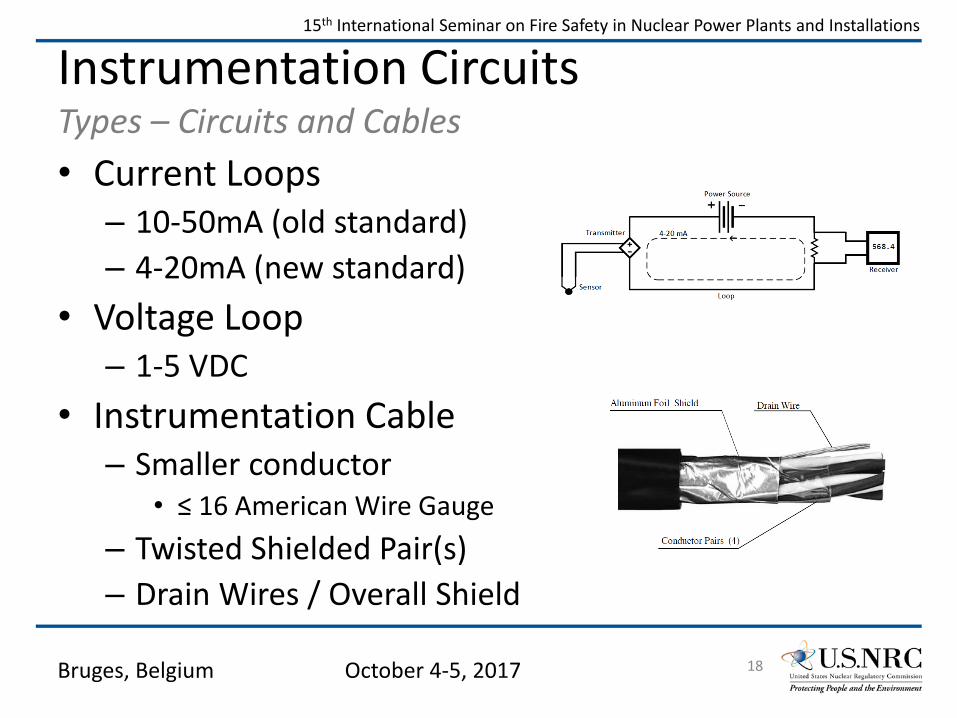
Instrumentation Circuits Types – Circuits and Cables• Current Loops
– 10-50mA (old standard)– 4-20mA (new standard)
• Voltage Loop– 1-5 VDC
• Instrumentation Cable– Smaller conductor
• ≤ 16 American Wire Gauge– Twisted Shielded Pair(s)– Drain Wires / Overall Shield
15th International Seminar on Fire Safety in Nuclear Power Plants and Installations
Bruges, Belgium October 4-5, 2017 18
Instrumentation Circuits Approach - Test Circuits
15th International Seminar on Fire Safety in Nuclear Power Plants and Installations
Bruges, Belgium October 4-5, 2017 19
250 Ω Constant Current: 15mA
1 – 5 V (Expected
3.75V)
+
-
Fire Test Cell
10 Ω
10 Ω
1/8 A100 Ω Constant
Current: 37.5 mA
1 – 5 V (Expected
3.75V)
+
-
Fire Test Cell
10 Ω
10 Ω
1/8 A
250 Ω
Constant Voltage: 24V
1 – 5 V (Expected 5V)
Fire Test Cell20 mA
100 Ω(Line drop 2V)
250 Ω(Intrinsic Safety
Resistor 5V)
1/8 A
620 Ω
4-20mA
10-50mA
1-5VDC

Instrumentation CableApproach - Cable Specimens
Cable type Cable Characteristics
ManufacturerInsulation & Jacket Materials
TS TPNum. of Twisted Pairs or Conductors
Part Number Overall Shield Shielded Pairs Notes
Rockbestos Firewall III XLPE/CSPE x 2/c I46-5700 x
From the Firewall III product line, a nuclear qualified cable brand. Equipment qualification certificates were not requested.
Rockbestos Firewall III XLPE/CSPE x 4/c I46-5844 xRockbestos Firewall III XLPE/CSPE x 2 I46-0021 x x
Rockbestos Firewall III XLPE/CSPE x 4
I46-3433
x x
Belden PVC/PVC-Nylon x 2HW1050160
2 x
Industrial-grade cable
Belden PVC/PVC Nylon x 8HW1050160
8 x
Belden FR-EPR/CPE x 2HW1100160
2 x x
Belden FR-EPR/CPE x 8HW1100160
8 x x
Belden XLPE/LSZH x 1HW1200160
1 x x
Belden XLPE/LSZH x 8HW1200160
8 x x
General Cable PVC/PVC x 2/c 230830 xCAROLFIRE Test Cable 4
Rockbestos-Surprenant XLPE/CSPE x 2/c I57-0120 x
CAROLFIRE Test Cable 7
Additional Notes:
Insulation and jacket materials shown as: (insulation type)/(jacket type).XLPE = Cross-linked polyethylene; CSPE = Chlorosulfunated polyethylene (also known as Hypalon); PVC = Polyvinyl chloride; FR-EPR = Flame-retardant ethylene-propylene rubber; CPE = Chlorinated Polyethylene; LSZH = Low smoke zero halogenTS = Thermoset; TP = Thermoplastic. All cables are 16 AWG.“2/c” represents a 2 conductor cable, “2” represents a cable containing 2 twisted pairs of conductors
15th International Seminar on Fire Safety in Nuclear Power Plants and Installations
20
• 3 Manufactures• Insulation Materials
• XLPE• PVC• FR-EPR
• Insulation Types• Thermoset• Thermoplastic
• Configuration• 1, 2, 4, 8 pair• 2/c, 4/c
• Shielded Pairs• Overall Shield

Instrumentation Circuits Approach – Thermal Exposure• Radiant ceramic fiber heater
– 0.41m dia. x 0.6 m long radiant cylinder– High emissivity coating (0.85, constant)– Electrically controlled thermal feedback
15th International Seminar on Fire Safety in Nuclear Power Plants and Installations
Bruges, Belgium October 4-5, 2017 21

Instrumentation CircuitApproach Testing
• Shake-down tests to determine heating profile for each cable type
• Cable response– One cable connected to test circuit (electrically monitored)– One cable with 18ga type K
thermocouples installed just beneath cable jacket
– Cable located symmetrically within cable tray
15th International Seminar on Fire Safety in Nuclear Power Plants and Installations
Bruges, Belgium October 4-5, 2017 22
TC
~4 in.
Electrically Monitored Cable
Temperature Monitored Cable

Instrumentation CircuitResults
15th International Seminar on Fire Safety in Nuclear Power Plants and Installations
23
Typical circuit response with signal decay

Instrumentation CircuitResults
15th International Seminar on Fire Safety in Nuclear Power Plants and Installations
24
Signal decay (leakage) time by Number of conductors
Signal decay (leakage) time by Cable Material

Instrumentation CircuitRegression Analysis
• Evaluate variable that may affect signal degradations– Cable Manufacture– Insulation / Jacket Material– Insulation Type (TS or TP)– Number of Conductors– Shielding– Circuit Type– Circuit Grounding– Shield Grounding– Circuit Fusing
15th International Seminar on Fire Safety in Nuclear Power Plants and Installations
Bruges, Belgium October 4-5, 2017 25
Instrumentation CircuitsGeneral Observations• Results from TP cables contradict previous findings that TP cables had no signal
leakage characteristics prior to signal loss. TP cables were found to have a smaller leakage time on average than TS cables; however, one TP test experienced a leakage time of 2.6 minutes. Therefore, TP cables may exhibit some signal degradation prior to failure.
• Limited testing from 2001 concluded that TS cables displayed some amount of signal leakage before the signal failed. During this series of testing, twelve out of the thirty-two tests had less than one minute of signal leakage before failure. Only four of the tests had a signal leakage longer than ten minutes. Therefore, it is difficult to conclude that TS cables will experience signal leakage before failure, contrary to what was concluded in earlier testing.
• A regression analysis was performed on the test data to determine key variables that contributed to longer leakage times. The dependent variable for this analysis is the time it takes for the cable to lose signal below a certain threshold (signal leakage time). The key independent variable was the number of conductors, which aligns with an increase in cable mass per unit length.
15th International Seminar on Fire Safety in Nuclear Power Plants and Installations
Bruges, Belgium October 4-5, 2017 26

NRC Fire ResearchConclusions
• Empirical studies are necessary to provide information that cannot always be identified from engineering principles or judgement– Proper testing improve knowledge base and comports with
actual performance• CT testing has filled knowledge gaps to close out long-
standing regulatory concern• Instrumentation testing has shown that failure modes
and circuit response differ from those observed previously and from control/power type cables/circuits.– Additional research could provide resolution, as needed.
15th International Seminar on Fire Safety in Nuclear Power Plants and Installations
Bruges, Belgium October 4-5, 2017 27