Insight on the Regulatory Role of the PERIOD 2 Gene in the ...
89
Insight on the Regulatory Role of the PERIOD 2 Gene in the Cellular Response to DNA-damage Liang Jiang Thesis submitted to the faculty of the Virginia Polytechnic Institute and State University in partial fulfillment of the requirements for the degree of Master of Science In Biological Sciences Carla Finkielstein, Chair John Tyson Nikolaos Dervisis Shihoko Kojima May 13, 2019 Blacksburg, VA Keywords: Circadian rhythm, PER2, DNA damage, p53, radiation, MDM2 Copyright 2019, Liang Jiang
Transcript of Insight on the Regulatory Role of the PERIOD 2 Gene in the ...

Insight on the Regulatory Role of the PERIOD 2 Gene in the Cellular Response to DNA-damage
Liang Jiang
Thesis submitted to the faculty of the Virginia Polytechnic Institute and State University in partial fulfillment of the requirements for the degree of
Master of Science
In
Biological Sciences
Carla Finkielstein, Chair
John Tyson
Nikolaos Dervisis
Shihoko Kojima
May 13, 2019
Blacksburg, VA
Keywords: Circadian rhythm, PER2, DNA damage, p53, radiation, MDM2
Copyright 2019, Liang Jiang
Insight on the Regulatory Role of the PERIOD 2 Gene in the Cellular Response to DNA-damage
Liang Jiang
ABSTRACT
Circadian rhythm is a ~24-h mechanism that keeps our physiology and behavior in synchrony with environmental changes. Period2 (Per2) is a core component of the circadian clock and a candidate tumor suppressor as its knockout expression results in a cancer-prone animal. p53 is an effector in the DNA damage response and regulates downstream effectors by trans-activation. Recent studies in our lab show that PER2 can bind to p53, and regulates the trans-activation function. This project studied the subcellular distribution of PER2 in response to DNA damage, and explored the role of p53 in the regulation of PER2 subcellular distribution. We found that PER2 accumulates in the nucleus in response to DNA damage, and such accumulation is independent of p53. In addition, we analyzed Single Nucleotide Polymorphisms (SNP) of PER2 in the 1000 Genome project to gain insight onto how missense mutations in PER2 lay at the interface of p53: PER2 binding. In a separate project, we also performed bioinformatics analysis on the iron related genes to discuss the circadian regulation of iron genes in the liver. These findings shed light on the regulation of Per2 under genotoxic stress, genetic variations of Per2 in normal human population, and expression of circadian genes under iron-controlled diets.
Insight on the Regulatory Role of the PERIOD 2 Gene in the Cellular Response to DNA-damage
Liang Jiang
GENERAL AUDIENCE ABSTRACT
Circadian rhythm is a ~24-h mechanism that keeps the body in synchrony with the environment. Period2 (Per2) is a gene at the core of circadian rhythm in mammals. In this work, we found that PER2 accumulates in the nucleus of cells in response to DNA damage. In addition, we analyzed the genetic variation of PER2 in general human population to gain insight onto how mutations in PER2 affect the risk of cancer that’s associated to circadian disruption. In a separate project, we performed bioinformatics analysis on the genes related to iron metabolism, and showed pattern of circadian regulation of iron genes in the liver. These findings shed light on how circadian rhythm responds to genotoxic stress, and summarized genetic variations of Per2 in normal human population, and the expression of circadian genes under iron-controlled diets.

iv
Contents
ABSTRACT .................................................................................................................................................. ii
GENERAL AUDIENCE ABSTRACT ........................................................................................................ iii
List of figures: .............................................................................................................................................. vi
Abbreviations .............................................................................................................................................. vii
CHAPTER 1: Introduction ........................................................................................................................... 1
Overview of Circadian Cycle .................................................................................................................... 1
Physiological and Molecular Mechanism of the Circadian Clock ........................................................ 1
The Role of Post-translational Modifications in the Mammalian Circadian Clock .............................. 2
Genetic and Biochemical Properties of PER2 ...................................................................................... 3
Circadian Rhythm Output ..................................................................................................................... 4
Association between DNA Damage and Circadian Clock ........................................................................ 4
Chapter 2: Specific Aims .............................................................................................................................. 6
Aim1: To Determine the Subcellular Distribution of PER2 in Response to Genotoxic Stress ................. 6
Aim2: Determine Molecular Intermediaries Responsible for Circadian Phase Resetting in the Event of Genotoxic Stress. ...................................................................................................................................... 6
Significance of this Study: .................................................................................................................... 6
Chapter 3: Material and methods .................................................................................................................. 7
Cells and antibodies (for all experiments) ................................................................................................ 7
Irradiation (for all experiments) ................................................................................................................ 7
Monitoring Bioluminescence Rhythms in MEF cells (for all experiments associated with Aim2).......... 7
Immunoblotting (for all immunoblot experiments) .................................................................................. 7
Immunofluorescence microscopy (for all IF experiments associated with aim1) .................................... 8
Chapter 4: Results ......................................................................................................................................... 9
DNA damage leads to acute accumulation of PER2 in HCT116 .............................................................. 9
Establishing the experiment context ....................................................................................................... 11
Step1: Establishing the irradiation dosage for HCT116 ..................................................................... 11
Step2: validate the DNA damage response of γH2AX under 10Gy irradiation .................................. 12
Total abundance of PER2 in response to DNA damage is independent of p53 ...................................... 14
The Subcellular Distribution of PER2 in Response to Irradiation is Independent of p53 ...................... 15
Nuclear/cytosolic Distribution of PER2 after DNA Damage ................................................................. 18
Proteasome Inhibition can Rescue the PER2 Nuclear Accumulation from Leptomycin B .................... 20
Perturbation of Circadian Cycle by Small Molecule Inhibitors and Irradiation ..................................... 22

v
Circadian Phase Shift in MEFPer2:luc is Dose Dependent ..................................................................... 22
Circadian Phase Advance in Response to Irradiation can not be Alleviated by Caffeine ................... 23
CK1 Kinase Inhibitor PF670 can Alleviate Circadian Phase Advance in Response to Irradiation .... 24
Chapter 5: Analysis of Immunofluorescence Microscopy Images ............................................................. 25
Chapter 6: Bioinformatics analysis ............................................................................................................. 28
Introduction: ............................................................................................................................................ 28
Single Nucleotide Polymorphism (SNP) Analysis of Human PER2 Protein .......................................... 28
Introduction ......................................................................................................................................... 28
Procedure ............................................................................................................................................ 29
Results ................................................................................................................................................. 30
Effect of Iron Intake on Transcription of Circadian Genes in Mice Liver .............................................. 33
Introduction ......................................................................................................................................... 33
Results ................................................................................................................................................. 34
Materials and Methods ........................................................................................................................ 42
Gene Ontology Analysis of Circadian Iron Genes .................................................................................. 46
Introduction ......................................................................................................................................... 46
Procedure ............................................................................................................................................ 46
Result .................................................................................................................................................. 46
Chapter 7: Conclusions, and Future Directions .......................................................................................... 48
Reference .................................................................................................................................................... 49
Supplementary Data .................................................................................................................................... 67
Immunofluorescence microscopy image analysis ................................................................................... 67
SNP analysis ........................................................................................................................................... 74
Gene Ontology Analysis ......................................................................................................................... 76
Supplementary Figures ............................................................................................................................... 79

vi
List of figures:
Figure 1.1 A simplified diagram of molecular mechanism of circadian clock in mammals ………………..…...……….2
Figure 4.1 Per2 and γH2AX response in synchronized HCT116 cells ………………………………..….……...……..10
Figure 4.2 HCT116 cells respond to different dose of Irradiation ………………………………………..……..……..12
Figure 4.3 Validation of DNA damage response of γH2AX under 10Gy in HCT116 ……………….…………………14
Figure 4.4 Total PER2 and p53 in response to irradiation ……………………………………………………….……..15
Figure 4.5 PER2 accumulates in the nucleus after irradiation independent of p53 ………………………………….….17
Figure 4.6 PER2 in the nucleus of HCT116 p53+/+ and HCT116 p53-/- in response to LMB treatment and IR ……….…19
Figure 4.7 PER2 in the nucleus of HCT116 p53+/+ in response to LMB and MG132 ……………………………....…21
Figure 4.8 Dose dependent phase shift of circadian rhythm in MEFPer2:luc in response to IR ………………………….22
Figure 4.9 Caffeine attenuates circadian phase advance in response to irradiation …………………………………….23
Figure 4.10 Effect of small molecule inhibitors to circadian phase shift in MEFPer2:luc cells ………………….………24
Figure 5.1 Evaluation of the method in pipeline 2 with SSIM and PSNR ……………………………………………..27
Figure 6.1 Screenshot of the table displayed in the SNP GeneView webpage for PER2 …………………………..….29
Figure 6.2 General MAF and position of PER2 SNPs in 1000 Genomes project ………………………………………31
Figure 6.3 MAF and geological distribution of PER2 SNPs in 1000 Genomes project ………………………..……...32
Figure 6.4 The expression of iron metabolic genes is sensitive to overexpression or repression of core circadian components ………………………………………………………………………………………………………..…..35
Figure 6.5 Circadian oscillations in TFRC expression are not generated by rhythmic de novo transcription……..…..37
Figure 6.6 Expression of iron metabolism regulator IRP2 in circadian synchronized HepG2 cells which have
compromised iron status ………………………………………………………………………………………...……..39
Figure 6.7 Cellular response to acute iron influx is minimized in cells with downregulated PER2 …………….…..….42
Table 6.1 List of qRT-PCR primer sequences used ………………………………………………………………….…45
Figure 6.8 Gene ontology analysis of circadian iron genes in mouse liver …………………………………….………47
Figure S1 Intracellular iron concentration can be manipulated while maintaining cell viability ………………..……..79
Figure S2 MetaCycle analysis of PER2 and IREB2 mRNA levels in synchronized HepG2 cells …………….….…….80

vii
Abbreviations
AMPK: Adenosine 5′ Monophosphate-activated Protein Kinase
ATM: Ataxia Telangiectasia Mutated
ATR: Ataxia Telangiectasia and Rad3-related
bHLH-PAS: basic Helix-loop-helix-Period-ARNT-Single-minded
BMAL1: Brain and Muscle Aryl Hydrocarbon Receptor Nuclear Translocator-like Protein-1
BSA: Bovine Serum Albumin
CGDB: Circadian Gene Database
Chk1: Checkpoint Kinase 1
Chk2: Checkpoint kinase 2
CK1: Casein Kinase 1
CK2: Casein Kinase 2
CLOCK: Circadian Locomotor Output Cycles Kaput
c-Myc: cellular-Myelocytomatosis
CPD-photolyase: Cyclobutane Pyrimidine Dimer photolyase
CRY: Cryptochrome
CSV: Comma Separated Values
DAPI: 4′,6-diamidino-2-phenylindole
DDR: DNA Damage Response
DMEM: Dulbecco's Modified Eagle Medium
DSB: Double Strand Breakage
E4BP4: E4 Promoter-Binding Protein
EDTA: Ethylenediaminetetraacetic Acid
FA/BRCA pathway: Fanconi Anemia/Breast Cancer pathway
FASPS: Familial Advanced Sleep Phase Syndrome

viii
FBS: Fetal Bovine Serum
Fbxl3: F-Box and Leucine Rich Repeat Protein 3
FITC: Fluorescein Isothiocyanate
GC: Glucocorticoid Control
GO: Gene Ontology
GRE: Glucocorticoid Response Element
GSK3β: Glycogen Synthase Kinase 3β
IF: Immunofluorescence
IP: Immunoprecipitation
IR: Irradiation
MBS: Main dichroic Beam Splitter
MDM2: Murine Double Minute 2
MAF: Minor Allele Frequency
MEF: Mouse Embryonic Fibroblast
MGI: Mouse Genome Informatics
MT1: Melatonin receptor Type 1
MT2: Melatonin receptor Type2
MYC: Myelocytomatosis
NAD: Nicotinamide Adenine Dinucleotide
NCBI: National Center for Biotechnology Information
NER: Nucleotide Excision Repair
NTO: Non-Transcriptional Oscillator
PAS: Period-ARNT-Single-minded
PBS: Phosphate Buffered Saline
PER: Period
PP1: Protein Phosphatase 1

ix
PP2A: Protein Phosphatase 2A
PP5: Protein Phosphatase 5
PRC: Phase Response Curve
PSNR: Peak Signal to Noise Ratio
PTM: Post-Translational Modification
PVDF: Polyvinylidene Fluoride
REV-ERB-Alpha: Nuclear Receptor Subfamily 1, Group D, Member 1
ROI: Region of Interest
ROR: Retinoid-related Orphan Receptors
S90: Serine 90
S662: Serine 662
SCF: Skp, Cullin, F-box containing complex
SCN: Suprachiasmatic Nucleus
SDS: Sodium Dodecyl Sulfate
SNPs: Single Nucleotide Polymorphisms
SIK3: Salt-Inducible Kinase 3
SIRT1: Sirtuin1 (Silent Mating Type Information Regulation 2 Homolog1)
SSIM: Structural Similarity Index
T347: Threonine 347
TBST: Tris Buffered Saline-Tween
TIM: Timeless
TTFL: Transcription-Translation Feedback Loop
USP7: Ubiquitin Specific Peptidase 7
XPA: Xeroderma Pigmentosum, Complementation Group A
β-TrCP: Beta-Transducin repeat Containing Protein
γH2AX: Gamma Histone 2AX

1
CHAPTER 1: Introduction
Overview of Circadian Cycle
The earth’s rotation around its axis leads to predicable rhythmic changes in the geophysical environment, and the period of the rhythm has been roughly constant throughout the history of evolution (Williams 2000). Circadian clock is virtually present in all organisms, providing them a way to predict their surroundings and occupy the temporal niche. Circadian rhythms are biological oscillations that operate independently of temporal input information, able to compensate for temperature alterations, and of a ~24-hour period.
Physiological and Molecular Mechanism of the Circadian Clock
Circadian rhythm is ubiquitous in virtually all organisms from cyanobacteria to mammals (Bhadra et al. 2017). In most organisms, the molecular mechanism of circadian clock is controlled by a Transcription-Translation Feedback Loop (TTFL). There is another mechanism for regulating circadian rhythm, the Non-Transcriptional Oscillator (NTO) mechanism, which is found in cyanobacteria (van Ooijen and Millar 2012). The translational product of a circadian gene inhibits the transcription process, and the negative feedback oscillates robustly with a period of around 24 hours to generate the circadian cycle. Genetic screenings in multiple organisms have revealed that many key clock proteins are orthologous between species (Tauber et al. 2004).
In mammals, the Suprachiasmatic Nucleus (SCN) is the central pace maker that regulates the circadian rhythm of peripheral organs. The SCN resides in the anterior hypothalamus and contains about 20,000 neurons (Welsh et al. 1995). It is innervated by rods, cones, and a type of intrinsically photosensitive retinal ganglion cells called ipRGC located in the retina via the retinohypothalamic tract (Hattar et al. 2003; Hankins et al. 2008; Chen et al. 2011). SCN transmits the signal to various brain nuclei through diffusible molecules like dopamine and regulates circadian physiology of peripheral organs through the visceral nervous system (Silver et al. 1996; Kalsbeek et al. 2006). Glucocorticoid Control (GC) is considered to be an important humoral signaling molecule for synchronizing the peripheral clock (Balsalobre et al. 2000), the secretion of which is regulated through Hypothalamus-Pituitary-Adrenal (HPA) neuroendocrine axis. Melatonin (5-methoxy-N-acetyltryptamine) is primarily produced in the pineal gland during the subjective night through the regulation by the SCN (Benarroch 2008), and regulate metabolism of peripheral tissues by activating widely expressed melatonin receptors (Slominski et al. 2012).
At the molecular level, circadian rhythm is maintained in individual cells by a robust molecular mechanism that involves two interlocked positive and negative TTFLs (Figure 1.1). In the core negative feedback loop, members of the basic Helix-Loop-Helix-Period-ARNT-Single-minded (bHLH-PAS) transcription factor superfamily, such as Brain and Muscle Aryl Hydrocarbon Receptor Nuclear Translocator-like Protein-1 (BMAL1) and Circadian Locomotor Output Cycles Kaput (CLOCK) are the positive limb in the feedback loop. They form a heterodimer complex and activate the transcription of target genes by binding to E-box promoters (King et al. 1997; Gekakis et al. 1998; Bunger et al. 2000). Target genes include PERIOD (PER)1-3 and CRYPTOCHROME (CRY)1-2, whose protein products are translocated to the nucleus and inhibit the transcriptional activity of BMAL1/CLOCK complex (Van Der Horst et al. 1999; Reppert and Weaver 2002). The degradation of PER and CRY is important for maintaining circadian rhythm. The half-life of PER proteins are 2-3 hours and the half-life of CRY proteins are 5-6 hours (Siepka et al. 2007; Maywood et al. 2011; Tamiya et al. 2016). The Skp, Cullin, F-box containing complex (SCF) E-box ligase Beta-Transducin repeat Containing Protein (β-TrCP) ubiquitinates PER2 and targets it for proteasomal degradation in the cytosol. The recognition of PER2 by β-TrCP is dependent on Casein Kinase 1 (CK1)ε/δ phosphorylation (Akashi et al. 2002; E. J. Eide et al. 2005; Lee et al. 2009). Another E3 ligase F-Box and

2
Leucine rich repeat protein 3 (FBXL3) ubiquitinates CRY and targets it for proteasomal degradation in both degradation in the nucleus (Shi et al. 2013).
The concentration of BMAL1 is regulated by an auxiliary feedback loop (Chung et al. 2011). BMAL1/CLOCK complex activates the transcription of Retinoid-related Orphan Receptors (ROR) and Nuclear Receptor Subfamily 1, Group D, Member 1 (REV-ERB-alpha),. Transcription of BMAL1 can be activated by ROR, repressed by REV-ERB-alpha (Preitner et al. 2002; Sato et al. 2004; Akashi and Takumi 2005; Guillaumond et al. 2005).
The molecular clock can be entrained by neuronal and humoral signals (Dubocovich 2007; So et al. 2009; Chen et al. 2011; Jung-Hynes et al. 2011). Transcription of PER1, PER2 and E4 Promoter-Binding Protein (E4BP4) are directly regulated by the Glucocorticoid Response Elements (GREs), so that peripheral tissue can be synchronized by glucocorticoid (So et al. 2009). Melatonin can activate Melatonin receptor Type 1 (MT1) and Melatonin receptor Type2 (MT2) receptors and regulates the circadian rhythm of SCN (Dubocovich 2007).
Figure 1.1 A simplified diagram of molecular mechanism of circadian clock in mammals
The Role of Post-translational Modifications in the Mammalian Circadian Clock
Post-Translational Modifications (PTMs) of circadian proteins are essential for the regulation of their function, stability, and subcellular localization. For example, sumolylation of BMAL1 is shown to decrease its protein stability (Cardone 2005); deacetylation of BMAL1 by Silent Mating Type Information Regulation 2 Homolog1 (SIRT1) is Nicotinamide Adenine Dinucleotide (NAD) dependent and might link circadian rhythm to glucose metabolism (Belden and Dunlap 2008); Casein Kinase 2 (CK2) phosphorylates BMAL1 at Serine 90 (S90) and promotes its nuclear entry (Tamaru et al. 2009); activity of casein Kinase

3
1 δ (CK1δ) towards PER2 can be regulated by phosphorylation at Threonine 347 (T347) (Eng et al. 2017). Furthermore, CLOCK possesses acetyltransferase activity and has a possible role in chromatin remodeling by acetylation of BMAL1 and histone H3 (Doi et al. 2006; Grimaldi et al. 2007; Hirayama et al. 2007). Since this project mainly focuses on PER2, PER2 post-translational modification will be emphasized in the text.
PERIOD2 has many types of PTMs including phosphorylation (Kondratov et al. 2006). For example, one study implies CLOCK as the acetyltransferase responsible for PER2 acetylation (Belden and Dunlap 2008). Conversely, SIRT1, circadian expressed in mouse liver and cultured fibroblasts, can bind to CLOCK/BMAL1 and PER2 in a circadian fashion, and reduce the stability of PER2 by deacetylation (Guo et al. 2012). As previously described, ubiquitination mediated proteasomal degradation of PER2 by β-TrCP is dependent on phosphorylation. However, recent evidence suggests a different mode of PER2 degradation which is dependent on the balance between ubiquitination and deubiquitination (Ohsaki et al. 2008; Zhou et al. 2015; D’Alessandro et al. 2017). In addition, our lab has discovered that PER2 can be ubiquitinated by Mouse Double Minute 2 (MDM2) independent of phosphorylation and β-TrCP (Liu et al. 2018).
Among all PTMs, phosphorylation of PER2 is the most studied and is proved to be important for subcellular localization and degradation of PER2(Gallego and Virshup 2007). A mass spectrometry study identified a total of 21 phosphorylation sites on mPER2 with a multi protease approach (Schlosser et al. 2005), and those sites have been studied to different extents (Eng et al. 2017). For example, Glycogen Synthase Kinase 3β (GSK3β) can regulate PER2 subcellular localization through phosphorylation (Akashi et al. 2002; Iitaka et al. 2005). Some less characterized kinases that target PER2 include Salt-Inducible Kinase 3 (SIK3) (Hayasaka et al. 2017) and CK2 (Maier et al. 2009; Tsuchiya et al. 2009). Conversely, PER2 can be dephosphorylated by Protein Phosphatase 5 (PP5) and Protein Phosphatase 2A (PP2A) families of protein phosphatases (Rivers et al. 1998; Schmutz et al. 2011; Shanware et al. 2011).
Mutation of key molecules responsible for PER2 phosphorylation can have pathological effects (Vanselow et al. 2006). The first identified pathological effect is the Familial Advanced Sleep Phase Syndrome (FASPS) caused by tau mutation of CK1ε (Kong L Toh et al. 2001).
The tau mutation was first discovered in Syrian hamster, mutation of cysteine to threonine at 178th amino acid of CK1ε can lead to decreased phosphorylation activity on the FASPS cluster of PER2 around serine 662 and therefore increase on serine 478 cluster, and lead to a shortened period (Ralph and Menaker 1988; Meng et al. 2008). Such mutation in human can lead to FASPS disease(Jones et al. 1999).
The familial advanced sleep-phase syndrome is a syndrome first described in 1999, characterized by a profound phase advance of the sleep-wake pattern, melatonin and temperature rhythms associated with a short period length (Jones et al. 1999). It can be caused either by mutation of PER2 at Serine 662 or mutation of CK1 at threonine 44. The mechanism of such phenomenon is that CK1 dependent phosphorylation of PER2 at the FASPS region relies on a priming phosphorylation at Serine 662 (S662) in human PER2 (Shanware et al. 2011). This can prevent CK1δ/ε priming independent phosphorylation at S478. F-box protein β-TrCP mediated ubiquitination of PER2 at Serine 477 is dependent on the S478 phosphorylation, so mutation of the S662 priming site leads to the destabilization of PER2 (Erik J Eide et al. 2005; Isojima et al. 2009). It is suggested that the balance between phosphorylation in both cluster sites provides a biochemical mechanism to explain for the temperature compensation phenomena of the circadian cycle (Zhou et al. 2015).
Genetic and Biochemical Properties of PER2
PER2 gene is located on the long arm of chromosome 2 at position 37.3. The only known functional transcript is comprised of 23 exons, and the full length of human PER2 has 1255 amino acids (Gilliland et
4
al. 2000; Kong L Toh et al. 2001; Prieto and U. ALBRECHT, A. BORDON, I. SCHMUTZ 2007). As a circadian rhythm proteins transcribed in all tissue types (Uhlén et al. 2015)
Mammalian PER2 protein has two PER-ARNT-Single minded (PAS) domains with a linker in between, the flexibility of the interdomain linker is vital for the stability of the PAS domain core, and therefore influence period of circadian rhythm (Militi et al. 2016). The nuclear localization signal sequence and carboxyl-terminal CRY binding motif are both essential for its nuclear entry (Miyazaki et al. 2001).
In addition, PER2 has various molecular binding partners. Mammalian PER2 is known to form homodimers stabilized by interactions of the PAS-β-sheet surface (Hennig et al. 2009) or heterodimers with PER1. PER2 also participates in larger complexes with Cry1/2 and PER1 (Langmesser et al. 2008; Schmalen et al. 2014).
Circadian Rhythm Output
Many physiological activities and molecular pathways are regulated by circadian rhythm (Bozek et al. 2009). Transcriptome studies and promotor analyses concur that the transcription of as many as 10% of all genes are controlled by the clock (Ptitsyn and Gimble 2011). More recently, high-resolution multi-organ expression data shows nearly half of all genes in the mouse genome have circadian rhythmicity somewhere in the body, many of them being targets of drugs used in clinical therapies (Zhang et al. 2014). Based on the circadian rhythm of drug targets, the concept of chronotherapy was proposed to adapt the design of clinical treatments to the circadian changes in disease and achieve maximum therapeutic effect (Peeples 2018). In the field of human cancer treatment, the clinical relevance of chronotherapy has been tested extensively (Lévi 2001). Chronomodulation of chemotherapeutic drugs like 5-fluorouracil, oxaliplatin and leucovorin have proven to be successful in clinical trials against metastatic colorectal cancer (Lévi et al. 1995; Garufi et al. 1997).
Association between DNA Damage and Circadian Clock
DNA damage response pathways are highly conserved in eukaryotic organisms and include three essential components: sensors that recognize the damage, transducers that pass on the information, and effectors that carry out the physiological and cellular response (Liang et al. 2009). There are more than one pathway in mammals and the response is largely directed by the type of DNA damage and the phase in the cell cycle at which the insult occurs (Zamkov et al. 2004).
To briefly introduce the molecular mechanism of DNA damage response, Ataxia Telangiectasia Mutated (ATM) is primarily involved in the recognition of DNA Double Strand Break (DSB) and Ataxia Telangiectasia and Rad3-related (ATR), who serves an important role in the detection of ultraviolet induced DNA damage and malfunctioning replication forks (Wei et al. 2008). The p53 protein is a transcription factor that targets pathways including apoptosis, DNA damage repair, cell cycle, etc (Purvis et al. 2012). In the event of DNA damage, p53 is stabilized as a result of phosphorylation via ATM and CK2 (Canman et al. 1998; Matsuoka et al. 2000; Chung et al. 2002) and inhibition of its E3 ligase MDM2 (O. Shaul 1996). Stabilized p53 then forms a tetramer and trans-activate its targets and elicit DNA damage response. Moreover, large scale proteomic analyses have identified thousands of protein phosphorylation events following DNA damage in a ATM/ATR dependent manner (Matsuoka et al. 2007), putting multiple cell signaling pathways directly under the regulation of DNA damage response.
Circadian rhythm and DNA damage response are evolutionarily related. Evidence lays in the homology of the protein molecules in these two cellular activities(Uchida et al. 2010). Photolyases and cryptochromes are both members of the photolyase/cryptochrome superfamily, and Cyclobutane Pyrimidine Dimer
5
photolyase (CPD-photolyase) has been shown to restore the circadian rhythm of double mutant Cry1-/- Cry2-/- mice (Chaves et al. 2011; Mei and Dvornyk 2015). The Timeless (TIM) gene was originally discovered in Drosophila melanogaster for its function in circadian rhythm, its mammalian orthologue has disputable function in circadian rhythm (Sangoram et al. 1998; Barnes et al. 2003; Gotter 2006). However, expression of mammalian TIM is circadian, and TIM is important in DNA damage repair (Unsal-Kaçmaz et al. 2005; Engelen et al. 2013; Xie et al. 2015).
DNA Damage Response(DDR) and circadian rhythm has been demonstrated to affect each other (Antoch and Kondratov 2010). The following paragraph explains how they affect each other from both aspects.
Circadian rhythm can affect the effectiveness of DNA damage response. Ultraviolet can cause the formation of Thymine-Thymine-dimers in DNA, and such damage is repaired through the Nucleotide Excision Repair (NER) pathway (Grant et al. 1998). Xeroderma Pigmentosum, complementation group A (XPA), a rate limiting subunit of NER exhibits circadian rhythmicity in skin cells and brain tissue of SKH-1 hairless mice with peak during the subjective day and during the subjective night (Kang et al. 2009; Gaddameedhi et al. 2011). Cyclophosphamide, a drug that can cause the formation of base monoadducts and inter-strand cross-links in DNA, has a lethal effect on mice that reaches the peak at ZT18-22 and the trough at ZT10-14, which is concurrent with the peak and trough of XPA induced nuclear excision repair (Gorbacheva et al. 2005). However, nucleotide excision repair is not the predominant mechanism for clearing these adducts, suggesting the possibility of other DNA repair mechanisms also under the regulation of circadian clock (Grant et al. 1998). Period1 is a core clock component in circadian rhythm and it can sensitize cells to DNA damage induced apoptosis by elevating cellular-Myelocytomatosis viral oncogene (c-Myc) and suppressing p21Waf1/Cip1 (Gery et al. 2006). DNA cross-link repair is mainly conducted by the Checkpoint Kinase1 (Chk1)-mediated Fanconi Anemia/ Breast Cancer (FA/BRCA) pathway (Räschle et al. 2008). Expression of mammalian TIM is circadian, and it interacts with core clock component CRY2 and core DDR element Chk1, providing a pathway for circadian rhythm to regulate Chk1 mediated DNA cross-link repair (Unsal-Kaçmaz et al. 2005). P53 is a key protein for the modulation of DNA damage response, our lab discovered that Per2 and p53 dimeric complex exists in both nuclear and cytosol of mammalian cells, and Per2 can inhibit the trans activation activity of p53 in response to genotoxic stress through molecular binding (Gotoh et al. 2014; Gotoh et al. 2015; Gotoh et al. 2016).
Conversely, DNA damage can reset the circadian clock. Such effect has been shown in mice and in Rat-1 fibroblasts and Mouse Embryonic Fibroblast (MEF) on a cellular level; as well as Gonyaulax and Neurospora (Oklejewicz et al. 2008). Genotoxic stress is known to cause circadian phase shift in mammalian cells, but the underlying mechanism is only recently illustrated(Oklejewicz et al. 2008). For example, we know now that Ubiquitin Specific Peptidase 7 (USP7) deubiquitinate Cry1 in response to DNA damage and cause phase advance (Papp et al. 2015).
In conclusion, the molecular mechanisms revealed so far on how DNA damage resets circadian clock lacks an unifying model, and still await further investigation.

6
Chapter 2: Specific Aims
Our findings show that in unstressed cells, PER2 forms a trimeric complex with p53 and MDM2 in the nucleus, and increases the stability of p53 and MDM2 by blocking MDM2 E3 ligase activity (Gotoh et al. 2014; Gotoh et al. 2015). Formation of PER2:p53 dimer is independent of MDM2 in both the cytosol and the nucleus (Gotoh et al. 2015). While in complex with PER2, p53 loses its transcriptional activity and become unable to respond to DNA damage (Gotoh et al. 2015). Surprisingly, p53 and PER2 are out of phase relative to each other in the cytosol, such phenomenon was explained using systematic modeling and supported by the increased stability of p53 in the nucleus and PER2 promoted p53 nuclear shuttling (Gotoh et al. 2016). Recently, we unveiled a new regulatory role of MDM2 by targeting PER2 as a novel substrate for degradation (Liu et al. 2018).
Therefore, we hypothesize that genotoxic stress compromises the association between PER2 and p53 and modulates the response to genotoxic stress, and thus, contributes to phase resetting via regulating PER2 stability.
Aim1: To Determine the Subcellular Distribution of PER2 in Response to Genotoxic Stress
We hypothesize that the circadian phase shift caused by DNA damage response is rapid. We conducted the following studies:
1. To monitor the expression and subcellular localization of PER2 in response to DNA damage. I propose to perform Immunofluorescence (IF) microscopy of HCT116 cells before and after irradiation (IR).
2. PER2 and p53 can form heterodimers, to measure the effect of DNA damage response on this dimeric complex, I propose to use immunoprecipitation (IP) to measure abundancy of PER2:p53 from subcellular fractionations before and after IR.
3. To monitor the nuclear/cytosolic trafficking and degradation of PER2 in response to DNA damage, I propose to perform IF microscopy on HCT116 cells with nuclear transport inhibitors and proteasome inhibitor.
Aim2: Determine Molecular Intermediaries Responsible for Circadian Phase Resetting in the Event of Genotoxic Stress.
We hypothesize that in response to DNA damage, MDM2 acts on PER2 by altering its stability and promoting phase resetting.
1. To evaluate the perturbation of circadian cycle caused by MDM2 ubiquitination of PER2, I propose to record bioluminescence of cells with small molecule inhibitors with IR administered at different phases of circadian cycle.
Significance of this Study:
PER2 and p53 are core molecules of circadian rhythm and DNA damage response, respectively. The interaction between these two molecules provides a direct link between the two pathways. p53 is mutated in half of all cancers (Service 2016 Oct 5), and there are many drugs targeting p53 (Harrison 2012). If p53 function is found to be regulated by PER2, there might be a benefit to apply those treatments to chronotherapeutic methods.

7
Chapter 3: Material and methods
Cells and antibodies (for all experiments)
HCT116 p53+/+ and HCT116 p53-/- cells were maintained and cultured in McCoy’s 5A medium (Corning, 10-050-CV) with 10% heat-inactivated fetal bovine serum (Atlanta Biologicals, S11150), 50U/ml penicillin and 50µg/ml streptomycin (Gibco, 15140-122).
MEF PER2:luc cells were obtained from Shihoko Kojima’s lab. Cells were maintained and cultured in Dulbecco's Modified Eagle Medium (DMEM) high-glucose (VWR 10-013-CV) with 10% fetal bovine serum (Atlanta Biologicals, S11150), 50U/ml penicillin and 50µg/ml streptomycin (Gibco, 15140-122).
Irradiation (for all experiments)
Irradiation was administered by a cabinet X-ray system (TFI, M-110-NH) at 50kV with dose rate of 5Gy/min. Control samples were subject to the same temperature and light exposure as irradiated samples to isolate irradiation as the only variable.
Monitoring Bioluminescence Rhythms in MEF cells (for all experiments associated with Aim2)
To measure bioluminescence rhythms, cells were seeded at 3X10⁵/dish 35 mm dishes, cultured overnight, then synchronized with 100nM dexamethasone for 2 hours according to previously established protocol in the lab (Gotoh et al. 2016). After synchronization, cells are cultured in DMEM with 4.5g/L glucose without phenol red, supplemented with 1% Fetal Bovine Serum (FBS), and 0.1 mM luciferin, the dishes were sealed with cover glass and vacuum grease and placed into a LumiCycle 32 luminometer (Actimetrics, Wilmette, IL). The circadian data were analyzed with BioDare2(Zielinski et al. 2014).
Immunoblotting (for all immunoblot experiments)
Indicated cell samples were collected from petri dish by trypsinization and centrifugation, protein was extracted from cell pellets at 4°C in 50ul NP40 lysate buffer (137 mM NaCl, 1 mM Ethylenediaminetetraacetic Acid (EDTA), 10 mM NaF, 10mM Tris (pH=7.5), 1mM Na3VO4, 80mM glycerol 2-phosphate, 10% glycerol, 0.5% NP-40, 0.3nM aprotinin, 1nM leupeptin, 1 nM of pepstatin A, phosphatase inhibitor cocktail A (Santa Cruz Biotechnology)) on a vortex machine.
Homogenates were cleared by centrifugation (10 min, 16,000 × g). Supernatants were mixed with 4× Laemmli sample buffer and boiled on 100℃ metal bath for 5 minutes. Proteins were separated by electrophoresis through Sodium Dodecyl Sulfate (SDS)–7% polyacrylamide gels and then transferred to Polyvinylidene Fluoride (PVDF) membranes. Membranes were blocked with 5% nonfat dry milk or 2% Bovine Serum Albumin (BSA) in Tris-Buffered Saline containing 0.05% Tween 20 (TBST) for 1 hour and then incubated with designated primary antibodies at 4℃ overnight. After washing with TBST, PVDF membranes were incubated with secondary antibodies, and immunoreactive bands were visualized with SuperSignal West Pico PLUS Chemiluminiscent Substrate (ThermoFisher Scientific).

8
Immunofluorescence microscopy (for all IF experiments associated with aim1)
L-poly-Lysine coated glass slides (Neuvitro, GG18PLL) were seeded with cells at the density of 125 cell/mm2. After treatment with drug or irradiation, coverslips were gently washed with 37℃ Phosphate Buffered Saline (PBS) and fixed in 3.7% formaldehyde, 5% sucrose, 0.5% Triton-X100 in PBS for 5 minutes at 37℃. Following, were permeabilized in 0.5% Triton-X100 in PBS for 10 minutes at room temperature, blocked in 20% goat serum (Sigma-Aldrich, G9023-10ML) and 0.1% Triton-X100 in PBS for 1 hour at room temperature.
For staining of PER2 and Gamma Histone 2AX (γH2AX), glass coverslips were incubated with a mixture of 1:200 diluted rabbit-anti-γH2AX (Cell signaling technology, cat# 20E3) and 1:50 diluted mouse-anti-PER2 antibody (Sigma-Aldrich, cat#5C10) overnight at 4℃ on a slowly shaking platform. Samples were washed in TBST (0.1% Tween-20 in PBS) for 4 times, 10 minutes each, then incubated with 1:100 diluted goat-anti-rabbit AlexaFluor488 conjugated (Invitrogen, cat#PIA32731) and goat-anti-mouse IgG conjugated (Jackson ImmunoResearch, cat#115-165-003)
Immunofluorescence microscopy images were collected with a laser confocal microscope (Carl Zeiss, LSM880). The objective lens used was C-Apochromat 40x/1.2 W Korr FCS M27, master gain setting was 4′,6-diamidino-2-phenylindole (DAPI) Ch1 : 550, Fluorescein Isothiocyanate (FITC) ChS1 : 680, Rhodamine Ch2 : 750; digital gain setting was DAPI Ch1: 1.23, FITC ChS1: 1.00, Rhodamine Ch2: 1.25; digital offset setting was DAPI Ch1: 160.00, FITC ChS1: -40.00, Rhodamine Ch2: 160.00; pinhole size for all channels were set to 36µm; filters used were DAPI Ch1: 415 – 480, FITC ChS1: 490 – 535, Rhodamine Ch2: 545 – 625; beam splitters used were Main dichroic Beam Splitter (MBS): MBS 488/543, MBS_InVis: MBS -405, DBS1: Mirror; laser setting was DAPI 405 nm: 1.0%, FITC 488 nm: 5.0%, Rhodamine 543 nm: 8.0%

9
Chapter 4: Results
DNA damage leads to acute accumulation of PER2 in HCT116
Rationale:
Previous studies show that circadian rhythm phase can be shifted in response to DNA damage (Oklejewicz et al. 2008; Papp et al. 2015), but the evidence so far do not indicate the temporal sensitivity of this response. I hypothesize that the response of circadian phase to DNA damage is acute, because the signaling pathways that connects circadian rhythm and DNA damage response illustrated in recent studies are primarily post translational, and signaling through post translational modification is usually rapid.
Description and controls:
To test the hypothesis, HCT116 p53+/+ cells were plated on coverslips and incubated with 200 nM dexamethasone to synchronize the circadian rhythmicity, and irradiated with 10 Gy (Gray) X-ray immediately after synchronization. Cells cultured without the irradiation treatment served as negative controls, and samples were collected and fixed at 0.5, 1, 2, 4, 20 hours after synchronization. After staining with DAPI, and antibodies for PER2 and γH2AX, the samples were imaged with laser confocal microscopy and the signal for the target proteins were quantified in nucleus and cytosol as described in chapter 5 pipeline 2.
Result:
As shown in Figure 4.1 PER2 signal in both nucleus and cytosol has a sharp decrease and increase in the first 2 hours after irradiation. The spike is caused by activation of PER2 expression in response to dexamethasone synchronization. The peak for irradiated samples is 1-hour in both cytosol and nucleus, while the peak for unirradiated samples is 2-hour (Figure 4.1 A, B). This indicates that irradiation led to PER2’s rapid accumulation in the early stage of DNA damage.
A
B
10
C
D
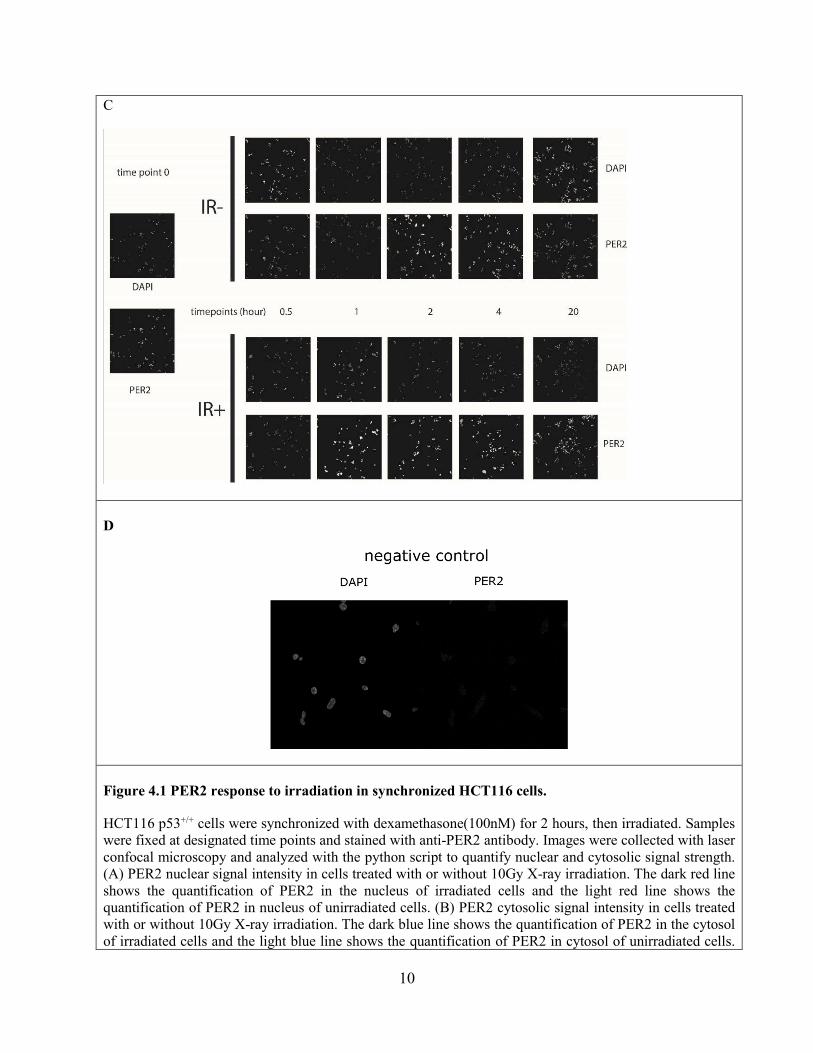
Figure 4.1 PER2 response to irradiation in synchronized HCT116 cells.
HCT116 p53+/+ cells were synchronized with dexamethasone(100nM) for 2 hours, then irradiated. Samples were fixed at designated time points and stained with anti-PER2 antibody. Images were collected with laser confocal microscopy and analyzed with the python script to quantify nuclear and cytosolic signal strength. (A) PER2 nuclear signal intensity in cells treated with or without 10Gy X-ray irradiation. The dark red line shows the quantification of PER2 in the nucleus of irradiated cells and the light red line shows the quantification of PER2 in nucleus of unirradiated cells. (B) PER2 cytosolic signal intensity in cells treated with or without 10Gy X-ray irradiation. The dark blue line shows the quantification of PER2 in the cytosol of irradiated cells and the light blue line shows the quantification of PER2 in cytosol of unirradiated cells.

11
(C) PER2 and DAPI channel of IF images of the cells with or without 10Gy X-ray irradiation at designated time points. (D) Negative control stained without primary antibody
Different cell types have different intrinsic radiosensitivity (Fertil and Malaise 1981). To study the relation between DNA damage response and circadian rhythm, it is vital to establish an irradiation dosage that can reliably illicit significant DNA damage response in the cell line we use, which is HCT116 p53+/+ and HCT116 p53-/-. To prove the efficacy of 10Gy irradiation at causing DNA damage response in HCT116 cells, I checked the phosphorylation events of p53, Chk1 and γH2AX.
Establishing the experiment context
Step1: Establishing the irradiation dosage for HCT116
Phosphorylation of Chk1 at Serine 345 is downstream of ATM/ATR, and signifies the activation of checkpoint (Jiang et al. 2003). Phosphorylation of p53 at Serine 15 is downstream of ATM/ATR and DNA-PK, and signifies the stabilization of p53, promoting the accumulation and trans-activation activity of p53 (Shieh et al. 1997; Tibbetts et al. 1999).
To test the DNA damage response of HCT116 cells exposed to different doses of irradiation, HCT116 p53+/+ and HCT116 p53-/- cells were irradiated with 1Gy or 10Gy and then collected at different times after irradiation. Chk1 (pS345) and p53 (pS15) were examined by immunoblotting to determine DNA damage response of checkpoint activation and downstream transcriptional activation (Figure 4.2).
In HCT116 p53-/-, signal of p53 and p53 (pS15) is absent, which proves the authenticity and purity of the cell line and the specificity of the antibody, in line with our expectation. In HCT116 p53+/+, 10Gy is the only condition that can illicit detectable p53 (pS15) signal. In both HCT116 p53+/+ and HCT116 p53-/-, 10Gy irradiation illicit stronger Chk1 (pS345) signal than 1Gy (Figure 4.2).
12
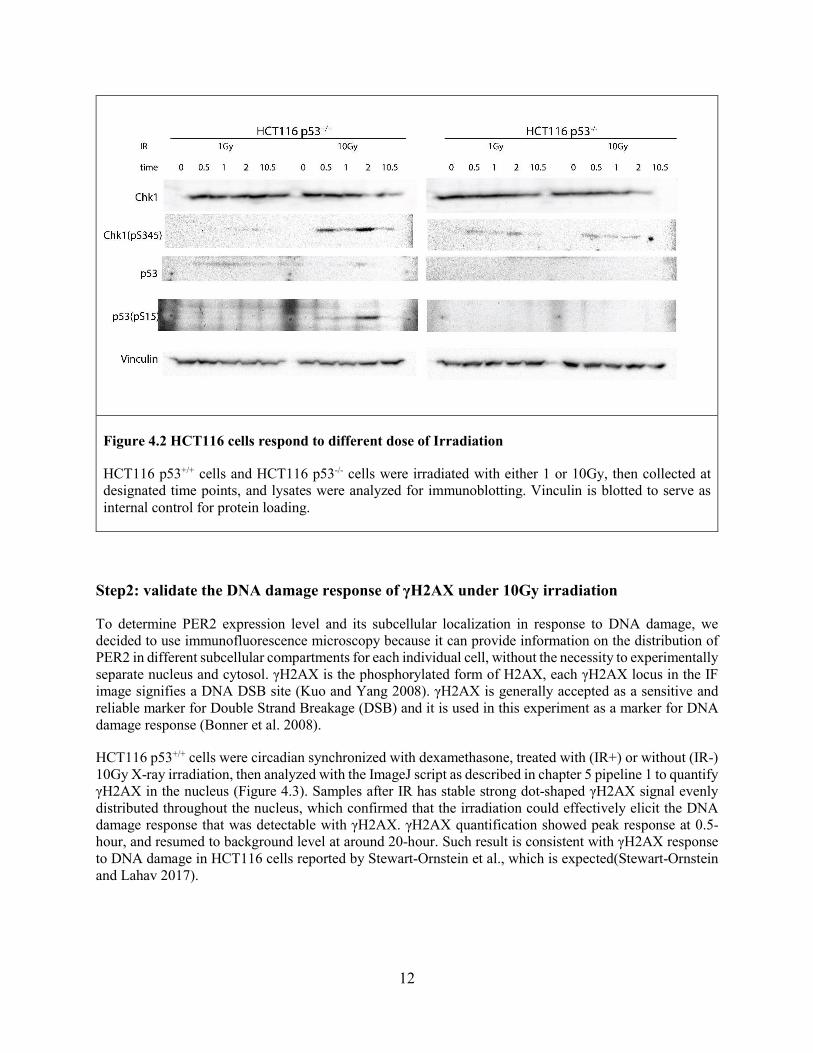
Figure 4.2 HCT116 cells respond to different dose of Irradiation
HCT116 p53+/+ cells and HCT116 p53-/- cells were irradiated with either 1 or 10Gy, then collected at designated time points, and lysates were analyzed for immunoblotting. Vinculin is blotted to serve as internal control for protein loading.
Step2: validate the DNA damage response of γH2AX under 10Gy irradiation
To determine PER2 expression level and its subcellular localization in response to DNA damage, we decided to use immunofluorescence microscopy because it can provide information on the distribution of PER2 in different subcellular compartments for each individual cell, without the necessity to experimentally separate nucleus and cytosol. γH2AX is the phosphorylated form of H2AX, each γH2AX locus in the IF image signifies a DNA DSB site (Kuo and Yang 2008). γH2AX is generally accepted as a sensitive and reliable marker for Double Strand Breakage (DSB) and it is used in this experiment as a marker for DNA damage response (Bonner et al. 2008).
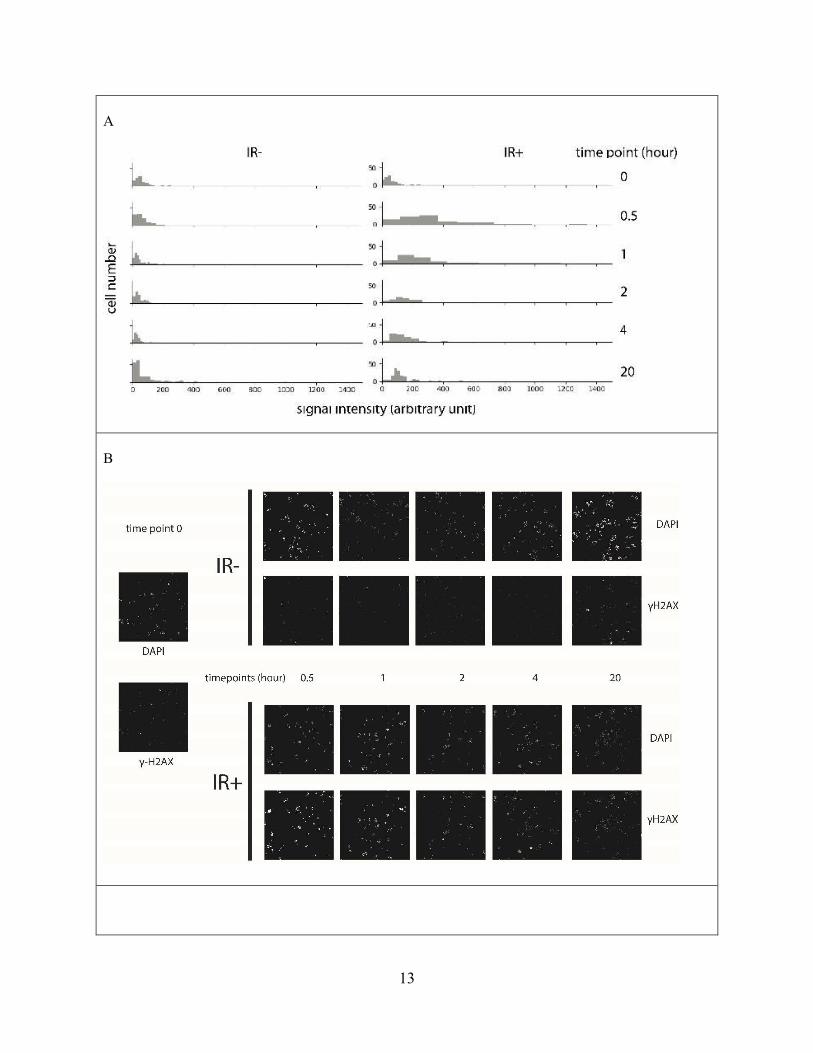
HCT116 p53+/+ cells were circadian synchronized with dexamethasone, treated with (IR+) or without (IR-) 10Gy X-ray irradiation, then analyzed with the ImageJ script as described in chapter 5 pipeline 1 to quantify γH2AX in the nucleus (Figure 4.3). Samples after IR has stable strong dot-shaped γH2AX signal evenly distributed throughout the nucleus, which confirmed that the irradiation could effectively elicit the DNA damage response that was detectable with γH2AX. γH2AX quantification showed peak response at 0.5-hour, and resumed to background level at around 20-hour. Such result is consistent with γH2AX response to DNA damage in HCT116 cells reported by Stewart-Ornstein et al., which is expected(Stewart-Ornstein and Lahav 2017).
13
A
B

14
C
Figure 4.3 Validation of DNA damage response of γH2AX under 10Gy in HCT116
HCT116 p53+/+ cells were synchronized with dexamethasone (200 nM) for 2 hours, irradiated at time point 0, then fixed at designated time points and stained with anti-γH2AX antibody. (A) Quantified γH2AX signal in the time series. (B) IF images of the time series (C) Negative control stained without primary antibody
Total abundance of PER2 in response to DNA damage is independent of p53
Rationale:
P53 and PER2 can form a dimeric complex that has been detected in both nucleus and cytosol (Gotoh et al. 2015). The binding has been suggested to modulate p53 transcriptional activity in mammalian cells in response to DNA damage (Gotoh et al. 2016). P53 has important roles in the DNA damage response, it is phosphorylated and expressed in response to DNA damage (Stewart-Ornstein and Lahav 2017). I hypothesize that the binding between PER2 and p53 can modulate the molecular dynamics of PER2 in response to DNA damage, and thus leads to the phase shift of circadian rhythm.
Description:
To test the hypothesis, HCT116 p53+/+ and HCT116 p53-/- cells were synchronized with 200 nM and irradiated immediately after synchronization. The cells were collected at 0.5, 1, 2, 10.5 hours after synchronization and the cells without irradiation were collected immediately after synchronization to serve as baseline. The experiment was repeated twice, and each was blotted for one panel. PER2 and p53 protein is measured with Western Blot to illustrate their molecular dynamics, p53 (pS15) and Chk1 (pS345) were blotted to confirm the DNA damage response. Vinculin is blotted to serve as internal control for both experiments.
Result:

15
Irradiation elicited phosphorylation of Chk1 in both HCT116 p53+/+ and HCT116 p53-/-, indicating successful DNA damage response. The accumulation of p53 in HCT116 p53+/+ is caused by the upregulation of p53 stability and protein expression(Chehab et al. 2002). PER2 is relatively stable in the two hours after irradiation, and is significantly decreased at 10.5-hour (Figure 4.4). The lack of difference in the dynamics of PER2 after irradiation between HCT116 p53+/+ and HCT116 p53-/- suggests that the abundance of total PER2 is not regulated by p53 in response to irradiation.
Figure 4.4 Total PER2 and p53 in response to irradiation
HCT116 p53+/+ and HCT116 p53-/- cells were irradiated with 10Gy X-ray. Samples were collected at designated time points. Total cell lysate was used for immunoblot assay.
The Subcellular Distribution of PER2 in Response to Irradiation is Independent of p53
Rationale:
Even though the abundance of total PER2 does not seem to be regulated by p53 in response to irradiation, it is still possible that the subcellular distribution of PER2 is regulated by p53 in response to irradiation.
Description:
To explore this possibility, PER2 HCT116 p53+/+ and HCT116 p53-/- cells were plated on coverslips and incubated with 200 nM dexamethasone to synchronize the circadian rhythmicity, and irradiated with 10 Gy X-ray immediately after synchronization. Cells cultured without the irradiation treatment served as negative controls, and samples were collected and fixed at 0.5, 1, 2, 4, 8 hours after synchronization. After staining with DAPI, and antibodies for PER2 and p53, the samples were imaged with laser confocal microscopy and the signal for the target proteins were quantified in nucleus and cytosol as described in chapter 5 pipeline 2, p53 signal from HCT116 p53-/- cells was used to calculate background noise, and the background noise was subtracted from p53 quantification from HCT116 p53+/+ cells.
Results:

16
Irradiation can elicit significant increase of p53 in nucleus and cytosol within 4 hours, which indicates significant DNA damage response in this experiment (Figure 4.5 A, B). PER2 signal in the nucleus was increased in the first 2 hours and then slowly decreased in the nucleus for both HCT116 p53+/+ and HCT116 p53-/- cells, while PER2 in the cytoplasm only had significant increase in the first 0.5 hour (p = 0.02 for HCT116 p53+/+, p = 0.006 for HCT116 p53-/-). In summary, availability of p53 had no identifiable effect on the subcellular localization of PER2 in response to DNA damage.
A
B
C D
0.00
5.00
10.00
15.00
20.00
25.00
30.00
35.00
40.00
0.00 2.00 4.00 6.00 8.00
inte
nsi
ty (
arb
itra
ry u
nit
)
time after irradiation (hour)
nuclear p53
0.00
5.00
10.00
15.00
20.00
25.00
30.00
35.00
40.00
0.00 2.00 4.00 6.00 8.00
inte
nsi
ty (
arb
itra
ry u
nit
)
time after irradiation (hour)
cytosolic p53
0.00
10.00
20.00
30.00
40.00
50.00
60.00
70.00
0.00 2.00 4.00 6.00 8.00
inte
nsi
ty (
arb
itra
ry u
nit
)
time after irradiation (hour)
cytoplasmic PER2
HCT116 p53 +/+ HCT116 p53 -/-
0.00
10.00
20.00
30.00
40.00
50.00
60.00
70.00
0.00 2.00 4.00 6.00 8.00
inte
nsi
ty (
arb
itra
ry u
nit
)
time after irradiation (hour)
nuclear PER2
HCT116 p53 +/+ HCT116 p53 -/-

17
E
F
Figure 4.5 PER2 accumulates in the nucleus after irradiation independent of p53
HCT116 p53+/+ and HCT116 p53-/- cells were synchronized then irradiated with 10Gy X-ray. Samples were fixed at designated time points and stained with anti-PER2 antibody and anti-p53 antibody. (A) Quantification of nuclear p53 in HCT116 p53+/+. (B) Quantification of cytosolic p53 in HCT116 p53+/+. (C) Quantification of PER2 in the nucleus in HCT116 p53+/+ and HCT116 p53-/-. (D) Quantification of PER2 in the cytosol in HCT116 p53+/+ and HCT116 p53-/-. (E) Immunofluorescence microscopy images

18
of in HCT116 p53+/+ and HCT116 p53-/- after irradiation, negative control is stained without primary antibody. (F) Diagram of the experiment procedure.
Nuclear/cytosolic Distribution of PER2 after DNA Damage
Rationale:
It has been shown that in mammalian cells DNA damage can lead to circadian phase advance in a dose dependent manner, The phase advance in response to DNA damage is more significant during the degradation phase of PER2 than the accumulation phase (Oklejewicz et al. 2008). PER2 is expressed in the cytosol and it can be transported into the nucleus, it is phosphorylated and then translocated to the cytosol for proteasomal degradation (Smyllie et al. 2016). There are two mechanisms that can potentially explain the phase advance in response to DNA damage: enhanced nuclear translocation, and the decreased PER2 stability.
Description:
We first tested the hypothesis that DNA damage promotes nuclear translocation and accumulation of PER2 in the nucleus. HCT116 p53+/+ and HCT116 p53-/- cells were synchronized with dexamethasone and then incubated with/without a nuclear export inhibitor Leptomycin B (LMB) for 4 hours and then irradiated with 10Gy X-ray. The samples were collected at 0, 1, 2 hours after irradiation, then fixed and stained with PER2 antibody. Images were collected with laser confocal microscope and quantified with method described in Chapter 5 pipeline 2. Quantified data was normalized by aligning time point 0 of the time series with the same
Result:
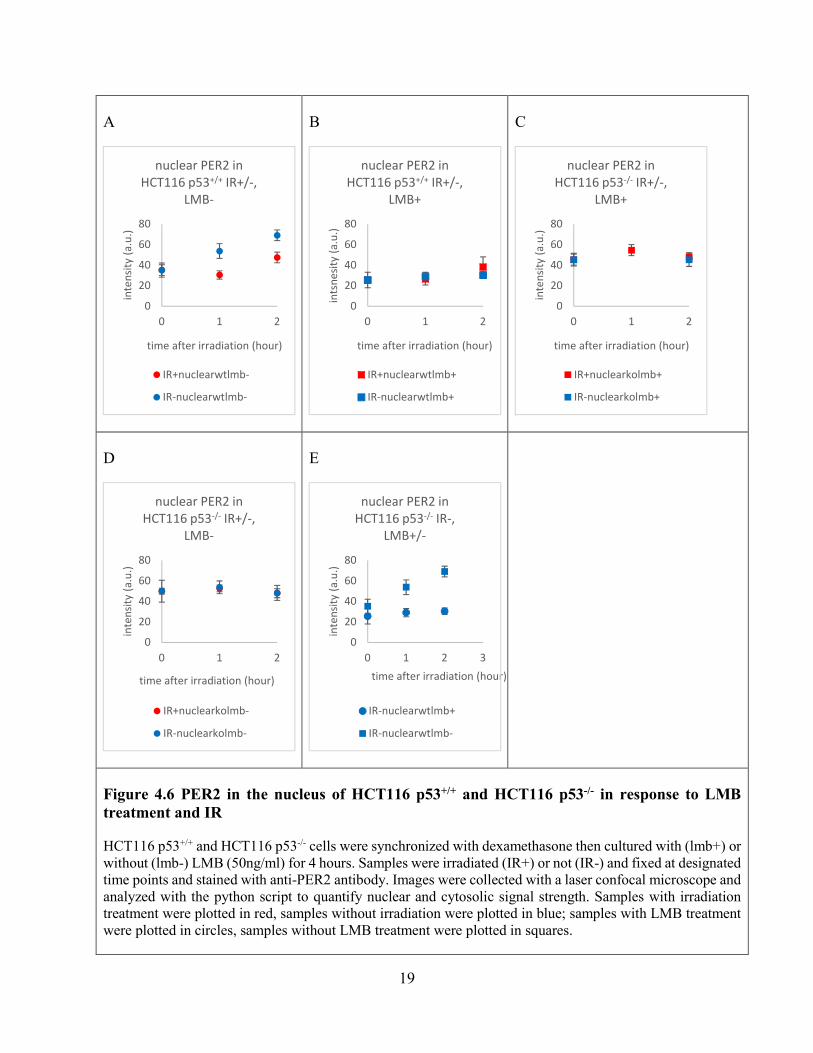
In HCT116 p53+/+ cells without LMB treatment, PER2 accumulates in the nucleus in both irradiated and unirradiated cells, and the accumulation in unirradiated cells was significantly stronger (p<0.01) (Figure 4.6 A). In the HCT116 p53+/+ cells treated with LMB, the accumulation of PER2 in the nucleus was only significant in unirradiated cells (Figure 4.6 B), suggesting that nuclear export regulates the subcellular localization of PER2 in response to irradiation. In HCT116 p53-/- cells, there was no significant accumulation of PER2 in the nucleus, and irradiation had no significant impact on the abundance of nuclear PER2 (Figure 4.6 C, D). This is in contrary to the previous result of PER2 signal accumulation in the nucleus of HCT116 p53-/- cells (Figure 4.5 C), probably because of the 4-hour incubation period after synchronization and before irradiation.
19
A
B
C
D
E
Figure 4.6 PER2 in the nucleus of HCT116 p53+/+ and HCT116 p53-/- in response to LMB treatment and IR
HCT116 p53+/+ and HCT116 p53-/- cells were synchronized with dexamethasone then cultured with (lmb+) or without (lmb-) LMB (50ng/ml) for 4 hours. Samples were irradiated (IR+) or not (IR-) and fixed at designated time points and stained with anti-PER2 antibody. Images were collected with a laser confocal microscope and analyzed with the python script to quantify nuclear and cytosolic signal strength. Samples with irradiation treatment were plotted in red, samples without irradiation were plotted in blue; samples with LMB treatment were plotted in circles, samples without LMB treatment were plotted in squares.
0
20
40
60
80
0 1 2
inte
nsi
ty (
a.u
.)
time after irradiation (hour)
nuclear PER2 in HCT116 p53+/+ IR+/-,
LMB-
IR+nuclearwtlmb-
IR-nuclearwtlmb-
0
20
40
60
80
0 1 2in
tsn
esit
y (a
.u.)
time after irradiation (hour)
nuclear PER2 in HCT116 p53+/+ IR+/-,
LMB+
IR+nuclearwtlmb+
IR-nuclearwtlmb+
0
20
40
60
80
0 1 2
inte
nsi
ty (
a.u
.)
time after irradiation (hour)
nuclear PER2 in HCT116 p53-/- IR+/-,
LMB+
IR+nuclearkolmb+
IR-nuclearkolmb+
0
20
40
60
80
0 1 2
inte
nsi
ty (
a.u
.)
time after irradiation (hour)
nuclear PER2 in HCT116 p53-/- IR+/-,
LMB-
IR+nuclearkolmb-
IR-nuclearkolmb-
0
20
40
60
80
0 1 2 3
inte
nsi
ty (
a.u
.)
time after irradiation (hour)
nuclear PER2 in HCT116 p53-/- IR-,
LMB+/-
IR-nuclearwtlmb+
IR-nuclearwtlmb-

20
Proteasome Inhibition can Rescue the PER2 Nuclear Accumulation from Leptomycin B
Rationale:
Leptomycin B is a nuclear export inhibitor, and it is expected to deter the nuclear export of PER2 and lead to faster nuclear accumulation of PER2. We noticed that in unirradiated HCT116 p53+/+ cells, LMB treatment seems to lead to decreased PER2 accumulation in the nucleus (Figure 4.6 E). In the nucleus, phosphorylated PER2 can be degraded by β-TRCP1 (Ohsaki et al. 2008). Our lab previously discovered MDM2:PER2:p53 trimeric complex exclusively in the nucleus, and that PER2 is a novel substrate of MDM2 E3 ligase activity (Gotoh et al. 2015; Liu et al. 2018). I hypothesize that a degradation factor in the nucleus is accumulated in the nucleus by LMB, thus the PER2 signal is decreased due to faster degradation in the nucleus.
Description:
MG132 is a proteasome inhibitor that can block the proteolytic activity of the 26S proteasome complex and attenuate the proteasomal degradation of protein (Han et al. 2009). HCT116 p53+/+ cells were synchronized with dexamethasone for 2 hours, treated with/without MG132 and/or LMB for 4 hours, then collected at 0,1,2 hours after cell culture in 37℃.
Result:
Without MG132, the accumulation of PER2 in the nucleus was independent of LMB (Figure 4.7 A). In the samples treated with MG132, LMB promotes PER2 accumulation in the nucleus (Figure 4.7 B). We found no significant difference (t-test, p>0.05) between MG132+ treatment and MG132- treatment for each time point in both LMB treated or untreated samples. Therefore, we do not find the regulation of protein stability as a major factor that contributes to PER2 nuclear localization in response to irradiation.

21
A
B
C
Figure 4.7 PER2 in the nucleus of HCT116 p53+/+ in response to LMB and MG132
Samples were synchronized with 200 nM dexamethasone, and incubated with or without LMB (lmb) or MG132(mg), then fixed at designated time points and stained with anti-PER2 antibody. (A) HCT116 p53+/+ cells were treated with LMB, with or without MG132, then synchronized with dexamethasone. (B) HCT116 p53+/+ cells were treated with or without MG132, then synchronized with dexamethasone. (C) IF images for each condition
0
20
40
60
80
100
120
0 0.5 1 1.5 2
inte
nsi
ty (
ho
ur)
time after irradiation (hour)
nuclear PER2 in LMB+ treated HCT116 p53+/+
nuclear lmb+ mg+ nuclear lmb+ mg-
0
20
40
60
80
100
120
0 0.5 1 1.5 2
inte
nsi
ty (
ho
ur)
time after irradiation (hour)
nuclear PER2 in LMB- treated HCT116 p53+/+
nuclear lmb- mg+ nuclear lmb- mg-
22
Perturbation of Circadian Cycle by Small Molecule Inhibitors and Irradiation
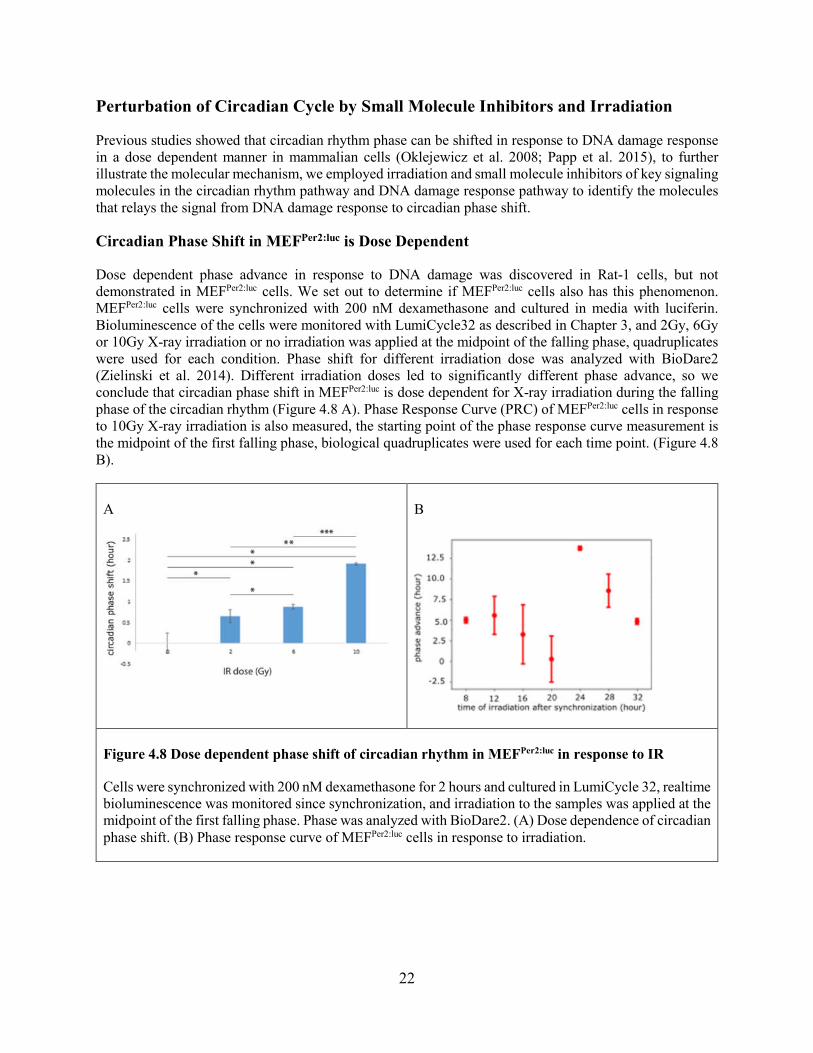
Previous studies showed that circadian rhythm phase can be shifted in response to DNA damage response in a dose dependent manner in mammalian cells (Oklejewicz et al. 2008; Papp et al. 2015), to further illustrate the molecular mechanism, we employed irradiation and small molecule inhibitors of key signaling molecules in the circadian rhythm pathway and DNA damage response pathway to identify the molecules that relays the signal from DNA damage response to circadian phase shift.
Circadian Phase Shift in MEFPer2:luc is Dose Dependent
Dose dependent phase advance in response to DNA damage was discovered in Rat-1 cells, but not demonstrated in MEFPer2:luc cells. We set out to determine if MEFPer2:luc cells also has this phenomenon. MEFPer2:luc cells were synchronized with 200 nM dexamethasone and cultured in media with luciferin. Bioluminescence of the cells were monitored with LumiCycle32 as described in Chapter 3, and 2Gy, 6Gy or 10Gy X-ray irradiation or no irradiation was applied at the midpoint of the falling phase, quadruplicates were used for each condition. Phase shift for different irradiation dose was analyzed with BioDare2 (Zielinski et al. 2014). Different irradiation doses led to significantly different phase advance, so we conclude that circadian phase shift in MEFPer2:luc is dose dependent for X-ray irradiation during the falling phase of the circadian rhythm (Figure 4.8 A). Phase Response Curve (PRC) of MEFPer2:luc cells in response to 10Gy X-ray irradiation is also measured, the starting point of the phase response curve measurement is the midpoint of the first falling phase, biological quadruplicates were used for each time point. (Figure 4.8 B).
A
B
Figure 4.8 Dose dependent phase shift of circadian rhythm in MEFPer2:luc in response to IR
Cells were synchronized with 200 nM dexamethasone for 2 hours and cultured in LumiCycle 32, realtime bioluminescence was monitored since synchronization, and irradiation to the samples was applied at the midpoint of the first falling phase. Phase was analyzed with BioDare2. (A) Dose dependence of circadian phase shift. (B) Phase response curve of MEFPer2:luc cells in response to irradiation.
23
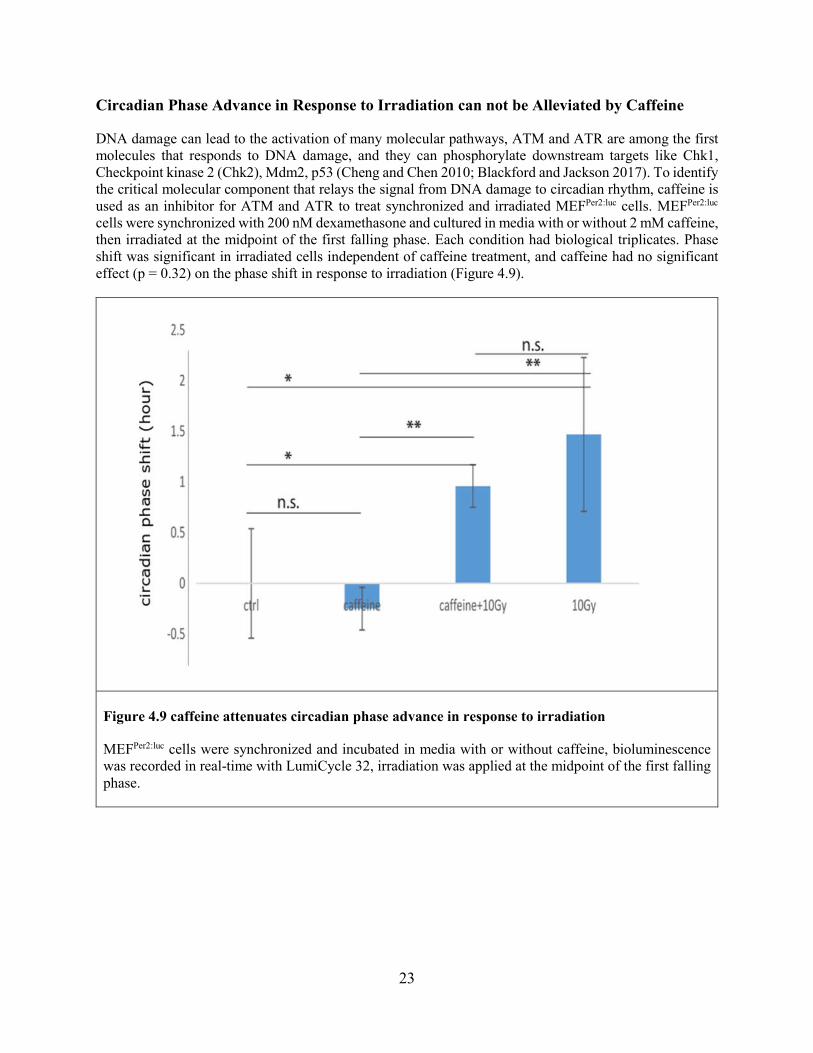
Circadian Phase Advance in Response to Irradiation can not be Alleviated by Caffeine
DNA damage can lead to the activation of many molecular pathways, ATM and ATR are among the first molecules that responds to DNA damage, and they can phosphorylate downstream targets like Chk1, Checkpoint kinase 2 (Chk2), Mdm2, p53 (Cheng and Chen 2010; Blackford and Jackson 2017). To identify the critical molecular component that relays the signal from DNA damage to circadian rhythm, caffeine is used as an inhibitor for ATM and ATR to treat synchronized and irradiated MEFPer2:luc cells. MEFPer2:luc cells were synchronized with 200 nM dexamethasone and cultured in media with or without 2 mM caffeine, then irradiated at the midpoint of the first falling phase. Each condition had biological triplicates. Phase shift was significant in irradiated cells independent of caffeine treatment, and caffeine had no significant effect (p = 0.32) on the phase shift in response to irradiation (Figure 4.9).
Figure 4.9 caffeine attenuates circadian phase advance in response to irradiation
MEFPer2:luc cells were synchronized and incubated in media with or without caffeine, bioluminescence was recorded in real-time with LumiCycle 32, irradiation was applied at the midpoint of the first falling phase.

24
CK1 Kinase Inhibitor PF670 can Alleviate Circadian Phase Advance in Response to Irradiation
Although ATM and ATR are some of the first effectors of DNA damage response, the inhibitor we used, caffeine, was unable to alleviate the circadian phase advance effect. We suspected that this is due to the poor specificity and potency of caffeine as checkpoint inhibitor. DNA damage elicited by X-ray is predominantly double strand breaks, so we decided to use a more specific and more potent inhibitor, Ku-55933, with IC50 of 300 nM to inhibit ATM activity (Rouse and Jackson 2002; Lau et al. 2005). CK1 is a family of highly related constitutively active serine/threonine-protein kinase that regulates a wide variety of cellular activities including DNA damage response, Wnt signaling and circadian rhythm (Dumaz et al. 1999; Del Valle-Pérez et al. 2011; Qin et al. 2015). PF670462 (PF670) is a potent CK1δ/ε inhibitor with IC50 of 7.7 nM and 14 nM respectively (Liu et al. 2013), and hypothesize that it could affect the circadian phase shift in response to DNA damage through regulation of either DNA damage response pathway or circadian rhythm pathway.
MEFPer2:luc cells were synchronized and cultured in media with designated inhibitors or without inhibitor for control, then irradiated at the midpoint of the first falling phase. Biological quadruplicates were used for each condition. The effect of Ku55933 was ambiguous due to the inconsistency in the quadruplicates in Ku-55933 treated irradiated sample (Figure 4.10). However, PF670 significantly reduced the phase advance independent of Ku-55933 treatment, suggesting an important role of CK1δ/ε in the phase advance in response to DNA damage. Notably, when treated along with Ku-55933, PF670 can cause a significant phase delay in cells without irradiation. This could due to the circadian regulation activity of CK1.
Figure 4.10 effect of small molecule inhibitors to circadian phase shift in MEFPer2:luc cells
MEFPer2:luc cells were synchronized and incubated with Ku-55933 (5 μM) or PF670 (1 μM) or both,
bioluminescence is monitored with LumiCycle 32, and the phase is analyzed with BioDare2, then normalized in relation to control group.

25
Chapter 5: Analysis of Immunofluorescence Microscopy Images
Image analysis programs are used to process and analyze the image to eliminate the subjective bias from human observer and keep consistency between multiple images. Nucleus and cytosol needs to be segregated for the quantification of the target proteins in different cellular compartments. Programs that provide this feature such as Squassh, CellProfiler and BleND were tested (AU - Stockwell and AU - Mittnacht 2014; Rizk et al. 2014; Verschuuren et al. 2017). However, none of the established programs can consistently and accurately segregate the nucleus and cytosol from my images, so I created two pipelines to process and quantify the protein signal for my IF images.
Pipeline1: Quantification of IF signal in each nucleus based on ImageJ macros
This pipeline was used to quantify the γ-H2AX signal in the nucleus of HCT116 cells.
1. Split the RGB multichannel image into grey scale images for each channel. 2. Segregate and identify each nucleus based on the DAPI channel and create Region of Interest (ROI). 3. Quantify the mean signal density within each nuclei and export data in Comma Separated Values
(CSV) format.
Pipeline2: Nuclear/cytosolic IF signal quantification based on python scripts
1. Channel separation and bit depth conversion We first splitted the original image into separate channels. Each channel contained the information of one fluorescent label. This analysis method can handle multiple channels simultaneously, most commonly 3. In the 3 channels, one has to have only nuclear localization, and one of the other two has to have cytosolic localization. With our sample, DAPI only stains the nuclear region and PER2 have both nuclear and cytosolic distribution. Since most image processing packages are only compatible with 8-bit images, all 16-bit images were converted to 8-bit images at this step.
2. Image slicing and denoise Then we divided the image into 4 by 4 slices with image_slicer package to generate 16 slices for each sample, calculating the mean and standard deviation of the 16 slices served to validate the uniformity of the sample. Background noise in IF images could result from any step from sample preparation to microscopy imaging, and they could impact the analysis result and make recognizing cell morphology very difficult. Denoising of the image was achieved by applying a median filter, the disk size was set to 2 so that the processed image is not blurry.
3. Region of interest (ROI) definition DAPI channel was used for nuclear ROI definition. The nuclear region usually has strong and continuous signal from the DAPI staining. Sobel operator, watershed transform were used for segmentation of nucleus region from background, small holes were removed with mathematical morphology. Cytosolic region was defined by subtracting the nuclear region from whole cell region. The whole cell region was defined with the signal from a antigen that has cytosolic distribution. Triangle threshold value of the denoised image was calculated and ROI of the whole cell was determined as region with greyscale value higher than the triangle threshold.
4. Batch quantification and processed image plotting. Image from designated folders were matched to the same tile by filename, processed images are plotted to demonstrate ROI for each cell. Since this method was very sensitive to ROI definition quality, these processed images need to be visually checked to ensure correct parameters are used in the analysis. If the ROI doesn’t match nucleus or cytosolic shape, this method would need modification to adjust the dataset. Data was exported for each sample as the program runs, and a file that has all the quantification data in the dataset was exported in CSV format when the program finished the analysis.
5. Benchmarking of the denoising in this image analysis method. Denoising was used in this image analysis method to reduce background noise. Some denoising methods can be destructive to the

26
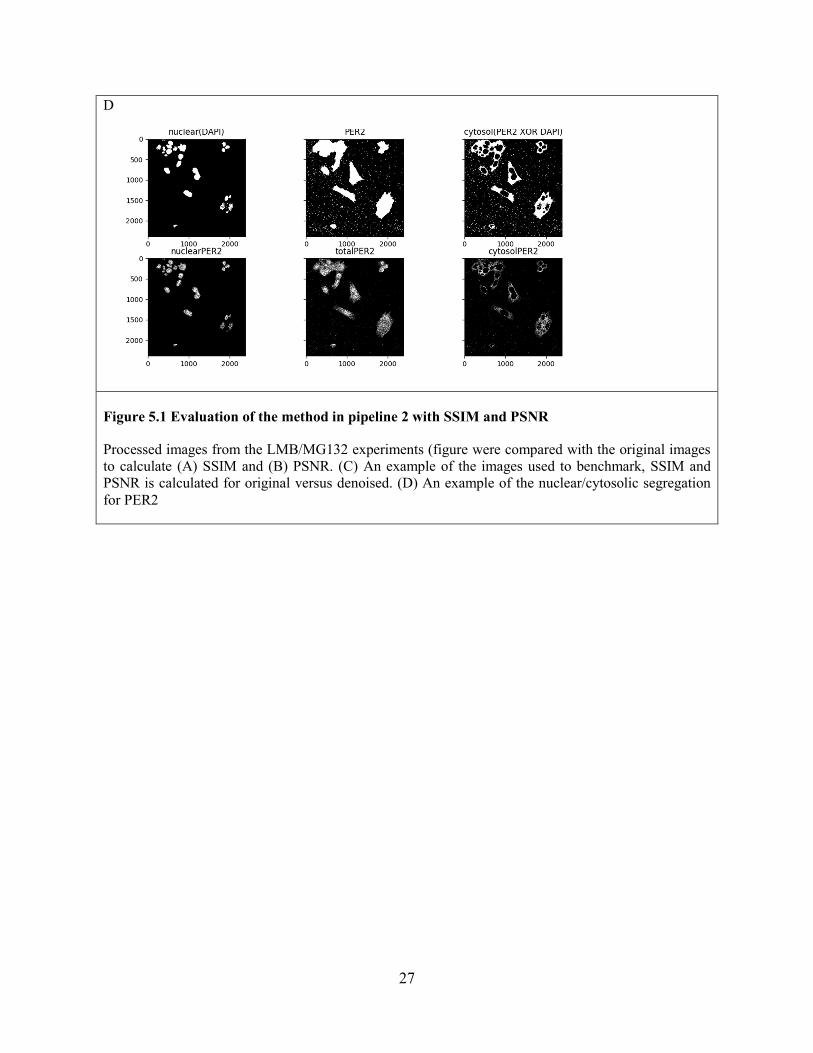
original image and skew the information contained in the original image. Structural Similarity Index (SSIM) and Peak Signal to Noise Ratio (PSNR) are two parameters commonly used to benchmark image analysis methods. To evaluate the method we used, the denoised images of LMB/ MG132 experiments (Figure 4.7 C) were compared with the original images to calculate SSIM and PSNR values in the PER2 and p53 channel (Figure 5.1). The SSIM values for both PER2 and p53 signal are between 0.4 and 1.0, the PSNR values for both PER2 and p53 signal are between 25 and 45, suggesting that the processed images are not significantly distorted from the original images, proving that the quantification can faithfully represent the signals from both proteins.
A
B
C
27
D
Figure 5.1 Evaluation of the method in pipeline 2 with SSIM and PSNR
Processed images from the LMB/MG132 experiments (figure were compared with the original images to calculate (A) SSIM and (B) PSNR. (C) An example of the images used to benchmark, SSIM and PSNR is calculated for original versus denoised. (D) An example of the nuclear/cytosolic segregation for PER2

28
Chapter 6: Bioinformatics analysis
Introduction:
Two bioinformatic projects were developed during my dissertation and included the study of Single Nucleotide Polymorphisms (SNPs) present in the coding region of the human Per2 gene, and to complete another project in the lab, I studied how intracellular iron concentration leads to peripheral clock resetting in mice liver.
The first project was initiated to search for mutations of human PER2 that can affect PER2:p53 binding. Chronic jet lag and extensive exposure to shift work was shown to be associated to cancer risk and tumor progression(Shanmugam et al. 2013). Our lab recently found that several missense mutations of p53 that are commonly found in cancer patients can affect the binding affinity between p53 and PER2 in vitro (unpublished data). We hypothesize that the difference in the molecular interaction between PER2 and p53 due to missense mutations might lead to the diversity in the susceptibility to cancer risk caused by circadian disruption in different people. SNPs from the 1000 Genomes project was used to analyze the Minor Allele Frequency (MAF) and geological distribution of missense mutations in Per2 in order to gain insight on the hypothesis.
The second project was initiated to find genomics data from in vivo experiments to further support how metabolic changes act as physiological cues to synchronize the liver circadian rhythm. This work is an extension of Dr. Samuel Schiffhauer’s research of circadian regulation by ferrous iron in vitro.
Single Nucleotide Polymorphism (SNP) Analysis of Human PER2 Protein
Introduction
A Single nucleotide polymorphism (SNP) is a variation of single nucleotide in the genome. These variations usually originate from naturally occurring mutations, and they have the potential of affecting the function of the genes they are located. While most SNPs have no effect on the carrier, some SNPs can lead to hereditary diseases such as sickle-cell anemia and cystic fibrosis (Ingram 1956; Hamosh et al. 1992).
SNPs in PER2 have been associated to various physiological and pathological phenotypes such as circadian disorders (K L Toh et al. 2001), chronotypes (Carpen et al. 2006; Lee et al. 2011; Jones et al. 2019), alcoholism (Yuferov et al. 2005), affective disorder (Kripke et al. 2009), depression (Lavebratt et al. 2010), metabolic syndrome (Garcia-Rios et al. 2012), abdominal obesity (Garaulet et al. 2010) and reward circuitry (Forbes et al. 2012). However, the only disease caused by SNP of PER2 with clear molecular mechanism is the FASPS disease due to PER2 mutation of serine at 662. Human PER2 has 13310 SNPs registered in the Database of Short Genetic Variations,
There are three candidate data sources for the MAF analysis of PER2, 1000 Genomes project (1000G), NHLBI Grand Opportunity Exome Sequencing Project (ESP) and Exome Aggregation Consortium (ExAC). We decided to choose 1000G because it has more than 8 times more variants recorded than the other two candidates, and its subject population has a diverse ethnic composition that represents the majority of human populations around the globe. The 1000 Genomes project is a deep catalog of human genetic variation, it ran between 2008 and 2015 and collected data from 2504 individuals from 26 populations around the world, and has ~84 million variants (Durbin et al. 2010; Sudmant et al. 2015).

29
Procedure
To understand the natural variations of human PER2 protein and their geological distribution, I analyzed the SNPs collected by the 1000 Genomes project and created a tentative map that showed the PER2 missense mutations and their MAF.
The SNP data is downloaded from National Center for Biotechnology Information (NCBI) SNP GeneView as a webpage and parsed with regular expression to match the hypertext markup language. Missense mutations, MAF and the amino acid position is extracted from the parsed file based on the column number in the table from the webpage as shown in the screenshot (Figure 6.1). Contig reference amino acid of each position is extracted from the canonical PER2 sequence. MAF is plotted against amino acid position for each SNP on PER2.
Figure 6.1 Screenshot of the table displayed in the SNP GeneView webpage for PER2
The webpage for GeneView can be accessed by searching for PER2 in the NCBI SNP database

30
Results
Most parts of the PER2 protein is highly conserved in human. We identified 74 SNPs that can cause missense mutation in PER2, and 68 of them were rare mutations with MAF<0.005. The SNPs with MAF > 0.005 were mostly positioned within or adjacent to the p53 binding sites previously established in our lab, suggesting an evolutionarily adaptive role of the binding between PER2 and p53 (Figure 6.2).
1000 Genome project categorized the individuals into 5 super populations: African (AFR), Ad Mixed American (AMR), East Asian (EAS), European (EUR), South Asian (SAS), the MAF of the SNPs were plotted for each super population. We identified two SNPs that have drastically different MAF in different super populations. A missense SNP (rs934945) that causes mutation of glycine 1244 to glutamate is rare in African population (MAF < 0.01) but relatively common in all other super populations (MAF > 0.17). Another missense SNP (rs55704277) that causes mutation of Alanine 828 to Threonine is not detected in east Asian or south Asian populations, but has diverse MAF in other populations (MAF = 0.001 in Europe, MAF = 0.01 in American, MAF = 0.12 in Africa) (Figure 6.3).
The revelation of this difference is unclear at the moment, but could be due to adaptations of different populations to different climate or cultures.

31
Figure 6.2 General MAF and position of PER2 SNPs in 1000 Genomes project
MAF is acquired as described in the text, MAF is plotted against amino acid position for each SNP with the script described in the appendix, and the figure is finalized with Adobe Illustrator.

32
Figure 6.3 MAF and geological distribution of PER2 SNPs in 1000 Genomes project
AFR: African, AMR: Ad Mixed American, EAS: East Asian, EUR: European, SAS: South Asian

33
Effect of Iron Intake on Transcription of Circadian Genes in Mice Liver
This is a project in collaboration with Dr. Samuel Schiffhauer. I was responsible for the bioinformatics analysis and part of the RNA-seq data processing in this project.
Introduction
Tissue-specific and temporal-dependent genomic-expression profile analyses established that clock mechanisms regulate numerous aspects of the body’s physiology and metabolism and are entrained in response to an input signal (Longo and Panda 2016). We know now that feeding and fasting cycles are more potent circadian synchronizers in peripheral tissues than systemic cues released in response to photic inputs (Damiola et al. 2000; Saini et al. 2013). Indeed, whereas feeding acts as a cue in the liver, the same input is unable to reset the clock in the SCN as shown in rodents maintained under a restricted feeding protocol where meals, but not the amount of calories, were confined to a specific temporal window (Damiola et al. 2000; Saini et al. 2013). On the other hand, calorie restriction does affect the phase of the circadian rhythm in the SCN (Mendoza 2007). Overall findings are of relevance when it comes to understanding how liver metabolism and clock functioning are intertwined as findings show disruption of circadian rhythms and alterations in daily food intake have been both linked to metabolic diseases (Turek et al. 2005; Arble et al. 2009; Marcheva et al. 2010). Conversely, individuals experiencing chronic sleep debt or demanding shift work schedules exhibit physiological maladaptation, a phenomenon that leads to endocrine dysfunction and has severe cardiometabolic implications (Spiegel et al. 1999; Scheer et al. 2009). Support to these findings comes from the use of genetic mice models as they have helped defining the specific contributions of various core clock components to specific metabolic phenotypes (Bass 2012). For example, Clock-mutant and Npas2-knockout animals show altered patterns of rest and metabolic activity and a modified circadian behavior that compromise the animal’s adaptability to feeding conditions and develop hyperphagic and obese phenotypes (Dudley et al. 2003; Turek et al. 2005). Interestingly, animals undergoing metabolic alterations due to a nutritional challenge, e.g. maintained in a high-fat diet, also experience diverse forms of circadian disruption, e.g. period lengthening, suggesting a reciprocal regulation exists (Kohsaka et al. 2007; Laposky et al. 2008; Peek et al. 2012; Eckel-Mahan and Sassone-Corsi 2013).
As diets vary substantially in their composition efforts focused in identifying specific nutrients that can act as clock zeitgebers. Food macronutrients such as resveratrol, proanthocyanidins, carbohydrates, and polyamines act in the clock either indirectly, by acting in a signaling pathway that eventually influence the activity of circadian proteins, or directly, by targeting a specific core clock component (Ribas-Latre and Eckel-Mahan 2016). On the other hand, only a limited number of micronutrients (e.g., some vitamins) and natural ligands (e.g., cholesterol, eicosanoids, and retinoic acid) are known to directly target clock molecules (Ribas-Latre and Eckel-Mahan 2016). Heme, for example, directly interferes with the formation of the BMAL1:NPAS2 heterodimer (Kaasik and Lee 2004), the transcriptional activity of REV-ERB-alpha(Raghuram et al. 2007; Yin et al. 2007), and the stability of PER2 (Yang et al. 2008).
A case-point in our study refers to iron as an essential micronutrient for which maintaining its homeostasis is relevant to the entrainment of the hepatic clock (Kalhan and Ghosh 2015). As today, mounting evidence establishes dietary iron modulates circadian rhythms of hepatic function through Adenosine 5′ Monophosphate-activated Protein Kinase (AMPK) and SIRT1 metabolic sensors (reviewed by (Bass 2012; Kalhan and Ghosh 2015)); however, a void exists with regards to whether iron could circumvent this peripheral pathways and directly influence the expression and/or activity of clock components to promote resetting. Accordingly, our work establishes that iron overload directly impacts circadian oscillation by acting on the expression and stability of its core clock components, a result that favors the existence of a

34
regulatory loop in which circadian regulatory components modulate and are being influenced by the metabolic iron pool.
Results Iron overload can be acquired through both genetic and dietary factors and can lead to widespread health conditions (Abbaspour et al. 2014). Proper homeostasis requires the body’s constant monitoring and adjustment to evolving conditions in the environment that are generated by cues as basic as a dietary source. Therefore, we ask how micronutrients’ uptake, e.g. iron by liver cells, exerts a zeitgeber function in the tissue’s circadian clock, a finding of relevance if considering nutritional regimens as part of a therapeutic approach to treat, for example, metabolic diseases.
The oscillation of core clock genes is altered in response to changes in the labile iron pool. Initial studies aimed to determine whether the oscillatory behavior and level of expression of circadian core mRNA components remained invariable despite alterations in the intracellular labile iron pool. To explore this possibility, we chose to work with human HepG2 epithelial liver cells as they are amendable for synchronization (Fig. S1A-C) and have been used in circadian biology before to i) identify the sensor role
of heme, an iron-containing porphyrin prosthetic group, in Rev-Erb for synchronizing glucose homeostasis, energy metabolism, and the cellular clock (Yin et al. 2007), ii) examine the effect of dosing time, drug pharmacokinetics, and xenobiotic metabolism (Azama et al. 2007), iii) evaluate the therapeutic value of synthetic ligands that pharmacologically target clock components (Solt and Burris 2012), iv) understand the impact of circadian factors in global transcriptomics and in modulation of drug metabolism (Kriebs et al. 2017).
Initially, we chose to study the transcriptional profile of the PER2, BMAL1, and CRY2 genes under conditions in which HepG2 cells were exposed to comparable dietary levels of iron (Card et al. 1964). Accordingly, cells were initially circadian synchronized with dexamethasone, and then, maintained in media depleted or with low concentration of Fe2+ [named iron, hereafter] as indicated in the Materials and Methods section. Firstly, we confirmed HepG2 cells’ viability remained unchanged despite being challenged by iron overload for as long as 48h (Fig. S1D). Then, we monitored the expression of clock genes in samples treated, or not, with Fe2+ at a concentration proximal to the upper range of plasma iron
detected in healthy individuals [30 M, (Card et al. 1964)]. Samples were collected at different times after synchronization and gene expression was monitored by qRT-PCR (Fig. 6.4.A).Results show PER2 and BMAL1 levels follow an apparent oscillatory pattern of expression (Fig. 6.4.B-C) that was confirmed to be periodic using a non-parametric algorithm, JTK_CYCLE, included in the MetaCycle package (Hughes et al. 2010; Wu et al. 2016) (Fig. 6.4.D). As shown in Figs. 1B-C, addition of dietary iron levels completely dampened the expression of PER2 to a point in which periodicity and rhythms were lost, as confirmed by non-parametric analysis (BH.Q<0.1 and ADJ.P<0.05 are significant). Although more prominent in PER2, loss of rhythmic mRNA expression was also evident for BMAL1 and CRY2 genes (Fig. 6.4.C and S1E).

35
Figure 6.4. The expression of iron metabolic genes is sensitive to overexpression or repression of core circadian components. (A)Endogenous ferrous intracellular iron was quantified by ferrozine assay (Sigma) in HepG2 cells circadian synchronized by a 2h incubation with 50% FBS. Results represent biological triplicates, each replicate comprised of 2x10⁶ cells. The assay was quantified in a plate reader at 593 nm, and results were normalized to the 0h timepoint. (B) HepG2 cells were transfected with pCS2+FLAG-CLOCK, pCS2+myc-BMAL1, pCS2+FLAG-PER2, or empty vector using Lipofectamine LTX Plus as described in Materials and Methods. Cells were harvested 24h after transfection. Expression of IREB2, SLC40A1, and TFRC was analyzed by qRT-PCR. PER2 was used as a control. (C) HepG2 and AML12 cells were transfected with siRNA targeting PER2 using Dharmafect. Iron metabolic gene expression was quantified by qRT-PCR for HepG2 cells, and by microarray (Affymatrix) for AML12

36
cells. Significant changes in expression were determined by t-test. *p ≤ 0.05; ** p ≤ 0.005; *** p ≤ 0.001
Next, we reasoned that depletion of the endogenous labile pool of iron in the cell might reverse the effect of Fe2+treatment and restore the expression of PER2, BMAL1, and CRY2 mRNA to levels comparable to those in untreated cells. To test this possibility, we incubated HepG2 cells with a lipid-soluble, cell permeable, ferrous iron chelator 2,2,’-dipyridyl [named 2,2’-DP, hereafter] proven to interact with the “labile” iron pool within eukaryotic cells (Epsztejn et al. 1997; Konijn et al. 1999). A dose-dependent viability assay showed treatment of HepG2 cells with 2,2’-DP at concentrations compatible with its chelating activity were not detrimental for the cells’ viability (Fig. S1D). Cells were maintained in 2,2’-
DP-containing media (15 M) during synchronization and monitored for gene expression by qRT-PCR at various times after dexamethasone treatment. Results show that, unlike BMAL1 (Fig. 6.4.C, right panel), 2,2’-DP reversed the effect of Fe2+ treatment on PER2 expression (Fig. 1B, right panel). Furthermore, PER2 circadian periodicity was reestablished under 2,2’-DP treatment with values in length and amplitude mirroring those of untreated cells (Fig. 6.4.C). Conversely, the expression of BMAL1 was only reduced by ~50% as result of Fe2+ treatment (Fig. 6.4.C, middle panel) and partially restored when in the presence of 2,2’-DP (Fig. 6.4.C, right panel). Despite the mitigated effect of iron treatment in BMAL1 expression, the periodicity of its oscillation was compromised, and rhythms were lost (Fig. 6.4.D).
Because iron loading varies orders of magnitude under, for example, dietary conditions, improper gut absorption, pregnancy, excessive blood loss and in conditions such hereditary hemochromatosis or as result of transfusional overload (Dev and Babitt 2017), we asked whether the magnitude of the iron overload in clock gene expression was greater than, less than, or equal than that detected in response to physiological iron conditions. As such, HepG2 cells were maintained in media containing hundred-time range of iron concentration for 48h before harvesting and their transcriptional expression monitored (Fig.
6.5). Results show that physiological levels of iron (~ 10 M) cause a dramatic reduction in PER2 level
(p<0.005) and a significant decrease in BMAL1 and CLOCK transcript expression (p<0.05) (Fig. 6.5.A). Conversely, the expression of CRY2 was upregulated up to 3-fold in response to iron overload suggesting distinct iron regulatory mechanisms act upon circadian genes. Unlike its CLOCK counterpart, changes in BMAL1 gene expression seemed less responsive to even hundred-fold increase in iron concentration
despite being reduced at 10 M. As expected, the iron response genes TFRC and Slc40A1 were down-
and up-regulated, respectively in response to chronic iron exposure (Mehta et al. 2016). In agreement with the specific effect of iron in modulating PER2, BMAL1, CRY2, and CLOCK gene expression, long-term treatment of HepG2 cells with 2,2’-DP reverses the iron effect to basal levels in the case of PER2, BMAL1, and CRY2 while enhancing CLOCK expression (Fig. 6.5.B). Overall, the data presented here show iron uptake exerts a regulatory role in the expression of clock core genes.

37
Figure 6.5 Circadian oscillations in TFRC expression are not generated by rhythmic de novo transcription. (A) HepG2 cells were treated with FeSO4 for 8h prior to synchronization with dexamethasone (100nM). Cells were then maintained in serum free media that contained FeSO4 in the case of treated cells, and collected at the times indicated. Expression of TFRC was quantified by qRT-PCR, normalizing within each treatment group to the -2h timepoint. Between treatment groups, the +Fe2+
and +2,2’-DP groups were normalized to the untreated group using the ΔCT values of TFRC in each -2h timepoint and using this normalization factor from the unsynchronized cells to properly represent the comparative expression of TFRC between the time series. (B-D) Figures generated from dataset deposited by (Menet et. al., 2012) and (Koike et. al., 2012). (B) ChIP-seq data was used to analyze circadian protein binding to TFRC. Liver samples were taken from entrained mice maintained in D:D 12:12 from CT0 to CT20. Knockout mice which did not express circadian gene of interest were included as a control. Mouse liver homogenate was incubated with antibodies directed against the indicated circadian proteins before crosslinking, and the resulting isolated chromatin was amplified and SOLiD sequenced, before reads were mapped to the mouse genome (NCBI m37/mm9). Circadian protein binding to TFRC, occurs predominantly near the transcription start site. (C) Nascent RNA was isolated from mouse liver, from animals housed in LD 12:12. Purified nascent RNA was used to generate Illumina libraries, sequenced using an Illumina Genome Analyzer. Sequences were aligned to the mouse genome (UCSC mm9), and analyzed using UCSC Genome Browser. Transcription of TFRC is nonrhythmic, (D) mRNA was isolated from the livers of entrained mice maintained in DD 12:12, collected every 4h from CT0 to CT44. Sequencing libraries were constructed using SOLiD Total RNA-seq Kit, and sequencing was run on an ABI SOLiD4 instrument. Sequences were aligned

38
to the mouse genome (UCSC mm9) and analyzed on UCSC Genome Browser. TFRC mRNA is rhythmic in contrast to the nascent RNA data.
Variations in the endogenous iron labile pool post-transcriptionally impacts the circadian expression of clock proteins. Although, iron exerts transcriptional control over gene expression, rapid response to iron occurs via post-transcriptional mechanisms of which the iron regulatory protein (IRP)/iron-responsive element (IRE) regulatory network is its chief mediator (Muckenthaler et al. 2017). And whereas this regulatory mechanism might be relevant to the expression of TFRC and SLC40A1 genes for which IRPs turn into IRE binding proteins in iron-starved cells, the existence of a post-translational iron-regulated response among clock components has not been explored. In light of this, we investigated the effect of altering the intracellular concentration of iron in the level and rhythmicity of core circadian
proteins. Accordingly, we incubated HepG2 cells with either Fe2+ (1 mM) or 2,2’-DP (15 M) for two days prior to synchronization and maintained under those conditions during the time course analyzed (Fig. 6.6). As shown in Fig. 6.6.A-B, extracts from untreated cells show a prominent oscillatory level of expression of PER2, CRY1, and BMAL1 proteins that contrast sharply with the low amplitude oscillations of CLOCK detected throughout the time course analyzed (Fig. 6.6.B, panels in left column). Interestingly, iron-treatment of HepG2 cells resulted in an array of responses at the protein level involving different clock components. This is, PER2 levels were dampened but oscillatory, BMAL1 lost rhythmicity, and CLOCK and CRY1 remained largely unresponsive to iron treatment (Fig. 6.6.B, panels in middle column). Furthermore, whereas treatment of cells with 2,2’-DP partially restored PER2 levels and rhythmicity, albeit to a lower amplitude, neither BMAL1 levels nor rhythmicity were restored when the endogenous iron free pool was chelated (Fig. 6.6.B, right column). Both CRY1 and CLOCK seemed to remain largely unchanged to 2,2’-DP treatment. As expected, IRP2 was rapidly targeted for degradation in iron-depleted cells (Recalcati et al. 2010); although, an oscillatory behavior prevailed and was in anti-phase with that of its expression in untreated cells.
When our data were analyzed in the context of those presented in Figs. 1 and 2, the overall panorama suggested iron might exert a multilevel regulatory control over the expression, stability, and time-dependent distribution of clock proteins in the cell. All of which, prompted us to look for cis-regulatory elements in the form of a IRE hairpin-loop in clock cote transcripts using the SIREs web-server (Search for Iron-Responsive Elements, http://ccbg.imppc.org/sires/,(Campillos et al. 2010)). Output results did not predict the existence of high-scored IRE structures in either the 5’ or 3’ regulatory region of PER2, CRY1 and 2, BMAL1, and CLOCK, although, the presence of other non-canonical IRE sequences cannot be completely ruled out. In summary, and among clock proteins, changes in intracellular iron levels influenced the expression and phase of PER2 while dampening BMAL1 oscillations suggesting a role for iron in controlling circadian rhythms.

39
Figure 6.6 Expression of iron metabolism regulator IRP2 in circadian synchronized HepG2 cells which have compromised iron status. (A) HepG2 cells were treated with FeSO4 (1mM) or 2,2’-DP (15uM) for 8h before synchronization with dexamethasone (100nM, t=-2). Cells were then collected every 4h for 48h, and mRNA expression of IREB2 was quantified by qRT-PCR. The -2h timepoint was used to normalize relative expression levels between treated groups and the untreated cells. (B) Analysis of period, phase, and amplitude of

40
mRNA rhythms was performed using MetaCycle. Phase is indicated by the direction of the arrow, and normalized amplitude by the length of the arrow as indicated on the graph’s scale. (C) Following 48h incubation with either FeSO4 or 2,2’-DP, HepG2 cells were synchronized by 2h serum shock (FBS, 50%). Cells were collected every 4h for 24h, and lysates were resolved by SDS-PAGE and analyzed by immunoblotting using α-IREB2 antibody. α-tubulin was used as a loading control. Protein levels were quantified by densitometry using ImageJ software. Quantification of IRP2 was normalized to tubulin, and the -2h timepoint was used to calculate relative protein amounts between FeSO4 or 2,2’-DP treated groups and untreated. Multiple exposures of each blot were used to calculate standard deviation of the densitometry signal. (D) Analysis of the period, phase and amplitude of the protein rhythms observed in (C) was performed using MetaCycle, by integrating the ARSER, JTK-Cycle, and Lomb-Scargle methods with Fisher’s method for integration of p-values. Phase is indicated by the direction of the arrow, and amplitude corresponds to the length of the arrow. Untreated is shown in grey, +Fe2+ in red, and +2-2’-DP in green.
Alterations in circadian bioluminescence rhythms occur as result of iron load. Next, we asked whether the importance of iron as regulator of clock components translates in alterations in circadian period length in cells. To address this question, we used a well-characterized mouse embryonic fibroblast system in which the luciferase reporter gene was fused in-frame and downstream of the endogenous mouse Per2 gene to allow for real-time monitoring of the oscillatory levels of the fusion protein [named MEFPer2::Luc hereafter, (Yoo et al. 2004)]. For these experiments, we used a range of iron concentrations compatible with the viability of MEF cells that was lower than that used in all HepG2 experiments described previously (Fig. S2). Our results show a dose-dependent shortening of the circadian period in
MEFPer2::Luc cells treated with Fe2+ that extended to ~3h when the iron concentration reached 1 M (Fig.
6.7). This result is in agreement with the role of PER2 in the negative feedback loop of the clock as reduction on total PER2 levels as result of iron treatment is expected to shorten the circadian period. Of note, oscillations are still detectable despite iron-mediated PER2 degradation in MEFPer2::Luc as the fraction of PER2::Luc that remains after iron treatment is larger than that in HepG2 (Fig. S2). Conversely, cells treated with 2,2’-DP showed significant lengthening of PER2::Luc luminescence rhythms of ~1h. Whereas treatment with the chelator was expect to reverse the effect of iron in circadian rhythms to a value closer to that of mock samples, the fact that resulted in a significantly larger period was unexpected from the stand point of iron only acting through PER2. However, period lengthening might simply reflect a much larger role for iron in modulating other clock components.
Iron overload affects the transcriptional profile of circadian genes in mouse models. Further studies aimed to identify changes in the expression of circadian genes in animal models where iron overload resulted from either nutritional intake or a genetic alteration. Accordingly, data for a nutritional model was obtained from the liver of animals maintained in an iron-deficient (< 3mg iron/kg), -balance (200 mg iron/kg), or -overload (8.3 g/Kg) diet for 3 weeks as described (Kautz et al. 2008). Expression data were retrieved from the National Center for Biotechnology Information’s (NCBI’s) Gene expression Omnibus (GEO) repository under the accession number GeneBank: GSE10421, (Kautz et al. 2008).
Initially, we confirmed the experimental model responded to changes in iron diet by evaluating the expression profile of key regulatory players involved in iron metabolism in the liver. Accordingly, the levels of Tfrc and Hamp1 were significantly impacted by alterations in the content of the iron diet. Thus, Tfrc was predominantly upregulated (~ 8-fold) under conditions of iron deficiency (Fig. 6.7.C) whereas increased Hamp1 expression (3-fold) occurred in animals fed an enriched iron diet (Fig. 6.7C and S2B). In sharp contrast to humans, mice express a second variant of the Hamp gene (i.e., Hamp2) that, unlike

41
Hamp1, has limited involvement in iron homeostasis (Neves et al. 2015), and, in our analysis, seemed to respond solely to iron deficiency (Fig. S2B). Increased Hamp1 production is known to cause an inhibitory effect in Slc40A1 expression, thus limiting iron release from liver hepatocytes by reducing iron mobilization and adsorption (Ramey et al. 2010). Accordingly, results summarized in Fig. S2B show that the expression profile of Slc40A1 remained at basal levels, whereas Hamp1 increased, during iron overload treatment. Furthermore, in the experimentally iron-deficient animal model, expression levels of Hamp1 and Slc40A1 were opposite to what was observed during iron overload (Fig. S2B). Lastly, Fig. 6.7.C show alteration in the expression of IREB2 mRNA were not significant under iron deficient condition and only marginally noticeable in iron overloaded liver samples. This is in agreement with previous findings that established the product of the IREB2 gene, the IRP2 protein, is primarily regulated post-translationally as result of fluctuations in the intracellular labile pool of iron.
Next, we analyzed the expression profile of 21 clock and clock-related genes using the same genome-wide transcriptional profile of mice fed with iron-deficient, -balanced, or -enriched diets. Initially, we categorized the clock’s response to iron based whether the expression profile of clock genes was, or not, responsive to alteration in intracellular iron levels. Accordingly, we found that, always compared with balanced-iron diet samples, the iron nutritional state significantly affected the expression of Clock and Arntl (also known as Bmal1 or Mop3), the negative regulators Cry1, Cry2, and PER3, as well as the nuclear receptors Nr1d1 and Nr1d2 genes, all of which are components of different interlocked feedback loops that include repressors and activators and are responsible for the functioning of the canonical clock network (Fig. 4C, ** p<0.005 and *** p<0.001). In addition, transcriptional elements from other auxiliary loops that ingrain in the clock core mechanism such as Dbp, encodes for the D-box binding protein, of an auxiliary transcriptional, were altered by changes in iron levels (Fig. 4C and S2B). Lastly, a third group of molecules functionally characterized for their phosphorylation-dependent E3-ligase activity and involved
in protein turnover of the negative regulators Cry’s and Per’s, i.e. Fbxl21 and -Trcp, respectively, were also affected by iron (Fig. S2B). A second group of circadian components were unresponsive to iron changes. This are: i) the Fbxl3 gene that encodes an ubiquitin ligase that targets Cry for degradation in the
nuclear compartment, ii) Csnk1, encodes for CK1 and is, in part, responsible for phosphorylation-mediated turnover and shuttling of circadian repressors, and iii) the retinoic acid-related orphan receptor
and (RORB and RORC, respectively) (Fig. S2B). A fourth gene, Npas3, also remained invariable to
iron levels; however, this result should be taken with caution due to the low level of Npas3 overall expression in liver (Fig. S2B).
The third group of iron responders correspond to those genes whose expression show a significant fluctuation in only one direction depending of the nutritional protocol the animals were subjected to experimentally. Compared to balanced-iron diet, the negative regulators and core components Per1 and
Per2, Npas2, and Csnk1 were downregulated in liver samples obtained from animals subjected to iron-enriched diet and no significant changes detected among animals maintained into a restricted iron-
deficient diet instead (Fig. 6.7C and S2B). Conversely, Gsk3 and RORA were upregulated under conditions of iron-deficiency (Fig. 6.7C and S2B). Overall, our analyses suggest iron has multiple entry points in the mechanism that controls circadian rhythmicity and that, depending on the temporal combination of cis-elements acting among the different promoters (i.e., ROREs, D- and E-boxes) is how rhythms reset to the various nutritional conditions.

42
Figure 6.7 Cellular response to acute iron influx is minimized in cells with downregulated PER2. (A) HepG2 cells were transfected with siRNA to knockdown PER2 expression, as described in materials and methods. 48h after transfection, cells were dosed with FeSO4 (1mM), and collected at timepoints indicated. Ferrous iron concentration was measured as described in Materials and Methods for cells expressing endogenous PER2 (inset). Expression of SLC40A1, TFRC, and IREB2 was quantified using qRT-PCR. Within each data series, expression is normalized to the -2h timepoint.
Materials and Methods
Cell cultures
Human hepatocellular carcinoma (HepG2) cells were a gift from Dr. Herbert Bonkovsky (Wake Forest University) and maintained in Dulbecco’s Modified Eagle’s Medium (DMEM, MT 10-014-CV, Corning) supplemented with 10% (v/v) fetal bovine serum (2916254 MP Biomedicals, 30µM Fe+), 50 units/ml penicillin, and 50 units/ml streptomycin. The use of this fetal bovine serum resulted in a growth media with an iron concentration of 3 μM, which is very low compared to the physiological range of iron in the
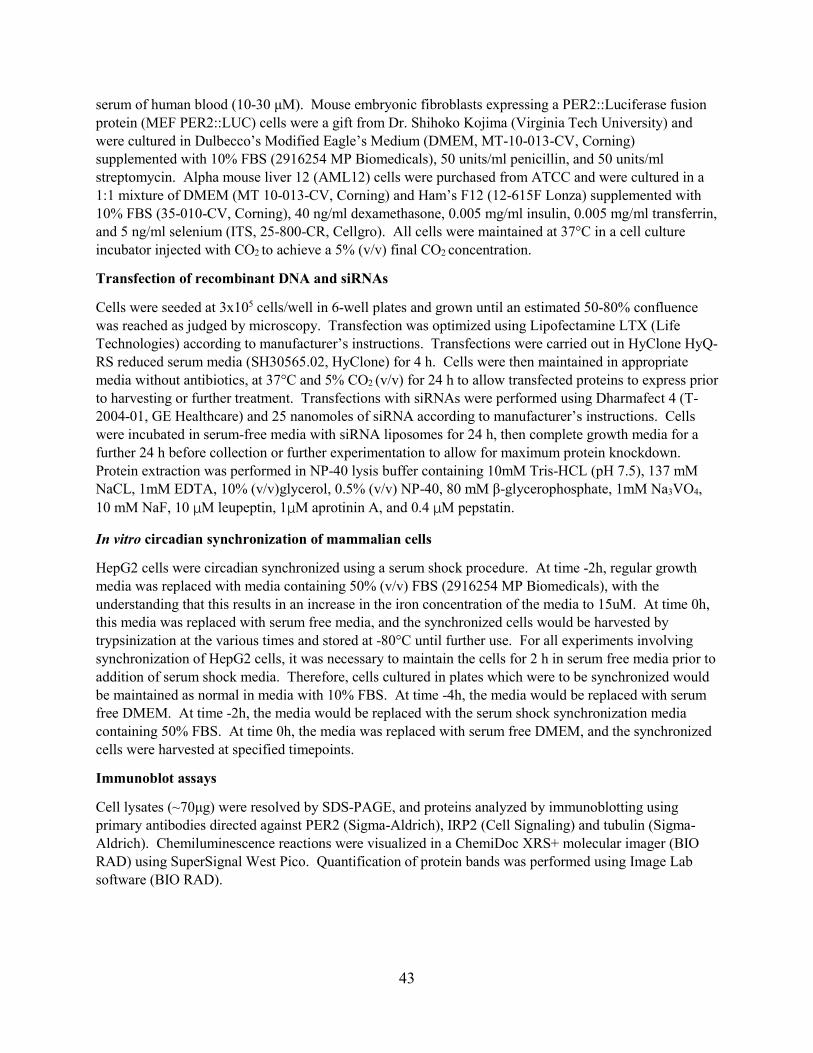
43
serum of human blood (10-30 μM). Mouse embryonic fibroblasts expressing a PER2::Luciferase fusion protein (MEF PER2::LUC) cells were a gift from Dr. Shihoko Kojima (Virginia Tech University) and were cultured in Dulbecco’s Modified Eagle’s Medium (DMEM, MT-10-013-CV, Corning) supplemented with 10% FBS (2916254 MP Biomedicals), 50 units/ml penicillin, and 50 units/ml streptomycin. Alpha mouse liver 12 (AML12) cells were purchased from ATCC and were cultured in a 1:1 mixture of DMEM (MT 10-013-CV, Corning) and Ham’s F12 (12-615F Lonza) supplemented with 10% FBS (35-010-CV, Corning), 40 ng/ml dexamethasone, 0.005 mg/ml insulin, 0.005 mg/ml transferrin, and 5 ng/ml selenium (ITS, 25-800-CR, Cellgro). All cells were maintained at 37°C in a cell culture incubator injected with CO2 to achieve a 5% (v/v) final CO2 concentration.
Transfection of recombinant DNA and siRNAs
Cells were seeded at 3x10⁵ cells/well in 6-well plates and grown until an estimated 50-80% confluence was reached as judged by microscopy. Transfection was optimized using Lipofectamine LTX (Life Technologies) according to manufacturer’s instructions. Transfections were carried out in HyClone HyQ-RS reduced serum media (SH30565.02, HyClone) for 4 h. Cells were then maintained in appropriate media without antibiotics, at 37°C and 5% CO2 (v/v) for 24 h to allow transfected proteins to express prior to harvesting or further treatment. Transfections with siRNAs were performed using Dharmafect 4 (T-2004-01, GE Healthcare) and 25 nanomoles of siRNA according to manufacturer’s instructions. Cells were incubated in serum-free media with siRNA liposomes for 24 h, then complete growth media for a further 24 h before collection or further experimentation to allow for maximum protein knockdown. Protein extraction was performed in NP-40 lysis buffer containing 10mM Tris-HCL (pH 7.5), 137 mM NaCL, 1mM EDTA, 10% (v/v)glycerol, 0.5% (v/v) NP-40, 80 mM β-glycerophosphate, 1mM Na3VO4,
10 mM NaF, 10 μM leupeptin, 1μM aprotinin A, and 0.4 μM pepstatin.
In vitro circadian synchronization of mammalian cells
HepG2 cells were circadian synchronized using a serum shock procedure. At time -2h, regular growth media was replaced with media containing 50% (v/v) FBS (2916254 MP Biomedicals), with the understanding that this results in an increase in the iron concentration of the media to 15uM. At time 0h, this media was replaced with serum free media, and the synchronized cells would be harvested by trypsinization at the various times and stored at -80°C until further use. For all experiments involving synchronization of HepG2 cells, it was necessary to maintain the cells for 2 h in serum free media prior to addition of serum shock media. Therefore, cells cultured in plates which were to be synchronized would be maintained as normal in media with 10% FBS. At time -4h, the media would be replaced with serum free DMEM. At time -2h, the media would be replaced with the serum shock synchronization media containing 50% FBS. At time 0h, the media was replaced with serum free DMEM, and the synchronized cells were harvested at specified timepoints.
Immunoblot assays
Cell lysates (~70μg) were resolved by SDS-PAGE, and proteins analyzed by immunoblotting using primary antibodies directed against PER2 (Sigma-Aldrich), IRP2 (Cell Signaling) and tubulin (Sigma-Aldrich). Chemiluminescence reactions were visualized in a ChemiDoc XRS+ molecular imager (BIO RAD) using SuperSignal West Pico. Quantification of protein bands was performed using Image Lab software (BIO RAD).

44
Total RNA purification and quantitative real-time PCR (qRT-PCR)
RNA was extracted using Trizol reagent (15596-026, Life Technologies), following manufacturer’s instructions. RNA samples were resuspended in DEPC treated water, and their purity and integrity analyzed using Agilent TapeStation by the Genomics Research Laboratory at the Biocomplexity Institute of Virginia Tech. Samples were incubated with DNase using an RQ1 DNase Kit (M6101, Promega), and cDNA was synthesized using the iScript cDNA Synthesis Kit (170-8891, BIO RAD), following manufacturers’ instructions. Specific gene mRNA expression was analyzed by qRT-PCR using PerfeCTa SYBR Green FastMix (95072-012 Quanta BioSciences) in 384 well plates (1438-4700, USA Scientific). Plates were thermocycled and scanned to measure fluorescence in a QuantStudio 6 Flex machine (Life Technologies), running QuantStudio Real-Time PCR System software. Primers used are listed in Table 6.1, FW indicates forward primer and RV indicates reverse primer.
Primer Name Sequence (5’ to 3’)
TBP FW cac gaa cca cgg cac tga tt
TBP RV ttt tct tgc tgc cag tct gga c
PER2 FW tga gaa gaa agc tgt ccc tgc cat
PER2 RV gac gtt tgc tgg gaa ctc gca ttt
CLOCK FW agt tca gca acc atc tca ggc tca
CLOCK RV ttg ctg gtg atg tga ctg agg gaa
CRY2 FW atc att ggt gtg gac tac
CRY2 RV tct gct tca ttc gtt ca
BMAL1 FW tca ttc tca ggg cag cag atg gat
BMAL1 RV gag ctg ctc ctt gac ttt ggc aat
IREB2 FW tcg atg tat cta aac ttg gca cc
IREB2 RV gcc atc aca att tcg tac agc ag
SLC40A1 FW ttg aac atg agc aag agc cta
SLC40A1 RV agt agg aga ccc atc cat ctc g
HAMP FW tcc tgc tcc tcc tcc tc
HAMP RV cag atg ggg aag tgg gtg tc
FTH1 FW cgc ctc cta cgt tta cct gt
FTH1 RV cac act cca ttg cat tca gc
TFRC FW ggc tac ttg ggc tat tgt aaa gg

45
TFRC RV cag ttt ctc cga caa ctt tct ct
TRF FW tga ttg cat cag ggc cat tg
TRF RV gcc agg taa gca tca tac acc a
Table 6.1 List of qRT-PCR primer sequences used
In vitro iron treatment and quantification of the endogenous iron pool.
To induce iron overload, ferrous sulfate (FeSO4, S25326, Fisher Scientific) was added to HepG2 cell media to a final concentration of 100nM-1 mM, and MEF PER2::LUC cell media had FeSO4 added to a final concentration of 1 μM. Ferrous sulfate was added directly to the DMEM complete growth media (10%FBS) at 37°C to avoid precipitation of the compound. Intracellular iron was depleted from the cells by supplementing the DMEM+10% FBS with up to 15 μM final concentration of 2-2’-dipyridyl (DP, D216305, Sigma), only supplementing the media with the chelator at concentrations which maintained cell viability. Viability was evaluated by using a MTT Cell Viability Assay (KA1606, Abnova). In order to measure intracellular iron levels, ~5x10⁶ cells were cultured in 100 mm dishes for 24 h before adding aqueous FeSO4 or DP for either 8h or 48h. Cells were harvested and rapidly homogenized at 4°C. Iron content of lysates was measured using a ferrozine based commercially available iron assay kit (MAK025-IKT, Sigma) in a 96 well plate. This colorimetric assay was quantified by measuring absorbance in a spectrophotometer plate reader (Molecular Devices SpectraMAX 190).
46
Gene Ontology Analysis of Circadian Iron Genes
Introduction
Gene Ontology (GO) is a dynamic, controlled classification system of genes from various species, and it is managed by the gene ontology consortium (Ashburner et al. 2000). Gene ontology has a loose hierarchy, genes with similar functions are classified under the same GO term, and the lower level of GO term in the hierarchy is more specific in describing the functionality of the genes. Each gene can be classified into multiple GO terms, and each ‘child’ GO term can have multiple ‘parent’ GO term.
Procedure
The GO terms in mice was downloaded from the Mouse Genome Informatics (MGI) website, and the term “iron” was used to select all the GO terms related to iron metabolism (Smith et al. 2018). The genes associated with each GO term is acquired through a web query script from MGI server (the script can be found in the appendix). The list of genes was then filtered for liver expression with tissue expression data provided by BioGPS (Wu et al. 2013) and filtered for circadian rhythmicity in liver with data provided by Circadian Gene Database (CGDB) (Wu et al. 2013; Li et al. 2017). 19 genes were found to be related to iron metabolism and has circadian rhythmicity in mice liver with support of in vivo experimental evidence. These 19 genes were processed through ShinyGO (Ge and Jung 2018 May 4), and grouped by GO terms (Ge and Jung 2018). Trough/peak was plotted for the genes in each group on a polar plot.
Result
Genes associated with cellular cation homeostasis and regulation of iron ion transport have peaks in the circadian rhythm between 12:00 and 24:00 in the day, while genes associated with ion transport and electron transport chain have peaks in the circadian rhythm between 0:00 and 12:00 in the day. This difference in the circadian phase indicates that genes with similar functions might work in coordination and keep the circadian phase aligned to each other (Figure 6.8).

47
A
B
C
D
E
F
Figure 6.8 Gene ontology analysis of circadian iron genes in mouse liver
Circadian genes related to iron metabolism are selected in CGDB database and grouped by GO terms. Peak is plotted in red, trough is plotted in green. Distance to the center represents the fold difference between peak and trough.
48
Chapter 7: Conclusions, and Future Directions
We discovered that rapid accumulation of PER2 in response to DNA damage in the nucleus independent of the presence of p53, which could be due to increased stability or translocation of PER2. It is imperative that we conduct the necessary experiments to find the exact cause.
We conducted preliminary examinations on the chemical inhibition of key regulatory molecules of the circadian rhythm, and discovered that CK1δ/ε inhibitor could attenuate the phase resetting of circadian rhythm that resulted from DNA damage. Inhibitors of ATM and ATR, however, had no significant impact. From these results, we postulate that the circadian phase resetting by DNA damage is mediated by CK1. Consequently, it would be of interest to test the upstream and downstream signaling molecules in relation to CK1 kinase to identify the complete signaling cascade.
The analysis of PER2 SNPs using data from the 1000 Genome project provided an interesting observation that alleles with high MAF were within or adjacent to the binding site of p53. Since PER2 is a key molecule in the circadian rhythm, it is possible that such variation could lead to various chronotypes. Our lab has shown that mutations in PER2 and p53 could change the binding of PER2:p53 in vitro, since p53 is an important cancer suppressor, we postulate that the SNPs could play a role in the susceptibility of cancer risk in response to DNA damage by altering the stability and/or association to p53. We are interested in finding more data on the genetics, phenotype and disease associated to the SNPs. We identified two SNPs with significantly different MAF in different super populations, but since the 1000 Genomes project has only less than 3000 subjects, it is imperative that we analyze the SNPs in a dataset from a larger population before we can draw a sound conclusion.
From an additional project, we analyzed the circadian rhythm of iron related genes and discovered that circadian iron genes in the liver with similar functions have similar phases. Genes associated to iron metabolism and regulation have expression peaks clustered in the evening, while genes associated to iron transport have expression peaks clustered in the morning. Such result indicates temporal differentiated activity of metabolism, regulation and transportation of iron in the liver, which brings our interest to studying the circadian coordination of iron regulation in the future.

49
Reference
Abbaspour N, Hurrell R, Kelishadi R. 2014. Review on iron and its importance for human health. J Res Med Sci. 19(2):164–174.
Akashi M, Takumi T. 2005. The orphan nuclear receptor RORα regulates circadian transcription of the mammalian core-clock Bmal1. Nat Struct Mol Biol. 12(5):441–448. doi:10.1038/nsmb925.
Akashi M, Tsuchiya Y, Yoshino T, Nishida E. 2002. Control of Intracellular Dynamics of Mammalian Period Proteins by Casein Kinase I ε ( CKI ε ) and CKI in Cultured Cells. Mol Cell Biol. 22(6):1693–1703. doi:10.1128/MCB.22.6.1693.
Antoch MP, Kondratov R V. 2010. Circadian proteins and genotoxic stress response. Circ Res. 106(1):68–78. doi:10.1161/CIRCRESAHA.109.207076.
Arble DM, Bass J, Laposky AD, Vitaterna MH, Turek FW. 2009. Circadian timing of food intake contributes to weight gain. Obes (Silver Spring). 17(11):2100–2102. doi:10.1038/oby.2009.264. [accessed 2019 May 8]. http://www.ncbi.nlm.nih.gov/pubmed/19730426.
Ashburner M, Ball CA, Blake JA, Botstein D, Butler H, Cherry JM, Davis AP, Dolinski K, Dwight SS, Eppig JT, et al. 2000. Gene ontology: Tool for the unification of biology. Nat Genet. 25(1):25–29. doi:10.1038/75556. [accessed 2019 May 8]. http://www.ncbi.nlm.nih.gov/pubmed/10802651.
AU - Stockwell SR, AU - Mittnacht S. 2014. Workflow for High-content, Individual Cell Quantification of Fluorescent Markers from Universal Microscope Data, Supported by Open Source Software. JoVE.(94):e51882. doi:doi:10.3791/51882.
Azama T, Yano M, Oishi K, Kadota K, Hyun K, Tokura H, Nishimura S, Matsunaga T, Iwanaga H, Miki H, et al. 2007. Altered expression profiles of clock genes hPer1 and hPer2 in peripheral blood mononuclear cells of cancer patients undergoing surgery. Life Sci. 80(12):1100–1108. doi:10.1016/j.lfs.2006.11.048.
Balsalobre A, Brown SA, Marcacci L, Tronche F, Kellendonk C, Reichardt HM, Schutz G, Schibler U, Schütz G, Schibler U, et al. 2000. Resetting of circadian time in peripheral tissues by glucocorticoid signaling. Science. 289(5488):2344–7. doi:10.1126/science.289.5488.2344.
Barnes JW, Tischkau SA, Barnes JA, Mitchell JW, Burgoon PW, Hickok JR, Gillette MU. 2003. Requirement of Mammalian Timeless for Circadian Rhythmicity. Science (80- ). 302(5644):439–442. doi:10.1126/science.1086593.
Bass J. 2012. Circadian topology of metabolism. Nature. 491(7424):348–356. doi:10.1038/nature11704. [accessed 2019 May 8]. http://www.ncbi.nlm.nih.gov/pubmed/23151577.

50
Belden WJ, Dunlap JC. 2008. SIRT1 Is a Circadian Deacetylase for Core Clock Components. Cell. 134(2):212–214. doi:10.1016/j.cell.2008.07.010.
Benarroch EE. 2008. Suprachiasmatic nucleus and melatonin: Reciprocal interactions and clinical correlations. Neurology. 71(8):594–598. doi:10.1212/01.wnl.0000324283.57261.37.
Bhadra U, Thakkar N, Das P, Pal Bhadra M. 2017. Evolution of circadian rhythms: from bacteria to human. Sleep Med. 35:49–61. doi:10.1016/j.sleep.2017.04.008.
Blackford AN, Jackson SP. 2017. ATM, ATR, and DNA-PK: The Trinity at the Heart of the DNA Damage Response. Elsevier. [accessed 2019 May 6]. http://www.ncbi.nlm.nih.gov/pubmed/28622525.
Bonner WM, Redon CE, Dickey JS, Nakamura AJ, Sedelnikova OA, Solier S, Pommier Y. 2008. γH2AX and cancer. Nat Rev Cancer. 8(12):957–967. doi:10.1038/nrc2523. [accessed 2018 Oct 2]. http://www.ncbi.nlm.nih.gov/pubmed/19005492.
Bozek K, Relógio A, Kielbasa SM, Heine M, Dame C, Kramer A, Herzel H. 2009. Regulation of clock-controlled genes in mammals. PLoS One. 4(3). doi:10.1371/journal.pone.0004882.
Bunger MK, Wilsbacher LD, Moran SM, Clendenin C, Radcliffe LA, Hogenesch JB, Simon MC, Takahashi JS, Bradfield CA. 2000. Mop3 is an essential component of the master circadian pacemaker in mammals. Cell. 103(7):1009–1017. doi:10.1016/S0092-8674(00)00205-1.
Campillos M, Cases I, Hentze MW, Sanchez M. 2010. SIREs: Searching for iron-responsive elements. Nucleic Acids Res. 38(SUPPL. 2):360–367. doi:10.1093/nar/gkq371. [accessed 2019 May 10]. http://www.ncbi.nlm.nih.gov/pubmed/20460462.
Canman CE, Lim DS, Cimprich KA, Taya Y, Tamai K, Sakaguchi K, Appella E, Kastan MB, Siliciano JD. 1998. Activation of the ATM kinase by ionizing radiation and phosphorylation of p53. Science. 281(5383):1677–9. [accessed 2017 Dec 1]. http://www.ncbi.nlm.nih.gov/pubmed/9733515.
Card RT, Brown GM, Valberg LS. 1964. Serum Iron and Iron-Binding Capacity in Normal Subjects. Can Med Assoc J. 90:618–622.
Cardone L. 2005. Circadian Clock Control by SUMOylation of BMAL1. Science (80- ). 309(5739):1390–1394. doi:10.1126/science.1110689.
Carpen JD, Von Schantz M, Smits M, Skene DJ, Archer SN. 2006. A silent polymorphism in the PER1 gene associates with extreme diurnal preference in humans. J Hum Genet. 51(12):1122–1125. doi:10.1007/s10038-006-0060-y. [accessed 2019 May 4]. http://www.ncbi.nlm.nih.gov/pubmed/17051316.
Chaves I, Nijman RM, Biernat MA, Bajek MI, Brand K, da Silva AC, Saito S, Yagita K, Eker APM, van der Horst GTJ. 2011. The potorous cpd photolyase rescues a cryptochrome-deficient mammalian circadian clock. Yamazaki S, editor. PLoS One. 6(8):e23447. doi:10.1371/journal.pone.0023447. [accessed 2018 Feb 9].

51
http://dx.plos.org/10.1371/journal.pone.0023447.
Chehab NH, Malikzay A, Stavridi ES, Halazonetis TD. 2002. Phosphorylation of Ser-20 mediates stabilization of human p53 in response to DNA damage. Proc Natl Acad Sci. 96(24):13777–13782. doi:10.1073/pnas.96.24.13777. [accessed 2019 May 2]. http://www.ncbi.nlm.nih.gov/pubmed/10570149.
Chen SK, Badea TC, Hattar S. 2011. Photoentrainment and pupillary light reflex are mediated by distinct populations of ipRGCs. Nature. 476(7358):92–96. doi:10.1038/nature10206. [accessed 2018 Feb 11]. http://www.nature.com/articles/nature10206.
Cheng Q, Chen J. 2010. Mechanism of p53 stabilization by ATM after DNA damage. Cell Cycle. 9(3):472–8. doi:10.4161/cc.9.3.10556. [accessed 2019 May 6]. http://www.ncbi.nlm.nih.gov/pubmed/20081365.
Chung KW, Chan HSY, Wang BN. 2002. Efficient generation of hyperbolic symmetries from dynamics. Chaos, Solitons and Fractals. 13(6):1175–1190. doi:10.1016/S0960-0779(01)00148-5. [accessed 2017 Dec 1]. http://www.ncbi.nlm.nih.gov/pubmed/9733514.
Chung S, Son GH, Kim K. 2011. Circadian rhythm of adrenal glucocorticoid: Its regulation and clinical implications. Elsevier. [accessed 2018 Feb 16]. https://www.sciencedirect.com/science/article/pii/S0925443911000329#bb0100.
D’Alessandro M, Beesley S, Kim JK, Jones Z, Chen R, Wi J, Kyle K, Vera D, Pagano M, Nowakowski R, et al. 2017. Stability of Wake-Sleep Cycles Requires Robust Degradation of the PERIOD Protein. Curr Biol. 27(22):3454-3467.e8. doi:10.1016/j.cub.2017.10.014. [accessed 2018 Feb 18]. http://www.ncbi.nlm.nih.gov/pubmed/29103939.
Damiola F, Le Minh N, Preitner N, Kornmann B, Fleury-Olela F, Schibler U. 2000. Restricted feeding uncouples circadian oscillators in peripheral tissues from the central pacemaker in the suprachiasmatic nucleus. Genes Dev. 14(23):2950–61. [accessed 2019 May 8]. http://www.ncbi.nlm.nih.gov/pubmed/11114885.
Dev S, Babitt JL. 2017. Overview of iron metabolism in health and disease. Hemodial Int. 21 Suppl 1:S6–S20. doi:10.1111/hdi.12542.
Doi M, Hirayama J, Sassone-Corsi P. 2006. Circadian Regulator CLOCK Is a Histone Acetyltransferase. Cell. 125(3):497–508. doi:10.1016/j.cell.2006.03.033.
Dubocovich ML. 2007. Melatonin receptors: Role on sleep and circadian rhythm regulation. Sleep Med. 8(SUPPL. 3):34–42. doi:10.1016/S1389-9457(07)70130-2.
Dudley CA, Erbel-Sieler C, Estill SJ, Reick M, Franken P, Pitts SN, McKnight SL. 2003. Altered patterns of sleep and behavioral adaptability in NPAS2-deficient mice. Science (80- ). 301(5631):379–383. doi:10.1126/science.1082795. [accessed 2019 May 8]. http://www.ncbi.nlm.nih.gov/pubmed/12843397.
Dumaz N, Milne DM, Meek DW. 1999. Protein kinase CK1 is a p53-threonine 18 kinase which

52
requires prior phosphorylation of serine 15. FEBS Lett. 463(3):312–316. doi:10.1016/S0014-5793(99)01647-6. [accessed 2019 May 6]. http://doi.wiley.com/10.1016/S0014-5793%2899%2901647-6.
Durbin RM, Altshuler DL, Durbin RM, Abecasis GR, Bentley DR, Chakravarti A, Clark AG, Collins FS, De La Vega FM, Donnelly P, et al. 2010. A map of human genome variation from population-scale sequencing. Nature. 467(7319):1061–1073. doi:10.1038/nature09534. [accessed 2019 May 4]. http://www.nature.com/doifinder/10.1038/nature09534.
Eckel-Mahan K, Sassone-Corsi P. 2013. Metabolism and the Circadian Clock Converge. Physiol Rev. 93(1):107–135. doi:10.1152/physrev.00016.2012. [accessed 2019 May 8]. http://www.physiology.org/doi/10.1152/physrev.00016.2012.
Eide E. J., Woolf MF, Kang H, Woolf P, Hurst W, Camacho F, Vielhaber EL, Giovanni A, Virshup DM. 2005. Control of Mammalian Circadian Rhythm by CKI -Regulated Proteasome-Mediated PER2 Degradation. Mol Cell Biol. 25(7):2795–2807. doi:10.1128/MCB.25.7.2795-2807.2005. [accessed 2017 Dec 5]. http://www.ncbi.nlm.nih.gov/pubmed/15767683.
Eide Erik J, Woolf MF, Kang H, Woolf P, Hurst W, Camacho F, Vielhaber EL, Giovanni A, Virshup DM. 2005. Control of Mammalian Circadian Rhythm by CKIε-Regulated Proteasome-Mediated PER2 Degradation. Mol Cell Biol. 25(7):2795–2807. doi:10.1128/MCB.25.7.2795-2807.2005.
Eng GWL, Edison, Virshup DM. 2017. Site-specific phosphorylation of casein kinase 1 δ (CK1δ) regulates its activity towards the circadian regulator PER2. PLoS One. 12(5). doi:10.1371/journal.pone.0177834.
Engelen E, Janssens RC, Yagita K, Smits VAJ, van der Horst GTJ, Tamanini F, Der GTJ Van, Tamanini F. 2013. Mammalian TIMELESS Is Involved in Period Determination and DNA Damage-Dependent Phase Advancing of the Circadian Clock. Bardoni B, editor. PLoS One. 8(2):e56623. doi:10.1371/journal.pone.0056623. [accessed 2018 Feb 9]. http://dx.plos.org/10.1371/journal.pone.0056623.
Epsztejn S, Kakhlon O, Glickstein H, Breuer W, Cabantchik I. 1997. Fluorescence analysis of the labile iron pool of mammalian cells. Anal Biochem. 248(1):31–40.
Fertil B, Malaise EP. 1981. Inherent cellular radiosensitivity as a basic concept for human tumor radiotherapy. Int J Radiat Oncol Biol Phys. 7(5):621–629. doi:10.1016/0360-3016(81)90377-1. [accessed 2019 May 1]. https://www.sciencedirect.com/science/article/pii/0360301681903771.
Forbes EE, Dahl RE, Almeida JRC, Ferrell RE, Nimgaonkar VL, Mansour H, Sciarrillo SR, Holm SM, Rodriguez EE, Phillips ML. 2012. PER2 rs2304672 polymorphism moderates circadian-relevant reward circuitry activity in adolescents. Biol Psychiatry. 71(5):451–457. doi:10.1016/j.biopsych.2011.10.012. [accessed 2019 May 4]. http://www.ncbi.nlm.nih.gov/pubmed/22137505.
Gaddameedhi S, Selby CP, Kaufmann WK, Smart RC, Sancar A. 2011. Control of skin cancer by the circadian rhythm. Proc Natl Acad Sci U S A. 108(46):18790–5.

53
doi:10.1073/pnas.1115249108.
Gallego M, Virshup DM. 2007. Post-translational modifications regulate the ticking of the circadian clock. Nat Rev Mol Cell Biol. 8(2):139–148. doi:10.1038/nrm2106.
Garaulet M, Corbalán-Tutau MD, Madrid JA, Baraza JC, Parnell LD, Lee YC, Ordovas JM. 2010. PERIOD2 Variants Are Associated with Abdominal Obesity, Psycho-Behavioral Factors, and Attrition in the Dietary Treatment of Obesity. J Am Diet Assoc. 110(6):917–921. doi:10.1016/j.jada.2010.03.017. [accessed 2019 May 4]. http://www.ncbi.nlm.nih.gov/pubmed/20497782.
Garcia-Rios A, Perez-Martinez P, Delgado-Lista J, Phillips CM, Gjelstad IMF, Wright JW, Karlström B, Kie´c-Wilk B, van Hees AMJ, Helal O, et al. 2012. A Period 2 Genetic Variant Interacts with Plasma SFA to Modify Plasma Lipid Concentrations in Adults with Metabolic Syndrome. J Nutr. 142(7):1213–1218. doi:10.3945/jn.111.156968. [accessed 2019 May 4]. http://www.ncbi.nlm.nih.gov/pubmed/22623394.
Garufi C, Lévi F, Aschelter AM, Pace R, Giunta S, Nisticó C, Gallà DAP, Silecchia GF, Franchi F, Narduzzi C, et al. 1997. A phase I trial of 5-day chronomodulated infusion of 5-fluorouracil and 1-folinic acid in patients with metastatic colorectal cancer. Eur J Cancer. 33(10):1566–1571. doi:10.1016/S0959-8049(97)00133-0. [accessed 2019 May 5]. https://www.sciencedirect.com/science/article/pii/S0959804997001330.
Ge S, Jung D. 2018 May 4. ShinyGO: a graphical enrichment tool for animals and plants. bioRxiv.:315150. doi:10.1101/315150. [accessed 2019 May 9]. https://europepmc.org/abstract/ppr/ppr13396.
Gekakis N, Staknis D, Nguyen HB, Davis FC, Wilsbacher LD, King DP, Takahashi JS, Weitz CJ, Wilsbacner LD, King DP, et al. 1998. Role of the CLOCK Protein in the Mammalian Circadian Mechanism. Science (80- ). 280(5369):1564–1569. doi:10.1126/science.280.5369.1564. [accessed 2018 Feb 9]. http://www.sciencemag.org/cgi/doi/10.1126/science.280.5369.1564.
Gery S, Komatsu N, Baldjyan L, Yu A, Koo D, Koeffler HP. 2006. The Circadian Gene Per1 Plays an Important Role in Cell Growth and DNA Damage Control in Human Cancer Cells. Mol Cell. 22(3):375–382. doi:10.1016/j.molcel.2006.03.038. [accessed 2016 Nov 23]. http://www.ncbi.nlm.nih.gov/pubmed/16678109.
Gilliland G, Berman HM, Weissig H, Shindyalov IN, Westbrook J, Bourne PE, Bhat TN, Feng Z. 2000. The Protein Data Bank. Nucleic Acids Res. 28(1):235–242. doi:10.1093/nar/28.1.235.
Gorbacheva VY, Kondratov R V, Zhang R, Cherukuri S, Gudkov A V, Takahashi JS, Antoch MP. 2005. Circadian sensitivity to the chemotherapeutic agent cyclophosphamide depends on the functional status of the CLOCK/BMAL1 transactivation complex. Proc Natl Acad Sci U S A. 102(9):3407–3412. doi:10.1073/pnas.0409897102. [accessed 2018 Feb 10]. http://www.pnas.org/content/pnas/102/9/3407.full.pdf.
Gotoh T, Kim JK, Liu J, Vila-Caballer M, Stauffer PE, Tyson JJ, Finkielstein C V. 2016. Model-

54
driven experimental approach reveals the complex regulatory distribution of p53 by the circadian factor Period 2. Proc Natl Acad Sci U S A. 113(47):13516–13521. doi:10.1073/pnas.1607984113.
Gotoh T, Vila-Caballer M, Liu J, Schiffhauer S, Finkielstein C V. 2015. Association of the circadian factor Period 2 to p53 influences p53’s function in DNA-damage signaling. Mol Biol Cell. 26(2):359–372. doi:10.1091/mbc.E14-05-0994. [accessed 2018 Feb 13]. http://www.ncbi.nlm.nih.gov/pubmed/25411341.
Gotoh T, Vila-Caballer M, Santos CS, Liu J, Yang J, Finkielstein C V. 2014. The circadian factor Period 2 modulates p53 stability and transcriptional activity in unstressed cells. Mol Biol Cell. 25(19):3081–93. doi:10.1091/mbc.E14-05-0993. [accessed 2018 Feb 13]. http://www.molbiolcell.org/content/25/19/3081.long.
Gotter AL. 2006. A Timeless debate: Resolving TIM’s noncircadian roles with possible clock function. Neuroreport. 17(12):1229–1233. doi:10.1097/01.wnr.0000233092.90160.92.
Grant DF, Bessho T, Reardon JT. 1998. Nucleotide excision repair of melphalan monoadducts. Cancer Res. 58(22):5196–5200. [accessed 2018 Feb 10]. http://cancerres.aacrjournals.org/content/canres/58/22/5196.full.pdf.
Grimaldi B, Nakahata Y, Sahar S, Kaluzova M, Gauthier D, Pham K, Patel N, Hirayama J, Sassone-Corsi P. 2007. Chromatin remodeling and circadian control: Master regulator CLOCK is an enzyme. In: Cold Spring Harbor Symposia on Quantitative Biology. Vol. 72. p. 105–112.
Guillaumond F, Dardente H, Giguère V, Cermakian N. 2005. Differential control of Bmal1 circadian transcription by REV-ERB and ROR nuclear receptors. J Biol Rhythms. 20(5):391–403. doi:10.1177/0748730405277232. [accessed 2018 Feb 17]. http://journals.sagepub.com/doi/10.1177/0748730405277232.
Guo X, Kesimer M, Tolun G, Zheng X, Xu Q, Lu J, Sheehan JK, Griffith JD, Li X. 2012. The NAD+-dependent protein deacetylase activity of SIRT1 is regulated by its oligomeric status. Sci Rep. 2(1):640. doi:10.1038/srep00640. [accessed 2018 Feb 17]. http://www.nature.com/articles/srep00640.
Hamosh A, King TM, Rosenstein BJ, Corey M, Levison H, Durie P, Tsui LC, McIntosh I, Keston M, Brock DJ, et al. 1992. Cystic fibrosis patients bearing both the common missense mutation Gly----Asp at codon 551 and the delta F508 mutation are clinically indistinguishable from delta F508 homozygotes, except for decreased risk of meconium ileus. Am J Hum Genet. 51(2):245–50. [accessed 2019 May 4]. http://www.ncbi.nlm.nih.gov/pubmed/1379413.
Han YH, Moon HJ, You BR, Park WH. 2009. The effect of MG132, a proteasome inhibitor on HeLa cells in relation to cell growth, reactive oxygen species and GSH. Oncol Rep. 22(1):215–221. doi:10.3892/or_00000427. [accessed 2019 May 6]. http://www.spandidos-publications.com/or/22/1/215.
Hankins MW, Peirson SN, Foster RG. 2008. Melanopsin: an exciting photopigment. Trends Neurosci. 31(1):27–36. doi:10.1016/j.tins.2007.11.002.

55
Harrison C. 2012. Anticancer drugs: Reactivating p53 tumour suppressor function. Nat Rev Drug Discov. 11(9):674. [accessed 2018 Feb 19]. http://dx.doi.org/10.1038/nrd3834.
Hattar S, Lucas RJ, Mrosovsky N, Thompson S, Douglas RH, Hankins MW, Lemk J, Biel{ M, Hofmann# F, Foster RG, et al. 2003. Melanopsin and rod–cone photoreceptive systems account for all major accessory visual functions in mice. Nature. 424.
Hayasaka N, Hirano A, Miyoshi Y, Tokuda IT, Yoshitane H, Matsuda J, Fukada Y. 2017. Salt-inducible kinase 3 regulates the mammalian circadian clock by destabilizing PER2 protein. Elife. 6:1–35. doi:10.7554/eLife.24779. [accessed 2018 Feb 17]. https://elifesciences.org/articles/24779.
Hennig S, Strauss HM, Vanselow K, Yildiz Ö, Schulze S, Arens J, Kramer A, Wolf E. 2009. Structural and functional analyses of PAS domain interactions of the clock proteins Drosophila PERIOD and mouse period2. Egli M, editor. PLoS Biol. 7(4):0836–0853. doi:10.1371/journal.pbio.1000094. [accessed 2018 Feb 16]. http://www.ncbi.nlm.nih.gov/pubmed/19402751.
Hirayama J, Sahar S, Grimaldi B, Tamaru T, Takamatsu K, Nakahata Y, Sassone-Corsi P. 2007. CLOCK-mediated acetylation of BMAL1 controls circadian function. Nature. 450(7172):1086–1090. doi:10.1038/nature06394.
Van Der Horst GTJ, Muijtjens M, Kobayashi K, Takano R, Kanno SI, Takao M, De Wit J, Verkerk A, Eker APM, Van Leenen D, et al. 1999. Mammalian Cry1 and Cry2 are essential for maintenance of circadian rhythms. Nature. 398(6728):627–630. doi:10.1038/19323.
Hughes ME, Hogenesch JB, Kornacker K. 2010. JTK-CYCLE: An efficient nonparametric algorithm for detecting rhythmic components in genome-scale data sets. J Biol Rhythms. 25(5):372–380. doi:10.1177/0748730410379711.
Iitaka C, Miyazaki K, Akaike T, Ishida N. 2005. A role for glycogen synthase kinase-3beta in the mammalian circadian clock. J Biol Chem. 280(33):29397–402. doi:10.1074/jbc.M503526200. [accessed 2017 May 1]. http://www.jbc.org/lookup/doi/10.1074/jbc.M503526200%5Cnhttp://www.ncbi.nlm.nih.gov/pubmed/15972822.
Ingram VM. 1956. A specific chemical difference between the globins of normal human and sickle-cell anaemia haemoglobin. Nature. 178(4537):792–4. [accessed 2019 May 4]. http://www.ncbi.nlm.nih.gov/pubmed/13369537.
Isojima Y, Nakajima M, Ukai H, Fujishima H, Yamada RG, Masumoto K -h. KK -h., Kiuchi R, Ishida M, Ukai-Tadenuma M, Minami Y, et al. 2009. CKIepsilon/delta-dependent phosphorylation is a temperature-insensitive, period-determining process in the mammalian circadian clock. Proc Natl Acad Sci U S A. 106(37):15744–9. doi:10.1073/pnas.0908733106. [accessed 2017 Dec 5]. http://www.ncbi.nlm.nih.gov/pubmed/19805222.
Jiang K, Pereira E, Maxfield M, Russell B, Goudelock DM, Sanchez Y. 2003. Regulation of Chk1 Includes Chromatin Association and 14-3-3 Binding following Phosphorylation on Ser-
56
345. J Biol Chem. 278(27):25207–25217. doi:10.1074/jbc.M300070200. [accessed 2019 May 1]. http://www.ncbi.nlm.nih.gov/pubmed/12676962.
Jones CR, Campbell SS, Zone SE, Cooper F, Desano A, Murphy PJ, Jones B, Czajkowski L, Ptáček LJ. 1999. Familial advanced sleep-phase syndrome: A short-period circadian rhythm variant in humans. Nat Med. 5(9):1062–1065. doi:10.1038/12502. [accessed 2018 Feb 13]. http://www.ncbi.nlm.nih.gov/pubmed/10470086.
Jones SE, Lane JM, Wood AR, van Hees VT, Tyrrell J, Beaumont RN, Jeffries AR, Dashti HS, Hillsdon M, Ruth KS, et al. 2019. Genome-wide association analyses of chronotype in 697,828 individuals provides insights into circadian rhythms. Nat Commun. 10(1):343. doi:10.1038/s41467-018-08259-7. [accessed 2019 May 7]. http://www.nature.com/articles/s41467-018-08259-7.
Jung-Hynes B, Schmit TL, Reagan-Shaw SR, Siddiqui IA, Mukhtar H, Ahmad N. 2011. Melatonin, a novel Sirt1 inhibitor, imparts antiproliferative effects against prostate cancer in vitro in culture and in vivo in TRAMP model. J Pineal Res. 50(2):140–149. doi:10.1111/j.1600-079X.2010.00823.x.
Kaasik K, Lee CC. 2004. Reciprocal regulation of haem biosynthesis and the circadian clock in mammals. Nature. 430(6998):467–471. doi:10.1038/nature02724. [accessed 2019 May 8]. http://www.ncbi.nlm.nih.gov/pubmed/15269772.
Kalhan SC, Ghosh A. 2015. Dietary iron, circadian clock, and hepatic gluconeogenesis. Diabetes. 64(4):1091–1093. doi:10.2337/db14-1697. [accessed 2019 May 8]. http://www.ncbi.nlm.nih.gov/pubmed/25805759.
Kalsbeek A, Perreau-Lenz S, Buijs RM. 2006. A network of (autonomic) clock outputs. Chronobiol Int. 23(3):521–535. doi:10.1080/07420520600651073. [accessed 2018 Feb 11]. http://ifc.unam.mx/pages/curso_ritmos/capitulo9/Kalsbeek_2006.pdf.
Kang T-H, Reardon JT, Kemp M, Sancar A. 2009. Circadian oscillation of nucleotide excision repair in mammalian brain. Proc Natl Acad Sci U S A. 106(8):2864–2867. doi:10.1073/pnas.0812638106.
Kautz L, Meynard D, Monnier A, Darnaud V, Bouvet R, Wang R-HHRH, Deng C, Vaulont S, Mosser J, Coppin H, et al. 2008. Iron regulates phosphorylation of Smad1/5/8 and gene expression of Bmp6, Smad7, Id1, and Atoh8 in the mouse liver. Blood. 112(4):1503–1509. doi:10.1182/blood-2008-03-143354.
King DP, Zhao Y, Sangoram AM, Wilsbacher LD, Tanaka M, Antoch MP, Steeves TDL, Vitaterna MH, Kornhauser JM, Lowrey PL, et al. 1997. Positional cloning of the mouse circadian Clock gene. Cell. 89(4):641–653. doi:10.1016/S0092-8674(00)80245-7.
Kohsaka A, Laposky AD, Ramsey KM, Estrada C, Joshu C, Kobayashi Y, Turek FW, Bass J. 2007. High-Fat Diet Disrupts Behavioral and Molecular Circadian Rhythms in Mice. Cell Metab. 6(5):414–421. doi:10.1016/j.cmet.2007.09.006. [accessed 2019 May 8]. http://www.ncbi.nlm.nih.gov/pubmed/17983587.

57
Kondratov R V., Kondratova AA, Lee C, Gorbacheva VY, Chernov M V., Antoch MP. 2006. Post-translational regulation of circadian transcriptional CLOCK(NPAS2)/BMAL1 complex by CRYPTOCHROMES. Cell Cycle. 5(8):890–895. doi:10.4161/cc.5.8.2684.
Konijn AM, Glickstein H, Vaisman B, Meyron-Holtz EG, Slotki IN, Cabantchik ZI. 1999. The cellular labile iron pool and intracellular ferritin in K562 cells. Blood. 94(6):2128–2134.
Kriebs A, Jordan SD, Soto E, Henriksson E, Sandate CR, Vaughan ME, Chan AB, Duglan D, Papp SJ, Huber AL, et al. 2017. Circadian repressors CRY1 and CRY2 broadly interact with nuclear receptors and modulate transcriptional activity. Proc Natl Acad Sci U S A. 114(33):8776–8781. doi:10.1073/pnas.1704955114.
Kripke DF, Nievergelt CM, Joo EJ, Shekhtman T, Kelsoe JR. 2009. Circadian polymorphisms associated with affective disorders. J Circadian Rhythms. 7(0):2. doi:10.1186/1740-3391-7-2. [accessed 2019 May 4]. http://www.ncbi.nlm.nih.gov/pubmed/19166596.
Kuo LJ, Yang L-X. 2008. Gamma-H2AX - a novel biomarker for DNA double-strand breaks. In Vivo. 22(3):305–9. [accessed 2019 May 1]. http://www.ncbi.nlm.nih.gov/pubmed/18610740.
Langmesser S, Tallone T, Bordon A, Rusconi S, Albrecht U. 2008. Interaction of circadian clock proteins PER2 and CRY with BMAL1 and CLOCK. BMC Mol Biol. 9. doi:10.1186/1471-2199-9-41.
Laposky AD, Bass J, Kohsaka A, Turek FW. 2008. Sleep and circadian rhythms: Key components in the regulation of energy metabolism. FEBS Lett. 582(1):142–151. doi:10.1016/j.febslet.2007.06.079. [accessed 2019 May 8]. http://www.ncbi.nlm.nih.gov/pubmed/17707819.
Lau A, Swinbank KM, Ahmed PS, Taylor DL, Jackson SP, Smith GCM, O’Connor MJ. 2005. Suppression of HIV-1 infection by a small molecule inhibitor of the ATM kinase. Nat Cell Biol. 7(5):493–500. doi:10.1038/ncb1250. [accessed 2019 May 6]. http://www.nature.com/articles/ncb1250.
Lavebratt C, Sjöholm LK, Partonen T, Schalling M, Forsell Y. 2010. PER2 variantion is associated with depression vulnerability. Am J Med Genet Part B Neuropsychiatr Genet. 153(2):570–581. doi:10.1002/ajmg.b.31021. [accessed 2019 May 4]. http://doi.wiley.com/10.1002/ajmg.b.31021.
Lee H, Chen R, Lee Y, Yoo S, Lee C. 2009. Essential roles of CKIdelta and CKIepsilon in the mammalian circadian clock. Proc Natl Acad Sci U S A. 106(50):21359–21364. doi:10.1073/pnas.0906651106. [accessed 2018 Feb 17]. https://www.ncbi.nlm.nih.gov/pubmed/19948962.
Lee HJ, Kim L, Kang SG, Yoon HK, Choi JE, Park YM, Kim SJ, Kripke DF. 2011. PER2 variation is associated with diurnal preference in a Korean young population. Behav Genet. 41(2):273–277. doi:10.1007/s10519-010-9396-3. [accessed 2019 May 4]. http://www.ncbi.nlm.nih.gov/pubmed/20931356.

58
Lévi F. 2001. Circadian chronotherapy for human cancers. Lancet Oncol. 2(5):307–315. doi:10.1016/S1470-2045(00)00326-0. [accessed 2019 May 5]. https://www.sciencedirect.com/science/article/pii/S1470204500003260?via%3Dihub#bib24.
Lévi F, Giacchetti S, Adam R, Zidani R, Metzger G, Misset J-L. 1995. Chronomodulation of chemotherapy against metastatic colorectal cancer. Eur J Cancer. 31(7–8):1264–1270. doi:10.1016/0959-8049(95)00242-B. [accessed 2019 May 5]. https://www.sciencedirect.com/science/article/pii/095980499500242B.
Li S, Shui K, Zhang Y, Lv Y, Deng W, Ullah S, Zhang L, Xue Y. 2017. CGDB: A database of circadian genes in eukaryotes. Nucleic Acids Res. 45(D1):D397–D403. doi:10.1093/nar/gkw1028. [accessed 2019 Mar 14]. https://academic.oup.com/nar/article-lookup/doi/10.1093/nar/gkw1028.
Liang Y, Lin SY, Brunicardi FC, Goss J, Li K. 2009. DNA damage response pathways in tumor suppression and cancer treatment. World J Surg. 33(4):661–666. doi:10.1007/s00268-008-9840-1. [accessed 2018 Feb 18]. http://link.springer.com/10.1007/s00268-008-9840-1.
Liu JJ, Zou X, Gotoh T, Brown AM, Jiang L, Wisdom EL, Kyoung Kim J, Finkielstein C V. 2018. Distinct control of PERIOD2 degradation and circadian rhythms by the oncoprotein and ubiquitin ligase MDM2. Sci Signal. 11(556):1–18. doi:10.1126/scisignal.aau0715. [accessed 2018 Dec 7]. http://www.ncbi.nlm.nih.gov/pubmed/30425162.
Liu X, Wilcken R, Joerger AC, Chuckowree IS, Amin J, Spencer J, Fersht AR. 2013. Small molecule induced reactivation of mutant p53 in cancer cells. Nucleic Acids Res. 41(12):6034–6044. doi:10.1093/nar/gkt305.
Longo VD, Panda S. 2016. Fasting, Circadian Rhythms, and Time-Restricted Feeding in Healthy Lifespan. Cell Metab. 23(6):1048–1059. doi:10.1016/j.cmet.2016.06.001. [accessed 2019 May 8]. http://www.ncbi.nlm.nih.gov/pubmed/27304506.
Maier B, Wendt S, Vanselow JT, Wallach T, Reischl S, Oehmke S, Schlosser A, Kramer A. 2009. A large-scale functional RNAi screen reveals a role for CK2 in the mammalian circadian clock. Genes Dev. 23(6):708–718. doi:10.1101/gad.512209.
Marcheva B, Ramsey KM, Buhr ED, Kobayashi Y, Su H, Ko CH, Ivanova G, Omura C, Mo S, Vitaterna MH, et al. 2010. Disruption of the clock components CLOCK and BMAL1 leads to hypoinsulinaemia and diabetes. Nature. 466(7306):627–631. doi:10.1038/nature09253. [accessed 2019 May 8]. http://www.ncbi.nlm.nih.gov/pubmed/20562852.
Matsuoka S, Ballif BA, Smogorzewska A, McDonald ER, Hurov KE, Luo J, Bakalarski CE, Zhao Z, Solimini N, Lerenthal Y, et al. 2007. ATM and ATR substrate analysis reveals extensive protein networks responsive to DNA damage. Science (80- ). 316(5828):1160–1166. doi:10.1126/science.1140321. [accessed 2017 Dec 5]. http://www.ncbi.nlm.nih.gov/pubmed/17525332.
Matsuoka S, Rotman G, Ogawa A, Shiloh Y, Tamai K, Elledge SJ. 2000. Ataxia telangiectasia-mutated phosphorylates Chk2 in vivo and in vitro. Proc Natl Acad Sci. 97(19):10389–10394.

59
doi:10.1073/pnas.190030497. [accessed 2017 Dec 1]. http://www.pnas.org/content/97/19/10389.full.pdf.
Maywood ES, Chesham JE, Meng Q-JQ-J, Nolan PM, Loudon ASI, Hastings MH. 2011. Tuning the Period of the Mammalian Circadian Clock: Additive and Independent Effects of CK1 Tau and Fbxl3Afh Mutations on Mouse Circadian Behavior and Molecular Pacemaking. J Neurosci. 31(4):1539–1544. doi:10.1523/JNEUROSCI.4107-10.2011. [accessed 2018 Feb 18]. http://www.ncbi.nlm.nih.gov/pubmed/21273438.
Mehta K, Busbridge M, Renshaw D, Evans RW, Farnaud S, Patel VB. 2016. Characterization of hepcidin response to holotransferrin in novel recombinant TfR1 HepG2 cells. Blood Cells Mol Dis. 61:37–45. doi:10.1016/j.bcmd.2016.06.008.
Mei Q, Dvornyk V. 2015. Evolutionary history of the photolyase/cryptochrome superfamily in eukaryotes. PLoS One. 10(9). doi:10.1371/journal.pone.0135940. [accessed 2018 Feb 12]. http://journals.plos.org/plosone/article/file?id=10.1371/journal.pone.0135940&type=printable.
Mendoza J. 2007. Circadian clocks: Setting time by food. J Neuroendocrinol. 19(2):127–137. doi:10.1111/j.1365-2826.2006.01510.x. [accessed 2019 May 8]. http://doi.wiley.com/10.1111/j.1365-2826.2006.01510.x.
Meng QJ, Logunova L, Maywood ES, Gallego M, Lebiecki J, Brown TM, Sládek M, Semikhodskii AS, Glossop NRJ, Piggins HD, et al. 2008. Setting Clock Speed in Mammals: The CK1ε tau Mutation in Mice Accelerates Circadian Pacemakers by Selectively Destabilizing PERIOD Proteins. Neuron. 58(1):78–88. doi:10.1016/j.neuron.2008.01.019.
Militi S, Maywood ES, Sandate CR, Chesham JE, Barnard AR, Parsons MJ, Vibert JL, Joynson GM, Partch CL, Hastings MH, et al. 2016. Early doors ( Edo ) mutant mouse reveals the importance of period 2 (PER2) PAS domain structure for circadian pacemaking. Proc Natl Acad Sci. 113(10):2756–2761. doi:10.1073/pnas.1517549113. [accessed 2018 Feb 16]. http://www.ncbi.nlm.nih.gov/pubmed/26903623.
Miyazaki K, Mesaki M, Ishida N. 2001. Nuclear entry mechanism of rat PER2 (rPER2): role of rPER2 in nuclear localization of CRY protein. Mol Cell Biol. 21(19):6651–9. doi:10.1128/MCB.21.19.6651-6659.2001. [accessed 2018 Feb 18]. http://www.ncbi.nlm.nih.gov/pubmed/11533252.
Muckenthaler MU, Rivella S, Hentze MW, Galy B. 2017. A Red Carpet for Iron Metabolism. Cell. 168(3):344–361. doi:10.1016/j.cell.2016.12.034.
Neves J V, Caldas C, Vieira I, Ramos MF, Rodrigues PN. 2015. Multiple Hepcidins in a Teleost Fish, Dicentrarchus labrax: Different Hepcidins for Different Roles. J Immunol. 195(6):2696–2709. doi:10.4049/jimmunol.1501153.
O. Shaul MVM and DI. 1996. Cell Cycle Control.
Ohsaki K, Oishi K, Kozono Y, Nakayama KKI, Nakayama KKI, Ishida N. 2008. The role of β-TrCP1 and β-TrCP2 in circadian rhythm generation by mediating degradation of clock protein

60
PER2. J Biochem. 144(5):609–618. doi:10.1093/jb/mvn112. [accessed 2018 Feb 18]. https://academic.oup.com/jb/article-lookup/doi/10.1093/jb/mvn112.
Oklejewicz M, Destici E, Tamanini F, Hut RA, Janssens R, van der Horst GTJJ. 2008. Phase resetting of the mammalian circadian clock by DNA damage. Curr Biol. 18(4):286–291. doi:10.1016/j.cub.2008.01.047. [accessed 2017 Aug 15]. http://linkinghub.elsevier.com/retrieve/pii/S0960982208000948.
van Ooijen G, Millar AJ. 2012. Non-transcriptional oscillators in circadian timekeeping. Trends Biochem Sci. 37(11):484–492. doi:10.1016/j.tibs.2012.07.006.
Papp SJ, Huber A-LL, Jordan SD, Kriebs A, Nguyen M, Moresco JJ, Yates JR, Lamia KA, Landais S, Kodama Y, et al. 2015. DNA damage shifts circadian clock time via hausp-dependent cry1 stabilization. Elife. 2015(4):1–19. doi:10.7554/eLife.04883.001. [accessed 2017 Apr 25]. http://www.ncbi.nlm.nih.gov/pubmed/25756610.
Peek CB, Ramsey KM, Marcheva B, Bass J. 2012. Nutrient sensing and the circadian clock. Trends Endocrinol Metab. 23(7):312–318. doi:10.1016/j.tem.2012.02.003. [accessed 2019 May 8]. http://www.ncbi.nlm.nih.gov/pubmed/22424658.
Peeples L. 2018. Medicine’s secret ingredient — it’s in the timing. Nature. 556(7701):290–292. doi:10.1038/d41586-018-04600-8. [accessed 2019 May 5]. http://www.nature.com/articles/d41586-018-04600-8.
Preitner N, Damiola F, Lopez-Molina L, Zakany J, Duboule D, Albrecht U, Schibler U, Luis-Lopez-Molina, Zakany J, Duboule D, et al. 2002. The orphan nuclear receptor REV-ERBα controls circadian transcription within the positive limb of the mammalian circadian oscillator. Cell. 110(2):251–260. doi:10.1016/S0092-8674(02)00825-5. [accessed 2016 Oct 19]. http://www.ncbi.nlm.nih.gov/entrez/query.fcgi?db=pubmed&cmd=Retrieve&dopt=AbstractPlus&list_uids=12150932%5Cnpapers2://publication/uuid/16C515BE-60EF-4007-9A95-BB02F01AFA18.
Prieto LP, U. ALBRECHT, A. BORDON, I. SCHMUTZ AJR. 2007. The Multiple Facets of Per2. LXXII.
Ptitsyn AA, Gimble JM. 2011. True or false: All genes are rhythmic. Ann Med. 43(1):1–12. doi:10.3109/07853890.2010.538078.
Purvis JE, Karhohs KW, Mock C, Batchelor E, Loewer A, Lahav G. 2012. p53 dynamics control cell fate. Science (80- ). 336(6087):1440–1444. doi:10.1126/science.1218351.
Qin X, Mori T, Zhang Y, Johnson CH. 2015. PER2 Differentially Regulates Clock Phosphorylation versus Transcription by Reciprocal Switching of CK1ε Activity. J Biol Rhythms. 30(3):206–16. doi:10.1177/0748730415582127.
Raghuram S, Stayrook KR, Huang P, Rogers PM, Nosie AK, McClure DB, Burris LL, Khorasanizadeh S, Burris TP, Rastinejad F. 2007. Identification of heme as the ligand for the orphan nuclear receptors REV-ERBα and REV-ERBβ. Nat Struct Mol Biol. 14(12):1207–1213.

61
doi:10.1038/nsmb1344. [accessed 2019 May 8]. http://www.ncbi.nlm.nih.gov/pubmed/18037887.
Ralph MR, Menaker M. 1988. A mutation of the circadian system in golden hamsters. Science. 241(4870):1225–7. [accessed 2019 May 1]. http://www.ncbi.nlm.nih.gov/pubmed/3413487.
Ramey G, Deschemin JC, Durel B, Canonne-Hergaux F, Nicolas G, Vaulont S. 2010. Hepcidin targets ferroportin for degradation in hepatocytes. Haematologica. 95(3):501–504. doi:10.3324/haematol.2009.014399.
Räschle M, Knipsheer P, Enoiu M, Angelov T, Sun J, Griffith JD, Ellenberger TE, Schärer OD, Walter JC. 2008. Mechanism of Replication-Coupled DNA Interstrand Crosslink Repair. Cell. 134(6):969–980. doi:10.1016/j.cell.2008.08.030. [accessed 2018 Feb 11]. http://www.cell.com/cell/pdf/S0092-8674(08)01075-1.pdf.
Recalcati S, Minotti G, Cairo G. 2010. Iron regulatory proteins: from molecular mechanisms to drug development. Antioxid Redox Signal. 13(10):1593–1616. doi:10.1089/ars.2009.2983.
Reppert SM, Weaver DR. 2002. Coordination of circadian timing in mammals. Nature. 418(6901):935–41. doi:10.1038/nature00965.
Ribas-Latre A, Eckel-Mahan K. 2016. Interdependence of nutrient metabolism and the circadian clock system: Importance for metabolic health. Mol Metab. 5(3):133–152. doi:10.1016/j.molmet.2015.12.006. [accessed 2019 May 8]. http://www.ncbi.nlm.nih.gov/pubmed/26977390.
Rivers A, Gietzen KF, Vielhaber E, Virshup DM. 1998. Regulation of casein kinase I epsilon and casein kinase I delta by an in vivo futile phosphorylation cycle. J Biol Chem. 273(26):15980–15984. doi:10.1074/jbc.273.26.15980.
Rizk A, Paul G, Incardona P, Bugarski M, Mansouri M, Niemann A, Ziegler U, Berger P, Sbalzarini IF. 2014. Segmentation and quantification of subcellular structures in fluorescence microscopy images using Squassh. Nat Protoc. 9(3):586–96. doi:10.1038/nprot.2014.037. [accessed 2018 Dec 10]. http://www.nature.com/articles/nprot.2014.037.
Rouse J, Jackson SP. 2002. Interfaces between the detection, signaling, and repair of DNA damage. Science (80- ). 297(5581):547–551. doi:10.1126/science.1074740. [accessed 2018 Dec 7]. http://www.ncbi.nlm.nih.gov/pubmed/12142523.
Saini C, Liani A, Curie T, Gos P, Kreppel F, Emmenegger Y, Bonacina L, Wolf JP, Poget YA, Franken P, et al. 2013. Real-time recording of circadian liver gene expression in freely moving mice reveals the phase-setting behavior of hepatocyte clocks. Genes Dev. 27(13):1526–1536. doi:10.1101/gad.221374.113. [accessed 2019 May 8]. http://www.ncbi.nlm.nih.gov/pubmed/23824542.
Sangoram AM, Saez L, Antoch MP, Gekakis N, Staknis D, Whiteley A, Fruechte EM, Vitaterna MH, Shimomura K, King DP, et al. 1998. Mammalian circadian autoregulatory loop: A timeless ortholog and mPer1 interact and negatively regulate CLOCK-BMAL1-induced transcription.

62
Neuron. 21(5):1101–1113. doi:10.1016/S0896-6273(00)80627-3.
Sato TK, Panda S, Miraglia LJ, Reyes TM, Rudic RD, McNamara P, Naik KA, FitzGerald GA, Kay SA, Hogenesch JB. 2004. A functional genomics strategy reveals Rora as a component of the mammalian circadian clock. Neuron. 43(4):527–537. doi:10.1016/j.neuron.2004.07.018. [accessed 2018 Feb 17]. https://www.sciencedirect.com/science/article/pii/S089662730400460X.
Scheer FAJL, Hilton MF, Mantzoros CS, Shea SA. 2009. Adverse metabolic and cardiovascular consequences of circadian misalignment. Proc Natl Acad Sci U S A. 106(11):4453–4458. doi:10.1073/pnas.0808180106. [accessed 2019 May 8]. http://www.ncbi.nlm.nih.gov/pubmed/19255424.
Schlosser A, Vanselow JT, Kramer A. 2005. Mapping of phosphorylation sites by a multi-protease approach with specific phosphopeptide enrichment and NanoLC-MS/MS analysis. Anal Chem. 77(16):5243–5250. doi:10.1021/ac050232m. [accessed 2018 Feb 17]. https://pubs.acs.org/doi/pdf/10.1021/ac050232m.
Schmalen I, Reischl S, Wallach T, Klemz R, Grudziecki A, Prabu JR, Benda C, Kramer A, Wolf E. 2014. Interaction of circadian clock proteins CRY1 and PER2 is modulated by zinc binding and disulfide bond formation. Cell. 157(5):1203–1215. doi:10.1016/j.cell.2014.03.057. [accessed 2018 Feb 16]. https://www.sciencedirect.com/science/article/pii/S0092867414005352?_rdoc=1&_fmt=high&_origin=gateway&_docanchor=&md5=b8429449ccfc9c30159a5f9aeaa92ffb.
Schmutz I, Wendt S, Schnell A, Kramer A, Mansuy IM, Albrecht U. 2011. Protein Phosphatase 1 (PP1) is a post-translational regulator of the Mammalian Circadian Clock. PLoS One. 6(6). doi:10.1371/journal.pone.0021325. [accessed 2018 Feb 11]. http://www.unifr.ch/biology/assets/files/albrecht/schmutz2011.pdf.
Service RF. 2016 Oct 5. This protein is mutated in half of all cancers. New drugs aim to fix it before it’s too late. Science (80- ).:1–7. doi:10.1126/science.aah7382. [accessed 2018 Feb 19]. http://www.sciencemag.org/news/2016/10/protein-mutated-half-all-cancers-new-drugs-aim-fix-it-it-s-too-late.
Shanmugam V, Wafi A, Al-Taweel N, Büsselberg D. 2013. Disruption of circadian rhythm increases the risk of cancer, metabolic syndrome and cardiovascular disease. J Local Glob Heal Sci. 2013(1).
Shanware NP, Hutchinson JA, Kim SH, Zhan L, Bowler MJ, Tibbetts RS. 2011. Casein kinase 1-dependent phosphorylation of familial advanced sleep phase syndrome-associated residues controls PERIOD 2 stability. J Biol Chem. 286(14):12766–12774. doi:10.1074/jbc.M111.224014. [accessed 2017 Dec 5]. http://www.ncbi.nlm.nih.gov/pubmed/21324900.
Shi G, Xing L, Liu Z, Qu Z, Wu X, Dong Z, Wang X, Gao X, Huang M, Yan J, et al. 2013. Dual roles of FBXL3 in the mammalian circadian feedback loops are important for period determination and robustness of the clock. Proc Natl Acad Sci U S A. 110(12):4750–5. doi:10.1073/pnas.1302560110.

63
Shieh SY, Ikeda M, Taya Y, Prives C. 1997. DNA damage-induced phosphorylation of p53 alleviates inhibition by MDM2. Cell. 91(3):325–34. [accessed 2019 May 1]. http://www.ncbi.nlm.nih.gov/pubmed/9363941.
Siepka SM, Yoo SH, Park J, Song W, Kumar V, Hu Y, Lee C, Takahashi JS. 2007. Circadian Mutant Overtime Reveals F-box Protein FBXL3 Regulation of Cryptochrome and Period Gene Expression. Cell. 129(5):1011–1023. doi:10.1016/j.cell.2007.04.030.
Silver R, LeSauter J, Tresco PA, Lehman MN. 1996. A diffusible coupling signal from the transplanted suprachiasmatic nucleus controlling circadian locomotor rhythms. Nature. 382(6594):810–813. doi:10.1038/382810a0. [accessed 2018 Feb 11]. https://www.nature.com/articles/382810a0.pdf.
Slominski RM, Reiter RJ, Schlabritz-Loutsevitch N, Ostrom RS, Slominski AT. 2012. Melatonin membrane receptors in peripheral tissues: Distribution and functions. Mol Cell Endocrinol. 351(2):152–166. doi:10.1016/j.mce.2012.01.004. [accessed 2018 Feb 17]. http://www.ncbi.nlm.nih.gov/pubmed/22245784.
Smith CL, Blake JA, Kadin JA, Richardson JE, Bult CJ, Mouse Genome Database Group. 2018. Mouse Genome Database (MGD)-2018: knowledgebase for the laboratory mouse. Nucleic Acids Res. 46(D1):D836–D842. doi:10.1093/nar/gkx1006. [accessed 2019 May 4]. http://www.ncbi.nlm.nih.gov/pubmed/29092072.
Smyllie NJ, Pilorz V, Boyd J, Meng QJ, Saer B, Chesham JE, Maywood ES, Krogager TP, Spiller DG, Boot-Handford R, et al. 2016. Visualizing and Quantifying Intracellular Behavior and Abundance of the Core Circadian Clock Protein PERIOD2. Curr Biol. 26(14):1880–1886. doi:10.1016/j.cub.2016.05.018.
So AY-L, Bernal TU, Pillsbury ML, Yamamoto KR, Feldman BJ. 2009. Glucocorticoid regulation of the circadian clock modulates glucose homeostasis. Proc Natl Acad Sci. 106(41):17582–17587. doi:10.1073/pnas.0909733106. [accessed 2017 Oct 9]. http://www.pnas.org/content/106/41/17582.full.pdf?with-ds=yes.
Solt LA, Burris TP. 2012. Action of RORs and their ligands in (patho)physiology. Trends Endocrinol Metab. 23:573–581. doi:10.1016/j.tem.2012.05.012. [accessed 2017 Aug 17]. http://www.cell.com/trends/endocrinology-metabolism/pdf/S1043-2760(12)00092-6.pdf.
Spiegel K, Leproult R, Van Cauter E. 1999. Impact of sleep debt on metabolic and endocrine function. Lancet. 354(9188):1435–1439. doi:10.1016/S0140-6736(99)01376-8. [accessed 2019 May 8]. http://www.ncbi.nlm.nih.gov/pubmed/10543671.
Stewart-Ornstein J, Lahav G. 2017. P53 dynamics in response to DNA damage vary across cell lines and are shaped by efficiency of DNA repair and activity of the kinase ATM. Sci Signal. 10(476):1–11. doi:10.1126/scisignal.aah6671.
Sudmant PH, Rausch T, Gardner EJ, Handsaker RE, Abyzov A, Huddleston J, Zhang Y, Ye K, Jun G, Hsi-Yang Fritz M, et al. 2015. An integrated map of structural variation in 2,504 human genomes. Nature. 526(7571):75–81. doi:10.1038/nature15394. [accessed 2019 May 4].

64
http://www.nature.com/articles/nature15394.
Tamaru T, Hirayama J, Isojima Y, Nagai K, Norioka S, Takamatsu K, Sassone-Corsi P. 2009. CK2α phosphorylates BMAL1 to regulate the mammalian clock. Nat Struct Mol Biol. 16(4):446–448. doi:10.1038/nsmb.1578.
Tamiya H, Ogawa S, Ouchi Y, Akishita M. 2016. Rigid Cooperation of Per1 and Per2 proteins. Sci Rep. 6:32769. doi:10.1038/srep32769. [accessed 2016 Oct 19]. http://www.ncbi.nlm.nih.gov/pubmed/27609640%5Cnhttp://www.pubmedcentral.nih.gov/articlerender.fcgi?artid=PMC5016722.
Tauber E, Last KS, Olive PJW, Kyriacou CP. 2004. Clock Gene Evolution and Functional Divergence. J Biol Rhythms. 19(5):445–458. doi:10.1177/0748730404268775. [accessed 2018 Feb 11]. http://journals.sagepub.com/doi/10.1177/0748730404268775.
Tibbetts RS, Brumbaugh KM, Williams JM, Sarkaria JN, Cliby WA, Shieh SY, Taya Y, Prives C, Abraham RT. 1999. A role for ATR in the DNA damage-induced phosphorylation of p53. Genes Dev. 13(2):152–7. [accessed 2019 May 1]. http://www.ncbi.nlm.nih.gov/pubmed/9925639.
Toh Kong L, Jones CR, He Y, Eide EJ, Hinz WA, Virshup DM, Pta LJ. 2001. An h Per2 Phosphorylation Site Mutation in Familial Advanced Sleep Phase Syndrome. 291(February).
Toh K L, Jones CR, He Y, Eide EJ, Hinz WA, Virshup DM, Ptácek LJ, Fu YH. 2001. An hPer2 phosphorylation site mutation in familial advanced sleep phase syndrome. Science. 291(5506):1040–3. [accessed 2019 May 4]. http://www.ncbi.nlm.nih.gov/pubmed/11232563.
Tsuchiya Y, Akashi M, Matsuda M, Goto K, Miyata Y, Node K, Nishida E. 2009. Involvement of the protein kinase CK2 in the regulation of mammalian circadian rhythms. Taghert PH, editor. Sci Signal. 2(June):e1002293. doi:10.1126/scisignal.2000305. [accessed 2018 Feb 9]. http://www.ncbi.nlm.nih.gov/pubmed/26562092.
Turek FW, Joshu C, Kohsaka A, Lin E, Ivanova G, McDearmon E, Laposky A, Losee-Olson S, Easton A, Jensen DR, et al. 2005. Obesity and metabolic syndrome in circadian Clock mutant nice. Science (80- ). 308(5724):1043–1045. doi:10.1126/science.1108750. [accessed 2019 May 8]. http://www.ncbi.nlm.nih.gov/pubmed/15845877.
Uchida Y, Hirayama J, Nishina H. 2010. A Common Origin: Signaling Similarities in the Regulation of the Circadian Clock and DNA Damage Responses. Biol Pharm Bull. 33(4):535–544. doi:10.1248/bpb.33.535. [accessed 2018 Feb 9]. https://www.jstage.jst.go.jp/article/bpb/33/4/33_4_535/_pdf/-char/en.
Uhlén M, Fagerberg L, Hallström BM, Lindskog C, Oksvold P, Mardinoglu A, Sivertsson Å, Kampf C, Sjöstedt E, Asplund A, et al. 2015. Tissue-based map of the human proteome. Science (80- ). 347(6220):1260419. doi:10.1126/science.1260419.
Unsal-Kaçmaz K, Mullen TE, Kaufmann WK, Sancar A. 2005. Coupling of human circadian and cell cycles by the timeless protein. Mol Cell Biol. 25(8):3109–16. doi:10.1128/MCB.25.8.3109-

65
3116.2005. [accessed 2018 Feb 17]. http://www.ncbi.nlm.nih.gov/pubmed/15798197.
Del Valle-Pérez B, Arqués O, Vinyoles M, de Herreros AG, Duñach M. 2011. Coordinated action of CK1 isoforms in canonical Wnt signaling. Mol Cell Biol. 31(14):2877–88. doi:10.1128/MCB.01466-10. [accessed 2019 May 6]. http://www.ncbi.nlm.nih.gov/pubmed/21606194.
Vanselow K, Vanselow JT, Westermark PO, Reischl S, Maier B, Korte T, Herrmann A, Herzel H, Schlosser A, Kramer A. 2006. Differential effects of PER2 phosphorylation: Molecular basis for the human familial advanced sleep phase syndrome (FASPS). Genes Dev. 20(19):2660–2672. doi:10.1101/gad.397006. [accessed 2017 May 31]. http://www.ncbi.nlm.nih.gov/pubmed/16983144.
Verschuuren M, De Vylder J, Catrysse H, Robijns J, Philips W, De Vos WH. 2017. Accurate detection of dysmorphic nuclei using dynamic programming and supervised classification. PLoS One. 12(1):1–19. doi:10.1371/journal.pone.0170688.
Wei S, Yen IL, Thuraisingham B. 2008. EnhancingSecurity modeling for web services using delegation and pass-on. In: Proceedings of the IEEE International Conference on Web Services, ICWS 2008. Vol. 22. p. 545–552. [accessed 2017 Dec 5]. http://www.ncbi.nlm.nih.gov/pubmed/12446774.
Welsh DK, Logothetis DE, Meister M, Reppert SM. 1995. Individual neurons dissociated from rat suprachiasmatic nucleus express independently phased circadian firing rhythms. Neuron. 14(4):697–706. doi:10.1016/0896-6273(95)90214-7.
Williams GE. 2000. Geological Constraints on the Precambrian History of Earth ’ S Rotation and the Moon ’ S Orbit. (1999):37–59.
Wu C, MacLeod I, Su AI. 2013. BioGPS and MyGene.info: Organizing online, gene-centric information. Nucleic Acids Res. 41(D1):D561–D565. doi:10.1093/nar/gks1114. [accessed 2019 May 4]. http://www.ncbi.nlm.nih.gov/pubmed/23175613.
Wu G, Anafi RC, Hughes ME, Kornacker K, Hogenesch JB. 2016. MetaCycle: An integrated R package to evaluate periodicity in large scale data. Bioinformatics. 32(21):3351–3353. doi:10.1093/bioinformatics/btw405.
Xie S, Mortusewicz O, Ma HT, Herr P, Poon RRY, Helleday T, Qian C. 2015. Timeless Interacts with PARP-1 to Promote Homologous Recombination Repair. Mol Cell. 60(1):163–176. doi:10.1016/j.molcel.2015.07.031.
Yang J, Kim KD, Lucas A, Drahos KE, Santos CS, Mury SP, Capelluto DGS, Finkielstein C V. 2008. A Novel Heme-Regulatory Motif Mediates Heme-Dependent Degradation of the Circadian Factor Period 2. Mol Cell Biol. 28(15):4697–4711. doi:10.1128/mcb.00236-08. [accessed 2019 May 8]. http://www.ncbi.nlm.nih.gov/pubmed/18505821.
Yin L, Wu N, Curtin JC, Qatanani M, Szwergold NR, Reid RA, Waitt GM, Parks DJ, Pearce KH, Wisely GB, et al. 2007. Rev-erbα, a heme sensor that coordinates metabolic and circadian

66
pathways. Science (80- ). 318(5857):1786–1789. doi:10.1126/science.1150179. [accessed 2019 May 8]. http://www.ncbi.nlm.nih.gov/pubmed/18006707.
Yoo S-H, Yamazaki S, Lowrey PL, Shimomura K, Ko CH, Buhr ED, Siepka SM, Hong H-K, Oh WJ, Yoo OJ, et al. 2004. PERIOD2::LUCIFERASE real-time reporting of circadian dynamics reveals persistent circadian oscillations in mouse peripheral tissues. Proc Natl Acad Sci. 101(15):5339–5346. doi:10.1073/pnas.0308709101.
Yuferov V, Bart G, Kreek MJ. 2005. Clock reset for alcoholism. Nat Med. 11(1):23–24. doi:10.1038/nm0105-23. [accessed 2019 May 4]. http://www.nature.com/articles/nm0105-23.
Zamkov M, Chakraborty HS, Habib A, Woody N, Thumm U, Richard P. 2004. Image-potential states of single- and multiwalled carbon nanotubes. Phys Rev B - Condens Matter Mater Phys. 70(11):316–323. doi:10.1038/nature03097. [accessed 2017 Dec 5]. http://www.ncbi.nlm.nih.gov/pubmed/15549093.
Zhang R, Lahens NF, Ballance HI, Hughes ME, Hogenesch JB. 2014. A circadian gene expression atlas in mammals: Implications for biology and medicine. Proc Natl Acad Sci. 111(45):16219–24. doi:10.1073/pnas.1408886111. [accessed 2018 Jan 30]. http://www.pnas.org/lookup/doi/10.1073/pnas.1408886111.
Zhou M, Kim JKKK, Eng GWLWLWL, Forger DBBB, Virshup DMMM. 2015. A Period2 Phosphoswitch Regulates and Temperature Compensates Circadian Period. Mol Cell. 60(1):77–88. doi:10.1016/j.molcel.2015.08.022. [accessed 2016 Nov 23]. http://www.ncbi.nlm.nih.gov/pubmed/26431025.
Zielinski T, Moore AM, Troup E, Halliday KJ, Millar AJ. 2014. Strengths and Limitations of Period Estimation Methods for Circadian Data. Yamazaki S, editor. PLoS One. 9(5):e96462. doi:10.1371/journal.pone.0096462. [accessed 2019 May 5]. https://dx.plos.org/10.1371/journal.pone.0096462.

67
Supplementary Data Immunofluorescence microscopy image analysis Immunofluorescence (IF) microscopy is a technique widely used in basic research to monitor. The basic principle includes the recognition of a target molecule by a probe, usually an antibody, that is fluorescently labeled. On one sample, multiple targets can be labeled with multiple fluorescent tags with different absorption and emission wavelengths that do not overlap. The images were collected by a laser confocal microscope, which activated one fluorescent tag at a time with the lasers at the absorption peaks of each fluorescent tag. The activated fluorescent tags emit light that passed through a band pass filter to select for a small range of wavelength, then passed through a pinhole to select for a shallow focal depth. The signal of each fluorescent tag was collected into an individual channel. Each image depicted the distribution of the fluorescent labeled proteins in a thin slice of the specimen. 3 fluorescent tags were used in each of the images collected in this project, and the signal from each corresponding channel was assigned red, blue or green depending on the emission wavelength of the tags. A composite image was generated as the output from the microscope.
To quantify the IF images, I created two automatic pipelines to process the image to eliminate the subjective bias from human observer and keep consistency between multiple images.
Pipeline1: quantification of IF signal in each nucleus based on ImageJ macros, the program is hosted on GitHub at the following address: https://github.com/hugeneuron/segMeasure and https://github.com/hugeneuron/channelSpliter
4. Split the RGB multichannel image into grey scale images for each channel. 5. Segregate and identify each nucleus based on the DAPI channel and create ROI. 6. Quantify the mean signal density within each nuclei and export data in CSV format.
The scripts are explained as follows:
1. Split the RGB multichannel image into grey scale images for each channel.

68
dir1 = getDirectory("C:\Users\jiang\Desktop\0-Stitching-06-Image Export-01");
list = getFileList(dir1);
dir2 = dir1+"splitChannel"+File.separator;
File.makeDirectory(dir2);
for (i=0; i<list.length; i++)
{
if (File.isDirectory(dir1+list[i])){}
else{
path = dir1+list[i];
if (endsWith(path, ".ini")){}
else{
open(path);
setBatchMode(true);
title = File.nameWithoutExtension;
run("Split Channels");
saveAs("Tiff", dir2+title+"blue.tif");
close();
saveAs("Tiff", dir2+title+"green.tif");
close();
saveAs("Tiff", dir2+title+"red.tif");
close();
setBatchMode(false);
}
}
} 2. Segregate and identify each nucleus based on the DAPI channel and create ROI.
dir1 = getDirectory("C:\Users\jiang\Desktop\0-Stitching-06-Image Export-01");//input directory
list = getFileList(dir1);
dir2 = "C:\\Users\\jiang\\Desktop\\";//output directory
File.makeDirectory(dir2);
for (i=0; i<list.length; i++)
{
if (File.isDirectory(dir1+list[i])){}//reiterate all files in the folder
else{
path = dir1+list[i];
open(path);
title = File.nameWithoutExtension;
setAutoThreshold("RenyiEntropy");
setOption("BlackBackground", false);
run("Convert to Mask");
run("Smooth");
run("Make Binary");
saveAs("Tiff", dir2+title);
close();
}
} 3. Quantify the mean signal density within each nuclei and export data in CSV format.

69
indir = "D:\\Google Drive\\Finkielstein lab\\Processed Data\\Immunofloures\\HCT116_WT_sync-LMB-IR\\";//input directory
outdir = "D:\\Google Drive\\Finkielstein lab\\Processed Data\\ImmunoFloures\\HCT116_WT_sync-LMB-IR\\measuredTable\\";//output
directory
title = "LMB-IR-2"
//open both files
open(indir + "dapiProcessed\\"+title+"_DAPI.tif");
open(indir + "PER2\\"+title+"_PER2.tif");
//define ROI with DAPI channel
selectWindow(title+"_DAPI.tif");
run("Analyze Particles...", "size=200-Infinity pixel circularity=0.10-1.00 include add");
//apply ROI to PER2 channel
selectWindow(title+"_PER2.tif");
roiManager("Show None");
roiManager("Show All");
//set measurements and measure
run("Set Measurements...", "area mean min shape integrated kurtosis area_fraction limit redirect=None decimal=3");
roiManager("Measure");
//clean up ROI manager,prevent ROI leaking to the next iteration
run("Select All");
roiManager("Delete");
//save file
saveAs("Results", outdir+title+".csv");
//clean up opened resources, release memory
run("Clear Results");
close();
close();
Pipeline2: nuclear/cytosolic IF signal quantification based on python scripts, the program is hosted on GitHub at the following address: https://github.com/hugeneuron/IF_analysis, The scripts are explained as follows:
package dependency The analysis is implemented with python scripts that use image processing packages like scikit-image and pillow. To keep track of the progress of the analysis, tqdm is used for generating a progress bar. For image slicing, image slicer is used. channel separation and bit depth conversion We first split the original image into separate channels. Each channel contains the information of one fluorescent label. This analysis method can handle multiple channels simultaneously, but since most fluorescent labeling is done with 3 fluorescent tags, we will mainly discuss this scenario. In the 3 channels, one has to have only nuclear localization, and one of the other two has to have cytosolic localization. With our sample, DAPI only stains the nuclear region and PER2 have both nuclear and cytosolic distribution. Since most image processing packages are only compatible with 8-bit images, all 16-bit images are converted to 8-bit images at this step.
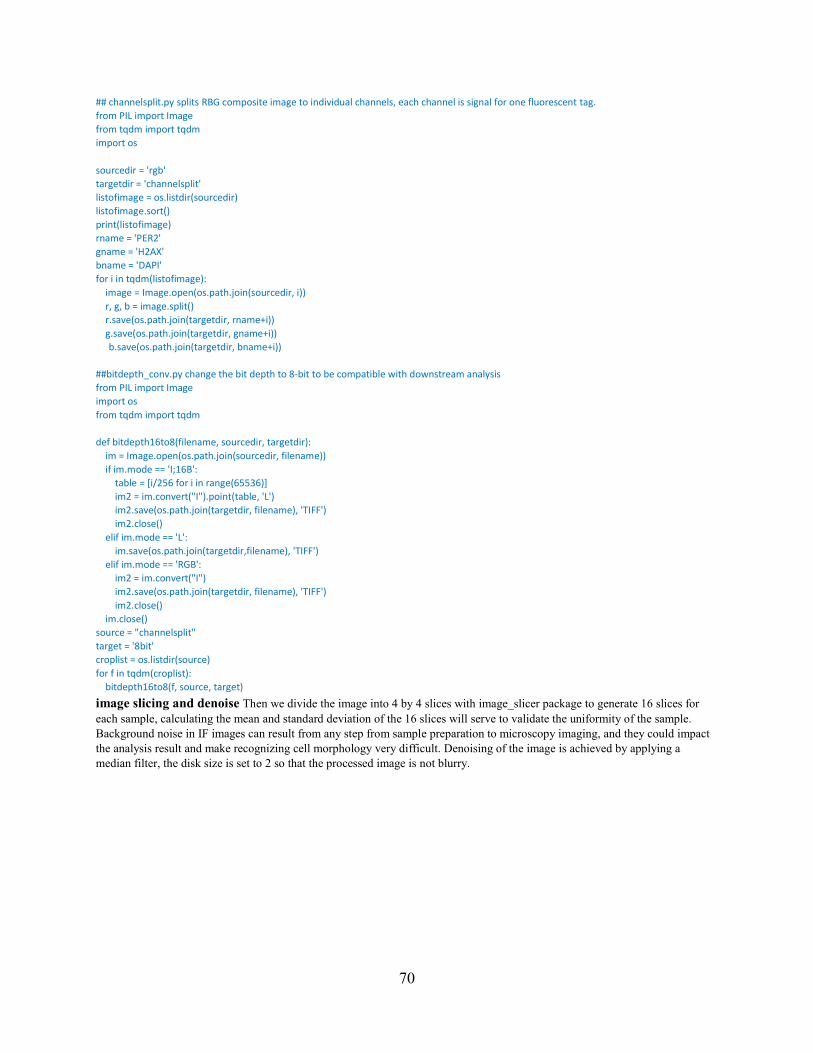
70
## channelsplit.py splits RBG composite image to individual channels, each channel is signal for one fluorescent tag.
from PIL import Image
from tqdm import tqdm
import os
sourcedir = 'rgb'
targetdir = 'channelsplit'
listofimage = os.listdir(sourcedir)
listofimage.sort()
print(listofimage)
rname = 'PER2'
gname = 'H2AX'
bname = 'DAPI'
for i in tqdm(listofimage):
image = Image.open(os.path.join(sourcedir, i))
r, g, b = image.split()
r.save(os.path.join(targetdir, rname+i))
g.save(os.path.join(targetdir, gname+i))
b.save(os.path.join(targetdir, bname+i))
##bitdepth_conv.py change the bit depth to 8-bit to be compatible with downstream analysis
from PIL import Image
import os
from tqdm import tqdm
def bitdepth16to8(filename, sourcedir, targetdir):
im = Image.open(os.path.join(sourcedir, filename))
if im.mode == 'I;16B':
table = [i/256 for i in range(65536)]
im2 = im.convert("I").point(table, 'L')
im2.save(os.path.join(targetdir, filename), 'TIFF')
im2.close()
elif im.mode == 'L':
im.save(os.path.join(targetdir,filename), 'TIFF')
elif im.mode == 'RGB':
im2 = im.convert("I")
im2.save(os.path.join(targetdir, filename), 'TIFF')
im2.close()
im.close()
source = "channelsplit"
target = '8bit'
croplist = os.listdir(source)
for f in tqdm(croplist):
bitdepth16to8(f, source, target) image slicing and denoise Then we divide the image into 4 by 4 slices with image_slicer package to generate 16 slices for
each sample, calculating the mean and standard deviation of the 16 slices will serve to validate the uniformity of the sample. Background noise in IF images can result from any step from sample preparation to microscopy imaging, and they could impact the analysis result and make recognizing cell morphology very difficult. Denoising of the image is achieved by applying a median filter, the disk size is set to 2 so that the processed image is not blurry.

71
##batchSlice.py script resamples each image into 16 slices import image_slicer import os, shutil from tqdm import tqdm if __name__ == "__main__": uncropDir = "8bit" cropDir = "slices" croplist = os.listdir(uncropDir) for f in tqdm(croplist): tiles = image_slicer.slice(os.path.join(uncropDir, f), 16, save=False) image_slicer.save_tiles(tiles, directory=cropDir, prefix=f) # sort images by DAPI and PER cropedlist = os.listdir(cropDir) for f in cropedlist: if "DAPI" in f: shutil.move(os.path.join(cropDir, f), 'DAPIcroped') elif "H2AX" in f: shutil.move(os.path.join(cropDir, f), 'H2AXcroped') elif "PER2" in f: shutil.move(os.path.join(cropDir, f), 'PER2croped') region of interest (ROI) definition DAPI channel is used for nuclear ROI definition. The nuclear region usually has strong
and continuous signal from the DAPI staining. Sobel operator, watershed transform are used for segmentation of nucleus region from background, small holes are removed with mathematical morphology. Cytosolic region is defined by subtracting the nuclear region from whole cell region. The whole cell region is defined with the signal from a antigen that has cytosolic distribution. Triangle threshold value of the denoised image is calculated and ROI of the whole cell is determined as region with greyscale
value higher than the triangle threshold.

72
##ROI.py has functions that define ROI and the function that performs nuclear/cytosolic intensity analysis
from skimage import io, filters, morphology
from scipy import ndimage as ndi
import numpy as np
from skimage.filters.rank import median
from skimage.morphology import disk
def wholeROI(image):
denoised = median(image, disk(20))
try:
threshold = filters.threshold_triangle(denoised)
binary = denoised > threshold
return binary
except ValueError:
pass
def nuclearROI(image):
edges = filters.sobel(image)
markers = np.zeros_like(image)
markers[image < 20] = 1 # tunnable, depends on the image set to be analyzed
markers[image > 60] = 2
segmentation = morphology.watershed(edges, markers)
segmentation = ndi.binary_fill_holes(segmentation - 1)
return segmentation
def trimedMeanValue(array): # trim all zeros, and get mean value of grey scale data
flat = array.flatten()
trimed = flat[flat != 0]
mean = np.mean(trimed)
return mean
def NCcontent(targetImage, dapiImage): # takes two strings(image file names), return nuclear and cytosolic intensity
# change parameter name to internal variables
target = targetImage
dapi = dapiImage
# define ROI
nuclear = nuclearROI(dapi)
roi2 = wholeROI(target)
try: # value error raised when images from different channels have different dimensions
intersect = np.logical_and(roi2, nuclear)
cytosol = np.logical_xor(roi2, intersect) # "-" is deprecated in numpy
# calculate intensity
nuclearVal = target * nuclear # per2 is original image, nuclear is 0/1 value
cytosolVal = target * cytosol
# totalVal = target * roi2 # usually not useful, uncomment if needed
nuclearIntensity = trimedMeanValue(nuclearVal)
cytosolIntensity = trimedMeanValue(cytosolVal)
return [nuclearIntensity, cytosolIntensity]
except ValueError:
print('images have different dimensions, fix by cropping or respliting from rgb')
pass
Batch quantification and processed image plotting. Image from designated folders are matched to the same tile by filename, processed images are plotted to demonstrate ROI for each cell. Since this method is very sensitive to ROI definition quality, these processed images need to be visually checked to ensure correct parameters are used in the analysis. If the ROI doesn’t match nucleus or cytosolic shape, this method would need modification to adjust the dataset. Data is exported for each sample as the program runs, and a file that has all the quantification data in the dataset is exported in CSV format when the program finishes the analysis.

73
##plotAxes is the function that plots the processed images and the ROI masked images
import ROI
import matplotlib.pyplot as plt
import numpy as np
def plotAxes(h2axImage, dapiImage, per2Image, saveName):
# change parameter name to internal variables
h2ax = h2axImage
dapi = dapiImage
per2 = per2Image
# define ROI
nuclear = ROI.nuclearROI(dapi)
roi2 = ROI.wholeROI(h2ax)
intersect = np.logical_and(roi2, nuclear)
cytosol = np.logical_xor(roi2, intersect) # "-" is deprecated in numpy
nuclearh2ax = h2ax*nuclear # h2ax is original image, nuclear is 0/1 value # graph h2ax and per2
cytosolh2ax = h2ax*cytosol
totalh2ax = h2ax*roi2
nuclearper2 = per2*nuclear
cytosolper2 = per2*cytosol
totalper2 = per2*roi2
fig, axes = plt.subplots(3, 3, figsize=(10, 5), sharey=True)
fig.tight_layout()
axes[0][0].imshow(nuclear, cmap=plt.cm.gray)
axes[0][0].set_title("nuclear(DAPI)")
axes[0][1].imshow(roi2, cmap=plt.cm.gray)
axes[0][1].set_title("h2ax")
axes[0][2].imshow(cytosol, cmap=plt.cm.gray)
axes[0][2].set_title("cytosol(h2ax XOR DAPI)")
axes[1][0].imshow(nuclearh2ax, cmap=plt.cm.gray)
axes[1][0].set_title("nuclearh2ax")
axes[1][1].imshow(totalh2ax, cmap=plt.cm.gray)
axes[1][1].set_title("totalh2ax")
axes[1][2].imshow(cytosolh2ax, cmap=plt.cm.gray)
axes[1][2].set_title("cytosolh2ax")
axes[2][0].imshow(nuclearper2, cmap=plt.cm.gray)
axes[2][0].set_title("nuclearper2")
axes[2][1].imshow(totalper2, cmap=plt.cm.gray)
axes[2][1].set_title("totalper2")
axes[2][2].imshow(cytosolper2, cmap=plt.cm.gray)
axes[2][2].set_title("cytosolper2")
plt.savefig(fname=saveName, format='png')
plt.close()
##batchMeasure.py invokes ROI.py to calculate the nuclear/cytosolic content in a batch manner, and exports data in CSV format.
import ROI, os
from plotAxes import plotAxes
import pandas as pd
from skimage import io
from tqdm import tqdm
# folders for croped images
h2axdir = 'H2AXcroped'
DAPIdir = 'DAPIcroped'
per2dir = 'PER2croped'
# folder for output
axesdir = 'axes'
targetdir = 'analyzedtables'
# check prerequisites:
dapilist = sorted([f[4:] for f in os.listdir(DAPIdir)])

74
Benchmarking of the denoising in this image analysis method. Denoising is used in this image analysis method to reduce background noise. Some denoising methods can be destructive to the original image and skew the information contained in the original image. Structural Similarity Index (SSIM) and Peak Signal to Noise Ratio (PSNR) are two parameters commonly used to benchmark image analysis methods. To evaluate the method we used, the processed images of Leptomycin B/ MG132 experiments were compared with the original images to calculate SSIM and PSNR values in the PER2 and p53 channel. The following code is used to calculate SSIM and PSNR.
import os
import skimage
from skimage import io
from tqdm import tqdm
import numpy as np
compdir = ['per2','p53','dapi']
origdir = 'origin'
for folder in compdir:
filelist = os.listdir(folder)
ssimls = []
psnrls = []
for i in tqdm(filelist):
ori = io.imread(os.path.join(origdir, i))
comp = io.imread(os.path.join(folder, i))
ssim = skimage.measure.compare_ssim(ori, comp)
psnr = skimage.measure.compare_psnr(ori, comp)
ssimls.append(ssim)
psnrls.append(psnr)
np.save(folder+'ssim', np.asarray(ssimls))
np.save(folder+'psnr', np.asarray(psnrls))
SNP analysis The scripts used to analyze SNP for PER2 can be accessed through https://github.com/hugeneuron/PER2_SNP_1000G
The SNP data is downloaded from https://www.ncbi.nlm.nih.gov/projects/SNP/snp_ref.cgi?geneId=8864 as a webpage, MAF and the amino acid position is extracted from the page with the following script:

75
# -*- coding: utf-8 -*- """ Created on Sat Aug 12 15:49:14 2017 @author: jiang """ ##extract aa position and MAF import re colorCodec = "#ff6666" missensePatternAA = "^.*spacing\=0\"\>(\d{9})\<\/a\>.*\> (rs\d{1,15}) \<\/a\></td>.*bgcolor=\"\#ff6666\"\>(0.\d{4})\<.*\>(missense)\<.*\>([ATCG])\<.*\>... \[([A-Z])\]\<.*\>([123])\<.*\>(\d{1,5})\<" html = open("8864CDS.html") colorCode = {"ffff99":"intron","ff6666":"missense","LightGreen":"synonymous","ffcc66":"UTR","":"notGene","88CCFF":"frame-shift"} missenseAA = [] missenseAApos = [] missenseAAmaf = [] missenseAAmut = [] for line in html: record = re.findall(missensePatternAA,line) missenseAA.extend(record) for item in missenseAA: missenseAAmaf.append(float(item[2])) missenseAApos.append(float(item[7])) missenseAAmut.append(item[5])
The orthodoxial amino acid at the SNP positions are extracted from the PER2 protein fasta sequence with the following script:
# -*- coding: utf-8 -*- """ Created on Mon Aug 14 15:27:37 2017 @author: jiang """ ## extract AA sequence from fasta to list def fastaToList(filename): AAlines = []## wholeSeqfile = open(filename) for line in wholeSeqfile: AAlines.append(line[:-1])## strip of \n seq = "".join(AAlines) return seq if __name__ == "__main__": print(fastaToList("Per2.sequence"))
MAF is plotted against amino acid position of each SNP on PER2 with the following script:

76
# -*- coding: utf-8 -*- """ Created on Sat Aug 12 15:20:45 2017 @author: jiang """ from brokenaxes import brokenaxes import matplotlib.pyplot as plt import ExtractPOS_MAF import exonExtract from fastaToList import fastaToList output = open("missenseOri_POS_Mut.txt","w") POS = ExtractPOS_MAF.missenseAApos MAF = ExtractPOS_MAF.missenseAAmaf MUT = ExtractPOS_MAF.missenseAAmut ORI = fastaToList("Per2.sequence") ORIAA = [] for i in POS: ORIAA.append(ORI[int(i)-1]) exonMarkers = exonExtract.exonProtLengths fig = plt.figure(figsize=(10,10)) bax = brokenaxes(ylims=((0, 0.018),(0.027,0.035),(0.17,0.175)), hspace=.005, tilt = 45, d=0.01) bax.plot(POS,MAF,"ro",markersize=3,label = "missense") bax.legend(loc=3) bax.set_ylabel('MAF',labelpad= 50) bax.set_xlabel("aa position",labelpad= 30) bax.set_title("MAF of Per2 CDS SNPs") for x, y, mut, oriAA in zip(POS,MAF,MUT,ORIAA): annotater = oriAA + str(int(x)) + mut bax.annotate(annotater,xy=(x,y),fontsize = 5) output.write(annotater+"\n") for exon,y in zip(exonMarkers,[0.174]*22): bax.annotate(round(exon,2),xy=(round(exon,2),y),fontsize = 7) for i in exonMarkers: bax.axvline(x = i,ymin=0.9,ymax=1,linewidth=0.5, color='k') plt.savefig("Per2brokenaxes.pdf") output.close()
Gene Ontology Analysis Gene ontology terms for mice genes downloaded from mgi website (http://www.informatics.jax.org/downloads/reports/go_terms.mgi), which is a complete book of the GO terms in mice. I selected the term "Iron" in this file, and found all the GO terms related to Iron metabolism. With these GO terms, I found all the genes under these GO terms. To find if they are expressed in mice liver, I generated a list of genes with liver expression from BioGPS.
To determine if a gene is circadian in mouse liver, I selected the genes in GCDB database based on the following restrictions: (Organism = Mus Musculus, tissue = liver, External Condition = DD), and got 19 genes in total. These genes were grouped by biological process with a GO analysis online software ShinyGO. I plotted the peak/trough information for the genes in each group, and selected the GO terms that are related to iron to plot the peak and trough of the genes in each group.
The code is as follows:
For downloading the GO list from MGI:

77
import os
import pandas as pd
import urllib3
import shutil
# get the GO terms from mgi file from this source
# http://www.informatics.jax.org/downloads/reports/go_terms.mgi
if os.path.exists('go_terms.mgi'):
pass
else:
os.system('wget http://www.informatics.jax.org/downloads/reports/go_terms.mgi')
# get iron related GO terms
GOterms = pd.read_csv('go_terms.mgi', delimiter='\t', names=['category', 'GOID', 'description'])
GOterms['GOID'] = GOterms['GOID'].str.replace("GO:", "")
IronGOterms = GOterms.loc[GOterms['description'].str.contains('iron')==True]
IronGOterms.to_csv('ironGO.csv')
GOlist = list(IronGOterms['GOID'])
print(GOlist)
# download the genetables
os.mkdir("IronGO")
for i in GOlist:
url = 'www.informatics.jax.org/go/report.txt?goID=GO:{ID}&results=14&startIndex=0&sort=term&dir='.format(ID=i)
filename = i+'.txt'
c = urllib3.PoolManager()
with c.request('GET', url, preload_content=False) as resp, open(os.path.join("IronGO", filename), 'wb') as out_file:
shutil.copyfileobj(resp, out_file)
## load GO terms with genes to pandas dataframes
Ironframelist = [pd.read_csv(filename, delimiter='\t', header=0) for filename in glob.glob("IronGO/*.txt")]
For plotting the data:

78
import numpy as np
import matplotlib.pyplot as plt
import pandas as pd
import os
#load the group information
groups = pd.read_csv('enrichment.csv')
keys = list(groups['Functional Category'])
values = list(groups['Genes'])
GeneGrouped = []
for i in values:
GeneGrouped.append(i.split(' '))
GroupDict = dict(zip(keys,GeneGrouped))
#load the liver iron circadian list and select data for plotting
livercirlist = pd.read_csv('livercirclist.csv')
#livercirlist['symbol'] = livercirlist['symbol'].str.upper()
def dataSelect(key):
genes = GroupDict[key]
selected = livercirlist.loc[livercirlist['symbol'].isin(genes)]
return selected
def plotpolar(key, tissue):
df = dataSelect(key)
peak = list(df['Peak'] * np.pi / 12)
trough = list(df['Trough'] * np.pi / 12)
r = list(df['Amplitude(Fold)'])
area = 20
fig = plt.figure()
ax = fig.add_subplot(111, projection='polar')
ax.scatter(peak, r, s=area, color='red')
ax.scatter(trough, r, s=area, color='green')
for i in range(len((list(df['symbol'])))):
ax.annotate(list(df['symbol'])[i],(peak[i], r[i]), fontsize = 8)
ax.set_theta_zero_location('W', offset=-90)
ax.set_theta_direction(-1)
ax.set_xticklabels(['0','3','6','9','12','15','18','21'])
plt.title(key)
# plt.subtitle('only DD data plotted')
# ax.legend(loc='upper center', bbox_to_anchor=(0.5, 1.05), ncol=3,)
savefolder = tissue + 'polarplots'
plt.savefig(savefolder+'/'+key+'.png')
if __name__ == '__main__':
tissue = 'liver'
folder = tissue + 'polarplots'
if not os.path.exists(folder):
os.makedirs(folder)
for i in keys:
plotpolar(i, tissue)

79
Supplementary Figures
Figure S1 Intracellular iron concentration can be manipulated while maintaining cell viability. (A) Treatment of HepG2 Cells with FeSO4 (1mM) or 2,2’-DP (1.5uM, 15uM) does not noticeable impact cellular viability, measured by MTT assay (Abnova). Saponin (0.1%) was used as a control. Treatment of HepG2 cells with 2,2’-DP (150uM) did have a detrimental impact on viability, and therefore 15uM was chosen to treat cells in all relevant experiments. Chemicals were added directly to the media for 48h prior to viability assay. (B) MEFPer2:luc cells were treated with either FeSO4 (0.1 μM, 1 μM, 10 μM) or 2,2’-DP (0.15 μM, 1.5 μM, 15 μM) for 48h prior to viability analysis by MTT assay. (C) HepG2 cells were treated with FeSO4 (0.1 μM, 1 μM, 10 μM, 1mM), and increase in intracellular iron relative to untreated controls was measured using a ferrozine based assay (Sigma). Significance was calculated using t-tests. *p ≤ 0.05; ** p ≤ 0.005; *** p ≤ 0.001 (D) HepG2 cells were treated with 2-2’-DP (1.5 μM, 15μM), and intracellular ferrous iron was measured as described in Materials and Methods.

80
Figure S2. MetaCycle analysis of PER2 and IREB2 mRNA levels in synchronized HepG2 cells. MetaCycle is a freely available statistics package run in R. language which enables analysis of circadian rhythms. The MetaCycle2D algorithm was applied to qRT-PCR quantification of PER2 and IREB2 mRNA in synchronized HepG2 cells. Cells were treated with either FeSO4 (1mM) or 2,2’-DP (15uM), and compared to untreated control. MetaCycle calculates circadian properties by integrating the ARSER, JTK-Cycle, and Lomb-Scargle methods with Fisher’s method for integration of p-values.