Insight into hydroxides-activated coals: chemical or...
22
Insight into hydroxides-activated coals: chemical or physical activation? J. Alcañiz-Monge, M. J. Illán-Gómez Departamento de Química Inorgánica. Universidad de Alicante. Ap. 99. E-03080. Alicante. Spain. Abstract- The objective of this paper is to get an insight into the chemical activation mechanism using KOH and NaOH as activated agents. Three coals have been selected as carbon precursors. It was found that KOH and NaOH develop a similar narrow microporosity, independently of the coal rank, whereas only KOH generates supermicroporosity. Temperature-programmed desorption experiments, carried out with impregnated anthracite, show differences on the gas evolved during the activated carbon preparation using the two activating agents. Thus, whereas hydrogen profiles are quite similar for both activated agents, the CO and H 2 O profiles are different. It is remarkable the high amount of H 2 O evolved at the maximum treatment temperature for both activating agents. The results obtained allow concluding that the chemical activation is due to a combination of different process driving the development of material porosity. Key words: Activated carbon; Chemical activation; Thermal analysis; Microporosity.
Transcript of Insight into hydroxides-activated coals: chemical or...

Insight into hydroxides-activated coals: chemical or physical activation?
J. Alcañiz-Monge, M. J. Illán-Gómez
Departamento de Química Inorgánica. Universidad de Alicante.
Ap. 99. E-03080. Alicante. Spain.
Abstract-
The objective of this paper is to get an insight into the chemical activation mechanism using
KOH and NaOH as activated agents. Three coals have been selected as carbon precursors. It
was found that KOH and NaOH develop a similar narrow microporosity, independently of the
coal rank, whereas only KOH generates supermicroporosity. Temperature-programmed
desorption experiments, carried out with impregnated anthracite, show differences on the gas
evolved during the activated carbon preparation using the two activating agents. Thus, whereas
hydrogen profiles are quite similar for both activated agents, the CO and H2O profiles are
different. It is remarkable the high amount of H2O evolved at the maximum treatment
temperature for both activating agents. The results obtained allow concluding that the chemical
activation is due to a combination of different process driving the development of material
porosity.
Key words: Activated carbon; Chemical activation; Thermal analysis; Microporosity.

1. INTRODUCTION
Activated carbons (AC) are porous solids with interesting properties such as high
thermal stability, high hydrophobic character, high chemical resistance and potential high
adsorption capacity for gas storage [1-5]. All materials that, after pyrolysis, yield a carbonized
with a high carbon content could be a suitable AC precursor: coal, pitch, agricultural by-
products and polymeric materials (phenol-formaldehyde resins, PAN, PVC, tires, sugar). The
most industrial used precursors are coals and agricultural by-products. In order to prepare AC,
two mainly groups of methods has been developed: i) physical activation (“thermal
activation”) using CO2 or steam as gasifying agents, and ii) chemical activation, using ZnCl2,
H3PO4, KOH or NaOH as activating agents. For chemical activation, the selection of the
activating agent depends on the carbon precursor: ZnCl2 and H3PO4 are frequently used for
lignocellulosic precursors, whereas for cokes or coals KOH is widely used.
Although the mechanism of the activation processes by KOH is an old subject of study
(i.e. Marsh & Walker 1979 [6]) and there are numerous reports in the literature [7-17],
nowadays, it is still unclear and, as consequence, continues being under study [18]. The
porosity development is strongly influence by numerous experimental parameters such as
coal/KOH weight ratio, maximum treatment temperature, time at the maximum temperature,
nitrogen flow and, as consequence, several mechanisms have been proposed. Some authors
point out that the intercalation of metallic potassium [16,19,20] or potassium compounds
[7,21,22] in the carbonaceous structure is the main cause of the porosity development. Other
authors [9,10,23,24] suggest that the gasification reactions between KOH and carbon is the
main activation process pathway. All these proposals can explain the experimental results, so,
1

all of them are acceptable. However, the challenge is to conclude which is the most realistic
approach.
Thus, the objective of this paper is to get an insight into the chemical activation
mechanism based on our experimental results obtained using KOH and NaOH as activated
agents. In order to make easy the interpretation of the results, three coals have been selected
as carbon precursor. This selection is based on the minimization of the other well-known
effects produced by hydroxide activation on lignocellulosic materials, such as dehydration,
degradation and polymerization of the cellulose compounds.
2. EXPERIMENTAL
Coal precursors
Three Spanish coals have been selected as carbon precursors: a lignite (denoted L), a
subbituminous (B) and an anthracite (A). Proximate analysis of coals is shows on Table 1.
Table 1. Proximate analysis of coals (weight %)
Coal Moisture Volatile mater Ash Fixe Carbon
A -- 8.2 6.7 85.1
B 9.2 30 10.8 50
L 15 39 33.6 12.4
Activation treatments
Chemical activation of coals was carried out using KOH (K) and NaOH (N) as activating
agents by the impregnation method [12,18]. In general, the following conditions were used: 2 g
2

of coal were mixed, by stirring, with a solution containing 10 cm3 of water and 4 g of the
activating agent for 2 h. The slurry was dried at 110 ºC overnight in an oven. Subsequently, the
dry mixture was heat treated in nitrogen flow (80 cm3/min) in a horizontal cylindrical furnace (65
mm i.d.). The heating rate was 5 ºC/min and the activation temperature was 700 ºC, which was
maintained for 2 h. The activated samples were washed repeatedly with a 5 M solution of HCl
and, after that, with distilled water until free of chloride ions. Finally, the sample was dried at
110 ºC for 12 h, and weigthed in order to calculate the yield.. The activation yield was obtained
from the weight differences between the raw coal (free ash based) and the obtained AC. On the
other hand, for comparative purpose, two ACs were prepared by physical activation: one using
CO2 as activating agent at 900 ºC during 10 hours, and the other using steam at 850 ºC during 6
hours.
Characterization of the samples
Porous texture analysis was carried out by N2 adsorption at 77 K and CO2 adsorption at
273 K (Autosorb 6). The samples were degassed at 600 K under vacuum 1 Pa. The Dubinin-
Radushkevich (DR) equation was used to calculate the micropore volume. The different pore
volumes were calculated as follows [25]: i) the volume of the narrow micropores (< 0.7 nm)
from the CO2 DRs (relative pressures < 0.015) and ii) the total micropore volume (pore size <
2nm), which contains the volume of the previous narrow micropores and those of the
supermicropores, from the N2 DRs (relative pressures < 0.14). Apparent surface area was
determined by applying the BET [26] (Brunauer-Emmett-Teller) equation.
The analysis of the weight loss and of the gases evolved during the heat treatment of
impregnated coal-hydroxide was studied in Stanton Redcroft thermobalance (STA-780), by
thermogravimetry analysis (TG), and in a mass spectrometer (VG quadrupoles), by temperature-
3

programmed desorption experiments (TPD). For TPD and TG experiments 0.1 g impregnated
coal-hydroxide (1/1) were heated at 20 ºC/min, under helium flow (60 cm3/min), until 700 ºC,
holding 30 min at this temperature.
3. RESULTS.
3.1. Porous Texture Characterization of AC.
The results corresponding to the pore texture characterization of ACs are shown in Table
2 and Figure 1. Table 2 contains the volume of micro and mesopore calculated from adsorption
data and the yield (ash free based) and Figure 1 shows the micropore volume.
Table 2. Pore texture characteristic and yield of AC.
AC SBET (m2/g) Vmicropore (cm3/g) Vmeso (cm3/g) Yield (wt%)
AK
AN
1806
1987
0.64
0.71
-
-
53
38
BK
BN
2100
1640
0.75
0.58
-
-
51
25
LK
LN
2587
1325
0.92
0.52
0.10
0.05
38
49
The data shown in Table 2 indicate that the ACs are, essentially, microporous with values
of BET surface areas around 2000 m2/g. Only ACs from low rank coal (L) shows a certain
mesoporosity development. It can also be appreciated that KOH produces higher micropore
development than NaOH for low rank coal; whereas, for anthracite, NaOH gives better results.
4

Interestingly, the evolution of the microporosity generated by both activating agents follows an
opposite trend: for KOH the lower the coal rank, the higher the porosity development, whereas,
for NaOH the higher the coal rank, the higher the porosity development. Regarding the yield,
except lignite, the ACs obtained using NaOH show lower yields, due to its higher reactivity.. For
lignite, the higher yields obtained using NaOH could be related, as reported [27], with the better
efficiency of NaOH in the decrease of tarry substances. This fact is more significant for lignite
due its high volatile content (see Table 1).
In order to clearly show that the microporosity development is related to the coal rank
and the activating agent, Figure 1 shows the micropore volume for all the ACs prepared. For the
narrow microporosity (VCO2) development a similar behaviour is observed for both activating
agents: the higher the coal rank, the higher the porosity development. The main difference
between both activating agents is observed on the supermicropore development. Thus, whereas
NaOH produces AC with a narrow micropore size distribution independently of coal rank, using
KOH the lower the coal rank, the higher the supermicropores volume.
3.2. Analysis of activation process
3.2.1. Thermogravimetry analysis.
Figure 2 shows the TG curves of the raw coal precursors and that of the KOH or NaOH
coal mixture. The low rank coals (L and B) show an initial weight loss between 25-150 ºC,
which corresponds to the loss of adsorbed atmospheric gases (CO2 and water). For these coals,
the weight loss goes on from 300 to 700 ºC due to the release of the volatile mater. The weight
loss values shown by L and B samples agree with the proximate analysis of coals shown in Table
5

1. Coal A presents a different behaviour showing a very low weight loss at temperatures lower
than 700 ºC.
The weight loss shown by impregnated samples correspond to the volatile matter of raw
coal, to the dehydration of activating agent and to the gaseous products generated by the
chemical reaction between the activating agent (and their decomposition products) and the coal.
Note that there is not a correlation between the remaining weight of TG curves and the AC yield
shown in Table 2, because it is expressed in free mineral matter based. It can be observed in
Figure 2 that the TG curves of impregnated samples show the same profile than the
corresponding to the original coal. Hence, until temperatures close to 700 ºC, the weight loss
shown by impregnated samples can be related, mainly, to the release of volatile matter from the
raw coal. It has to be pointed out that, in the range of temperature under study, KOH and NaOH
show a similar behaviour during the heat treatment of impregnated coal. The main difference
between both activating agents is observed at temperatures around 700 ºC, where NaOH shows a
higher reactivity than KOH. The temperature at which NaOH shows a higher reactivity than
KOH is coal rank depending (700 ºC to A, 650 ºC to B and 600 ºC L). This fact agrees with the
reactivity sequence for coals gasification [28,29].
3.2.2. Evolved gas analysis.
In order to obtain more information about the activation process, the study of the gas
evolution during TG experiments could be interesting. Figure 2 reveals a similar gas evolution
for raw and impregnated coals in the case of coal L and B. This evolution corresponds to the
release of volatile matter from these coals (Table 1). For coal A, the gases evolved by
impregnated sample seem to be related to the chemical reaction between activating agent and
6

coal. As consequence, coal A has been selected to carry out the analysis of gas evolution during
activation process.
Figures 3 and 4 feature the results of TPD experiments for AK (a) and AN (b) samples.
Both, the gas evolution versus temperature during the heat treatment of samples until 700 ºC (left
part of figure), and the gas evolution with time at 700 ºC (right part of figure) are shown. Figure
3 shows the emission of H2, CO2, CO and CH4, and Figure 4 presents the H2O and H2 emission.
As deduced form TG experiments (Figure 2), the gas evolution follows the same pattern for
samples AK and AN: at low temperature is low and begins to be significant at temperatures
above 500 ºC. In general terms, the H2O and CO2 emission is observed a low temperature, the H2
and CH4 emission begins at temperatures close to 500 ºC, and near to 600 ºC starts the CO
emission. The main differences between both activating agents are the onset temperature for gas
evolution and the temperature for the maximum: KOH shows the lowest temperature for both
onset gas evolution and the peak maximum. During the isothermal step at 700 ºC, the gas
evolution decreases indicating the end of chemical reactions, being this more pronounced for
KOH than for NaOH.
On the other hand, the analysis of the individual gas profile gives interesting information.
Firstly, it must be point out that the H2 profile is quite similar for both activated agents. The H2
comes from the hydroxide metal-coal reaction [23,27,29]:
4 MeOH + -CH2 → Me2CO3 + Me2O + 3 H2 (1)
6MeOH + C → Me + H2 + Me2CO3 (2)
7
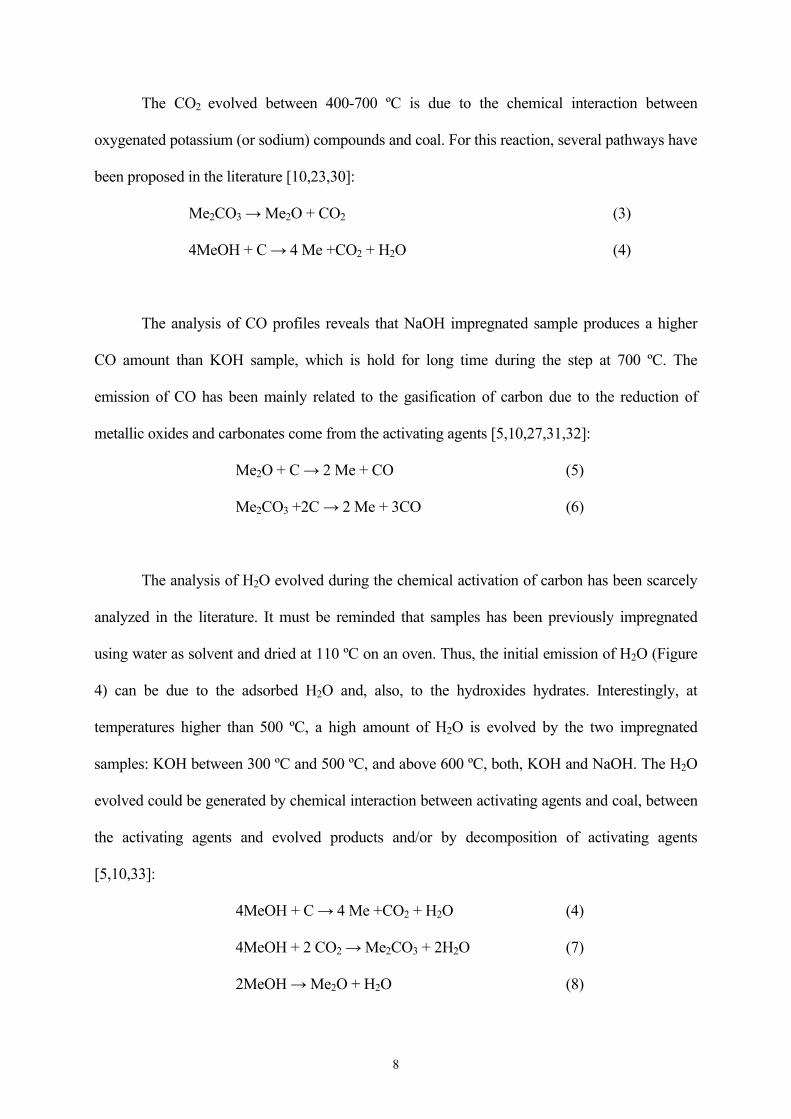
The CO2 evolved between 400-700 ºC is due to the chemical interaction between
oxygenated potassium (or sodium) compounds and coal. For this reaction, several pathways have
been proposed in the literature [10,23,30]:
Me2CO3 → Me2O + CO2 (3)
4MeOH + C → 4 Me +CO2 + H2O (4)
The analysis of CO profiles reveals that NaOH impregnated sample produces a higher
CO amount than KOH sample, which is hold for long time during the step at 700 ºC. The
emission of CO has been mainly related to the gasification of carbon due to the reduction of
metallic oxides and carbonates come from the activating agents [5,10,27,31,32]:
Me2O + C → 2 Me + CO (5)
Me2CO3 +2C → 2 Me + 3CO (6)
The analysis of H2O evolved during the chemical activation of carbon has been scarcely
analyzed in the literature. It must be reminded that samples has been previously impregnated
using water as solvent and dried at 110 ºC on an oven. Thus, the initial emission of H2O (Figure
4) can be due to the adsorbed H2O and, also, to the hydroxides hydrates. Interestingly, at
temperatures higher than 500 ºC, a high amount of H2O is evolved by the two impregnated
samples: KOH between 300 ºC and 500 ºC, and above 600 ºC, both, KOH and NaOH. The H2O
evolved could be generated by chemical interaction between activating agents and coal, between
the activating agents and evolved products and/or by decomposition of activating agents
[5,10,33]:
4MeOH + C → 4 Me +CO2 + H2O (4)
4MeOH + 2 CO2 → Me2CO3 + 2H2O (7)
2MeOH → Me2O + H2O (8)
8

In the case of KOH, the emission of H2O at temperatures lower than 600 ºC is not
concomitant with the CO2 emission. This fact seems to indicate that reaction (8) is taking place.
In the case of NaOH, at temperature lower than 600 ºC, no emission of H2O and CO2 is
observed. So, at 600 ºC, NaOH is present. Above this temperature, similar profiles for H2O and
CO2 are shown (Figure 3 and 4) indicating that reactions (4) and (7) are taking place, without
discard also reaction (8).
All the reactions above described and, in addition, reactions (1), (2) and (4) will be
considered as global reactions. As example, the reaction (6) is the result of two consecutive
reactions (3) and (5) [34]. On the other hand, all reactions have been proposed based on the TPD
results and, for a different activating agent, others reactions can be proposed in order to explain
the experimental results. As example, the reaction (2) have been proposed by Lillo et al [23] to
explain the low CO2 amount observed at 700 ºC and also the high H2 emission. It has to be
considered that these authors used a MeOH/C weight ratio of 4/1 (corresponding to that used for
the AC preparation). In these experimental conditions, the CO2 evolved during the TPD could
react with the MeOH through the reaction (7). In the case of our experiments, due to the lower
amount of hydroxide used (1/1) most of the CO2 evolved could flows through the previous coal
bed minimizing the described reaction. Nevertheless, reaction (2) could also take place during
the AC preparation.
Finally, it is noteworthy that the TG and TPD experiments cannot explain the differences
in the micropore development found for the two activating agents.
9

4. DISCUSION.
Development of microporosity on coal by chemical activation: unifying ideas.
The preparation of AC by chemical activation of anthracites was study by several authors
[12,17,18,24,34]. In these studies, different parameters affecting the final pore texture of AC
were analysed: pre-treatment of coal, activated agents, activating agent/coal ratio, maximum
temperature of treatment, activation time, nitrogen flow. The analysis of the published data
indicates that the micropore volume increases with activating agent/coal ratio, maximum
temperature treatment, or the nitrogen flow. In this section, we are going to analyze our
experimental results as well as published results in terms of the proposed reactions.
a) The influence of nitrogen flow.
One of most influent parameter on the development of microporosity, scarcely study
in the literature, is the nitrogen flow. Some authors indicate that this effect is due to a
diffusion control of solid phase reaction [4]. Other authors suggest that the effect could be
consequence of the removal of metallic potassium (or sodium) which favours the reaction
between KOH and coal to produce metallic potassium [14]. Another possibility [14] is the
quicker removal of gaseous products evolved during the chemical reactions as the nitrogen
flow increases. Our TPD results reveal a high H2O emission at the maximum reaction
temperature for both activating agents. H2O is a coal gasification agent and reaction (9) can be
catalyzed by alkaline compounds (hydroxides, carbonates) [32,35].
H2O + C → CO + H2 (9)
It has been reported that the coal gasification by steam can takes place at temperatures
as low as 600 ºC by means of water dissociation on metallic particles (10) [36].
10

2 Na + H2O → Na2O + H2 (10)
The amount of H2O evolved during the experiments is quite enough to allow the coal
gasification. The H2 evolution observed on TPD experiments (Figure 4) indicates that reaction
(10) is taking place. In addition, this reaction could explain the influence of the nitrogen flow
on the AC yield: higher nitrogen flow faster removal of H2O, so lower coal gasification.
b) The influence of activating agent/ coal ratio.
It is well known that the increase of the hydroxide/coal ratio generates a higher
micropore volume. Several authors related this development with the increase in the carbon
gasification by potassium compounds [10,12,37]. If the chemical activation really involves
carbon gasification, and considering the stoichiometry of the gasification reaction (reactions (1),
(2) and (4)) and, also, that all KOH is involved in the carbon gasification, the calculate yields for
1 and 3 KOH/C ratios are 89 % and 68 %, respectively. However, the AC yields reported in the
literature are higher: 1, 2 and 3 ratios gives AC yields of 86, 79 and 90 % wt, respectively.
Considering these results, the following observations have to be point out: a) the development of
microporosity cannot be due only to carbon gasification, b) the intercalation must play an
important role on the micropore development, and c) it has to be an additional reduction
mechanism for hydroxide avoiding carbon consumption.
The first observation has been already justified by the above calculated yields. Related to
the second one, a comparison between chemical and physical activation has to be do. For this,
two AC using CO2 and steam as gasifying agents were prepared. The values of BET areas for
comparables burn-off (BO) are: 1460 m2/g to AC prepared using CO2 (60 % BO) and 710 m2/g
11

obtained with steam (65 % BO). For the sample obtained using NaOH the BO is 63 % and the
BET area is 1987 m2/g. Hence, it clear that in chemical activation the development of
microporosity can not be due only to carbon gasification, so the intercalation must be taking
place. This fact agrees with recent studies showing that metal intercalation can help the
activation by increasing the porosity [16,19,20,22] and this seems to explain that no
differences on the TG curves of two hydroxides are observed (section 3.2.1):, whereas the
development of microporosity is different.
However, for intercalation metallic species are needed. These species have to be
produced by reduction of potassium (or sodium) compounds (hydroxide, oxide or carbonate).
Almost all of the reported reactions explain the formation of metallic species involving carbon as
reductant (see reactions (2), (4)-(6)), which implies a carbon gasification that does not
correspond to the higher AC yields. Another possibility, scarcely analysed in the literature, is the
role that hydrogen could play in the reduction of metallic compounds. It is well known the use of
hydrogen as reducing agent in the activation of metallic catalyst. During TPD a higher emission
of H2 is observed at the activation temperature. It is well known that alkaline hydroxide suffers
an intense dehydrogenation, evolving H2 comes from the hydroxide and the coal [38]. Now, the
question is if the evolved H2 is enough to reduce potassium compounds. As example, a KOH/C
ratio of 3 means 0.026 mol K2O, and from an anthracite with a low hydrogen content of a 5 wt%
0.025 mol H2 could be released. Theses values indicate that there is enough hydrogen to reduce
all the potassium compounds.
12

5. CONCLUSIONS
It was found that KOH and NaOH develop a similar narrow microporosity,
independently of the coal rank, whereas only KOH generates supermicroporosity. TPD
experiments, reveals that H2 profiles are quite similar for both activated agents, whereas CO and
H2O profiles are different generating: NaOH impregnated sample the highest CO amount. The
high amount of evolved H2O at the maximum treatment temperature for both activating agents
allows to explain the influence of the nitrogen flow on the AC yield; and, the large amount of
evolved H2 justifies the high AC yield obtains during the preparation of high microporous AC
due its reductant role.
Based on the experimental results discussed in this paper and the revision of the
previous results, it is concluded that the chemical activation of an anthracite is closer to a
“physical” process of intercalation/de-intercalation than to a “chemical” carbon gasification. For
low rank coals, the “chemical activation” has to be a combination of several processes:
dehydration, dehydrogenation, gasification of carbon via reduction of oxygenated metallic
compounds, secondary gasification by the evolved H2O, and intercalation of metallic species. As
consequence, the porosity development of carbonaceous materials by chemical activation
depends on several interrelated factors: a) heteroatom contain, b) microstructure of carbonaceous
precursor and c) experimental conditions. Thus, depending on the combination of these factors,
the most influent activation process can be different, and, hence, the mechanism proposed for
specific conditions can not be extended to others.
13

Acknowledgements
The authors thank the Spanish Government (project CTQ2005-01358) and the GV (projects
GV/2007/144 and ARVIV/2007/067) for the financial support.
REFERENCES
1. R.C. Bansal, J.B. Donnet and F. Stoeckli, Actived Carbon, Marcel Dekker, New York,
(1988).
2. R.C. Bansal and M. Goyal, Activated Carbon Adsorption, Taylor & Francis, Boca Raton,
FL (2005).
3. J.W. Patrick, Editor, Porosity in Carbons, Wiley, New York (1995).
4. H. Marsh and F. Rodríguez-Reinoso, Activated Carbon, Elsevier Science, Amsterdan,
(2006), p. 322.
5. T. Otowa, R. Tanibata and M. Itoh, Gas Separation & Purification 7 (1993), p. 241.
6. D. Lozano-Castello, J. Alcañiz-Monge, M.A. de la Casa-Lillo, D. Cazorla-Amorós and
A. Linares-Solano, Fuel 81 (2002), p. 1777.
7. H. Marsh and P.L. Walker Jr. Fuel Processing technology 2 (1979), p. 61.
8. H. Marsh, D.S. Yan, T.M. O’Grady and A. Wennerberg, Carbon 22 (1984), p. 603.
9. T. Wigmans, A. Hooglnd, P. Tromp and J.A. Moulijin, Carbon 21 (1983), p. 13.
10. P. Ehrburger, A. Addoun, F. Addoun and J.B. Donnet, Fuel 65 (1986), p. 1447.
11. M. Jagtoyen, M. Thwaites, J. Stencel, B. McEnaney and F. Derbyshire, Carbon 30 (1992),
p. 1089.
14

12. M.J. Illán-Gómez, A. García-García, C. Salinas-Martínez de Lecea and A. Linares-
Solano, Energy Fuels 10 (1996), p. 1108.
13. A. Ahmadpour and D.D. Do, Carbon 34 (1996), p. 471.
14. D. Lozano-Castelló, M.A. Lillo-Ródenas, D. Cazorla-Amorós and A. Linares-Solano,
Carbon 39 (2001), p. 741.
15. M.A. Lillo-Ródenas, D. Lozano-Castelló, D. Cazorla-Amorós and A. Linares-Solano,
Carbon 39 (2001), p. 751
16. E. Raymundo-Piñero, D. Cazorla-Amorós, A. Linares-Solano, S. Delpeux, E. Frackowiak,
K. Szostak and F. Béguin, Carbon 40 (2002), p. 1614.
17. A. Perrin, A. Celzard, A. Albiniak, J. Kaczmarczyk, J.F. Marêché and G. Furdin, Carbon
42 (2004), p. 2855.
18. A. Linares-Solano, D. Lozano-Castelló, M.A. Lillo-Ródenas and D. Cazorla-Amorós. In:
L.R. Radovic, Editor, Carbon activation by alkaline hydroxides: preparation and reactions,
porosity and performances, Chem. Phys. Carbon, vol. 30, Dekker, New York (2006).
19. E. Raymundo-Piñero, P. Azaïs, T. Cacciaguerra, D. Cazorla-Amorós, A. Linares-Solano
and F. Béguin, Carbon 43 (2005), p. 786.
20. J. A. Maciá-Agulló, B.C. Moore, D. Cazorla-Amorós and A. Linares-Solano, Micropor
Mesopor Mater 101 (2007), p. 397.
21. J. Diaz-Téran, D.M. Nevskaia, J.L.G. Fierro, A.J. López-Peinado and A. Jerez, Micropor
Mesopor Mater 60 (2003), p. 173.
22. R. Xue and Z. Shen, Carbon 41 (2003), p. 1851.
23. M.A. Lillo-Ródenas, D. Cazorla-Amorós and A. Linares-Solano, Carbon 41 (2003), p.
267.
24. N. Yoshizawa, K. Maruyama, Y. Yamada, E. Ishikawa, M. Kobayashi, Y. Toda and M.
Shiraishi, Fuel 81 (2002), p. 1717.
15

25. D. Cazorla-Amorós, J. Alcañiz-Monge and A. Linares-Solano, Langmuir 12 (1996), p.
2820.
26. S. Brunauer, P. H. Emmett, E. Teller. J. Am. Chem. Soc. 60 (1938), p. 309.
27. Y. Yamashita and K. Ouchi, Carbon 20 (1982), p. 41.
28. P.L. Walker Jr., F. Rusinko Jr. and L.G. Austin, Adv. in Catalysis 11 (1959), p. 133.
29. M.A. Lillo-Ródenas, J. Juan-Juan, D. Carzola-Amorós and A. Linares-Solano, Carbon 42
(2004), p. 1371.
30. C.A. Mins and J.K. Pabst, Fuel 62 (1983), p. 176.
31. D. W. McKee and D. Chatterji, Carbon 16 (1978), p. 53.
32. F. Huhn, J. Klein and H. Jüntgen, Fuel 62 (1983), p. 196.
33. J. Laine and A. Calafat, Carbon 29 (1991), p. 949.
34. G. Amarasekera, M. J. Scarlett and D. E. Mainwaring, Carbon 36 (1998), p. 1071.
35. T. Wigman, R. Elfring and J.A. Moulijn, Carbon 21 (1983), p. 1.
36. T. Suzuki, K. Inoue and Y. Watanabe, Fuel 68(1989), p. 626.
37. T. Hsisheng and H. Li-Yeh, Ind. Eng. Chem. Res. 38 (1999), p. 2947.
38. S.K. Srivastava, T. Saran, J. Sinha, L.V. Ramachandran and S.K. Rao, Fuel 67 (1988), p.
1680.
16

A B L A B L0
0.25
0.5
0.75
1
Vmicro (cm /g)
KOH NaOH
3
Figure 1. Micropore volume calculated from N2 and CO2 data.
17

50
55
60
65
70
75
80
85
90
95
100
0 100 200 300 400 500 600 700 800
Temperature ºC
Wei
ght l
oss
%
AAKAN
50
55
60
65
70
75
80
85
90
95
100
0 100 200 300 400 500 600 700 800
Temperature ºC
Wei
ght l
oss
%
BBKBN
18

50
55
60
65
70
75
80
85
90
95
100
0 100 200 300 400 500 600 700 800
Temperature ºC
Wei
ght l
oss
%
LLKLN
Figure 2. Thermogravimetry curves for the coal precursors (A, B and L) and their impregnated samples with
KOH (K) and NaOH (N)
19

a) b)
0
0.5
1
1.5
2
2.5
0 100 200 300 400 500 600 700
Temperature (ºC)
ξm
ol/g
s
CH4 CO CO2 H2
0 5 10 15 20 25 30Time (min)
ξm
ol/C
s
0
1
2
3
4
5
6
7
0
0.5
1
1.5
2
2.5
0 100 200 300 400 500 600 700
Temperature (ºC)
ξm
ol/g
s
CH4 CO CO2 H2
0 5 10 15 20 25 30Time (min)
ξm
ol/g
s
0
1
2
3
4
5
6
7
Figure 3. H2, CO2, CO and CH4 evolution on the TPD experiment over AK (a) and AN (b) samples
20

a)
0
5
10
15
20
25
0 100 200 300 400 500 600 700
Temperature (ºC)
ξm
ol/g
s
H2O H2
0 5 10 15 20 25 30Time (min)
ξm
ol/g
s
0
1
2
3
4
5
6
7 b)
0
5
10
15
20
25
0 100 200 300 400 500 600 700
Temperature (ºC)
ξm
ol/g
s
H2O H2
0 5 10 15 20 25 30Time (min)
ξm
ol/g
s
0
1
2
3
4
5
6
7
Figure 4. H2 and H2O evolution on the TPD experiment over AK (a) and AN (b) samples.
21