
Insider sales and future stock price crash risk: Firm ...
46
1 Insider sales and future stock price crash risk: Firm-level analysis Abstract: This study investigates whether insiders trade on future stock price crash risk. We find that insider sales are positively associated with future stock price crash risk. This evidence is consistent with the view that insiders are able to assess and anticipate future crash risk and to exploit this information advantage to fulfil personal trading incentives. We also find that the positive association between insider sales and future crash risk is stronger for firms that have high information opacity but weaker for firms that are in financial constraints or in the post SOX period. Additional analysis reveals that insider sales can predict future crash risk as far as 39 months ahead. Our findings have important practical implications. Market participants can use insider sales in ex ante assessing future stock price crash risk, and in appraising the likelihood and extent of insiders’ bad news hoarding which results in the crash risk. Our study should be of particular interest to (i) investors that make portfolio investment decisions, (ii) suppliers and creditors who are concerned about their clients’ creditworthiness, (iii) boards of directors contemplating the design of optimal equity incentive compensation schemes for insiders, and (iv) policymakers regulating insider trading and corporate disclosure transparency. Keywords: insider sales; stock price crash risk; financial constraints; information asymmetry; SOX JEL Classifications: M41 G14 G30
Transcript of Insider sales and future stock price crash risk: Firm ...
1
Insider sales and future stock price crash risk: Firm-level analysis
Abstract: This study investigates whether insiders trade on future stock price crash risk. We
find that insider sales are positively associated with future stock price crash risk. This
evidence is consistent with the view that insiders are able to assess and anticipate future crash
risk and to exploit this information advantage to fulfil personal trading incentives. We also
find that the positive association between insider sales and future crash risk is stronger for
firms that have high information opacity but weaker for firms that are in financial constraints
or in the post SOX period. Additional analysis reveals that insider sales can predict future
crash risk as far as 39 months ahead. Our findings have important practical implications.
Market participants can use insider sales in ex ante assessing future stock price crash risk, and
in appraising the likelihood and extent of insiders’ bad news hoarding which results in the
crash risk. Our study should be of particular interest to (i) investors that make portfolio
investment decisions, (ii) suppliers and creditors who are concerned about their clients’
creditworthiness, (iii) boards of directors contemplating the design of optimal equity
incentive compensation schemes for insiders, and (iv) policymakers regulating insider trading
and corporate disclosure transparency.
Keywords: insider sales; stock price crash risk; financial constraints; information asymmetry;
SOX
JEL Classifications: M41 G14 G30
2
1. Introduction
A vast literature documents that insiders tend to trade on advance knowledge of bad news
events such as bankruptcies (Gosnell et al., 1992; Syhun and Bradley, 1997), dividend initiations
(John and Lang, 1991), disclosures of internal control weaknesses (Skaife et al., 2013), SEC
enforcement actions (Beneish, 1999; Johnson et al., 2009; Thevenot, 2012), accounting
restatements (Badertscher et al., 2011; Agrawal and Cooper, 2015), public disclosures of
negative SEC comment letters (Dechow et al., 2016), negative earnings surprises (e.g., Ke et al.,
2003) or reversals of inflated earnings (e.g., Beneish and Vargus, 2002; Darrough and Rangan,
2005). The insiders’ motivation behind these information-based sales is to avoid losses from a
stock price drop that is attributed to the bad news events, whereby securing monetary benefits at
the expense of uninformed outside investors. This issue is important because such opportunistic
insider sales engender resource misallocation in the financial marketplace, reduce investors’
willingness to trade, and lower market liquidity.
Our departure from the prior research is to conduct a firm-level analysis of the association
between insider sales and future stock price crash risk. Stock price crash risk is documented by
prior studies (e.g., Jin and Myers, 2006; Hutton et al., 2009) to be attributed to managers’
hoarding bad news inside a firm. In particular, due to career and short-term compensation
concerns, managers in general have incentives to hide bad news (Graham et al., 2005; Jin and
Myers, 2006; Kothari et al., 2009). Nonetheless, there exists an upper limit where it becomes too
costly or difficult for managers to further withhold the bad news, and managers usually cannot
anticipate when the upper limit point will arrive (He, 2015). Once the threshold point is reached,
3
all of the stockpiled bad news will come out at once, resulting in an abrupt, drastic decline in
stock price, that is, a stock price crash (Chen et al., 2001; Jin and Myers, 2006; Hutton et al.,
2009). Accordingly, stock price crash risk refers to the likelihood of a stock price crash that is
attributed to the bad news hoarding. The bad news withheld could be of any kind that, once
released, would bring about a drop in stock price. Hence, compared with other corporate bad
news events studied by the prior insider trading literature, stock price crash risk offers a more
powerful, generalized setting for us to examine the opportunistic insider sales. This constitutes
the major motivation of our study.
Though managers often cannot anticipate the point at which stock price would crash (to be
discussed in Section 2), it is still reasonable to expect that managers can assess and anticipate the
likelihood of a future stock price crash, because insiders are in charge of corporate decision
making and in possession of varied sorts of private information. So the aim of our study is to link
insider sales to future stock price crash risk, rather than to the unforeseen future stock price
crashes. In so doing, we investigate whether insiders’ anticipation of future stock price crash risk
incentivizes the insiders to sell stocks beforehand.
Insider sales could be driven by insiders’ liquidity needs or investment diversification
objectives (Frankel and Li, 2004; Lustgarten and Mande, 1995; Carpenter and Remmers, 2001;
Seyhun, 1990). It is usually hard for investors to discern and authenticate information-motivated
sales from liquidity- or diversification-motivated sales (Beneish and Vargus, 2002). This
provides insiders with incentives to engage in opportunistic stock sales. Therefore, we posit that
in securing personal benefits, insiders have an incentive to sell their stocks in anticipation of high
4
future crash risk, despite the potential litigation risk associated with insider sales.
We next carry out a couple of cross-sectional analyses of the positive association between
insider sales and future stock price crash risk. Insider sales by themselves could signal insiders’
gloomy expectations about firms’ future prospects. If firms in financial constraints involve in
insider sales, they will find it more difficult to finance their investments and operations, thereby
making the firms suffer from even more severe financial constraints. Thus, financial constrained
firms should be less likely to engage in insider sales based on future crash risk. This results in the
positive association between insider sales and future crash risk being weaker for firms that face
financial constraints.
Theories and empirical evidence (Huddart and Ke, 2007; Grossman and Stiglitz, 1980;
Glosten and Milgrom, 1985; Kyle, 1985) both show that the profitability of insider trades
increases with the degree of information asymmetry between insider and outsiders. If a firm has
high information asymmetry with outsiders, its insiders should have a stronger incentive to sell
stocks on the basis of their assessed future stock price crash risk. Therefore, we expect that the
positive association between insider sales and future crash risk is stronger for firms that have
high information asymmetry between insiders and outsiders.
The Sarbanes-Oxley Act (SOX) was enforced in 2002 with an aim of improving corporate
governance and financial reporting process. Stronger corporate governance and high information
transparency limit opportunistic insider trades that are to the detriment of shareholders (e.g.,
Gunny et al., 2008; Ravina and Sapienza, 2010; Jagolinzer et al., 2011; Dai et al., 2015).
Furthermore, SOX required insiders to report their trades to the SEC within two business days,
5
which replaces the old provision that had allowed insiders to wait till the tenth day of the next
calendar month. As such, SOX made all the insider trade transactions disclosed more timely to
market participants, which imposed a curb on opportunistic insider trades (Brochet, 2010). In
this vein, insiders should abstain from trading on their appraised future crash risk. Therefore, we
expect that the positive association between insider sales and future crash risk becomes less
pronounced after the implementation of SOX.
Our empirical analysis is conducted based on a sample of 32,085 firm-year observations
over a sample period of 1992-2013. While we use different measures of crash risk in the
robustness checks, our main tests are based on the one developed by Hutton et al. (2009). As
expected, we find that inside sales are significantly, positively associated with future crash risk,
and that this positive association is more pronounced for firms that have high information
asymmetry between insiders and outsiders but less pronounced for firms that are in financial
constraints or in the post SOX period. All our regressions include a comprehensive list of
variables that are likely correlated with both insider sales and crash risk, and the results are
insensitive to the use of firm-fixed effect model to mitigate potential omitted variable bias.
Our study’s objective is to test whether insiders’ anticipation of future crash risk
incentivizes the insiders to sell stocks in advance. The direction of causality is that future crash
risk impacts insider sales decisions. But insider selling might by itself affect stock price crash
risk in the cross-section. In particular, insider sales accelerate the speed of bad news being
impounded in stock prices and move prices towards fundamental value, thereby mitigating stock
price crash risk. However, this negative, contemporaneous association between insider sales and
6
crash risk is unlikely to explain the positive association between insider sales and future crash
risk. Hence, the reverse causality issue would not pose a threat against our empirical analysis.
Furthermore, our results for the cross-sectional analysis also help rule out the reverse causality
possibility. In particular, we would be unlikely to observe that the association between insider
sales and future stock price crash risk varies systematically with financial constraints or
information asymmetry if insider sales cause stock price crash risk.
One might argue that some regulatory events as to insider trades could be used as a natural
experiment to conduct a cross-country analysis of the association between insider sales and stock
price crash risk. But this cross-country study only allows us to test the contemporaneous
association between insider sales and crash risk (i.e., whether insider selling has a negative,
causal impact on crash risk in the contemporaneity),1 which is beyond the scope of our study.2
What’s more, any regulatory restriction on insider trades applies to both insider sales and insider
purchases. So the use of the enactments or enforcements of insider trading laws in a natural
experiment cannot disentangle insider purchasing versus insider selling incentives. Hence, we
maintain our analysis at the firm-level context in this study.
Our study contributes to the literature in several ways. First, the insider trading literature
finds that insiders tend to trade on foreknowledge of bad news corporate events including
bankruptcies (Gosnell et al., 1992; Syhun and Bradley, 1997), dividend announcements (John
1 If the hypothesis that insider sales decrease stock price crash risk in the cross-section holds, then one would
expect to find that stock price crash risk increases following the regulatory restrictions on insider sales.
Nevertheless, the objective of our study is to examine the lead-lag association between insider sales and stock
price crash risk, which is hypothetically positive. 2 Prior research has already documented that insider trading per se accelerates price discovery process and
increases the efficiency of stock prices (e.g., Manne, 1966; Carlton and Fischel, 1983; Leland, 1992; Piotroski
and Roulstone, 2005). Thus, the contemporaneous relationship between insider sales and stock price crash risk
is not the focus of interest in our study.
7
and Lang, 1991), disclosures of internal control weaknesses (Skaife et al., 2013), SEC
enforcement actions (Beneish, 1999; Johnson et al., 2009; Thevenot, 2012), announcements of
accounting misstatements (Badertscher et al., 2011; Agrawal and Cooper, 2015), disclosures of
negative SEC comment letters (Dechow et al., 2016), breaks in a series of consecutive increases
in quarterly earnings (Ke et al., 2003), and earnings disappointments (e.g., Beneish and Vargus,
2002; Darrough and Rangan, 2005). Their evidence suggests that insider sales are informative,
which runs contrast with another view that insider sales are driven by insiders’ needs for personal
liquidity and diversifications. Our study extends this strand of literature by linking insider sales
with future stock price crash risk that results from bad news hoarding. Because firm-specific
stock price crash risk is a result of managers’ withholding of varied sorts of bad news, it provides
a more powerful, generalized setting for us to examine the informativeness of insider sales. By
showing that insider sales are positively, significantly associated with future crash risk, we
corroborate the information role of insider sales.
Second, the crash risk literature (e.g., Chen et al., 2001; Jin and Myers, 2006; Hutton et al.,
2009; Kim et al., 2011a, 2011b; Kim and Zhang, 2015; He, 2015; DeFond et al., 2015) focuses
predominantly on the determinants of stock price crash risk. Nevertheless, little research
attention has been paid to the consequences of crash-risk exposures on managers’ decision-
making. We fill this gap in the literature by showing that crash risk exposures incite insiders to
sell stocks beforehand to extract private benefits.
Last but not least, our study has important practical implications. Our results suggest that
insider sales could forecast future stock price crash risk as far as three years ahead. Thus, market
8
participants can use insider sales in ex ante assessing the likelihood of a future stock price crash,
and in therein appraising the likelihood and extent of insiders’ bad news hoarding. This is in
particular relevant to investors for their portfolio investment decisions, and to suppliers and
creditors who monitor the creditworthiness of their clients. Also, our evidence which suggests
that insiders tend to exploit foreknowledge of future crash risk should be of particular interest to
(i) boards of directors contemplating the design of optimal equity incentive compensation
schemes for executives, and (ii) policymakers and regulators regulating insider trading and
corporate disclosure transparency. We further amplify and enrich these practical implications by
showing that the predictive power of insider sales for future crash risk varies on financial
constraints, information opacity, and regulatory regime changes as to SOX, which is yet another
important, new feature of our study to the practitioners.
The rest of the paper proceeds as follows. In Section 2, we review the related literature and
develop the testable hypotheses. Section 3 describes the data sources and variable measures.
Section 4 presents the research design. Section 5 discusses the results. Section 6 conducts the
additional tests, and Section 7 concludes.
2. Literature review and hypothesis development
2.1. The association between insider sales and future stock price crash risk
With separation of ownership and control, managers have incentives to expropriate wealth
from shareholders (Jensen and Meckling, 1976), and to withhold corporate bad news that is
associated with the wealth expropriation. Even if managers do not have the incentive to
9
deliberately extract rents from shareholders, they might operate corporate business in ways that
induce adverse operating outcomes for their firms. In such case, incentives also arise for the
managers to conceal bad news on account of compensation and career concerns (Graham et al.,
2005; Ball, 2009; Kothari et al., 2009). Moreover, nondisclosure occurs either because
information sender is not informed of any news or because the sender is hiding bad news (Dye,
1985; Jung and Kwon, 1988), whereby making it difficult for outsiders to unravel a firm’s bad
news hoarding. This further strengthens managers’ incentives to withhold bad news to secure
their private benefits.
However, when the withheld bad news accumulates and reaches a tipping point, managers
cannot withhold it any longer. At that point, all the bad news would come out at once, resulting
in a stock price crash (e.g., Jin and Myers et al., 2006; Hutton et al., 2009). Once the stock price
crash of a firm occurs, outsiders would realize that the firm has withheld bad news, most likely,
opportunistically. As such, insiders would not only be penalized by the bad news per se, but also
be subject to high litigation risk and great reputational losses for having hoarded the bad news
(e.g., Skinner, 1994; Skinner, 1997; Field et al., 2005). So presumably, managers are not willing
to see a stock price crash happening. Provided that managers are able to anticipate the maximum
amount of bad news they can withhold, they would take actions (e.g., releasing some good news,
optimistically biasing information disclosures, or stopping further withholding bad news) to
prevent the occurrence of a stock price crash when the accumulated bad news approaches the
upper threshold point. However, it is usually difficult for managers to foresee such threshold
point (He, 2015), because the maximum level of bad news that managers can withhold varies
10
unforeseeably at different points in time, depending on a firm’s changing external environments
and internal business. This explains why stock price crashes, albeit attracting high regulatory
scrutiny and litigation, still happen quite often in practice.
Though insiders often cannot foresee the threshold point at which stock price would crash,
it is still reasonable to expect that insiders, who run corporate business all the way and are in
possession of varied kinds of private information, are able to appraise and anticipate the
likelihood of a future stock price crash --- stock price crash risk. This presumption is built on the
prior research which finds that insiders actively trade on their foreknowledge of future bad news
events. For instance, Seyhun and Bradley (1997) find significant amount of insider sales that
occurs prior to the filing date of bankruptcy petitions. John and Lang (1991) document that a
dividend announcement is bad news for growth firms since it signals lack of profitable
investment opportunities, and insiders in such firms tend to sell shares prior to the
announcements of dividend initiations. Skaife et al. (2013) find that the profitability of insider
selling is particularly high in the years leading up to disclosures of material internal control
weaknesses. Beneish (1999), Johnson et al. (2009), Thevenot (2012), and Agrawal and Cooper
(2015) find that insiders sell substantially more stocks before revelations of accounting
irregularities. Dechow et al. (2016) show that insider sales are significantly higher than normal
levels prior to the public releases of SEC comment letters relating to aggressive revenue
recognition, and that the higher pre-disclosure sales are associated with a stronger negative drift
following the comment letter release date. Ke et al. (2003) find that insider sales increase three to
nine quarters prior to a break in a string of consecutive increases in quarterly earnings.
11
Collectively, this strand of literature suggests that insiders can foresee future bad news events
and trade intensively to exploit their information advantage. Since stock price crash is an
outcome of insiders’ bad news hoarding (e.g., Hutton et al., 2009), we posit that insiders can
appraise the likelihood of a future stock price crash and are inclined to sell stocks on the basis of
their crash risk appraisals to secure personal monetary benefits.
Insider selling can be attributed either to insiders’ exploitation of negative private
information (e.g., Lakonishok and Lee, 2001) or to their liquidity needs or investment portfolio
diversifications (Frankel and Li, 2004; Lustgarten and Mande, 1995; Carpenter and Remmers,
2001; Seyhun, 1990). In the latter case, insiders should not be blamed or charged for their stock
sales. But it is often difficult for investors to distinguish information-driven sales from liquidity-
or diversification-driven sales (Beneish and Vargus, 2002). Even if investors could manage to
distinguish out the two, insiders could defend themselves from litigation risk in a way that
information-driven sales are argued to be non-informational motivated. This heightens managers’
incentives to engage in insider sales based on appraised future crash risk, notwithstanding the
potential litigation risk associated with this strategic behavior. The discussion above leads to our
first hypothesis stated in the alternative form as follows.
H1: Insider sales are positively associated with future stock price crash risk.
A potential countervailing force that plausibly weakens H1 is litigation risk associated
with insider sales. In a narrow circumstance, trading immediately (e.g., within one quarter or
shorter) before price-relevant corporate events would trigger substantive litigation risk (e.g.,
Garfinkel, 1997; Huddart et al., 2007), compared with trading relatively long beforehand. To
12
alleviate this concern, we allow for a 3-month interval between the measurement window of
insider selling and of crash risk in our research design. Even if this concern is not eliminated, it
would only create bias towards H1. Hence, we maintain H1 as a directional hypothesis for our
empirical analysis.
2.2. Cross-sectional variations of the association between insider sales and future stock price
crash risk
Per Lamont et al. (2001), financial constraints refer to frictions that prevent a firm from
funding its desired investments. Prior studies (e.g., Lakonishok and Lee, 2001; Jeng et al., 2003;
Fidrmuc et al., 2006) document that insider selling could by itself convey unfavorable
information to the market and that share prices decrease in response to insider sales. Because of
the information effect of insider sales, financial constrained firms, if involved in insider sales,
would find it more difficult to raise external capital for investments and operations (Campello et
al., 2010; Ataullah et al., 2014), and consequently, their financial constraints would be further
exacerbated. Thus, confronted with financial constraints for firms, insiders should refrain from
trading on future stock price crash risk. This leads to our second hypothesis as follows.
H2: The positive association between insider sales and future stock price crash risk is less
pronounced for firms that face financial constraints.
Insider trading is fundamentally driven by insiders’ information advantage over outside
investors. Theories suggest (Grossman and Stiglitz, 1980; Glosten and Milgrom, 1985; Kyle,
1985; Huddart and Ke, 2007) that the larger the magnitude of information asymmetry between
13
insiders and outsiders, the higher trading profits insiders could reap from their stock trades.
Consistent with this notion, Frankel and Li (2004) find some evidence that the association
between insider sales and subsequent returns, which is used as a proxy for the profitability of
insider trades, is weaker for firms that experience an increase in financial statement
informativeness and in analyst following. Lakonishok and Lee (2001) find that firm size, an
inverse measure of information asymmetry, is negatively associated with the extent to which
insider trades predict future stock returns. Aboody and Lev (2000) predict and find that an
increase in information asymmetry between insiders and outsiders, which results from R&D
activities, allows insiders to gain higher profits from stock trades. Given the higher trading
profitability insiders can obtain from firms with high information asymmetry, insiders in such
firms should have stronger motives to trade aggressively in anticipation of high future crash risk.
We therefore have the third hypothesis as follows.
H3: The positive association between insider sales and future stock price crash risk is more
salient for firms that have high information asymmetry between insiders and outsiders.
The Sarbanes-Oxley Act was implemented in 2002 with the objective of improving
corporate governance and financial reporting quality. A number of studies provide supportive
evidence that SOX achieved this objective. For example, Arping and Sautner (2013) find that
analyst earnings forecasts become more accurate and less dispersed after the passage of SOX,
suggesting that SOX made firms less opaque. Iliev (2010) finds evidence that SOX increased
earnings quality for both domestic and foreign firms. Skaife et al. (2009) document that by
mandating management evaluation and independent audits of internal control effectiveness, SOX
14
could lower information risk and cost of equity for firms.
We expect that SOX reduced opportunistic crash-risk-based insider sales for three reasons.
First, separation of ownership and control induces incentive misalignment between managers
and shareholders and thereby drives managers’ motives to extract rents from shareholders
(Jensen and Meckling, 1976). One way for the managerial rent extraction is insider trades
whereby insiders (i.e., informed traders) profit at the expense of shareholders (i.e., uninformed
traders) (e.g., Seyhun, 1986; Fishman and Hagerty, 1992; Bettis et al., 2000; Jagolinzer et al.,
2011). Given that corporate governance is intended to align managers’ interests with those of
shareholders, it follows that strong corporate governance should mitigate opportunistic insider
sales that are detrimental to shareholders. In this vein, if SOX ameliorated corporate governance
for firms, insiders should be less likely to trade on future crash risk after the enforcement of
SOX.
Second, prior studies (e.g., Kyle, 1985; Huddart and Ke, 2007) show that low information
opacity reduces the profitability of insider trades. Provided that SOX improved disclosure
transparency and the quality of financial reporting for firms, information asymmetry between
insiders and outsiders would become lower. As such, insiders would profit less from their
informed trades, and accordingly, have smaller incentives to sell stocks on the basis of their
appraised future crash risk.
Third, before the passage of SOX, insiders could opt to report to the SEC their stock
transactions by the tenth day of the next calendar month. But in the post SOX era, insiders are
required to report all their trades to the SEC within two business days. This made the insider
15
trading information being disclosed more promptly to the public. Consequently, insiders would
be less likely to sell stocks before negative stock returns so as to avoid a potential legal jeopardy
(Brochet, 2010). In this respect, we also expect that SOX weaken insiders’ incentives to trade on
future stock price crash risk. Based on the above discussion, we have the fourth hypothesis as
follows.
H4: The positive association between insider sales and future stock price crash risk is weaker
after the implementation of SOX.
3. Data and variable measurement
3.1. Data sources and sample
Our empirical analysis is based on data collected primarily from I/B/E/S, CRSP,
Compustat, and Thomson Financial. Insider trading data are obtained from Thomson Financial
Insider Research Services Historical Files. Consistent with Huddart and Ke (2007) and Huddart
et al. (2007), insider trading transactions used in our empirical tests are restricted to open market
trades, exclusive of non-open market trades such as option grants, option exercises, dividend
reinvestments, stock transfers among family members, and pension transactions. We further limit
the insider trading transactions to those by officers and directors only, excluding those by lower-
tier officers or non-officer insiders who are unlikely to impact major corporate decisions.3 To
3 Our results remain qualitatively unchanged if we use the insider trades by CEOs, CFOs, and chairmen of
board (namely, senior insiders) only.
16
focus on the aggregate influence of the management team, we sum the purchases and sales by all
top managers of the same firm in the fiscal years of interest.4
We obtain financial analyst data from I/B/E/S. Other data are taken from CRSP and
Compustat. Our sample period ranges from 1992 to 2013. We require that firms have necessary
data from CRSP, Compustat, I/B/E/S, and Thomson Financial to construct the variables of
interest for our empirical tests. The final sample for testing the association between insider sales
and future stock price crash risk comprises 32,085 firm-year observations for 7,213 unique firms.
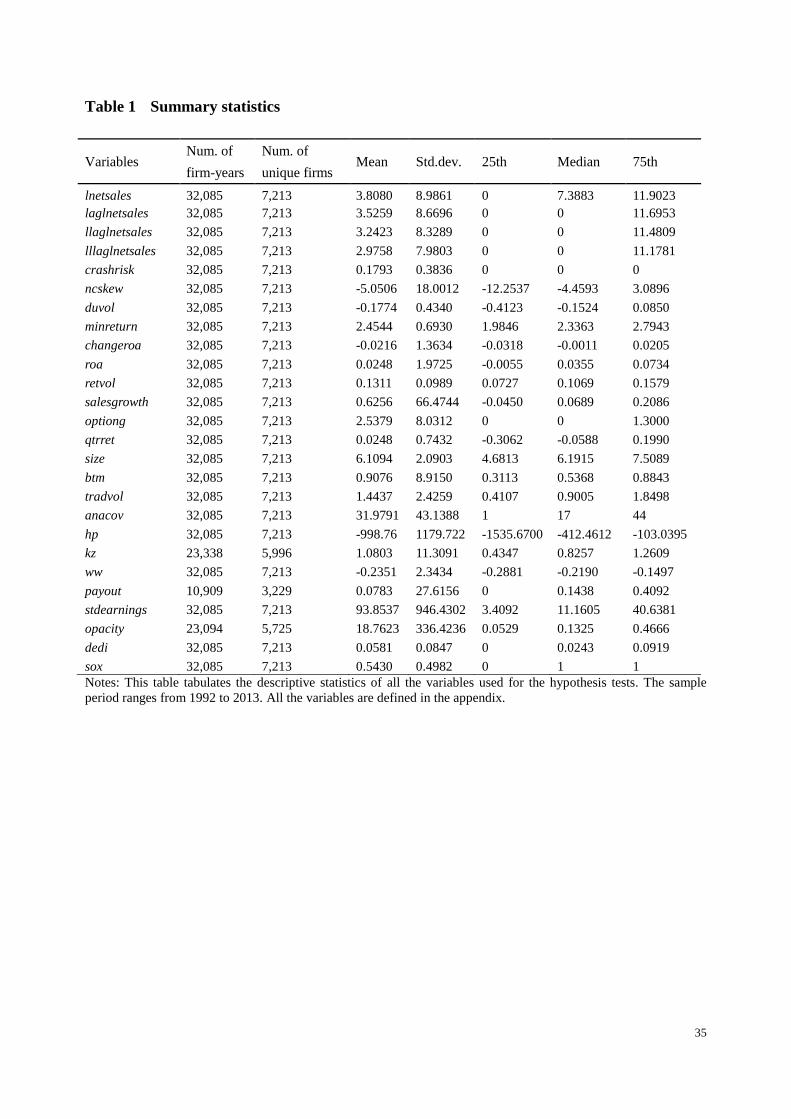
Table 1 reports the summary statistics of all the variables used in our hypothesis tests.
3.2. Measures of firm-specific stock price crash risk
Following Chen et al. (2001), Hutton et al. (2009), Kim et al. (2011a, b), and Defond et al.
(2014), among others, we employ four measures of stock price crash risk. First is the likelihood
of negative, extreme firm-specific weekly returns over a fiscal year (namely, crashrisk) as per
Hutton et al. (2009). Crashrisk equals 1 if a firm experiences one or more firm-specific weekly
returns falling 3.2 standard deviations below the mean firm-specific weekly returns over a fiscal
year and 0 otherwise.5 Our second crash risk measure (namely, ncskew) follows Chen et al.
(2001) and is the negative third moment of each stock’s firm-specific weekly returns. The third
measure of crash risk (namely, ncskew) is the down-to-up variance of firm-specific weekly
returns as per Chen et al. (2001). Duvol equals the standard deviation of down-week firm-
4 For a given firm in a fiscal year, some insiders might be selling while others might be buying. In this case,
insider purchases will be subtracted from insider sales to reflect the net direction of insider sales in that fiscal
year. 5 We obtain similar results using the number of crash weeks over a fiscal year to measure crash risk.
17
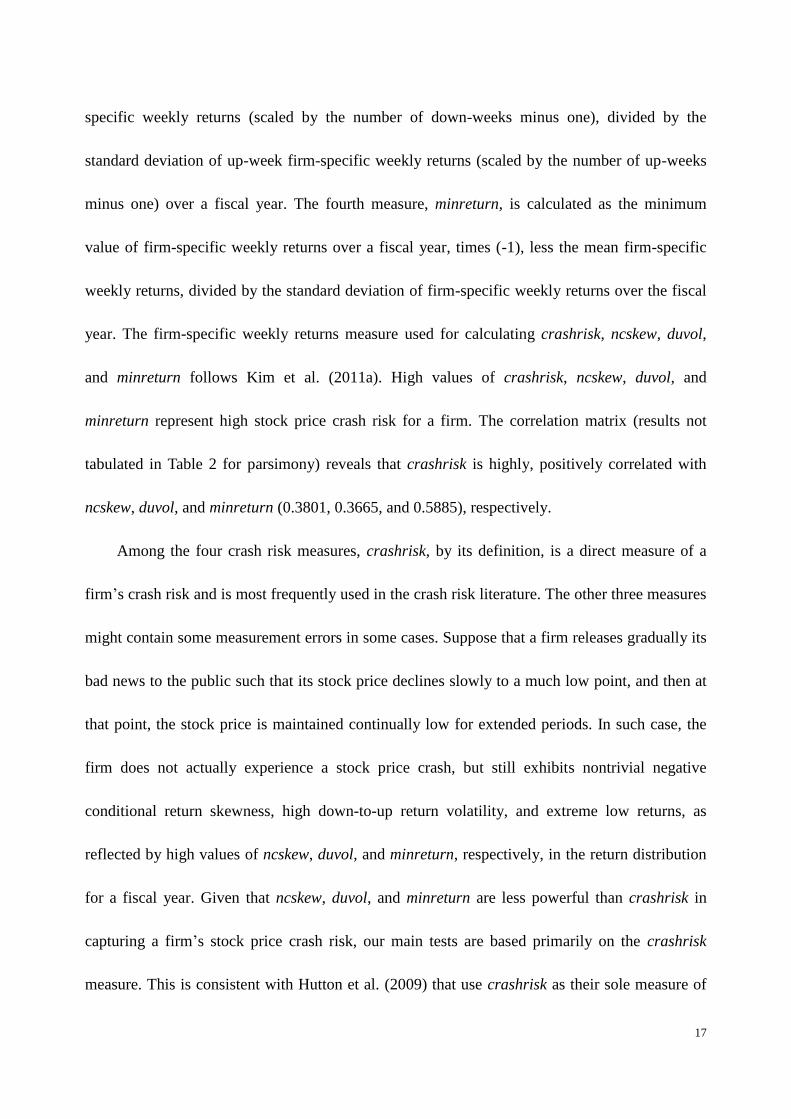
specific weekly returns (scaled by the number of down-weeks minus one), divided by the
standard deviation of up-week firm-specific weekly returns (scaled by the number of up-weeks
minus one) over a fiscal year. The fourth measure, minreturn, is calculated as the minimum
value of firm-specific weekly returns over a fiscal year, times (-1), less the mean firm-specific
weekly returns, divided by the standard deviation of firm-specific weekly returns over the fiscal
year. The firm-specific weekly returns measure used for calculating crashrisk, ncskew, duvol,
and minreturn follows Kim et al. (2011a). High values of crashrisk, ncskew, duvol, and
minreturn represent high stock price crash risk for a firm. The correlation matrix (results not
tabulated in Table 2 for parsimony) reveals that crashrisk is highly, positively correlated with
ncskew, duvol, and minreturn (0.3801, 0.3665, and 0.5885), respectively.
Among the four crash risk measures, crashrisk, by its definition, is a direct measure of a
firm’s crash risk and is most frequently used in the crash risk literature. The other three measures
might contain some measurement errors in some cases. Suppose that a firm releases gradually its
bad news to the public such that its stock price declines slowly to a much low point, and then at
that point, the stock price is maintained continually low for extended periods. In such case, the
firm does not actually experience a stock price crash, but still exhibits nontrivial negative
conditional return skewness, high down-to-up return volatility, and extreme low returns, as
reflected by high values of ncskew, duvol, and minreturn, respectively, in the return distribution
for a fiscal year. Given that ncskew, duvol, and minreturn are less powerful than crashrisk in
capturing a firm’s stock price crash risk, our main tests are based primarily on the crashrisk
measure. This is consistent with Hutton et al. (2009) that use crashrisk as their sole measure of
18
crash risk. As reported in Table 1, the mean value of crashrisk is 0.1793, indicating that firm-
specific stock price crash risk for a year amount to 17.93%. This is close to that of Hutton et al.
(2009) though they use a shorter sample period than ours.
3.3. Measures of insider sales
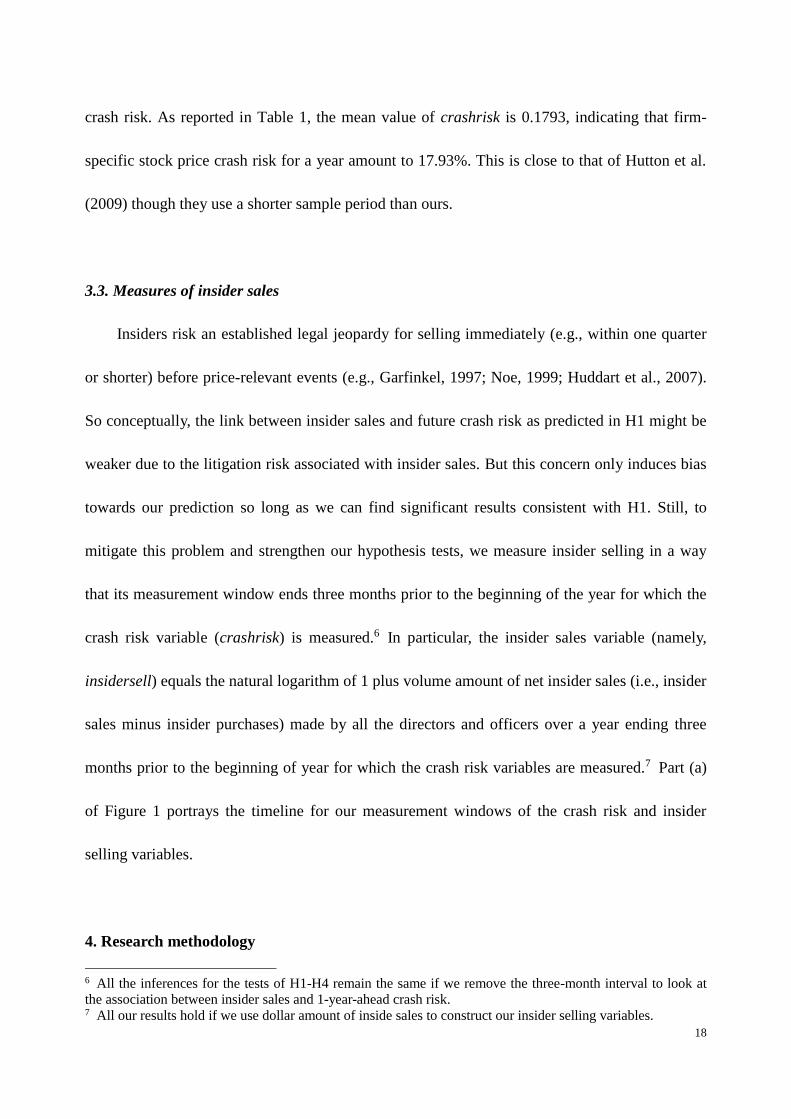
Insiders risk an established legal jeopardy for selling immediately (e.g., within one quarter
or shorter) before price-relevant events (e.g., Garfinkel, 1997; Noe, 1999; Huddart et al., 2007).
So conceptually, the link between insider sales and future crash risk as predicted in H1 might be
weaker due to the litigation risk associated with insider sales. But this concern only induces bias
towards our prediction so long as we can find significant results consistent with H1. Still, to
mitigate this problem and strengthen our hypothesis tests, we measure insider selling in a way
that its measurement window ends three months prior to the beginning of the year for which the
crash risk variable (crashrisk) is measured.6 In particular, the insider sales variable (namely,
insidersell) equals the natural logarithm of 1 plus volume amount of net insider sales (i.e., insider
sales minus insider purchases) made by all the directors and officers over a year ending three
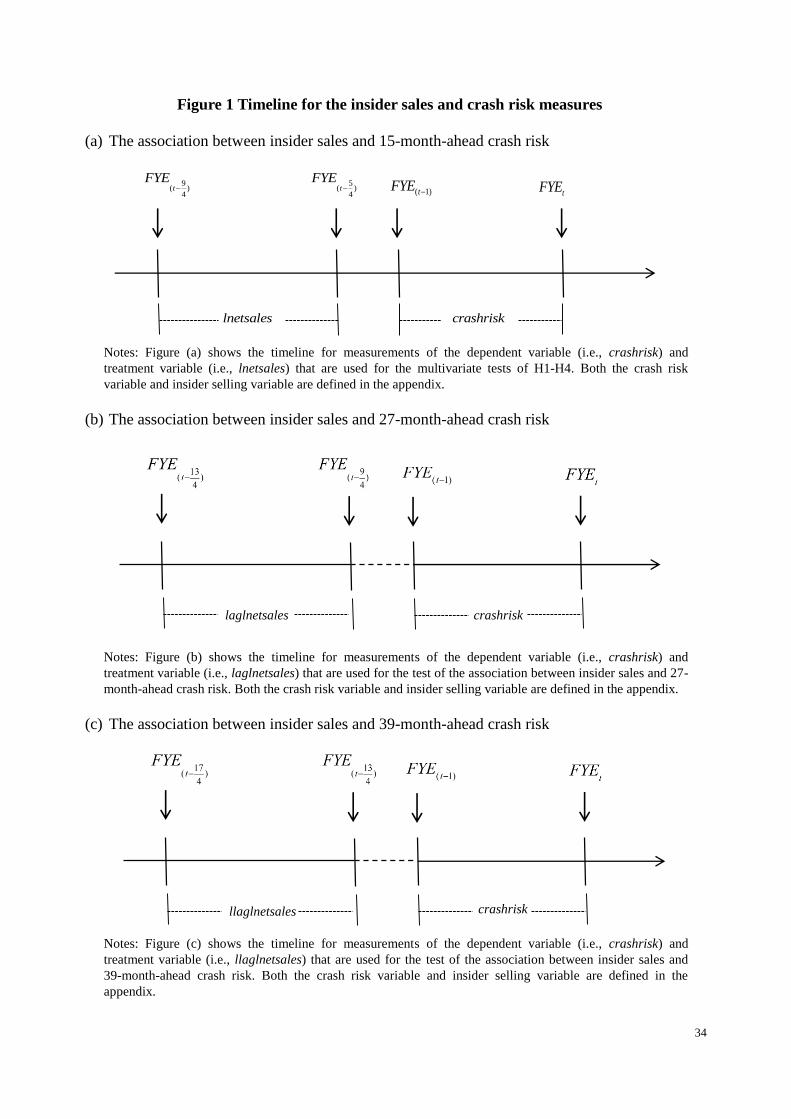
months prior to the beginning of year for which the crash risk variables are measured.7 Part (a)
of Figure 1 portrays the timeline for our measurement windows of the crash risk and insider
selling variables.
4. Research methodology
6 All the inferences for the tests of H1-H4 remain the same if we remove the three-month interval to look at
the association between insider sales and 1-year-ahead crash risk. 7 All our results hold if we use dollar amount of inside sales to construct our insider selling variables.
19
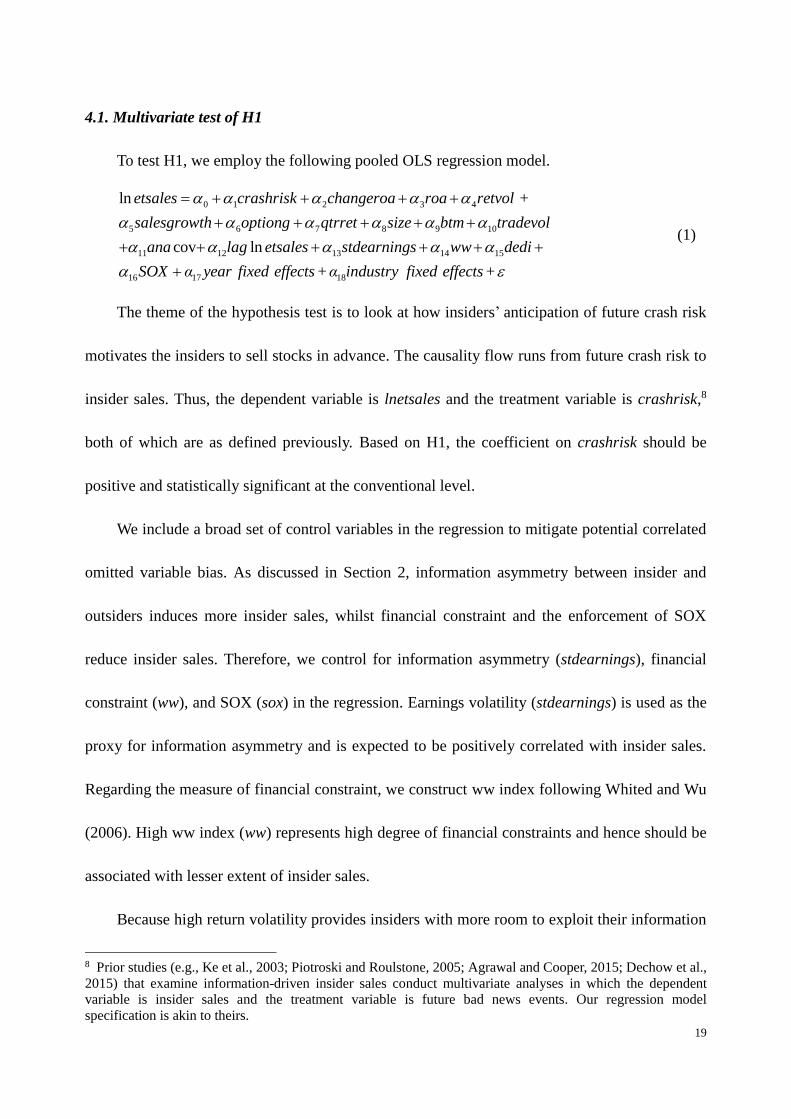
4.1. Multivariate test of H1
To test H1, we employ the following pooled OLS regression model.
0 1 2 3 4
5 6 7 8 9 10
11 12 13 14 15
16 17 18
ln +
cov ln
etsales crashrisk changeroa roa retvol
salesgrowth optiong qtrret size btm tradevol
ana lag etsales stdearnings ww dedi
SOX α year fixed effects+α ind
ustry fixed effects+
(1)
The theme of the hypothesis test is to look at how insiders’ anticipation of future crash risk
motivates the insiders to sell stocks in advance. The causality flow runs from future crash risk to
insider sales. Thus, the dependent variable is lnetsales and the treatment variable is crashrisk,8
both of which are as defined previously. Based on H1, the coefficient on crashrisk should be
positive and statistically significant at the conventional level.
We include a broad set of control variables in the regression to mitigate potential correlated
omitted variable bias. As discussed in Section 2, information asymmetry between insider and
outsiders induces more insider sales, whilst financial constraint and the enforcement of SOX
reduce insider sales. Therefore, we control for information asymmetry (stdearnings), financial
constraint (ww), and SOX (sox) in the regression. Earnings volatility (stdearnings) is used as the
proxy for information asymmetry and is expected to be positively correlated with insider sales.
Regarding the measure of financial constraint, we construct ww index following Whited and Wu
(2006). High ww index (ww) represents high degree of financial constraints and hence should be
associated with lesser extent of insider sales.
Because high return volatility provides insiders with more room to exploit their information
8 Prior studies (e.g., Ke et al., 2003; Piotroski and Roulstone, 2005; Agrawal and Cooper, 2015; Dechow et al.,
2015) that examine information-driven insider sales conduct multivariate analyses in which the dependent
variable is insider sales and the treatment variable is future bad news events. Our regression model
specification is akin to theirs.
20
advantage and to profit from their stock trades, we include return volatility (retvol) and expect it
to be positively related to insider sales. Strong external monitoring restrains opportunistic
informed trades, so we control for analyst coverage (anacov) and dedicated institutional
ownership (dedi). Presumably, large analyst coverage and high dedicated institutional ownership
are associated with more intense external monitoring (e.g., Chen et al., 2007; Chen et al., 2015)
and thus with less informed insider sales. We control for firm size (size) because insiders in large
firms sell more stocks (Lakonishok and Lee, 2001). We include the number of option grants
(optiong), as Ofek and Yermack (2000) find that insiders sell more shares when granted more
stock options. We include sales growth (salesgrowth), since Rozeff and Zaman (1998) find that
insiders in growth firms sell more stocks.
Piotroski and Roulstone (2005) find that insider trades are positively related to future
earnings performance (a proxy for insiders’ superior knowledge about future cash flow
realizations), positively associated with book-to-market ratio, and negatively related to recent
returns (proxies for insiders’ contrarian beliefs). Hence, we control for returns on assets (roa),
change in returns on assets (changeroa), book-to-market ratio (btm), and buy-and-hold stock
returns (qtrret). High trading volume is associated with a great difference in opinions among
investors (Chen et al., 2001) and hence with a high likelihood of mispricing. Since insiders have
incentives to trade against mispricing, trading volume should be positively associated with
insider trades. We therefore include trading volume (tradevol) and expect it to be positively
related to insider sales. The controls of tradvol and qtrret also reduce correlated omitted variable
bias induced by potential fundamental-related events. Following Cheng and Lo (2006), we also
21
include lagged insider sales to further control for unobserved factors that drive insider sales. All
the control variables are defined in the appendix. Last, we include industry and year fixed effects
in the regression model to control for any systematic variation in insider sales across industries
and over years.
4.2. Tests of H2-H4
For ease of interpretation of the coefficients and to mitigate measurement problems, we
adopt subsample analyses to test H2-H4. In testing H2, we use four proxies for financial
constraints: (i) ww index developed by Whited and Wu (2006); (ii) hp index developed by
Hadlock and Pierce (2010); (iii) kz index developed by Kaplan and Zingales (1997); (iv)
dividend payout ratio used by Denis and Sibikov (2010). Ww index, hp index, and kz index are
coded in a way that higher values represent higher financial constraints. Dividend payout ratio
runs the opposite: high dividend payout indicates less financial constraints (Fazzari et al., 1988).
The detailed definitions of these variables are defined in the appendix. We partition the full
sample into two subsamples based on the sample median of ww index, hp index, and kz index
respectively, and on an indicator variable for whether a firm has dividend payout for a fiscal year.
Then we estimate model (1) separately for the two subsamples that are created based on the four
financial constraint indicators, respectively. If H2 holds, the coefficient on crashrisk should be
incrementally less positive for the high financial constraint subsample than for the low financial
constraint subsample.
To test H3, we first split the full sample into two subsamples based on the sample median of
22
the measures of information asymmetry. Two information asymmetry proxies are used. First is
earnings volatility (stdearnings). The second proxy is financial opacity (opacity) measured using
Hutton et al.’s (2009) approach. Both proxies are defined in the appendix. High values of
earnings volatility and of financial opacity indicate high information asymmetry. We estimated
model (1) separately for the two subsamples. H3 predicts that the coefficient on crashrisk for the
high information asymmetry subsample is incrementally positive than that for the low
information asymmetry subsample.
To test H4, we divide the full sample into two subsamples based on an indicator variable for
whether a firm is in the post or pre-SOX period, and run model (1) separately for these two
subsamples. In supporting H4, crashrisk should have an incrementally positive coefficient in the
pre-SOX subsample than in the post SOX subsample.
If we find results consistent with H2-H4, we can tease out the endogeneity concern ascribed
to reverse causality. Insider trading by itself helps push stock prices towards fundamental value
(Piotroski and Roulstone, 2005), thus reverse causality might arise in a way that insider sales
reduce stock price crash risk. Unlike the predictions in H2-H4 that are related to managerial
opportunism, the underlying rationale for the reverse causality has nothing to do with managerial
opportunistic incentives. Thus, if insider sales are the cause of stock price crash risk, then we
would not find that the positive association between insider sales and future crash risk varies
with information asymmetry, financial constraints, or SOX implementation. In this regard, the
cross-sectional variation analysis serves as a falsification test that helps rule out the reverse
causality possibility. Furthermore, because the reverse causality pertains to a negative,
23
contemporaneous association between insider sales and crash risk, it is unlikely to explain the
positive, lead-lagged association between insider sales and crash risk as predicted in H1.
5. Empirical results
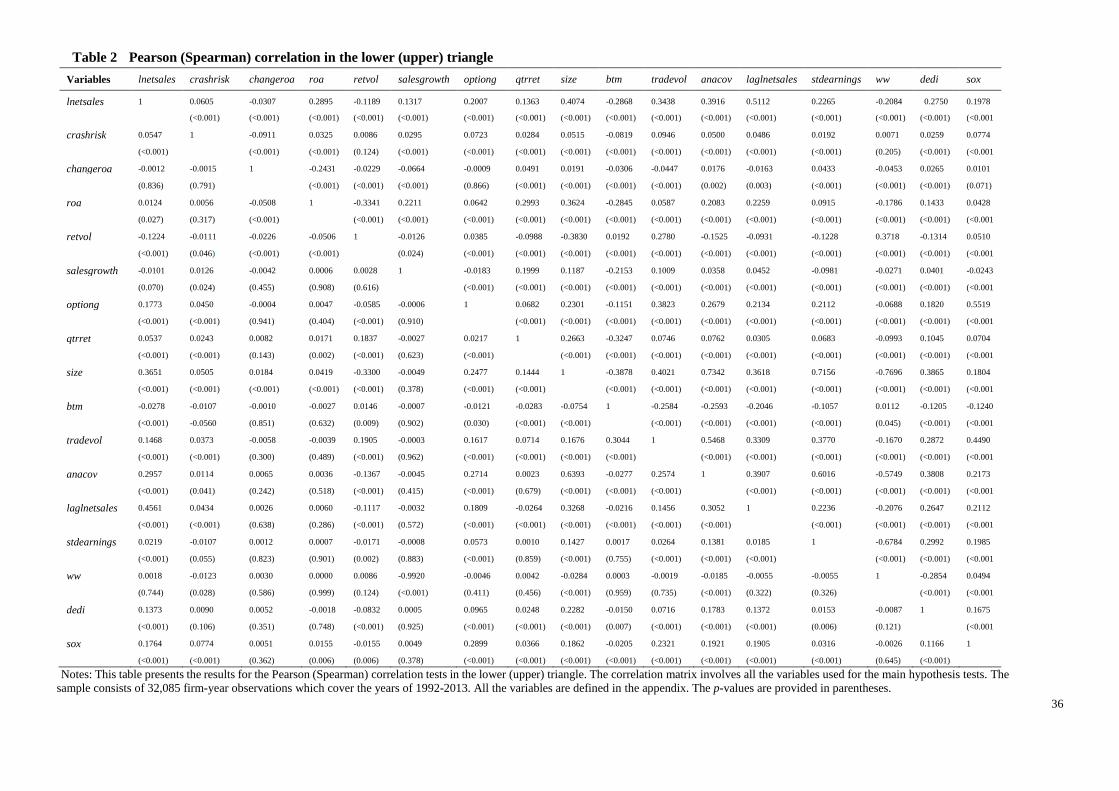
As shown in Table 2, the Pearson (Spearman) correlation between lnetsales and crashrisk is
positive (0.0547 (0.0605)) and statistically significant at less than 1% level, which provides
initial support for H1. All the variables in Table 2 are not highly correlated with each other,
indicating no multicollinearity arising should these variables be used for the multivariate tests of
our hypotheses.
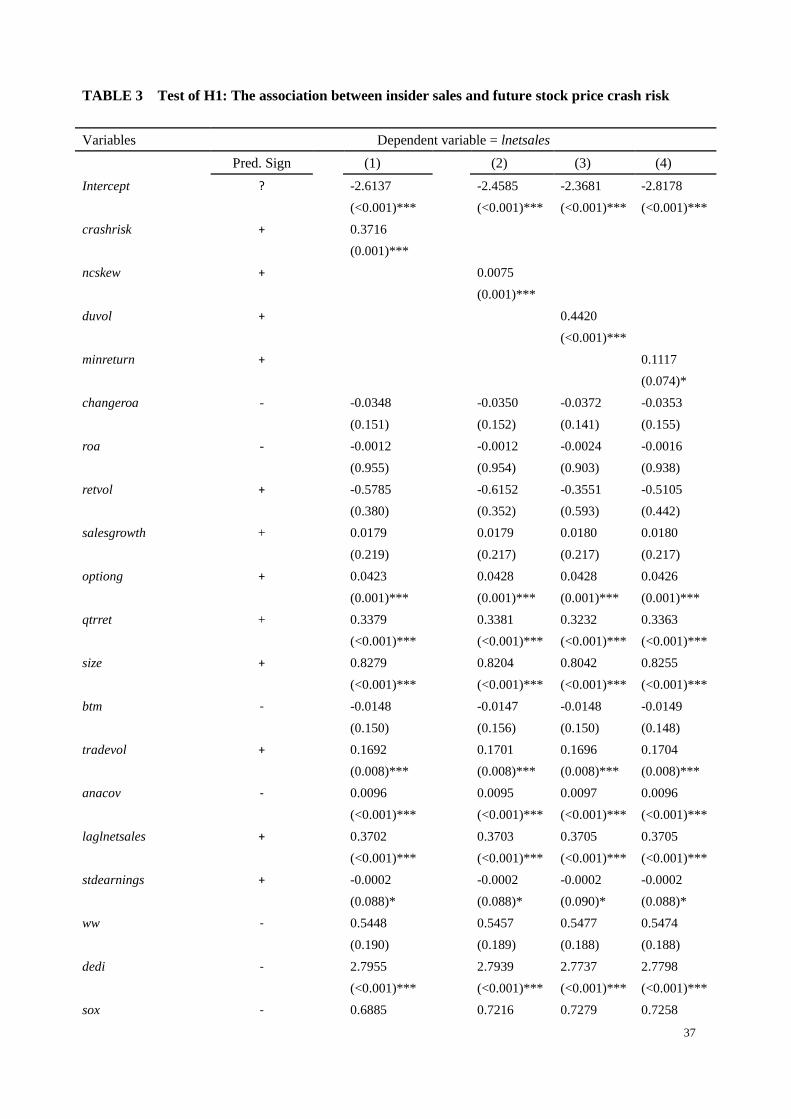
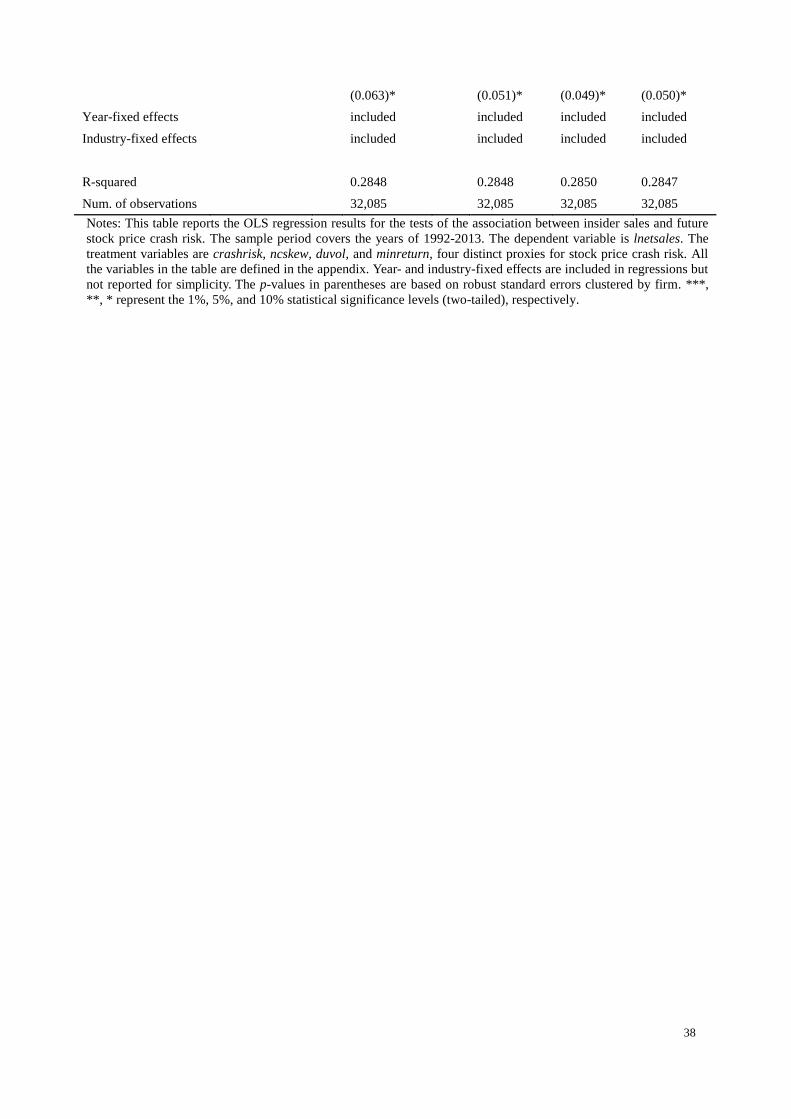
Table 3 reports the regression results for the test of the association between insider sales and
future stock price crash risk. The coefficient for crashrisk is positive and statistically significant
at the 0.1% level. One unit change in crashrisk leads to change of 0.3716 in letsales, which
accounts for 9.8% of the mean value of lnetsales for our sample and is economically significant.
This result supports H1 that insider sales are positively correlated with future crash risk. This
suggests that insiders are able to assess and anticipate the likelihood of a future stock price crash
that results from bad news hoarding, and that this motivates the insiders to sell stocks in
anticipation of high future crash risk. We check the robustness of the main results using
alternative measures of crash risk, namely, duvol, ncskew, and minreturn that are mentioned in
Section 3.2. Results are reported in Columns (2)-(4), and our inferences remain unchanged.
Table 4 reports the regression results for model (1) that is estimated separately for two
subsamples comprising firms with high versus low financial constraints, respectively. The
24
coefficient on crashrisk is positive and statistically significant across all the low financial
constraint subsamples (which are represented by dww=0, dhp=0, dkz=0, and dpayout=1,
respectively). By contrast, the coefficient for crashrisk, albeit positive, is not statistically
significant for the high financial constraint subsamples (represented by dww=1, dhp=1, dkz=1,
and dpayout=0, respectively). These results indicate that the positive association between insider
selling and future crash risk is evident only for firms that are in low financial constraints, which
thereby lends support to H2.
Table 5 presents the regression results for model (1) that is run separately for subsample
firms with high versus low information asymmetry between insiders and outsiders. Dstdearnings
=1 (0) and dopacity=1 (0) represent the high (low) information asymmetry subsample with
above- (below-) median value of stdearnings and of opacity, respectively. The coefficient for
crashrisk is positive and statistically significant (p=0.008) in the high stdearnings (dstdearnings
=1) subsample but is only marginally significant (p=0.090) in the low stdearnings (dstdearnings
=0) subsample. Crashrisk takes on a highly significant, positive coefficient in the high opacity
(dopacity=1) subsample but a statistically insignificant coefficient (p=0.860) in the low opacity
(dopacity=0) subsample. Taken together, these results suggest that the positive link between
insider sales and future crash risk is more evident for firms that have high information
asymmetry, thus consistent with H3.
Table 6 reports the regression results for the test of H4. The subsamples are formed based
on whether firms are in the post SOX or in the pre-SOX period. The coefficient for crashrisk in
the post SOX (sox=1) subsample is positive and highly significant (p=0.006), whereas the
25
coefficient for crashrisk in the pre-SOX (sox=0) subsample is not statistically significant (p=
0.414).9 This finding is consistent with H4 that inside sales are more strongly positively
associated with future crash risk before the implementation of SOX.
For all the multivariate tests we carried out thus far, we control not only for an extensive
set of variables that are potentially correlated with both insider sales and future crash risk, but
also for industry-fixed effects. But we could not completely exclude the possibility that our
regression analysis still omits some variables that might determine both insider sales and crash
risk. To address this possibility, we re-estimate model (1) using firm-fixed effect regression
technique which allows us to control for the effects of any unobserved firm characteristics
(Wooldrige, 2000; Amir et al., 2015). The firm-fixed effect regression results (not tabulated for
brevity) still hold in support of our hypotheses.
6. Additional tests
In the main test, we link insider sales with future crash risk on a 15-month-ahead horizon.
We now move forward the measurement window of future crash risk into longer horizons, and
re-test H1. This enables us to obtain insight into how far out insiders can assess and anticipate
future crash risk, and into whether insiders would base stock sales on their longer-term forecast
of future crash risk. This additional analysis also alleviates the potential correlated omitted
variables concern for our main results.
9 The option grant data in Compustat are missing for almost all firm-year observations for the years before the
passage of SOX. Hence, we do not include the optiong variable in the multivariate test of H4.
26
We link insider sales to 27-month-ahead and 39-month-ahead crash risk, respectively.10
Part (b) ((c)) of Figure 1 presents the timeline for our measurement windows of insider sales and
of 27-month-ahead (39-month-ahead) crash risk.11 There are two grounds on which we choose
these forecast windows for the additional tests. First, Hutton et al. (2009) and Kim et al. (2011a)
show that insiders conceal bad news up to a time horizon of around three years, and that crash
risk could persist for an at least three-year period. Second, insiders tend to sell stocks well in
advance of corporate bad news to avoid the appearance of taking advantage of insider
information and to mitigate the litigation risk associated with insider sales (Ke et al., 2003).
To test the association between insider sales and 27-month-ahead (39-month-ahead) crash
risk, we replace lnetsales with laglnetsale (llaglnetsales) on the left hand side of Equation (1),
substitute laglnetsales for llaglnetsales (lllaglnetsales) on the right hand side of the equation, and
re-run the regression. Table 7 reports the regression results. The coefficient on crashrisk in
Column (1) is marginally significant (p=0.063) and in the predicted positive sign. This offers
some evidence that insiders sell stocks on the basis of 27-month-ahead crash risk. The coefficient
for crashrisk in Column (2) is positive and highly significant at the 0.1% level, which indicates
strong evidence that insiders sell stocks based on 39-month-ahead crash risk. Taken together,
these findings suggest that insiders can forecast crash risk as far as 39 months ahead and that
they trade actively to profit from this informational forecast.
10 Related to footnote 7, we also find evidence (results not tabulated for brevity) that insider sales are
positively associated with 2-year-ahead and 3-year-ahead stock price crash risk, respectively. 11 In untabulated tests, we expand our measurement interval of future crash risk from one-year to two-year and
three-year, respectively. As such, future crash risk is measured in the two-year and three-year windows,
respectively, which are preceded three months by the measurement window of insider sales. Our inferences
remain similar for using this alternative measure of future crash risk.
27
7. Conclusion
This study examines whether insiders sell stocks based on their information advantage as to
future stock price crash risk. We find that insider sales are positively associated with future crash
risk. This evidence is consistent with the view that insiders are able to assess and anticipate
future crash risk and to exploit this information advantage to fulfil personal trading incentives.
We also find that the positive association between insider sales and future crash risk is more
evident for firms that have high information opacity but less evident for firms that are in
financial constraints or in the post SOX era. Our additional analysis further shows that insider
sales are positively correlated with 39-month-ahead stock price crash risk. This suggests that
insiders can predict future crash risk as far as 39 months ahead, and are inclined to trade
intensively to profit from the long-term crash risk forecast.
Our findings have important practical implications. Market participants can use insider sales
in ex ante assessing future stock price crash risk, and in gauging the likelihood and extent of
insiders’ bad news hoarding which results in the crash risk. In suggesting that outsiders can make
more powerful inferences about future crash risk by relating insider sales, our study should be of
particular interest to investors that make portfolio investment decisions, and to suppliers and
creditors who are concerned with the creditworthiness of their clients. Furthermore, executive
equity compensation is intended to align managerial incentives with shareholders’ interests
(Jensen and Meckling, 1976). However, high executive equity holdings could cause managers to
pursue short termism at the expense of shareholders (e.g., Bergstresser and Philippon, 2006).
One typical instance is that managers engage in strategic disclosures and in informed stock

28
trades in order to reap private benefits from shareholders. Therefore, our empirical evidence
should also be relevant to (i) boards of directors contemplating the design of optimal equity
incentive compensation schemes for insiders, and (ii) policymakers that are charged with
regulating insider trading and corporate disclosure transparency.
29
References
Aboody, D., and B. Lev. “Information Asymmetry, R&D, and Insider Gains.” Journal of Finance,
55 (2000), 2747-2766.
Agrawal, A., and C. Tommy. “Insider Trading Before Accounting Scandals.” Journal of
Corporate Finance, Forthcoming (2015).
Amir, E.; J. M. Carabias; J. Jona; and G. Livne. “Fixed Effects in Empirical Accounting
Research.” Working paper (2015), City University of London.
Arping, S., and Z. Sautner. “Did SOX Section 404 Make Firms Less Opaque? Evidence from
Cross-listed Firms.” Contemporary Accounting Research, 30 (2013), 1133-1165.
Ataullah, A.; M. Goergen; and H. Le. “Insider Trading and Financing Constraints.” The
Financial Review, 49 (2014), 685-712.
Badertscher, B. A.; P. S. Hribar. and N.T. Jenkins. “Informed Trading and the Market Reaction to
Accounting Restatements.” The Accounting Review, 86 (2011), 1519-1547.
Ball, R. “Market and Political/Regulatory Perspectives on the Recent Accounting Scandals.”
Journal of Accounting Research, 47 (2009), 277–323.
Beneish, M. “Incentives and Penalties Related to Earnings Overstatements that Violate GAAP.”
The Accounting Review, 74 (1999), 425-457.
Beneish, M. D., and M. E. Vargus. “Insider Trading, Earnings Quality, and Accrual Mispricing.”
The Accounting Review. 77 (2002), 755-791.
Bergstresser, D., and T. Philippon. “CEO Incentives and Earnings Management.” Journal of
Financial Economics, 80 (2006), 511-529.
Bettis, C.; J. Coles; and M. Lemmon. “Corporate Policies Restricting Trades by Insiders.”
Journal of Financial Economics, 57 (2000), 191-220.
Brochet, F. “Information Content of Insider Trades Before and After the Sarbanes-Oxley Act.”
The Accounting Review, 85 (2010), 419-446.
Campello, M.; J. R. Graham; and C. R. Harvey. “The Real Effects of Financial Constraints:
Evidence from a Financial Crisis.” Journal of Financial Economics, 97 (2010), 470–487.
Carlton, D. W., and D. R. Fischel. “The Regulation of Insider Trading.” Stanford Law Review, 35
(1983), 857-895.
Carpenter, J. N., and B. Remmers. “Executive Stock Option Exercises and Inside Information.”
Journal of Business, 74 (2001), 513-534.
Chen, J.; H. Hong; and J. C. Stein. “Forecasting Crashes: Trading Volume, Past Returns, and
Conditional Skewness in Stock Prices.” Journal of Financial Economics, 61 (2001), 345-
381.
30
Chen, X.; J. Harford; and K. Li. “Monitoring: Which Institutions Matter?” Journal of Financial
Economics, 86 (2007), 279-305.
Chen, T.; J. Harford; and C. Lin. “Do Analyst Matter for Governance? Evidence from Natural
Experiments.” Journal of Financial Economics, 115 (2015), 383-410.
Cheng, Q., and K. Lo. “Insider Trading and Voluntary Disclosures.” Journal of Accounting
Research, 44 (2006): 815-848.
Dai, L.; F. Ren; J. Kang; and I. Lee. “Internal Corporate Governance and the Profitability of
Insider Trading.” Working paper (2015). Nanyang Technological University.
Darrough, M., and S. Rangan. “Do Insiders Manipulate Earnings When They Sell Their Shares
in an Initial Public Offering?” Journal of Accounting Research, 43 (2005), 1-33.
Dechow, P.; A. Lawrence; and J. Ryans. “SEC Comment Letters and Insider Sales.” The
Accounting Review, 91 (2016), 401-439.
DeFond, M.; M. Hung; S. Li; and Y. Li. “Does Mandatory IFRS Adoption Affect Crash Risk?”
The Accounting Review, 90 (2015), 265-299.
Denis, D., and V. Sibilkov. “Financial Constraints, Investment, and the Value of Cash Holdings.”
Review of Financial Studies, 23 (2010), 247-269.
Dye, R. “Disclosure of Nonproprietary Information.” Journal of Accounting Research, 23 (1985),
123-145.
Fazzari, S.; R. G. Hubbard; and B. Petersen. “Financing Constraints and Corporate Investment.”
Brooking Papers of Economic Activity, 1 (1988), 141-195.
Fidrmuc, J.; M. Goergen; and L. Renneboog. “Insider Trading, News Releases and Ownership
Concentration.” Journal of Finance, 61 (2006), 2931-2973.
Field, L.; M. Lowry; and S. Shu. “Does Disclosure Deter or Trigger Litigation?” Journal of
Accounting and Economics, 39 (2005), 487-507.
Fishman, M., and K. Hagerty. “Insider Trading and the Efficiency of Stock Prices.” RAND
Journal of Economics, 23 (1992), 106-122.
Frankel, R., and X. Li. “Characteristics of a Firm’s Information Environment and the
Information Asymmetry between Insiders and Outsiders.” Journal of Accounting and
Economics, 37 (2004), 229-259.
Garfinkel, J. “New Evidence on the Effects of Federal Regulations on Insider Trading: The
Insider Trading and Securities Fraud Enforcement Act.” Journal of Corporate Finance, 3
(1997), 89-111.
Glosten, L. R., and P. R. Milgrom. “Bid, Ask, and Transaction Prices in a Specialist Market with
Heterogeneously Informed Traders.” Journal of Financial Economics, 14 (1985), 71-100.
31
Gosnell, T.; A. J. Keown; and J. M. Pinkerton. “Bankruptcy and Insider Trading: Differences
between Exchange-listed and OTC Firms.” Journal of Finance, 47 (1992), 349- 362.
Graham, J. R.; C.R. Harvey; and S. Rajgopal. “The Economic Implications of Corporate
Financial Reporting.” Journal of Accounting and Economics, 40 (2005), 3-73.
Grossman, S. J., and J. E. Stiglitz. “On the Impossibility of Informationally Efficient Markets.”
American Economic Review, 70 (1980), 393-408.
Gunny, K.; B. Ke; and T. C. Zhang. “Corporate Governance and Opportunistic Insider Trades.”
Working paper (2008), National University of Singapore.
Hadlock, C. J., and J. R. Pierce. “New Evidence on Measuring Financial Constraints: Moving
Beyond the KZ Index. Review of Financial Studies, 23 (2010), 1909-1940.
He, G. “The Effect of CEO Inside Debt Holdings on Financial Reporting Quality. Review of
Accounting Studies, 20 (2015), 501-536.
Huddart, S. J., and B. Ke. “Information Asymmetry and Cross-sectional Variation in Insider
Trading.” Contemporary Accounting Research, 24 (2007), 195-232.
Hutton, A.; A. Marcus; and H. Tehranian. “Opaque Financial Reports, R2, and Crash Risk.”
Journal of Financial Economics, 94 (2009), 67- 86.
Jagolinzer, A.; D. Larcker; and R. Zeckhauser. “Corporate Governance and the Information
Content of Insider Trades.” Journal of Accounting Research, 49 (2011), 1249-1274.
Jeng, L. A.; A. Metrick; and R. Zeckhauser. “Estimating the Returns to Insider Trading: A
Performance-evaluation Perspective. Review of Economics and Statistics, 85 (2003), 453-
471.
Jensen, M., and W. Meckling. “Theory of the firm: managerial behavior, agency costs, and
ownership structure.” Journal of Financial Economics, 3 (1976), 305-360.
Jin, L. and C. S. Myers. “R2 around the World: New Theory and New Tests’. Journal of
Financial Economics, 79 (2006), 257–292.
John, K., and L. H. P. Lang. “Strategic Insider Trading Around Dividend Announcements:
Theory and Evidence.” Journal of Finance, 46 (1991), 1361-1389.
Johnson, S. A.; H. E. Ryan; and Y. S. Tian. “Managerial Incentives and Corporate Fraud: the
Sources of Incentives Matter.” Review of Finance, 13 (2009), 115-145.
Jung, W., and Y. Kwon. “Disclosure When the Market is Unsure of Information Endowment of
Managers.” Journal of Accounting Research, 26 (1988), 146-153.
Kaplan, S., and L. Zingales. “Do investment-cash Flow Sensitivities Provide Useful Measures of
Financing Constraints?” Quarterly Journal of Economics, 112 (1997), 169-215.
Ke, B.; S. Huddart; and K. Petroni. “What Insiders Know about Future Earnings and How They
32
Use It: Evidence from Insider Trades.” Journal of Accounting and Economics, 35 (2003),
315-346.
Kim, J.; Y. Li; and L. Zhang. “Corporate Tax Avoidance and Stock Price Crash Risk: Firm-level
Analysis.” Journal of Financial Economics, 100 (2011a), 639-662.
Kim, J.; Y. Li; and L. Zhang. “CFOs versus CEOs: Equity Incentives and Crashes.” Journal of
Financial Economics. 101 (2011b), 713-730.
Kim, J.; and L. Zhang. “Accounting Conservatism and Stock Price Crash Risk: Firm-level
Evidence.” Contemporary Accounting Research, Forthcoming (2015).
Kothari, S. P.; S. Shu; and P. D. Wysocki. “Do Managers Withhold Bad News?” Journal of
Accounting Research 47 (2009), 241-276.
Kyle, A. S. “Continuous Auctions and Insider Trading.” Econometrica, 53 (1985), 1315-1335.
Iliev, P. “The Effect of SOX Section 404: Costs, Earnings Quality, and Stock Prices.” Journal of
Finance, LXV (2010), 1163-1196.
Lakonishok, J., and I. Lee. “Are Insider Trades Informative?” Review of Financial Studies, 14
(2001), 79-111.
Lustgarten, S.; and V. Mande. “Financial Analysts’ Earnings Forecasts and Insider Trading.”
Journal of Accounting and Public Policy, 14 (1995), 233-261.
Lamont, O.; C. Polk; and J. Saa ́-Requejo. “Financial Constraints and Stock Returns.” Review of
Financial Studies, 14 (2001), 529-554.
Leland, H. E. “Insider Trading: Should It be Prohibited?” Journal of Political Economy, 100
(1992), 859-887.
Manne, H. G. “Insider Trading and the Stock Market” (Free Press, New York), 93-158, (1966).
Available from http://www.jura.uni-muenchen.de/fakultaet/lehrstuehle/eidenmueller/
dokumente/ecil/manne1966.pdf.
Noe, C. “Voluntary Disclosures and Insider Transactions.” Journal of Accounting and Economics
27 (1999), 305-326.
Ofek, E., and D. Yermack. “Taking Stock: Equity-based Compensation and the Evolution of
Managerial Ownership.” Journal of Finance, 55 (2000), 1367-1384.
Piotroski, J. D., and D. T. Roulstone. “Do Insider Trades Reflect Both Contrarian Beliefs and
Superior Knowledge about Future Cash Flow Realization?” Journal of Accounting and
Economics, 39 (2005), 55-81.
Ravina, E., and P. Sapienza. “What Do Independent Directors Dnow? Evidence from Their
Trading.” Review of Financial Studies, 23 (2010), 962-1003.
33
Rozeff, M. S., and M. A. Zaman. “Overreaction and Insider Trading: Evidence from Growth and
Value Portfolios.” Journal of Finance, 53 (1998), 701-716.
Seyhun, N. “Insiders’ Profits, Costs of Trading, and Market Efficiency.” Journal of Financial
Economics, 16 (1986), 189-212.
Seyhun, H. N. “Overreaction or Fundamentals: Some Lessons from Insiders' Response to the
Market Crash of 1987”. Journal of Finance, 45 (1990), 1363-1388.
Seyhun, H.N., and M. Bradley. “Corporate Bankruptcy and Insider Trading.” Journal of Business,
70 (1997), 189-216.
Skaife, H. A.; D. W. Collins; W. R. Kinney; and R. LaFond. “The Effect of SOX Internal Control
Deficiencies on Firm Risk and Cost of Equity.” Journal of Accounting Research, 47 (2009),
1-43.
Skaife, H. A.; D. Veenman; and D. Wangerin. “Internal Control over Financial Reporting and
Managerial Rent Extraction: Evidence from the Profitability of Insider Trading.” Journal of
Accounting and Economics, 55 (2013), 91-110.
Skinner, D. J. “Why Firms Voluntarily Disclose Bad News?” Journal of Accounting Research 32
(1994): 38-60.
Skinner, D. “Earnings Disclosure and Stockholder Lawsuits.” Journal of Accounting and
Economics, 23 (1997), 249-283.
Thevenot, M. “The Factors Affecting Illegal Insider Trading in Firms with Violations of GAAP.”
Journal of Accounting and Economics, 53 (2012), 375-390.
Whited, T., and G. Wu. “Financial Constraints Risk.” Review of Financial Studies, 19 (2006),
531-559.
Wooldridge, J. “Introductory Econometrics: A Modern Approach.” First edition. New York:
South-Western College Publishing, (2000).
34
Figure 1 Timeline for the insider sales and crash risk measures
(a) The association between insider sales and 15-month-ahead crash risk
9( )
4t
FYE
5
( )4
tFYE
( 1)tFYE tFYE
lnetsales crashrisk
Notes: Figure (a) shows the timeline for measurements of the dependent variable (i.e., crashrisk) and
treatment variable (i.e., lnetsales) that are used for the multivariate tests of H1-H4. Both the crash risk
variable and insider selling variable are defined in the appendix.
(b) The association between insider sales and 27-month-ahead crash risk
Notes: Figure (b) shows the timeline for measurements of the dependent variable (i.e., crashrisk) and
treatment variable (i.e., laglnetsales) that are used for the test of the association between insider sales and 27-
month-ahead crash risk. Both the crash risk variable and insider selling variable are defined in the appendix.
(c) The association between insider sales and 39-month-ahead crash risk
Notes: Figure (c) shows the timeline for measurements of the dependent variable (i.e., crashrisk) and
treatment variable (i.e., llaglnetsales) that are used for the test of the association between insider sales and
39-month-ahead crash risk. Both the crash risk variable and insider selling variable are defined in the
appendix.
laglnetsales
crashrisk
crashrisk
llaglnetsales
35
Table 1 Summary statistics
Variables Num. of
firm-years
Num. of
unique firms Mean Std.dev. 25th Median 75th
lnetsales 32,085 7,213 3.8080 8.9861 0 7.3883 11.9023
laglnetsales 32,085 7,213 3.5259 8.6696 0 0 11.6953
llaglnetsales 32,085 7,213 3.2423 8.3289 0 0 11.4809
lllaglnetsales 32,085 7,213 2.9758 7.9803 0 0 11.1781
crashrisk 32,085 7,213 0.1793 0.3836 0 0 0
ncskew 32,085 7,213 -5.0506 18.0012 -12.2537 -4.4593 3.0896
duvol 32,085 7,213 -0.1774 0.4340 -0.4123 -0.1524 0.0850
minreturn 32,085 7,213 2.4544 0.6930 1.9846 2.3363 2.7943
changeroa 32,085 7,213 -0.0216 1.3634 -0.0318 -0.0011 0.0205
roa 32,085 7,213 0.0248 1.9725 -0.0055 0.0355 0.0734
retvol 32,085 7,213 0.1311 0.0989 0.0727 0.1069 0.1579
salesgrowth 32,085 7,213 0.6256 66.4744 -0.0450 0.0689 0.2086
optiong 32,085 7,213 2.5379 8.0312 0 0 1.3000
qtrret 32,085 7,213 0.0248 0.7432 -0.3062 -0.0588 0.1990
size 32,085 7,213 6.1094 2.0903 4.6813 6.1915 7.5089
btm 32,085 7,213 0.9076 8.9150 0.3113 0.5368 0.8843
tradvol 32,085 7,213 1.4437 2.4259 0.4107 0.9005 1.8498
anacov 32,085 7,213 31.9791 43.1388 1 17 44
hp 32,085 7,213 -998.76
78
1179.722
0
-1535.6700 -412.4612 -103.0395
kz 23,338 5,996 1.0803 11.3091 0.4347 0.8257 1.2609
ww 32,085 7,213 -0.2351 2.3434 -0.2881 -0.2190 -0.1497
payout 10,909 3,229 0.0783 27.6156 0 0.1438 0.4092
stdearnings 32,085 7,213 93.8537 946.4302 3.4092 11.1605 40.6381
opacity 23,094 5,725 18.7623 336.4236 0.0529 0.1325 0.4666
dedi 32,085 7,213 0.0581 0.0847 0 0.0243 0.0919
sox 32,085 7,213 0.5430 0.4982 0 1 1
Notes: This table tabulates the descriptive statistics of all the variables used for the hypothesis tests. The sample
period ranges from 1992 to 2013. All the variables are defined in the appendix.
36
Table 2 Pearson (Spearman) correlation in the lower (upper) triangle
Variables lnetsales crashrisk changeroa roa retvol salesgrowth optiong qtrret size btm tradevol anacov laglnetsales stdearnings ww dedi sox
lnetsales 1 0.0605 -0.0307 0.2895 -0.1189 0.1317 0.2007 0.1363 0.4074 -0.2868 0.3438 0.3916 0.5112 0.2265 -0.2084 0.2750 0.1978
(<0.001) (<0.001) (<0.001) (<0.001) (<0.001) (<0.001) (<0.001) (<0.001) (<0.001) (<0.001) (<0.001) (<0.001) (<0.001) (<0.001) (<0.001) (<0.001
) crashrisk 0.0547 1 -0.0911 0.0325 0.0086 0.0295 0.0723 0.0284 0.0515 -0.0819 0.0946 0.0500 0.0486 0.0192 0.0071 0.0259 0.0774
(<0.001)
(<0.001) (<0.001) (0.124) (<0.001) (<0.001) (<0.001) (<0.001) (<0.001) (<0.001) (<0.001) (<0.001) (<0.001) (0.205) (<0.001) (<0.001
) changeroa -0.0012 -0.0015 1 -0.2431 -0.0229 -0.0664 -0.0009 0.0491 0.0191 -0.0306 -0.0447 0.0176 -0.0163 0.0433 -0.0453 0.0265 0.0101
(0.836) (0.791)
(<0.001) (<0.001) (<0.001) (0.866) (<0.001) (<0.001) (<0.001) (<0.001) (0.002) (0.003) (<0.001) (<0.001) (<0.001) (0.071)
roa 0.0124 0.0056 -0.0508 1 -0.3341 0.2211 0.0642 0.2993 0.3624 -0.2845 0.0587 0.2083 0.2259 0.0915 -0.1786 0.1433 0.0428
(0.027) (0.317) (<0.001)
(<0.001) (<0.001) (<0.001) (<0.001) (<0.001) (<0.001) (<0.001) (<0.001) (<0.001) (<0.001) (<0.001) (<0.001) (<0.001
) retvol -0.1224 -0.0111 -0.0226 -0.0506 1 -0.0126 0.0385 -0.0988 -0.3830 0.0192 0.2780 -0.1525 -0.0931 -0.1228 0.3718 -0.1314 0.0510
(<0.001) (0.046) (<0.001) (<0.001)
(0.024) (<0.001) (<0.001) (<0.001) (<0.001) (<0.001) (<0.001) (<0.001) (<0.001) (<0.001) (<0.001) (<0.001
) salesgrowth -0.0101 0.0126 -0.0042 0.0006 0.0028 1 -0.0183 0.1999 0.1187 -0.2153 0.1009 0.0358 0.0452 -0.0981 -0.0271 0.0401 -0.0243
(0.070) (0.024) (0.455) (0.908) (0.616)
(<0.001) (<0.001) (<0.001) (<0.001) (<0.001) (<0.001) (<0.001) (<0.001) (<0.001) (<0.001) (<0.001
) optiong 0.1773 0.0450 -0.0004 0.0047 -0.0585 -0.0006 1 0.0682 0.2301 -0.1151 0.3823 0.2679 0.2134 0.2112 -0.0688 0.1820 0.5519
(<0.001) (<0.001) (0.941) (0.404) (<0.001) (0.910)
(<0.001) (<0.001) (<0.001) (<0.001) (<0.001) (<0.001) (<0.001) (<0.001) (<0.001) (<0.001
) qtrret 0.0537 0.0243 0.0082 0.0171 0.1837 -0.0027 0.0217 1 0.2663 -0.3247 0.0746 0.0762 0.0305 0.0683 -0.0993 0.1045 0.0704
(<0.001) (<0.001) (0.143) (0.002) (<0.001) (0.623) (<0.001)
(<0.001) (<0.001) (<0.001) (<0.001) (<0.001) (<0.001) (<0.001) (<0.001) (<0.001
) size 0.3651 0.0505 0.0184 0.0419 -0.3300 -0.0049 0.2477 0.1444 1 -0.3878 0.4021 0.7342 0.3618 0.7156 -0.7696 0.3865 0.1804
(<0.001) (<0.001) (<0.001) (<0.001) (<0.001) (0.378) (<0.001) (<0.001)
(<0.001) (<0.001) (<0.001) (<0.001) (<0.001) (<0.001) (<0.001) (<0.001
) btm -0.0278 -0.0107 -0.0010 -0.0027 0.0146 -0.0007 -0.0121 -0.0283 -0.0754 1 -0.2584 -0.2593 -0.2046 -0.1057 0.0112 -0.1205 -0.1240
(<0.001) -0.0560 (0.851) (0.632) (0.009) (0.902) (0.030) (<0.001) (<0.001)
(<0.001) (<0.001) (<0.001) (<0.001) (0.045) (<0.001) (<0.001
) tradevol 0.1468 0.0373 -0.0058 -0.0039 0.1905 -0.0003 0.1617 0.0714 0.1676 0.3044 1 0.5468 0.3309 0.3770 -0.1670 0.2872 0.4490
(<0.001) (<0.001) (0.300) (0.489) (<0.001) (0.962) (<0.001) (<0.001) (<0.001) (<0.001)
(<0.001) (<0.001) (<0.001) (<0.001) (<0.001) (<0.001
) anacov 0.2957 0.0114 0.0065 0.0036 -0.1367 -0.0045 0.2714 0.0023 0.6393 -0.0277 0.2574 1 0.3907 0.6016 -0.5749 0.3808 0.2173
(<0.001) (0.041) (0.242) (0.518) (<0.001) (0.415) (<0.001) (0.679) (<0.001) (<0.001) (<0.001)
(<0.001) (<0.001) (<0.001) (<0.001) (<0.001
) laglnetsales 0.4561 0.0434 0.0026 0.0060 -0.1117 -0.0032 0.1809 -0.0264 0.3268 -0.0216 0.1456 0.3052 1 0.2236 -0.2076 0.2647 0.2112
(<0.001) (<0.001) (0.638) (0.286) (<0.001) (0.572) (<0.001) (<0.001) (<0.001) (<0.001) (<0.001) (<0.001)
(<0.001) (<0.001) (<0.001) (<0.001
) stdearnings 0.0219 -0.0107 0.0012 0.0007 -0.0171 -0.0008 0.0573 0.0010 0.1427 0.0017 0.0264 0.1381 0.0185 1 -0.6784 0.2992 0.1985
(<0.001) (0.055) (0.823) (0.901) (0.002) (0.883) (<0.001) (0.859) (<0.001) (0.755) (<0.001) (<0.001) (<0.001)
(<0.001) (<0.001) (<0.001
) ww 0.0018 -0.0123 0.0030 0.0000 0.0086 -0.9920 -0.0046 0.0042 -0.0284 0.0003 -0.0019 -0.0185 -0.0055 -0.0055 1 -0.2854 0.0494
(0.744) (0.028) (0.586) (0.999) (0.124) (<0.001) (0.411) (0.456) (<0.001) (0.959) (0.735) (<0.001) (0.322) (0.326)
(<0.001) (<0.001
) dedi 0.1373 0.0090 0.0052 -0.0018 -0.0832 0.0005 0.0965 0.0248 0.2282 -0.0150 0.0716 0.1783 0.1372 0.0153 -0.0087 1 0.1675
(<0.001) (0.106) (0.351) (0.748) (<0.001) (0.925) (<0.001) (<0.001) (<0.001) (0.007) (<0.001) (<0.001) (<0.001) (0.006) (0.121)
(<0.001
) sox 0.1764 0.0774 0.0051 0.0155 -0.0155 0.0049 0.2899 0.0366 0.1862 -0.0205 0.2321 0.1921 0.1905 0.0316 -0.0026 0.1166 1
(<0.001) (<0.001) (0.362) (0.006) (0.006) (0.378) (<0.001) (<0.001) (<0.001) (<0.001) (<0.001) (<0.001) (<0.001) (<0.001) (0.645) (<0.001)
Notes: This table presents the results for the Pearson (Spearman) correlation tests in the lower (upper) triangle. The correlation matrix involves all the variables used for the main hypothesis tests. The
sample consists of 32,085 firm-year observations which cover the years of 1992-2013. All the variables are defined in the appendix. The p-values are provided in parentheses.
37
TABLE 3 Test of H1: The association between insider sales and future stock price crash risk
Variables Dependent variable = lnetsales
Pred. Sign (1)
(2) (3) (4)
Intercept ?
-2.6137
-2.4585 -2.3681 -2.8178
(<0.001)***
(<0.001)*** (<0.001)*** (<0.001)***
crashrisk +
0.3716
(0.001)***
ncskew +
0.0075
(0.001)***
duvol +
0.4420
(<0.001)***
minreturn +
0.1117
(0.074)*
changeroa -
-0.0348
-0.0350 -0.0372 -0.0353
(0.151)
(0.152) (0.141) (0.155)
roa -
-0.0012
-0.0012 -0.0024 -0.0016
(0.955)
(0.954) (0.903) (0.938)
retvol +
-0.5785
-0.6152 -0.3551 -0.5105
(0.380)
(0.352) (0.593) (0.442)
salesgrowth +
0.0179
0.0179 0.0180 0.0180
(0.219)
(0.217) (0.217) (0.217)
optiong +
0.0423
0.0428 0.0428 0.0426
(0.001)***
(0.001)*** (0.001)*** (0.001)***
qtrret +
0.3379
0.3381 0.3232 0.3363
(<0.001)***
(<0.001)*** (<0.001)*** (<0.001)***
size +
0.8279
0.8204 0.8042 0.8255
(<0.001)***
(<0.001)*** (<0.001)*** (<0.001)***
btm -
-0.0148
-0.0147 -0.0148 -0.0149
(0.150)
(0.156) (0.150) (0.148)
tradevol +
0.1692
0.1701 0.1696 0.1704
(0.008)***
(0.008)*** (0.008)*** (0.008)***
anacov -
0.0096
0.0095 0.0097 0.0096
(<0.001)***
(<0.001)*** (<0.001)*** (<0.001)***
laglnetsales +
0.3702
0.3703 0.3705 0.3705
(<0.001)***
(<0.001)*** (<0.001)*** (<0.001)***
stdearnings + -0.0002 -0.0002 -0.0002 -0.0002
(0.088)* (0.088)* (0.090)* (0.088)*
ww - 0.5448 0.5457 0.5477 0.5474
(0.190) (0.189) (0.188) (0.188)
dedi - 2.7955 2.7939 2.7737 2.7798
(<0.001)*** (<0.001)*** (<0.001)*** (<0.001)***
sox - 0.6885 0.7216 0.7279 0.7258
38
(0.063)* (0.051)* (0.049)* (0.050)*
Year-fixed effects included included included included
Industry-fixed effects included included included included
R-squared
0.2848
0.2848 0.2850 0.2847
Num. of observations
32,085
32,085 32,085 32,085
Notes: This table reports the OLS regression results for the tests of the association between insider sales and future
stock price crash risk. The sample period covers the years of 1992-2013. The dependent variable is lnetsales. The
treatment variables are crashrisk, ncskew, duvol, and minreturn, four distinct proxies for stock price crash risk. All
the variables in the table are defined in the appendix. Year- and industry-fixed effects are included in regressions but
not reported for simplicity. The p-values in parentheses are based on robust standard errors clustered by firm. ***,
**, * represent the 1%, 5%, and 10% statistical significance levels (two-tailed), respectively.
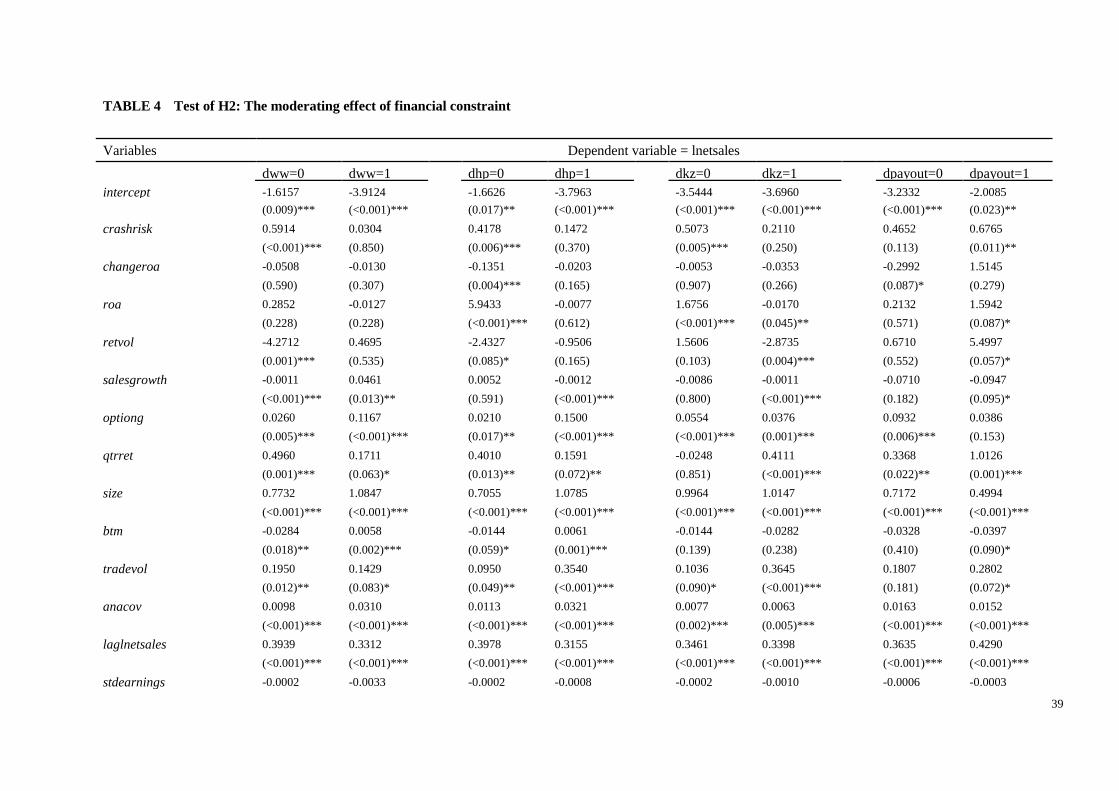
39
TABLE 4 Test of H2: The moderating effect of financial constraint
Variables Dependent variable = lnetsales
dww=0 dww=1 dhp=0 dhp=1 dkz=0 dkz=1 dpayout=0 dpayout=1
intercept -1.6157 -3.9124
-1.6626 -3.7963
-3.5444 -3.6960
-3.2332 -2.0085
(0.009)*** (<0.001)***
(0.017)** (<0.001)***
(<0.001)*** (<0.001)***
(<0.001)*** (0.023)**
crashrisk 0.5914 0.0304
0.4178 0.1472
0.5073 0.2110
0.4652 0.6765
(<0.001)*** (0.850)
(0.006)*** (0.370)
(0.005)*** (0.250)
(0.113) (0.011)**
changeroa -0.0508 -0.0130
-0.1351 -0.0203
-0.0053 -0.0353
-0.2992 1.5145
(0.590) (0.307)
(0.004)*** (0.165)
(0.907) (0.266)
(0.087)* (0.279)
roa 0.2852 -0.0127
5.9433 -0.0077
1.6756 -0.0170
0.2132 1.5942
(0.228) (0.228)
(<0.001)*** (0.612)
(<0.001)*** (0.045)**
(0.571) (0.087)*
retvol -4.2712 0.4695
-2.4327 -0.9506
1.5606 -2.8735
0.6710 5.4997
(0.001)*** (0.535)
(0.085)* (0.165)
(0.103) (0.004)***
(0.552) (0.057)*
salesgrowth -0.0011 0.0461
0.0052 -0.0012
-0.0086 -0.0011
-0.0710 -0.0947
(<0.001)*** (0.013)**
(0.591) (<0.001)***
(0.800) (<0.001)***
(0.182) (0.095)*
optiong 0.0260 0.1167
0.0210 0.1500
0.0554 0.0376
0.0932 0.0386
(0.005)*** (<0.001)***
(0.017)** (<0.001)***
(<0.001)*** (0.001)***
(0.006)*** (0.153)
qtrret 0.4960 0.1711
0.4010 0.1591
-0.0248 0.4111
0.3368 1.0126
(0.001)*** (0.063)*
(0.013)** (0.072)**
(0.851) (<0.001)***
(0.022)** (0.001)***
size 0.7732 1.0847
0.7055 1.0785
0.9964 1.0147
0.7172 0.4994
(<0.001)*** (<0.001)***
(<0.001)*** (<0.001)***
(<0.001)*** (<0.001)***
(<0.001)*** (<0.001)***
btm -0.0284 0.0058
-0.0144 0.0061
-0.0144 -0.0282
-0.0328 -0.0397
(0.018)** (0.002)***
(0.059)* (0.001)***
(0.139) (0.238)
(0.410) (0.090)*
tradevol 0.1950 0.1429
0.0950 0.3540
0.1036 0.3645
0.1807 0.2802
(0.012)** (0.083)*
(0.049)** (<0.001)***
(0.090)* (<0.001)***
(0.181) (0.072)*
anacov 0.0098 0.0310
0.0113 0.0321
0.0077 0.0063
0.0163 0.0152
(<0.001)*** (<0.001)***
(<0.001)*** (<0.001)***
(0.002)*** (0.005)***
(<0.001)*** (<0.001)***
laglnetsales 0.3939 0.3312
0.3978 0.3155
0.3461 0.3398
0.3635 0.4290
(<0.001)*** (<0.001)***
(<0.001)*** (<0.001)***
(<0.001)*** (<0.001)***
(<0.001)*** (<0.001)***
stdearnings -0.0002 -0.0033
-0.0002 -0.0008
-0.0002 -0.0010
-0.0006 -0.0003
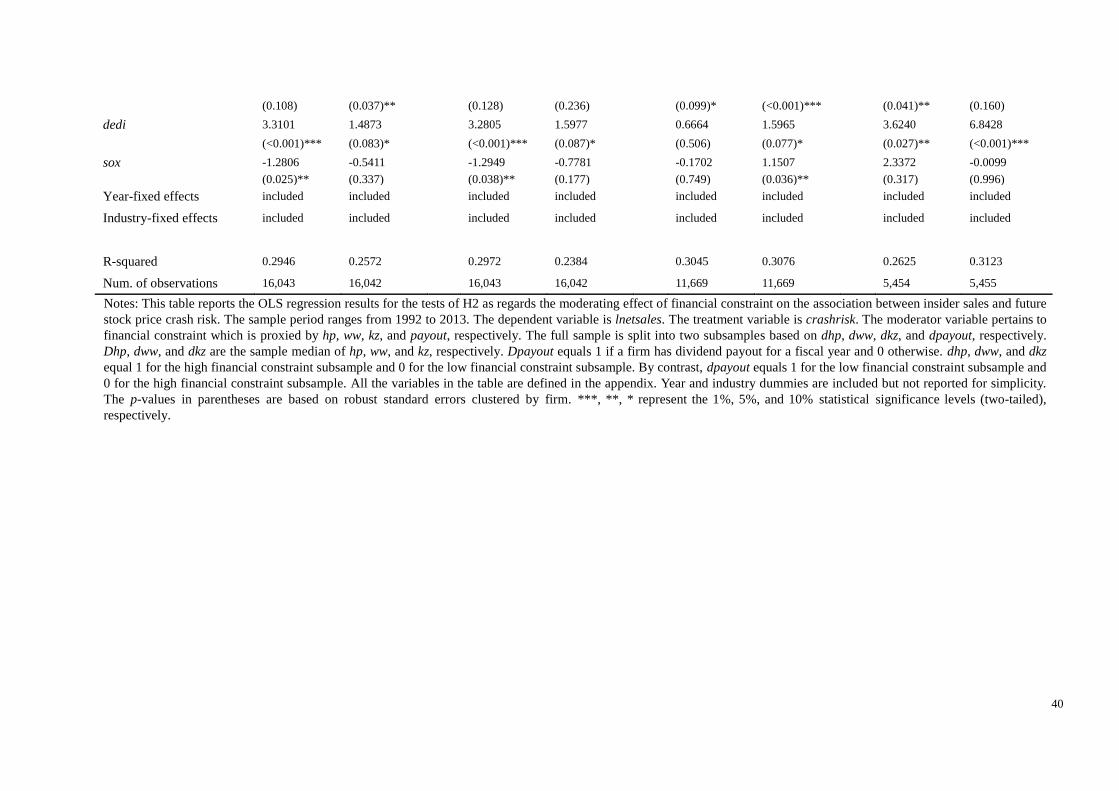
40
(0.108) (0.037)**
(0.128) (0.236)
(0.099)* (<0.001)***
(0.041)** (0.160)
dedi 3.3101 1.4873
3.2805 1.5977
0.6664 1.5965
3.6240 6.8428
(<0.001)*** (0.083)*
(<0.001)*** (0.087)*
(0.506) (0.077)*
(0.027)** (<0.001)***
sox -1.2806 -0.5411
-1.2949 -0.7781
-0.1702 1.1507
2.3372 -0.0099
(0.025)** (0.337)
(0.038)** (0.177)
(0.749) (0.036)**
(0.317) (0.996)
Year-fixed effects included included included included included included included included
Industry-fixed effects included included included included included included included included
R-squared 0.2946 0.2572
0.2972 0.2384
0.3045 0.3076
0.2625 0.3123
Num. of observations 16,043 16,042
16,043 16,042
11,669 11,669
5,454 5,455
Notes: This table reports the OLS regression results for the tests of H2 as regards the moderating effect of financial constraint on the association between insider sales and future
stock price crash risk. The sample period ranges from 1992 to 2013. The dependent variable is lnetsales. The treatment variable is crashrisk. The moderator variable pertains to
financial constraint which is proxied by hp, ww, kz, and payout, respectively. The full sample is split into two subsamples based on dhp, dww, dkz, and dpayout, respectively.
Dhp, dww, and dkz are the sample median of hp, ww, and kz, respectively. Dpayout equals 1 if a firm has dividend payout for a fiscal year and 0 otherwise. dhp, dww, and dkz
equal 1 for the high financial constraint subsample and 0 for the low financial constraint subsample. By contrast, dpayout equals 1 for the low financial constraint subsample and
0 for the high financial constraint subsample. All the variables in the table are defined in the appendix. Year and industry dummies are included but not reported for simplicity.
The p-values in parentheses are based on robust standard errors clustered by firm. ***, **, * represent the 1%, 5%, and 10% statistical significance levels (two-tailed),
respectively.
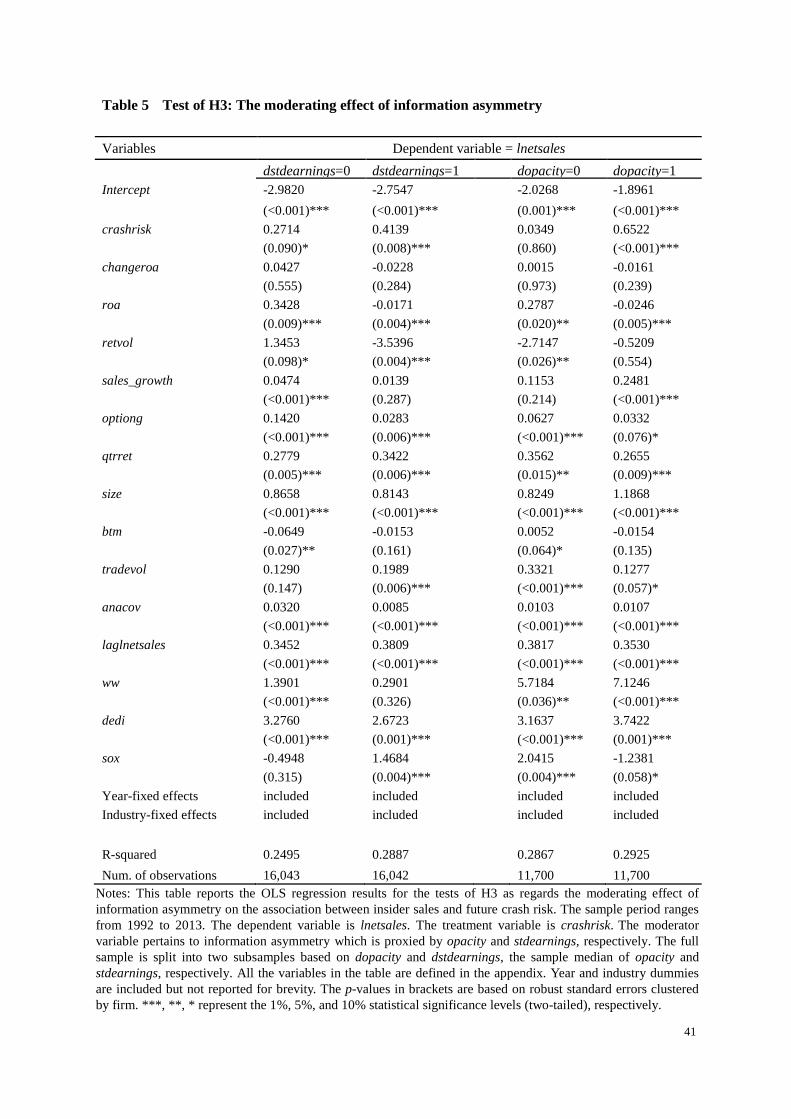
41
Table 5 Test of H3: The moderating effect of information asymmetry
Variables Dependent variable = lnetsales
dstdearnings=0 dstdearnings=1 dopacity=0 dopacity=1
Intercept -2.9820 -2.7547
-2.0268 -1.8961
(<0.001)*** (<0.001)***
(0.001)*** (<0.001)***
crashrisk 0.2714 0.4139
0.0349 0.6522
(0.090)* (0.008)***
(0.860) (<0.001)***
changeroa 0.0427 -0.0228
0.0015 -0.0161
(0.555) (0.284)
(0.973) (0.239)
roa 0.3428 -0.0171
0.2787 -0.0246
(0.009)*** (0.004)***
(0.020)** (0.005)***
retvol 1.3453 -3.5396
-2.7147 -0.5209
(0.098)* (0.004)***
(0.026)** (0.554)
sales_growth 0.0474 0.0139
0.1153 0.2481
(<0.001)*** (0.287)
(0.214) (<0.001)***
optiong 0.1420 0.0283
0.0627 0.0332
(<0.001)*** (0.006)***
(<0.001)*** (0.076)*
qtrret 0.2779 0.3422
0.3562 0.2655
(0.005)*** (0.006)***
(0.015)** (0.009)***
size 0.8658 0.8143
0.8249 1.1868
(<0.001)*** (<0.001)***
(<0.001)*** (<0.001)***
btm -0.0649 -0.0153
0.0052 -0.0154
(0.027)** (0.161)
(0.064)* (0.135)
tradevol 0.1290 0.1989
0.3321 0.1277
(0.147) (0.006)***
(<0.001)*** (0.057)*
anacov 0.0320 0.0085
0.0103 0.0107
(<0.001)*** (<0.001)***
(<0.001)*** (<0.001)***
laglnetsales 0.3452 0.3809
0.3817 0.3530
(<0.001)*** (<0.001)***
(<0.001)*** (<0.001)***
ww 1.3901 0.2901
5.7184 7.1246
(<0.001)*** (0.326)
(0.036)** (<0.001)***
dedi 3.2760 2.6723
3.1637 3.7422
(<0.001)*** (0.001)***
(<0.001)*** (0.001)***
sox -0.4948 1.4684
2.0415 -1.2381
(0.315) (0.004)***
(0.004)*** (0.058)*
Year-fixed effects included included
included included
Industry-fixed effects included included included included
R-squared 0.2495 0.2887
0.2867 0.2925
Num. of observations 16,043 16,042
11,700 11,700
Notes: This table reports the OLS regression results for the tests of H3 as regards the moderating effect of
information asymmetry on the association between insider sales and future crash risk. The sample period ranges
from 1992 to 2013. The dependent variable is lnetsales. The treatment variable is crashrisk. The moderator
variable pertains to information asymmetry which is proxied by opacity and stdearnings, respectively. The full
sample is split into two subsamples based on dopacity and dstdearnings, the sample median of opacity and
stdearnings, respectively. All the variables in the table are defined in the appendix. Year and industry dummies
are included but not reported for brevity. The p-values in brackets are based on robust standard errors clustered
by firm. ***, **, * represent the 1%, 5%, and 10% statistical significance levels (two-tailed), respectively.
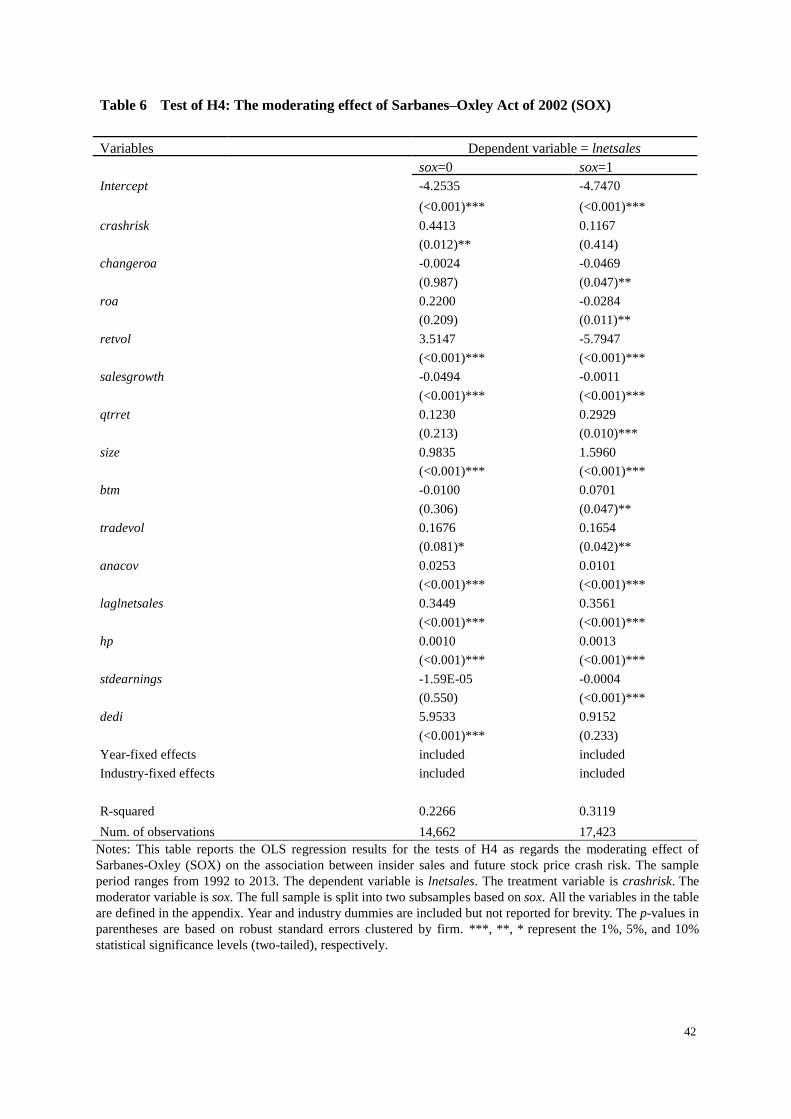
42
Table 6 Test of H4: The moderating effect of Sarbanes–Oxley Act of 2002 (SOX)
Variables Dependent variable = lnetsales
sox=0 sox=1
Intercept
-4.2535 -4.7470
(<0.001)*** (<0.001)***
crashrisk
0.4413 0.1167
(0.012)** (0.414)
changeroa
-0.0024 -0.0469
(0.987) (0.047)**
roa
0.2200 -0.0284
(0.209) (0.011)**
retvol
3.5147 -5.7947
(<0.001)*** (<0.001)***
salesgrowth
-0.0494 -0.0011
(<0.001)*** (<0.001)***
qtrret
0.1230 0.2929
(0.213) (0.010)***
size
0.9835 1.5960
(<0.001)*** (<0.001)***
btm
-0.0100 0.0701
(0.306) (0.047)**
tradevol
0.1676 0.1654
(0.081)* (0.042)**
anacov
0.0253 0.0101
(<0.001)*** (<0.001)***
laglnetsales
0.3449 0.3561
(<0.001)*** (<0.001)***
hp
0.0010 0.0013
(<0.001)*** (<0.001)***
stdearnings
-1.59E-05 -0.0004
(0.550) (<0.001)***
dedi
5.9533 0.9152
(<0.001)*** (0.233)
Year-fixed effects
included included
Industry-fixed effects included included
R-squared
0.2266 0.3119
Num. of observations
14,662 17,423
Notes: This table reports the OLS regression results for the tests of H4 as regards the moderating effect of
Sarbanes-Oxley (SOX) on the association between insider sales and future stock price crash risk. The sample
period ranges from 1992 to 2013. The dependent variable is lnetsales. The treatment variable is crashrisk. The
moderator variable is sox. The full sample is split into two subsamples based on sox. All the variables in the table
are defined in the appendix. Year and industry dummies are included but not reported for brevity. The p-values in
parentheses are based on robust standard errors clustered by firm. ***, **, * represent the 1%, 5%, and 10%
statistical significance levels (two-tailed), respectively.
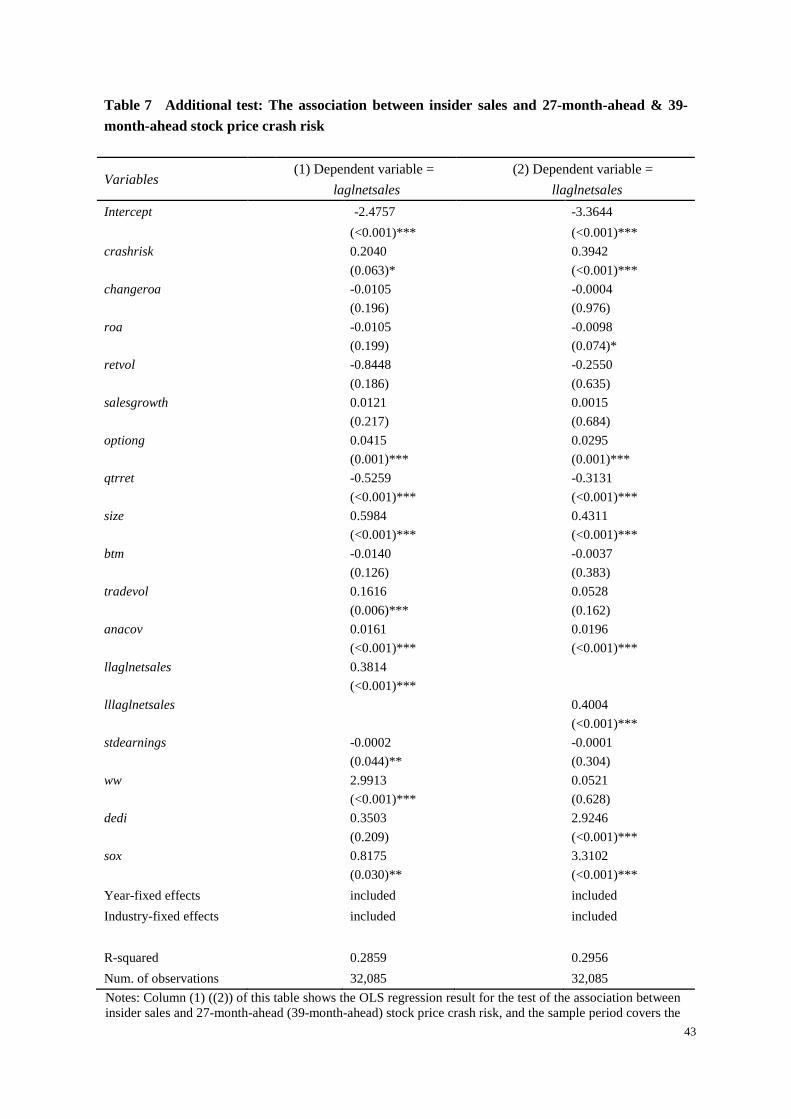
43
Table 7 Additional test: The association between insider sales and 27-month-ahead & 39-
month-ahead stock price crash risk
Variables
(1) Dependent variable =
laglnetsales
(2) Dependent variable =
llaglnetsales
Intercept -2.4757
-3.3644
(<0.001)***
(<0.001)***
crashrisk 0.2040
0.3942
(0.063)*
(<0.001)***
changeroa -0.0105
-0.0004
(0.196)
(0.976)
roa -0.0105
-0.0098
(0.199)
(0.074)*
retvol -0.8448
-0.2550
(0.186)
(0.635)
salesgrowth 0.0121
0.0015
(0.217)
(0.684)
optiong 0.0415
0.0295
(0.001)***
(0.001)***
qtrret -0.5259
-0.3131
(<0.001)***
(<0.001)***
size 0.5984
0.4311
(<0.001)***
(<0.001)***
btm -0.0140
-0.0037
(0.126)
(0.383)
tradevol 0.1616
0.0528
(0.006)***
(0.162)
anacov 0.0161
0.0196
(<0.001)***
(<0.001)***
llaglnetsales 0.3814
(<0.001)***
lllaglnetsales
0.4004
(<0.001)***
stdearnings -0.0002
-0.0001
(0.044)**
(0.304)
ww 2.9913
0.0521
(<0.001)***
(0.628)
dedi 0.3503
2.9246
(0.209)
(<0.001)***
sox 0.8175
3.3102
(0.030)**
(<0.001)***
Year-fixed effects included included
Industry-fixed effects included included
R-squared 0.2859
0.2956
Num. of observations 32,085
32,085
Notes: Column (1) ((2)) of this table shows the OLS regression result for the test of the association between
insider sales and 27-month-ahead (39-month-ahead) stock price crash risk, and the sample period covers the

44
years of 1992-2012 (1992-2011). In Column (1) ((2)), the dependent variable is laglnetsales (llaglnetsales),
and the treatment variable is crashrisk. All the variables in the table are defined in the appendix. Year- and
industry-fixed effects are included in regressions but not reported for brevity. The p-values in parentheses
are based on robust standard errors clustered by firm. ***, **, * represent the 1%, 5%, and 10% statistical
significance levels (two-tailed), respectively.
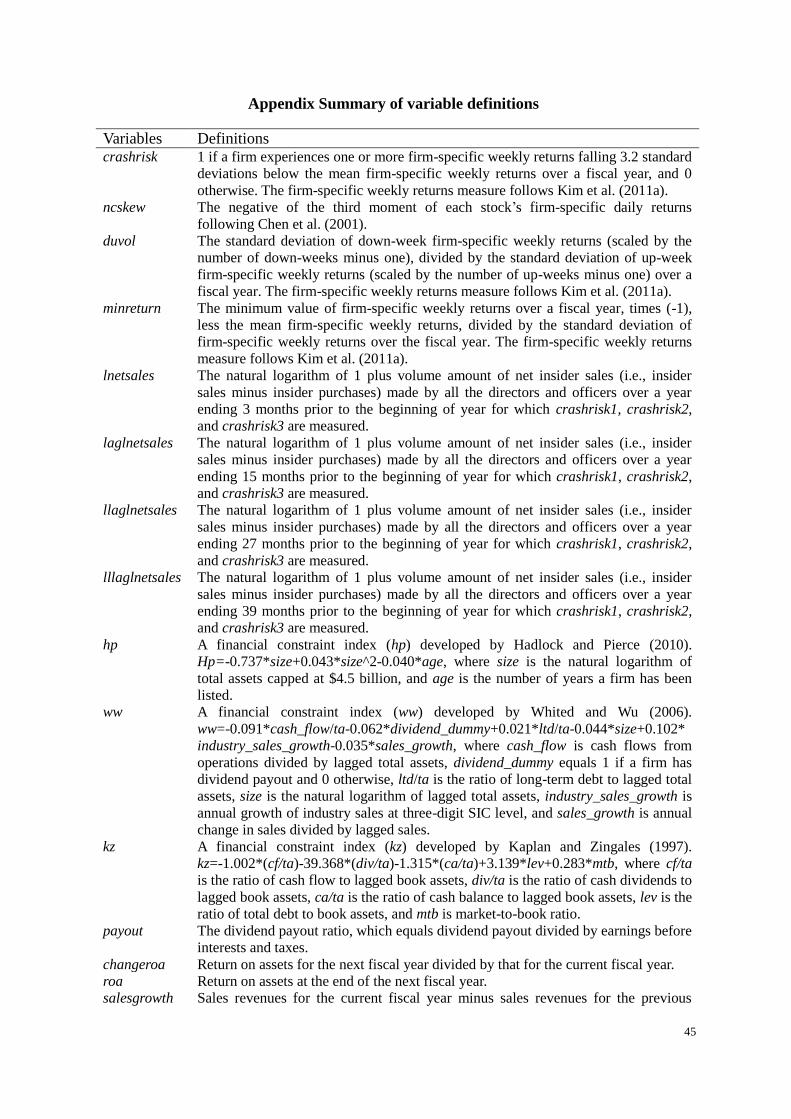
45
Appendix Summary of variable definitions
Variables Definitions crashrisk 1 if a firm experiences one or more firm-specific weekly returns falling 3.2 standard
deviations below the mean firm-specific weekly returns over a fiscal year, and 0
otherwise. The firm-specific weekly returns measure follows Kim et al. (2011a).
ncskew The negative of the third moment of each stock’s firm-specific daily returns
following Chen et al. (2001).
duvol The standard deviation of down-week firm-specific weekly returns (scaled by the
number of down-weeks minus one), divided by the standard deviation of up-week
firm-specific weekly returns (scaled by the number of up-weeks minus one) over a
fiscal year. The firm-specific weekly returns measure follows Kim et al. (2011a).
minreturn The minimum value of firm-specific weekly returns over a fiscal year, times (-1),
less the mean firm-specific weekly returns, divided by the standard deviation of
firm-specific weekly returns over the fiscal year. The firm-specific weekly returns
measure follows Kim et al. (2011a).
lnetsales The natural logarithm of 1 plus volume amount of net insider sales (i.e., insider
sales minus insider purchases) made by all the directors and officers over a year
ending 3 months prior to the beginning of year for which crashrisk1, crashrisk2,
and crashrisk3 are measured.
laglnetsales The natural logarithm of 1 plus volume amount of net insider sales (i.e., insider
sales minus insider purchases) made by all the directors and officers over a year
ending 15 months prior to the beginning of year for which crashrisk1, crashrisk2,
and crashrisk3 are measured.
llaglnetsales The natural logarithm of 1 plus volume amount of net insider sales (i.e., insider
sales minus insider purchases) made by all the directors and officers over a year
ending 27 months prior to the beginning of year for which crashrisk1, crashrisk2,
and crashrisk3 are measured.
lllaglnetsales The natural logarithm of 1 plus volume amount of net insider sales (i.e., insider
sales minus insider purchases) made by all the directors and officers over a year
ending 39 months prior to the beginning of year for which crashrisk1, crashrisk2,
and crashrisk3 are measured.
hp A financial constraint index (hp) developed by Hadlock and Pierce (2010).
Hp=-0.737*size+0.043*size^2-0.040*age, where size is the natural logarithm of
total assets capped at $4.5 billion, and age is the number of years a firm has been
listed.
ww A financial constraint index (ww) developed by Whited and Wu (2006).
ww=-0.091*cash_flow/ta-0.062*dividend_dummy+0.021*ltd/ta-0.044*size+0.102*
industry_sales_growth-0.035*sales_growth, where cash_flow is cash flows from
operations divided by lagged total assets, dividend_dummy equals 1 if a firm has
dividend payout and 0 otherwise, ltd/ta is the ratio of long-term debt to lagged total
assets, size is the natural logarithm of lagged total assets, industry_sales_growth is
annual growth of industry sales at three-digit SIC level, and sales_growth is annual
change in sales divided by lagged sales.
kz A financial constraint index (kz) developed by Kaplan and Zingales (1997).
kz=-1.002*(cf/ta)-39.368*(div/ta)-1.315*(ca/ta)+3.139*lev+0.283*mtb, where cf/ta
is the ratio of cash flow to lagged book assets, div/ta is the ratio of cash dividends to
lagged book assets, ca/ta is the ratio of cash balance to lagged book assets, lev is the
ratio of total debt to book assets, and mtb is market-to-book ratio.
payout The dividend payout ratio, which equals dividend payout divided by earnings before
interests and taxes.
changeroa Return on assets for the next fiscal year divided by that for the current fiscal year.
roa Return on assets at the end of the next fiscal year.
salesgrowth Sales revenues for the current fiscal year minus sales revenues for the previous
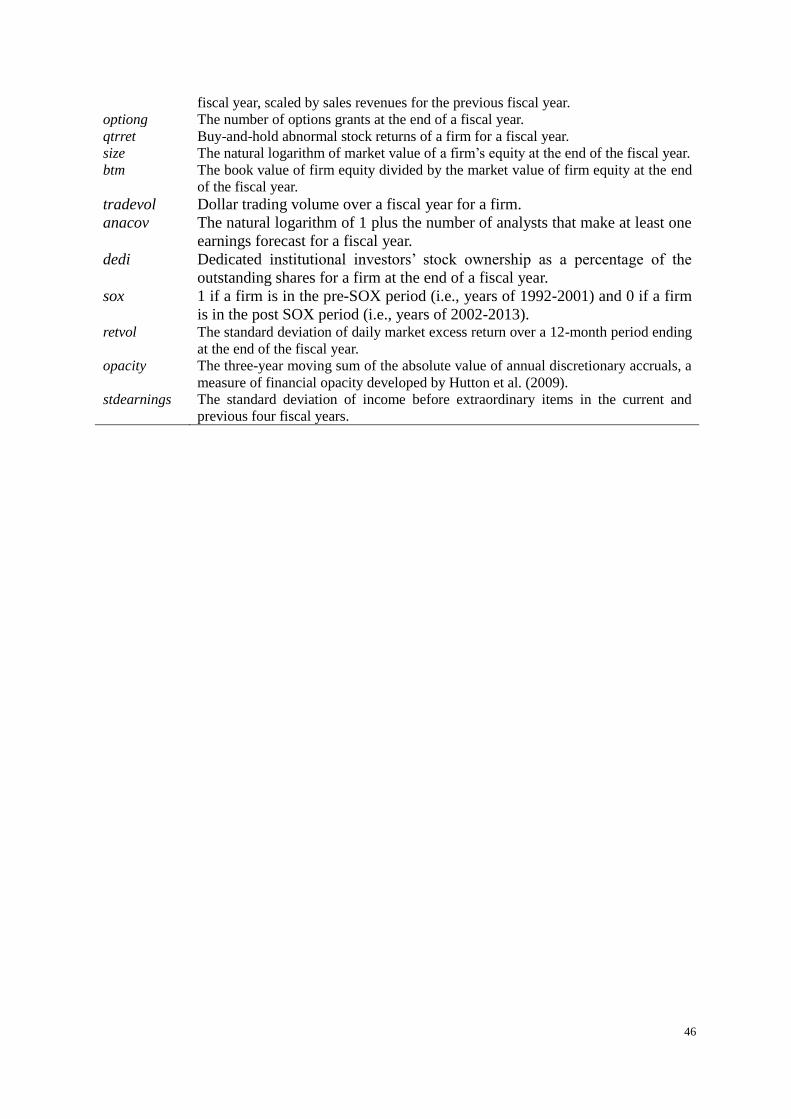
46
fiscal year, scaled by sales revenues for the previous fiscal year.
optiong The number of options grants at the end of a fiscal year.
qtrret Buy-and-hold abnormal stock returns of a firm for a fiscal year.
size The natural logarithm of market value of a firm’s equity at the end of the fiscal year.
btm The book value of firm equity divided by the market value of firm equity at the end
of the fiscal year.
tradevol Dollar trading volume over a fiscal year for a firm.
anacov The natural logarithm of 1 plus the number of analysts that make at least one
earnings forecast for a fiscal year.
dedi Dedicated institutional investors’ stock ownership as a percentage of the
outstanding shares for a firm at the end of a fiscal year.
sox 1 if a firm is in the pre-SOX period (i.e., years of 1992-2001) and 0 if a firm
is in the post SOX period (i.e., years of 2002-2013). retvol The standard deviation of daily market excess return over a 12-month period ending
at the end of the fiscal year.
opacity The three-year moving sum of the absolute value of annual discretionary accruals, a
measure of financial opacity developed by Hutton et al. (2009).
stdearnings The standard deviation of income before extraordinary items in the current and
previous four fiscal years.