Innovators...Agriculture’s Role in The Climate Conversation Economic Sector IPCC Sector U.S....
7
Transcript of Innovators...Agriculture’s Role in The Climate Conversation Economic Sector IPCC Sector U.S....

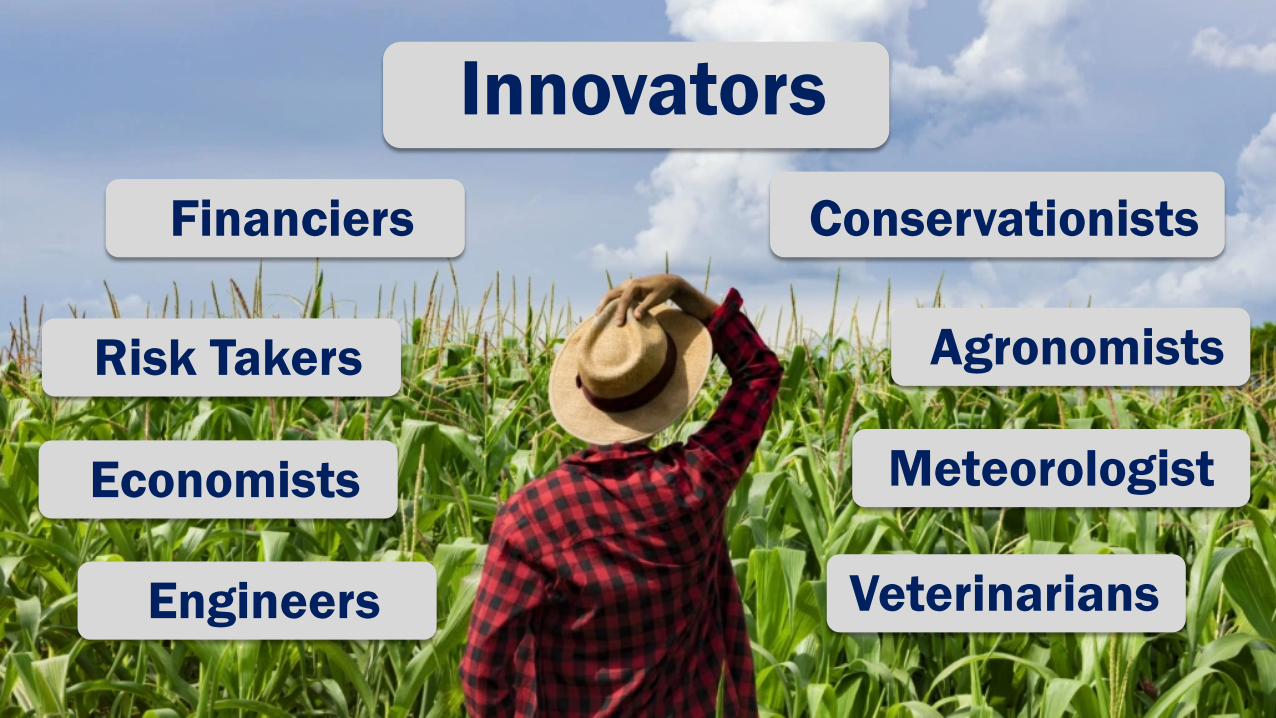
Innovators
Veterinarians
Agronomists
ConservationistsFinanciers
Engineers
Risk Takers
Economists Meteorologist

TRANSPORTATION28.7%
ELECTRICITY GENERATION27.5%
INDUSTRY22.4%
AGRICULTURE9.0%
COMMERCIAL6.5%
RESIDENTIAL5.2%
U.S. TERRITORIES0.7%
Source: Environmental Protection Agency, Farm Bureau Calculations
Agriculture’s Role in The Climate Conversation Economic Sector IPCC Sector
U.S. Inventory of Greenhouse Gas Emissions and Sinks, 2017
ENERGY84.1%
AGRICULTURE8.4%
INDUSTRIAL PROCESSES5.5%
WASTE2.0%

1.85
%
1.90
%
1.95
%
1.95
%
1.98
%
2.02
%
1.95
%
1.89
%
1.85
%
1.82
%
1.75
%
1.77
%
1.76
%
1.75
%
1.69
%
1.69
%
1.75
%
1.74
%
1.77
%
1.87
%
1.80
%
1.79
%
1.82
%
1.76
%
1.71
%
1.77
%
1.88
%
1.95
%
0.61
%
0.62
%
0.60
%
0.58
%
0.57
%
0.56
%
0.54
%
0.53
%
0.52
%
0.53
%
0.53
%
0.53
%
0.53
%
0.53
%
0.50
%
0.51
%
0.53
%
0.54
%
0.57
%
0.61
%
0.59
%
0.61
%
0.64
%
0.62
%
0.62
%
0.64
%
0.66
%
0.67
%
0.0%
0.5%
1.0%
1.5%
2.0%
2.5%
3.0%
3.5%
4.0%
1990 1995 2000 2005 2010 2015
Perc
ent
Beef Cattle Dairy Cattle Swine Other
Source: Environmental Protection Agency, Farm Bureau Calculations
U.S. Livestock Emissions as a Percent of Total GHG Emissions, Based on IPCC Sector, 1990 to 2017 in CO2 Equivalents
Beef Cattleemissions represented 1.95% of total GHG emissions in 2017
Dairy Cattleemissions represented 0.67% of total GHG emissions in 2017
Swine emissions represented 0.04% of total GHG emissions in 2017
Animal Agriculture’s Role in U.S. Greenhouse Gas Emissions is Less than 3%

70
75
80
85
90
95
100
105
110
1990 1992 1994 1996 1998 2000 2002 2004 2006 2008 2010 2012 2014 2016
Inde
x (1
990
= 10
0)
Source: Environmental Protection Agency, USDA FAS PSD Online, Farm Bureau Calculations
Index of Methane Emissions Per Unit of Production for Beef, Dairy and Swine, 1990 = 100
-25%DairyEmissions per unit of milk production have declined by nearly 25% since 1990
-7%BeefEmissions per unit of beef production have declined by more than 7% since 1990, and was more than 10% lower in recent years
-19%SwineEmissions per unit of pork production have declined by more than 19% since 1990
Ag Innovation Provided An Opportunity for Livestock to Get Better & Lower GHG Footprint

121
14
130
48
81
10
88
40
0
20
40
60
80
100
120
140
Corn Cotton Soybeans Wheat
Mill
ion
Acre
s
1990 2018
Source: USDA NASS, Farm Bureau Calculations
Farmers Today Do More With Fewer Acres
-40 MillionIt requires 33% fewer acres in 2018 to produce corn than it would have in 1990
-4 MillionIt requires 27% fewer acres in 2018 to produce cottonthan it would have in 1990
-42 MillionIt requires 33% fewer acres in 2018 to produce soybeans than it would have in 1990
-8 MillionIt requires 17% fewer acres in 2018 to produce wheatthan it would have in 1990
Harvested Acres Needed to Produce the 2018 Crop, 1990 and 2018
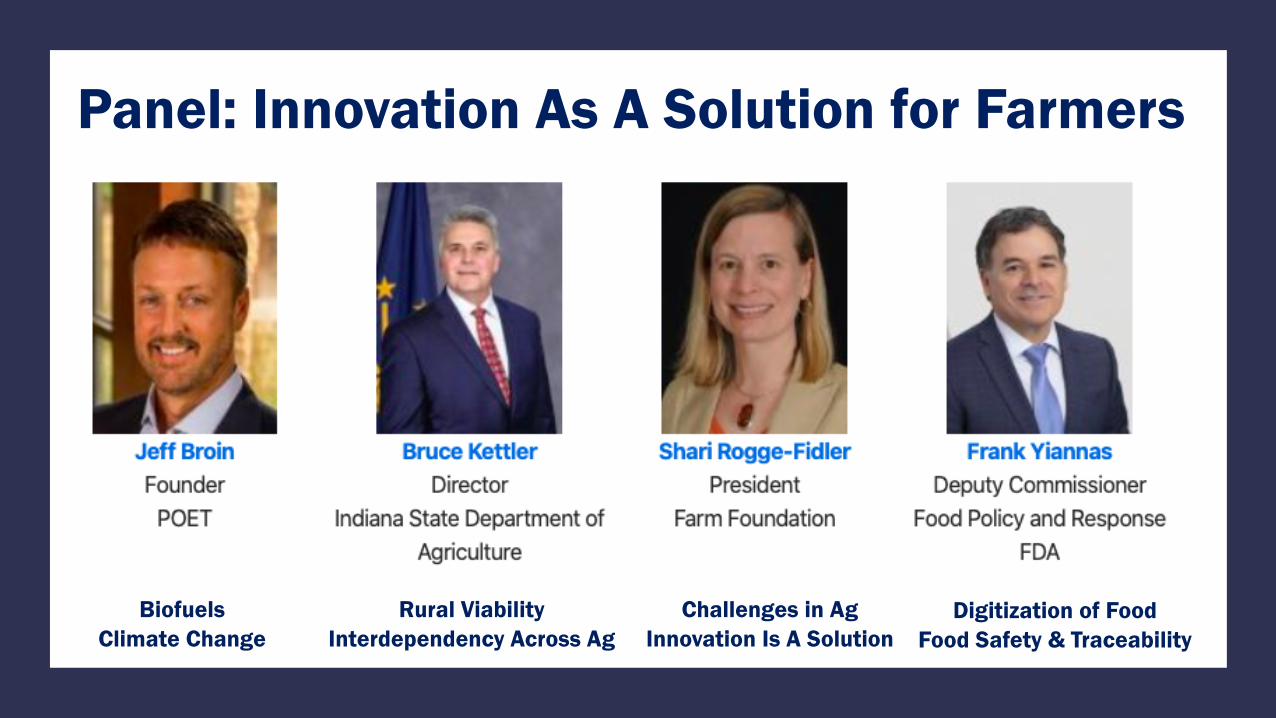
Panel: Innovation As A Solution for Farmers
BiofuelsClimate Change
Rural ViabilityInterdependency Across Ag
Digitization of FoodFood Safety & Traceability
Challenges in AgInnovation Is A Solution