Innovative Design Approaches for Large Wind Turbine Blades ... · SANDIA REPORT SAND2004-0074...
54
SANDIA REPORT SAND2004-0074 Unlimited Release Printed May 2004 Innovative Design Approaches for Large Wind Turbine Blades Final Report TPI Composites, Inc. Prepared by Sandia National Laboratories Albuquerque, New Mexico 87185 and Livermore, California 94550 Sandia is a multiprogram laboratory operated by Sandia Corporation, a Lockheed Martin Company, for the United States Department of Energy’s National Nuclear Security Administration under Contract DE-AC04-94AL85000. Approved for public release; further dissemination unlimited.
Transcript of Innovative Design Approaches for Large Wind Turbine Blades ... · SANDIA REPORT SAND2004-0074...
SANDIA REPORT
SAND2004-0074 Unlimited Release Printed May 2004 Innovative Design Approaches for Large Wind Turbine Blades Final Report
TPI Composites, Inc.
Prepared by Sandia National Laboratories Albuquerque, New Mexico 87185 and Livermore, California 94550 Sandia is a multiprogram laboratory operated by Sandia Corporation, a Lockheed Martin Company, for the United States Department of Energy’s National Nuclear Security Administration under Contract DE-AC04-94AL85000. Approved for public release; further dissemination unlimited.

Issued by Sandia National Laboratories, operated for the United States Department of Energy by Sandia Corporation.
NOTICE: This report was prepared as an account of work sponsored by an agency of the United States Government. Neither the United States Government, nor any agency thereof, nor any of their employees, nor any of their contractors, subcontractors, or their employees, make any warranty, express or implied, or assume any legal liability or responsibility for the accuracy, completeness, or usefulness of any information, apparatus, product, or process disclosed, or represent that its use would not infringe privately owned rights. Reference herein to any specific commercial product, process, or service by trade name, trademark, manufacturer, or otherwise, does not necessarily constitute or imply its endorsement, recommendation, or favoring by the United States Government, any agency thereof, or any of their contractors or subcontractors. The views and opinions expressed herein do not necessarily state or reflect those of the United States Government, any agency thereof, or any of their contractors. Printed in the United States of America. This report has been reproduced directly from the best available copy. Available to DOE and DOE contractors from
U.S. Department of Energy Office of Scientific and Technical Information P.O. Box 62 Oak Ridge, TN 37831 Telephone: (865)576-8401 Facsimile: (865)576-5728 E-Mail: [email protected] Online ordering: http://www.osti.gov/bridge
Available to the public from
U.S. Department of Commerce National Technical Information Service 5285 Port Royal Rd Springfield, VA 22161 Telephone: (800)553-6847 Facsimile: (703)605-6900 E-Mail: [email protected] Online order: http://www.ntis.gov/help/ordermethods.asp?loc=7-4-0#online
2
SAND 2004-0074 Unlimited Release Printed May 2004
INNOVATIVE DESIGN APPROACHES FOR LARGE WIND TURBINE BLADES
FINAL REPORT
WindPACT Blade System Design Studies
TPI Composites, Inc. 373 Market Street Warren, RI 02885
ABSTRACT
The goal of the Blade System Design Study (BSDS) was invest igat ion and eva lua t ion of des ign and manufac tur ing i s sues for wind tu rb ine b lades in the one to t en megawat t s ize range . A ser ies o f ana lys i s t asks were comple ted in support of the design effor t . We began with a parametr ic scal ing s tudy to assess blade s t ructure using current technology. This was fol lowed by an economic s tudy of the cos t to manufac ture , t ranspor t and ins ta l l l a rge b lades . Subsequent ly we ident i f ied several innovat ive design approaches that showed potent ia l for overcoming fundamental physical and manufactur ing constraints . The f ina l s tage o f the p ro jec t was used to deve lop severa l p re l iminary 50m blade designs.
The key design impacts identified in this study are: 1 ) blade cross-sect ions, 2) a l ternat ive mater ia ls , 3 ) IEC design c lass , and 4 ) root a t tachment . The resul ts show that th ick blade cross-sect ions can provide a large reduction in blade weight , whi le maintaining high aerodynamic performance. Increasing blade thickness for inboard sect ions is a key method for improving structural eff ic iency and reducing blade weight . Carbon/glass hybrid blades were found to provide good improvements in blade weight , s t i f fness , and def lect ion when used in the main s t ructural e lements of the blade. The addi t ion of carbon resulted in modest cost increases and provided significant benefits , particularly with respect to def lect ion. The change in design loads between IEC c lasses is qui te s ignif icant . Opt imized blades should be designed for each IEC design class . A s igni f icant por t ion o f b lade weight i s re la ted to the roo t bu i ldup and metal hardware for typical root a t tachment designs. The resul ts show that increasing the number of blade fas teners has a posit ive effect on total weight, because i t reduces the required root laminate thickness.

Acknowledgements
TPI Staff: Derek Berry and Steve Lockard Dynamic Design: Kevin Jackson MDZ Consulting: Mike Zuteck University of California, Davis: Case Van Dam
Sandia Technical Monitors: Tom Ashwill Paul Veers
TABLE OF CONTENTS
TABLE OF CONTENTS ................................................................................................................... 5
LIST OF FIGURES ........................................................................................................................... 6 LIST OF TABLES ............................................................................................................................. 8
1 .o 1 .I 1.2 1.3 1.4 1.5
2.0
2.1 2.2 2.3 2.4 2.5 2.6 2.7 2.8
3.0
3.1 3.2 3.3 3.4 3.5
4.0 4.1
4.2
5.0
5
LIST OF FIGURES
Figure 1 . 1 Figure 2.1 Figure 2.2 Figure 2.3 Figure 2.4 Figure 2.5 Figure 2.6 Figure 2.7 Figure 2.8 Figure 3.1
Figure 3.2
Figure 3.3 Figure 3.4
Figure 3.5
Figure 3.6
Figure 3.7
Figure 3.8
Figure 3.9a
Blade Planform Graph .................................................................................... 12 Representative Flatback Airfoils ............................................................................. 15 18% Thick S831 Airfoil for 95% Radius .................................................................. 15 21 % Thick S830 Airfoil for 75% Radius .................................................................. 16 27% Thick Hybrid Airfoil for 55% Radius ................................................................ 16
Planform & Thickness Distributions ........................................................................ 18 Spar Cap Width Taper Illustration .......................................................................... 19
Close-ups of C-grid (a. b) and O-grid (c. d) used to compute flow about a 30% thick airfoil with 1.7% thick trailing edge ............................................ 26 Effect of blunt trailing edge on mean pressure distribution
Inboard section shapes ..................................................................................... 29 Lift and performance curves of FB 6300-1800 . Soiled conditions modeled by tripping boundary layer at x/c = 0.05 on upper and lower surface . .................................................................................... 30 Lift and performance curves of FB 5487-1 21 6 . Soiled conditions modeled by tripping boundary layer at x/c = 0.05 on upper and lower surface . .................................................................................... 30 Lift and performance curves of FB 4286-0802 . Soiled conditions modeled by tripping boundary layer at x/c = 0.05 on upper and lower surface . .................................................................................... 31 Lift and performance curves of FB 3423-0596 . Soiled conditions modeled by tripping boundary layer at x/c = 0.05 on upper and lower surface . .................................................................................... 32 Lift and performance curves of FB 2700-0230 . Soiled conditions modeled by tripping boundary layer at x/c = 0.05 on upper and lower surface . .................................................................................... 32 Comparison of section lift curves at clean conditions . Reynolds
AeroSolve Preliminary Blade Planform .................................................................. 17
Outboard Spar Cap Width Taper ............................................................................ 19
at a = 8.. Re = 4.5 million. free transition .............................................................. 28
numbers as specified in Table 3.1 .......................................................................... 33 Figure 3.9b Comparison of section lift curves at soiled conditions . Reynolds
numbers as specified in Table 3.1 .......................................................................... 34 Figure 3.10a Comparison of section performance curves at clean conditions .
Reynolds numbers as specified in Table 3.1 .......................................................... 34 Figure 3.10b Comparison of section performance curves at soiled conditions .
Reynolds numbers as specified in Table 3.1 .......................................................... 35 Figure 3.11 a Comparison of FB 2700-0230 section performance characteristics
at Re = 6.3 million and clean conditions ................................................................. 36 Figure 3.1 1 b Comparison of FB 2700-0230 section performance characteristics
at Re = 6.3 million and soiled conditions ................................................................ 36 Figure 3.12 Outboard section shapes ..................................................................................... 37 Figure 3.13a Comparison of S830 and S816 lift curves at Re = 5.78 million .
Soiled conditions modeled by tripping boundary layer at x/c = 0.02 on upper and x/c = 0.05 on lower surface .............................................................. 38
million . Soiled conditions modeled by tripping boundary layer at x/c = 0.02 on upper and x/c = 0.05 on lower surface ................................................... 39
conditions modeled by tripping boundary layer at x/c = 0.02 on upper and x k = 0.05 on lower surface ................................................................... 39
Figure 3.13bComparison of S830 and S816 performance curves at Re = 5.78
Figure 3.14 Lift and performance curves of S830 at Re = 5.28 million . Soiled
6
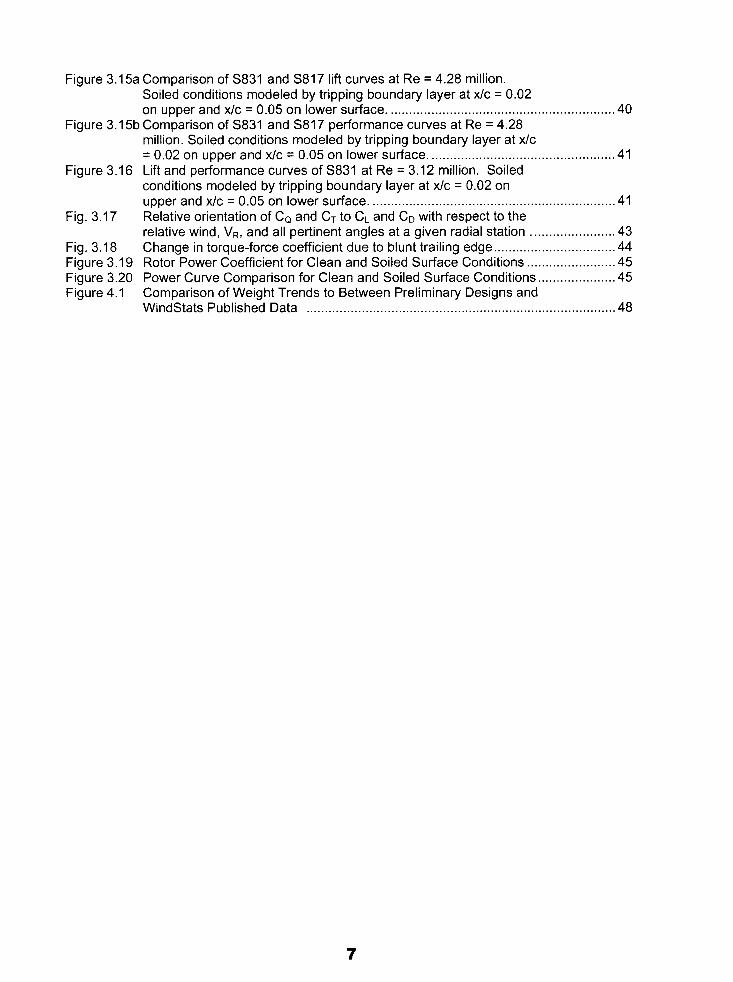
Figure 3.15a Comparison of S831 and S817 lift curves at Re = 4.28 million. Soiled conditions modeled by tripping boundary layer at x/c = 0.02 on upper and x/c = 0.05 on lower surface. ............................................................. 40
Figure 3.15b Comparison of S831 and S817 performance curves at Re = 4.28
Figure 3.16
Fig. 3.17
Fig. 3.18 Figure 3.19 Figure 3.20 Figure 4.1
million. Soiled conditions modeled by tripping boundary layer at x/c = 0.02 on upper and x/c = 0.05 on lower surface ................................................... 41 Lift and performance curves of S831 at Re = 3.12 million. Soiled conditions modeled by tripping boundary layer at x/c = 0.02 on upper and x/c = 0.05 on lower surface. .................................................................. 41 Relative orientation of Ca and CT to CL and CD with respect to the relative wind, VR, and all pertinent angles at a given radial station . ...................... 43 Change in torque-force coefficient due to blunt trailing edge ................................. 44 Rotor Power Coefficient for Clean and Soiled Surface Conditions ........................ 45 Power Curve Comparison for Clean and Soiled Surface Conditions ..................... 45 Comparison of Weight Trends to Between Preliminary Designs and Windstats Published Data .................................................................................... 48
7

LIST OF TABLES
Table 1 . 1 Table 1.2 Table 2.1 Table 2.2 Table 2.3 Table 2.4 Table 2.5 Table 2.6 Table 2.7 Table 2.8 Table 2.9 Table 2.10 Table 3.1
Table 3.2 Table 3.3 Table 3.4
Blade Planform Summary ....................................................................................... 11 IEC Class Ill Blade Extreme Wind Design Bending Moments ............................... 12 Primary Geometric Data ......................................................................................... 18 E-glass Blade Weight and Edgewise Margin Distributions .................................... 20 Carbon Blade Weight and Edgewise Margin Distributions ..................................... 20 E-glass Blade Material Weights and Costs ............................................................ 21 Carbon Hybrid Blade Material Weights and Costs ................................................. 21 Blade Root Attachment Weight and Cost Comparison .......................................... 22 E-glass Blade Tip Deflection .................................................................................. 23 Carbon Hybrid Blade Tip Deflection ....................................................................... 23 E-glass Blade First Frequencies and Stiffness ....................................................... 24 Carbon Hybrid Blade First Frequencies and Stiffness ........................................... 24 Inboard section shapes and corresponding Reynolds numbers for normal operating conditions ................................................................................... 29 Outboard section shapes and corresponding Reynolds numbers ......................... 37 Power Curve Comparison for Clean and Soiled Surface Conditions ..................... 46 Annual Energy Capture at IEC Sites With Clean and Soiled Surface Conditions ................................................................................................. 46
8

I .O ANALYSIS APPROACH
1.1 Goals and Objectives
The primary goal of the WindPACT Blade System Design Study (BSDS) was investigation and evaluat ion of design and manufactur ing issues for wind turbine blades in the one to ten megawatt s ize range. The resul ts of the ini t ia l engineer ing s tudy [ l ] guided design specif icat ions and prel iminary engineer ing for candidate blades in the range of 30 t o 70 meters in length. That init ial project task was to assess the fundamental physical and manufactur ing issues that govern and constrain large blades. The issues and constraints phase o f the p ro jec t en ta i led th ree bas ic e lements : 1 ) a parametric scaling study to assess blade s t ructure t rends for current technology [ 1 1 , 2) a s tudy of the cost to manufacture , t ransport , and instal l large blades (21, and 3 ) identification of promising innovative design approaches that show potent ia l for moving beyond current physical and manufactur ing constraints [3 ] .
Subsequent work pursued the most promising avenues of advancement with prel iminary blade designs for a 50m blade length. The f irst preliminary design approach used a f iberg lass sk in and f iberg lass s t ruc tura l spar , whi le the second used a hybrid carbon/glass spar. Both designs sought to improve structural efficiency by tailoring the thickness of the blade cross-sect ions to s implify construct ion of the inter ior s t ructural members . Inboard the blades used high thickness “f la tback” inboard a i r foi ls , whi le the outboard airfoi l th ickness was solved for the precise thickness and shape to yield the least complex and cost ly internal b lade s t ructure .
1.2 Summary of Parametric Study Results
The large blade parametric review [ l ] estimated peak power output, annual energy capture , design bending moments , b lade laminate weight , and t ip def lect ion for megawatt scale wind turbines with rotors of 62 , 8 3 , 104, 125, and 146 meters in diameter. The annual energy product ion for each rotor s ize was evaluated as a funct ion of t ip speed a t 60, 65 , and 70 m/s , which brackets the operat ing range of typical commercial wind turbines .
Blade design loads were es t imated using two s implif ied methods: parked under extreme winds and an operat ing gust condi t ion. The f i rs t model calculated the extreme loads with the tu rb ine in the parked condi t ion in accordance wi th IEC Class I design recommendat ions. The second calculat ion method es t imated blade spanwise loading under high wind gust condi t ions. Both load es t imat ion approaches provided s imilar resul ts wi th regards to the blade design loads.
S t ruc tura l ana lyses o f th ree representa t ive b lades (“base l ine” , “ th icker” , and “ th ickes t” ) were performed a t representat ive spanwise s ta t ions. The blade construct ion was assumed to be a s t ressed shel l , which was composed of four pr imary components : a low pressure shel l on the downwind s ide, a high pressure shel l on the upwind s ide, and two shear webs bonded between the two shel ls . The propert ies of the blade cross-sect ions were computed a t severa l s ta t ions , which was used to es t imate s t ress and def lec t ion us ing s tandard two- dimensional beam theory.
9
In the range from 30 to 70 meters the blade weight grew as the cube of the length for al l th ree representa t ive b lades s tud ied . The economic per formance of the b lades is inversely related to the specific weight, which is defined as the blade weight divided by capture a rea (kg /m2) . Economics t rends were nega t ive over the range of b lade d iameter s tud ied here; specif ic weight more than doubled over the analysis range.
Increased a i r foi l sect ion thickness appears to be a key tool in l imiting blade weight and cos t g rowth wi th sca le . Thickened and t runca ted t ra i l ing edges in the inboard reg ion provide s t rong, posi t ive effects on blade s t ructural performance. For a given rotor radius , in moving f rom the th in to th ickes t b lade d i s t r ibu t ion the spec i f ic weight was reduced by 15%, due to increased s t ruc tura l per formance .
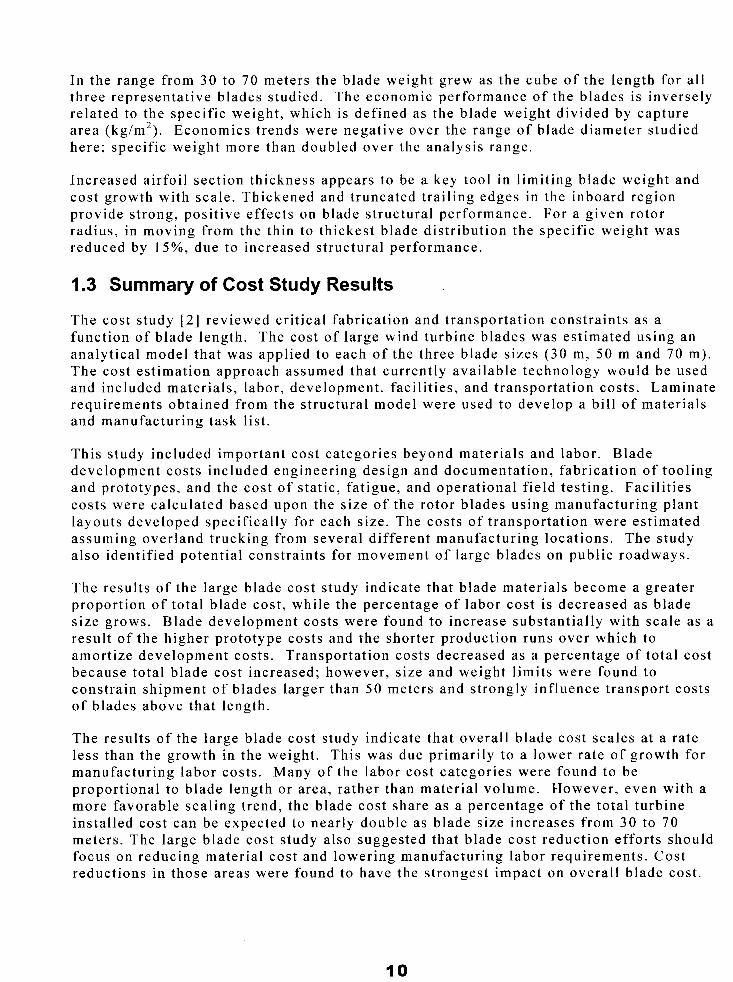
1.3 Summary of Cost Study Results
The cost s tudy [2] reviewed cr i t ical fabr icat ion and t ransportat ion constraints as a func t ion of b lade l ength . The cos t o f l a rge wind tu rb ine b lades was es t imated us ing an analyt ical model that was appl ied to each of the three blade s izes (30 m, 50 m and 70 m). The cost es t imat ion approach assumed that current ly avai lable technology would be used and included materials, labor, development, facil i t ies, and transportation costs. Laminate requirements obtained f rom the s t ructural model were used to develop a bi l l of mater ia ls and manufactur ing task l is t .
This s tudy included important cost categories beyond mater ia ls and labor . Blade development costs included engineer ing design and documentat ion, fabr icat ion of tool ing and prototypes, and the cost of static, fatigue, and operational f ield testing. Facil i t ies cos ts were ca lcu la ted based upon the s ize o f the ro tor b lades us ing manufac tur ing p lan t layouts developed specif ical ly for each s ize . The costs of t ransportat ion were es t imated assuming overland t rucking f rom several d i f ferent manufactur ing locat ions. The s tudy also ident i f ied potent ia l constraints for movement of large blades on publ ic roadways.
The resu l t s o f the l a rge b lade cos t s tudy ind ica te tha t b lade mater ia l s become a greater propor t ion of to ta l b lade cos t , whi le the percentage o f l abor cos t is decreased as b lade s ize grows. Blade development costs were found to increase substant ia l ly with scale as a resul t of the higher prototype costs and the shorter product ion runs over which to amort ize development costs . Transportat ion costs decreased as a percentage o f to ta l cos t because total b lade cost increased; however , s ize and weight l imits were found to constrain shipment of blades larger than 50 meters and s t rongly inf luence t ransport costs of blades above that length.
The resu l t s o f the l a rge b lade cos t s tudy ind ica te tha t overa l l b lade cos t sca les a t a rate less than the growth in the weight . This was due pr imari ly to a lower ra te o f g rowth for manufactur ing labor costs . Many of the labor cost categories were found to be proport ional to blade length or area, ra ther than mater ia l volume. However , even with a more favorable scal ing t rend, the blade cost share as a percentage of the to ta l tu rb ine installed cost can be expected to nearly double as blade size increases from 30 to 70 meters. The large blade cost study also suggested that blade cost reduction efforts should focus on reducing mater ia l cost and lowering manufactur ing labor requirements . Cost reduct ions in those areas were found to have the s t rongest impact on overal l b lade cost .
I O

1.4 Innovative Design Study Results
The innovat ive design s tudy [ 3 ] developed metr ics to compare the s t ructural and aerodynamic character is t ics of di f ferent blade sect ions. This work indicated that inboard sect ions should be weighted more s t rongly toward s t ructural performance, while outboard sect ions are weighted most highly on aerodynamic character is t ics . The most direct method to increase blade sect ion thickness i s to scale exis t ing a i r foi ls . In addi t ion to providing increased structural efficiency, this work showed that the use of specially designed inboard sections will minimize and potentially eliminate performance losses as compared to convent ional a i r foi l sect ions. The innovat ive design s tudy a lso documented a powerful method for designing the blade structure to minimize ply drops and simplify manufactur ing. The concept of designing for s imple s t ructures before f inal iz ing the aerodynamic design has not been widely appl ied in the wind energy industry heretofore, but the approach seems increasing appropriate as turbines grow larger .
The innovat ive design s tudy invest igated several mater ia l opt ions that could be used to reduce blade weight. Carbon/glass hybrid provided excellent weight reduction, but presented some significant challenges for cost and manufacturing. The report recommended that fur ther s tudy of wood/carbon/glass hybrid (zebrawood) be supported. This mater ia l o f fe rs a number of benefi ts and appears to be cost effect ive.
Finally the innovative design study investigated the impact of IEC Design Class on the weight and cost of the blades. The results of the study show that the design class has a major impact on blade weight and cost .
1.5 Summary of Preliminary Design Results
The innovat ive approaches evaluat ion and prel iminary design work assumed a reference blade length of 50 meters. The baseline blade planform characterist ics are as shown in Table 1 . 1 and Figure 1,. 1 (Reynolds No. is a t 10 m/s) . The wind turbine was assumed to have a convent ional , three bladed rotor with the blades mounted a t the root to a central hub.
Table 1.1 Blade Planform Summary
Station Radius Twist Chord Thickness Thickness Reynolds Number Ratio Ratio Number
(deg) (m) (mm) 1 5% 29.5 2.798 2798 100.00% 2.00E+06 2 15% 19.5 4.191 2640 63.00% 3.86E+06 3 25% 13.0 4.267 234 1 54.87% 5.26~+06 4 35% 8.8 4.097 1756 42.86% 6.51 E+06 5 45% 6.2 3.518 1204 34.23% 6.92E+06 6 55% 4.4 2.762 746 27.00% 6.51 E+06 7 65% 3.1 2.218 532 24.00% 6.50E+06
9 85% 0.8 1.232 234 19.00% 4.57E+06 10 95% 0.0 0.789 142 18.OO% 3.12E+06
a 75% 1.9 1.675 352 21 .OO% 5.28E+06
I 1
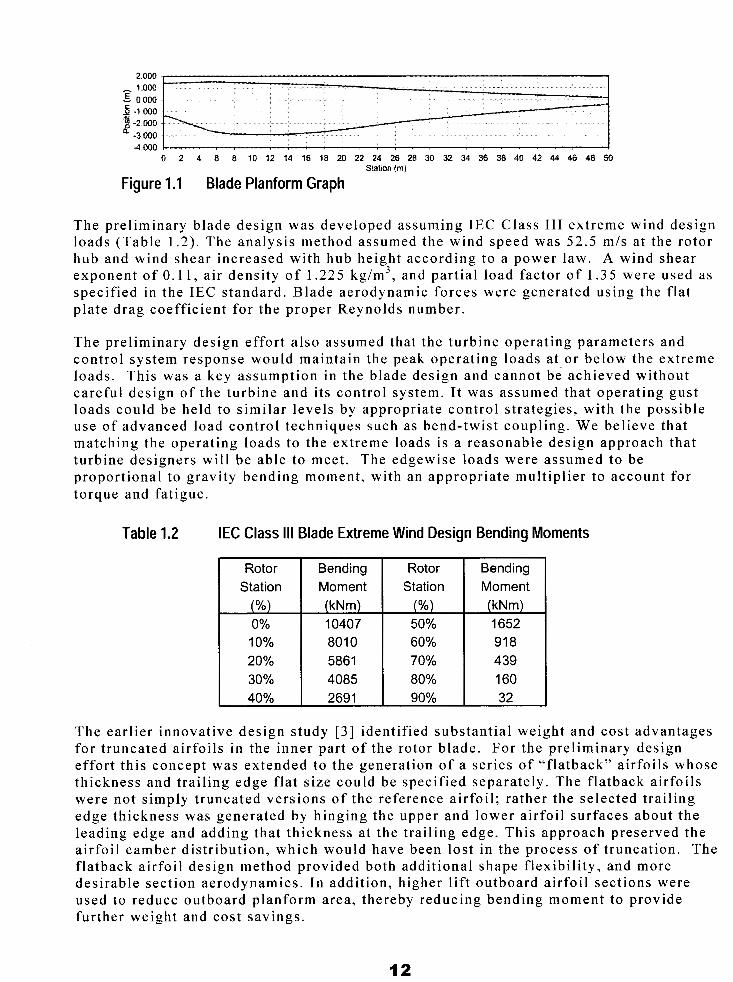
0 2 4 6 8 10 12 14 16 18 20 22 24 26 28 30 32 34 36 38 40 42 44 46 48 50 Station (m)
Figure 1.1 Blade Planform Graph
The prel iminary blade design was developed assuming IEC Class 111 extreme wind design loads (Table 1 .2) . The analysis method assumed the wind speed was 52.5 m/s a t the rotor hub and wind shear increased with hub height according to a power law. A wind shear exponent o f 0.11, a i r dens i ty o f 1.225 kg/m3, and partial load factor of 1.35 were used as specified in the IEC standard. Blade aerodynamic forces were generated using the f lat plate drag coeff ic ient for the proper Reynolds number.
The prel iminary design effor t a lso assumed that the turbine operat ing parameters and control system response would maintain the peak operat ing loads a t or below the extreme loads . This was a key assumption in the blade design and cannot be achieved without careful design of the turbine and i ts control system. I t was assumed that operat ing gust loads could be held to s imilar levels by appropriate control s t ra tegies , wi th the possible use of advanced load control techniques such as bend-twist coupl ing. We bel ieve that matching the operat ing loads to the extreme loads is a reasonable design approach that turbine designers wil l be able to meet . The edgewise loads were assumed to be proport ional to gravi ty bending moment , wi th an appropriate mult ipl ier to account for torque and fa t igue.
Table 1.2 IEC Class 111 Blade Extreme Wind Design Bending Moments
Rotor Station
(%) 0% 10% 20% 30% 40%
Bending Moment
10407
4085 2691
Rotor Moment Station Bending
(%) 50%
(kNm)
439 70% 91 8 60% 1652
32 90% 160 80%
The ear l ier innovat ive design s tudy [3] ident i f ied substant ia l weight and cost advantages for t runca ted a i r fo i l s in the inner par t o f the ro tor b lade . For the p re l iminary des ign e f for t th i s concept was ex tended to the genera t ion of a ser ies of “f la tback” a i r foi ls whose thickness and t ra i l ing edge f la t s ize could be specif ied separately. The f la tback a i r foi ls were not s imply t runcated vers ions of the reference a i r foi l ; ra ther the selected t ra i l ing edge th ickness was genera ted by h inging the upper and lower a i r fo i l sur faces about the lead ing edge and adding tha t th ickness a t the t ra i l ing edge . This approach preserved the air foi l camber dis t r ibut ion, which would have been lost in the process of t runcat ion. The f la tback a i r foi l design method provided both addi t ional shape f lexibi l i ty , and more desirable sect ion aerodynamics. In addi t ion, h igher l i f t outboard a i r foi l sect ions were used to reduce outboard planform area, thereby reducing bending moment to provide fur ther weight and cost savings.
12

Through an i terative procedure, inboard blade thickness was adjusted to match f latwise moment requirements with a constant , buckl ing s table s t ructural spar . Flatback width was adjusted to match edgewise requirements with a constant thickness t ra i l ing edge spl ine. Specifying blade thickness was an expl ic i t var iable provided the design f reedom needed to e l iminate ply drops f rom pr imary s t ructure inboard of 5 5 % radius station (r/R). A high l if t and l if t- to-drag (L/D) airfoil section was chosen for the t ip (95%) airfoi l to reduce bending moment through reduced outboard planform area, whi le an intermediate l if t airfoil was specified at 75% r /R. Both the chord length and design C1 of these sect ions were “solved for” to a l low the constant thickness spar cap to cont inue outward, with only a s imple, mater ia l -eff ic ient , l inear width taper needed to match the f la twise moment requirements . The resul t i s f reedom from spar cap ply drops f rom root bui ldup until near the blade t ip.
Two mater ia l choices were considered for the pr imary blade s t ructure: E-glass and an E- g lasdcarbon hybr id , bo th wi th v inyles te r res in . Two root sys tems were cons idered , internal studs and T-bolts. Studs allow the possibil i ty of saving root weight by using a h igher count o f smal le r fas teners , so in addi t ion to the case of s ixty (60 ) 30mm fasteners, which is fa i r ly typical of current large blades, o ther var ia t ions with one hundred twenty ( 1 20) 20mm fasteners were considered. Both meet minimum fastener s t rength calculat ions according to internat ional ly recognized s tandards [4].
Previous design opt imizat ion work [ 1,2] focused on the weight and cost of the primary blade structure only (blade skins and spar caps). In the current work, this was extended to inc lude the double-b ias (DB) g lass and ba lsa core used for the b lade she l l and shear webs, and other lesser components such as the t ra i l ing edge spl ine, gel coat , surface mat , shel l and web bonding mater ia l . As core turned out to be a big cost component , buckl ing ca lcu la t ions were used to s ize the th ickness o f b lade she l l and web cores , ra ther than the ru le o f thumb es t imates used prev ious ly . Addi t iona l weight cont r ibu t ions for res in in the core , and extra DB in the nose, were a lso added, to create more accurate weight and cost es t imates appropriate for prel iminary design.
I t was found that the glasdcarbon hybrid blade was about a ton l ighter than the E-glass based blade, but the material cost was about $3,300 more. The materials cost of a 60 stud root was about the same as a 60 T-bol t root , but the s tud root weighed a lmost a ton less. The 120 s tud root was es t imated to save near ly half a ton more weight , and about $1800, with fur ther cost savings possible i f a new, lower cost s tud is proven to perform well .
13
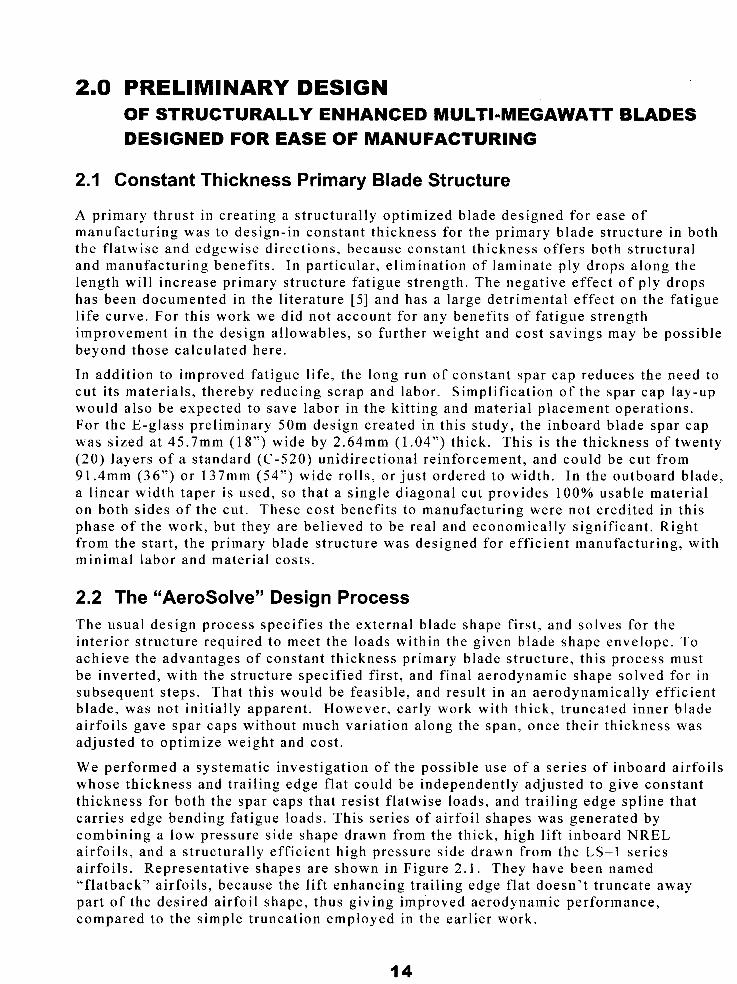
2.0 PRELIMINARY DESIGN OF STRUCTURALLY ENHANCED MULTI-MEGAWATT BLADES DESIGNED FOR EASE OF MANUFACTURING
2.1 Constant Thickness Primary Blade Structure
A primary thrust in creat ing a s t ructural ly opt imized blade designed for ease of manufactur ing was to design-in constant thickness for the pr imary blade s t ructure in both the f la twise and edgewise d i rec t ions , because cons tan t th ickness o f fe rs bo th s t ruc tura l and manufactur ing benefi ts . In par t icular , e l iminat ion of laminate ply drops a long the length wil l increase pr imary s t ructure fa t igue s t rength. The negat ive effect of ply drops has been documented in the l i terature [5] and has a large detr imental effect on the fa t igue l i fe curve. For this work we did not account for any benefi ts of fa t igue s t rength improvement in the design a l lowables , so fur ther weight and cost savings may be possible beyond those ca lcu la ted here .
In addi t ion to improved fa t igue l i fe , the long run of constant spar cap reduces the need to cut i ts mater ia ls , thereby reducing scrap and labor . Simplif icat ion of the spar cap lay-up would a lso be expected to save labor in the ki t t ing and mater ia l p lacement operat ions. For the E-glass prel iminary 50m design created in this s tudy, the inboard blade spar cap was s ized a t 45.7mm (18”) wide by 2.64mm (1.04”) thick. This is the thickness of twenty (20) layers o f a s tandard (C-520) unidirect ional re inforcement , and could be cut f rom 91.4mm (36”) or 137mm (54”) wide rol ls , or just ordered to width. In the outboard blade, a l inear width taper is used, so tha t a s ingle diagonal cut provides 100% usable mater ia l on bo th s ides o f t he cu t . These cos t bene f i t s t o manufac tu r ing were no t c r ed i t ed i n t h i s phase of the work, but they are bel ieved to be real and economical ly s ignif icant . Right f rom the s tar t , the pr imary blade s t ructure was designed for eff ic ient manufactur ing, wi th minimal labor and mater ia l costs .
2.2 The “AeroSoIveyy Design Process The usua l des ign process spec i f ies the ex te rna l b lade shape f i r s t , and so lves for the inter ior s t ructure required to meet the loads within the given blade shape envelope. To achieve the advantages of constant thickness pr imary blade s t ructure , th is process must be inverted, wi th the s t ructure specif ied f i rs t , and f inal aerodynamic shape solved for in subsequent s teps . That this would be feasible , and resul t in an aerodynamical ly eff ic ient blade, was not ini t ia l ly apparent . However , ear ly work with thick, t runcated inner blade airfoi ls gave spar caps without much var ia t ion a long the span, once their th ickness was ad jus ted to op t imize weight and cos t .
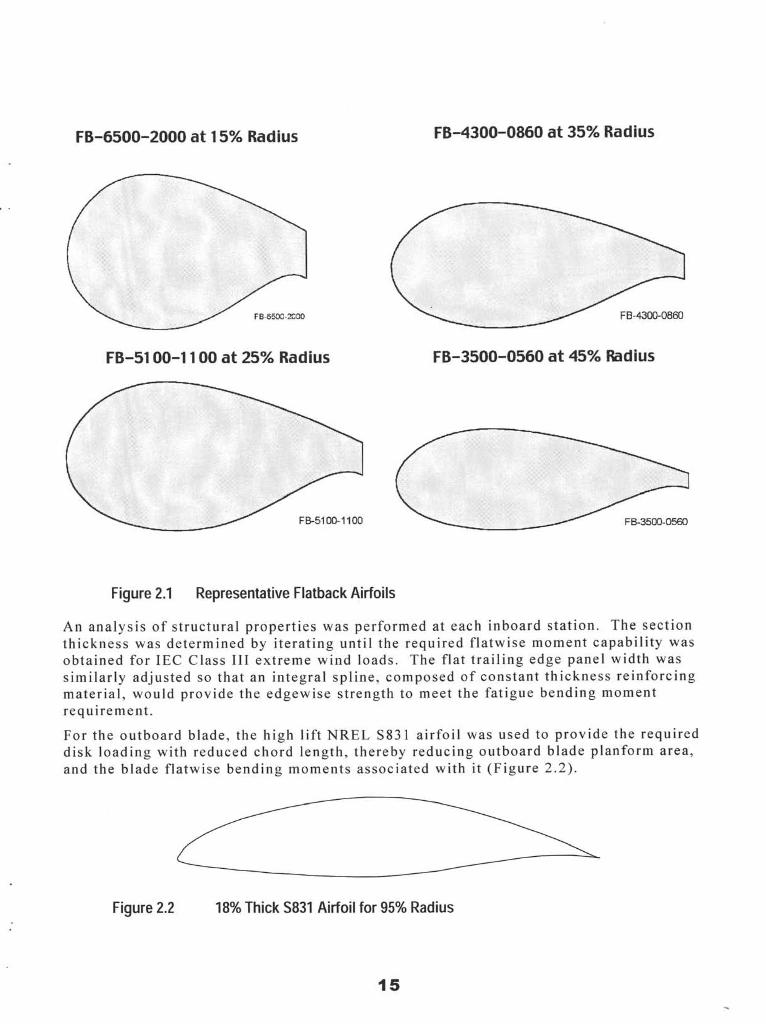
We per formed a sys temat ic inves t iga t ion of the poss ib le use o f a ser ies of inboard a i r foi ls whose th ickness and t ra i l ing edge f la t could be independent ly ad jus ted to g ive cons tan t th ickness for bo th the spar caps tha t res i s t f l a twise loads , and t ra i l ing edge sp l ine tha t car r ies edge bending fa t igue loads . This se r ies o f a i r fo i l shapes was genera ted by combin ing a low pressure side shape drawn from the thick, high l if t inboard NREL airfoi ls , and a s t ructural ly eff ic ient high pressure s ide drawn f rom the LS-1 ser ies a i r foi ls . Representat ive shapes are shown in Figure 2.1 . They have been named “f la tback” a i r foi ls , because the l i f t enhancing t ra i l ing edge f la t doesn’t t runcate away par t of the desired a i r foi l shape, thus giving improved aerodynamic performance, compared to the s imple t runcat ion employed in the earlier work.
14
FB-6500-2000 at 15% Radius F8-4300-0860 at 35% Radius
FB-5100-1100 at 25% Radius
F55100- 11 00
FB-4300-0860
FB-3500-0560 at 45% Radius
FB-3500-0560
Figure 2.1 Representative Flatback Airfoils
An analysis of s t ructural propert ies was performed a t each inboard s ta t ion. The sect ion thickness was determined by i terat ing unt i l the required f la twise moment capabili ty was obtained fo r IEC Class I11 ext reme wind loads. The f la t t ra i l ing edge panel width was s imilar ly adjusted so tha t an integral spl ine, composed o f constant thickness re inforcing material , would provide the edgewise s t rength to meet the fat igue bending moment requirement .
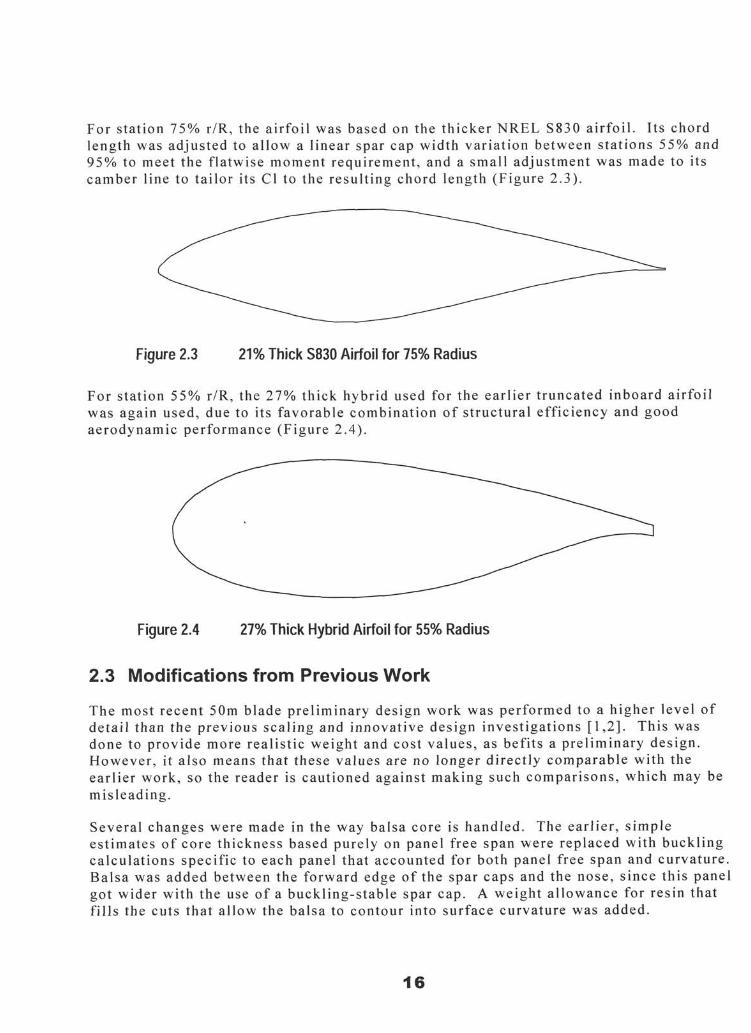
For the outboard blade, the high l if t NREL S831 airfoi l was used to provide the required disk loading with reduced chord length, thereby reducing outboard blade planform area, and the blade f la twise bending moments associated with it (Figure 2.2).
Figure 2.2 18% Thick S831 Airfoil for 95% Radius
15
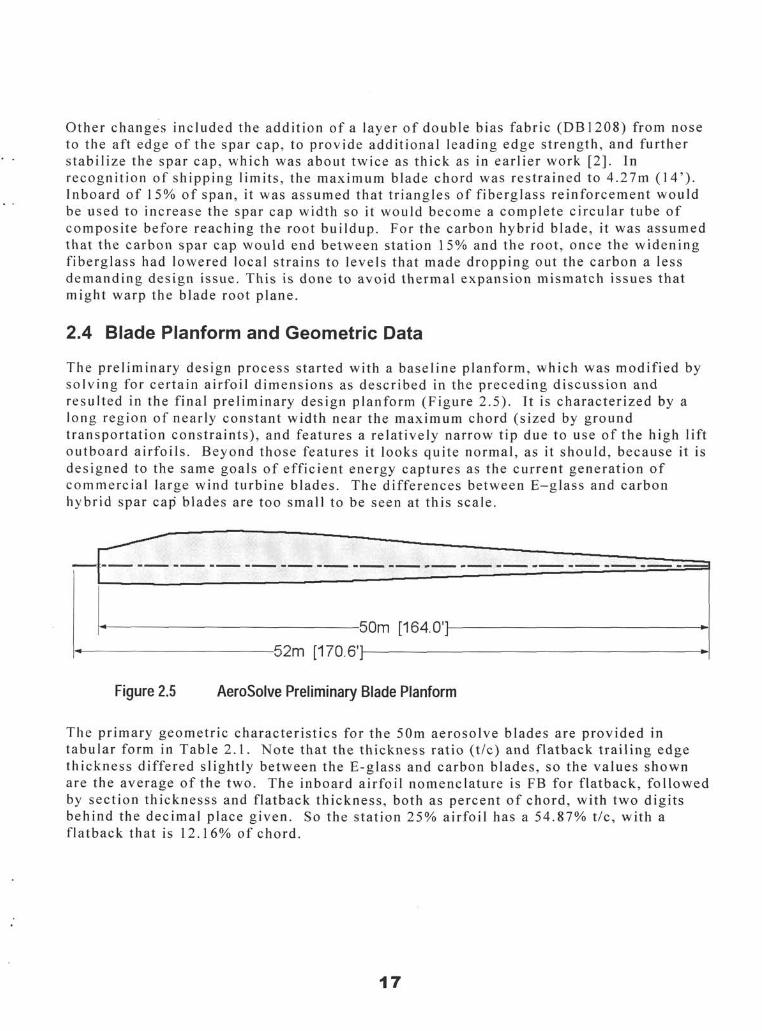
For station 75% r/R, the airfoil was based on the thicker NREL S830 airfoi l . I t s chord length was adjusted to a l low a l inear spar cap width var ia t ion between s ta t ions 5 5 % and
camber line t o tailor i ts C1 t o the result ing chord length (Figure 2.3). 95% t o meet the flatwise moment requirement, and a small adjustment was made t o i ts . -
Figure 2.3 21% Thick S830 Airfoil for 75% Radius
For station 5 5 % r/R, the 27% thick hybrid used for the ear l ier truncated inboard airfoil was again used, due to i ts favorable combination o f s t ructural efficiency and good aerodynamic performance (Figure 2.4).
Figure 2.4 27% Thick Hybrid Airfoil for 55% Radius
2.3 Modifications from Previous Work
The most recent 50m blade preliminary design work was performed t o a higher level of detai l than the previous scal ing and innovative design investigations [ 1,2]. This was done t o provide more real is t ic weight and cost values, a s befits a preliminary design. However, i t a l so means that these values a re no longer directly comparable with the ear l ier work, so the reader is cautioned against making such comparisons, which may be misleading .
Several changes were made in the way balsa core is handled. The earlier, s imple est imates of core thickness based purely on panel f ree span were replaced with buckling calculat ions specif ic to each panel that accounted for both panel f ree span and curvature . Balsa was added between the forward edge of the spar caps and the nose, s ince this panel got wider with the use of a buckling-stable spar cap. A weight a l lowance for resin that f i l ls the cu ts that allow the balsa to contour into surface curvature was added.
.
16
Other changes included the addition of a layer o f double bias fabr ic (DB1208) from nose t o the aft edge o f the spar cap, t o provide additional leading edge strength, and fur ther s tabi l ize the spar cap, which was about twice as thick as in earlier work [2]. In recognition of shipping l imits, the maximum blade chord was restrained t o 4.27m ( 1 4’). Inboard of 15% o f span, i t was assumed that tr iangles o f f iberglass reinforcement would be used t o increase the spar c a p width so i t would become a complete c i rcular tube o f composi te before reaching the root buildup. For the carbon hybrid blade, i t was assumed that the carbon spar cap would end between station 1 5 % and the root, once the widening f iberglass had lowered local s t ra ins t o levels that made dropping out the carbon a less demanding design issue. This is done t o avoid thermal expansion mismatch issues that might warp the blade root plane.
2.4 Blade Planform and Geometric Data
The preliminary design process started with a baseline planform, which was modif ied by solving for certain airfoil dimensions as described in the preceding discussion and resulted in the f inal preliminary design planform (Figure 2.5). I t is character ized by a long region of nearly constant width near the maximum chord (sized by ground transportation constraints), and features a relatively narrow t ip due t o use o f the high l if t outboard airfoils. Beyond those features i t looks qui te normal, as i t should, because it i s designed to the same goals o f eff ic ient energy captures as the current generation o f commercial large wind turbine blades. The differences between E-glass and carbon hybrid spar cap blades are too small to be seen at this scale.
50m [164.0’] c
52m [170.6’] c
Figure 2.5 AeroSolve Preliminary Blade Planform
The primary geometric character is t ics for the 50m aerosolve blades a re provided in tabular form in Table 2. I . Note that the thickness ra t io (t/c) and flatback t ra i l ing edge thickness differed slightly between the E-glass and carbon blades, so the values shown are the average o f the two. The inboard airfoil nomenclature is FB for flatback, fol lowed by sect ion thicknesss and flatback thickness, both a s percent o f chord, with two digi ts behind the decimal place given. So the s ta t ion 25% airfoil has a 54.87% tic, with a flatback that is 12.16% of chord.
17
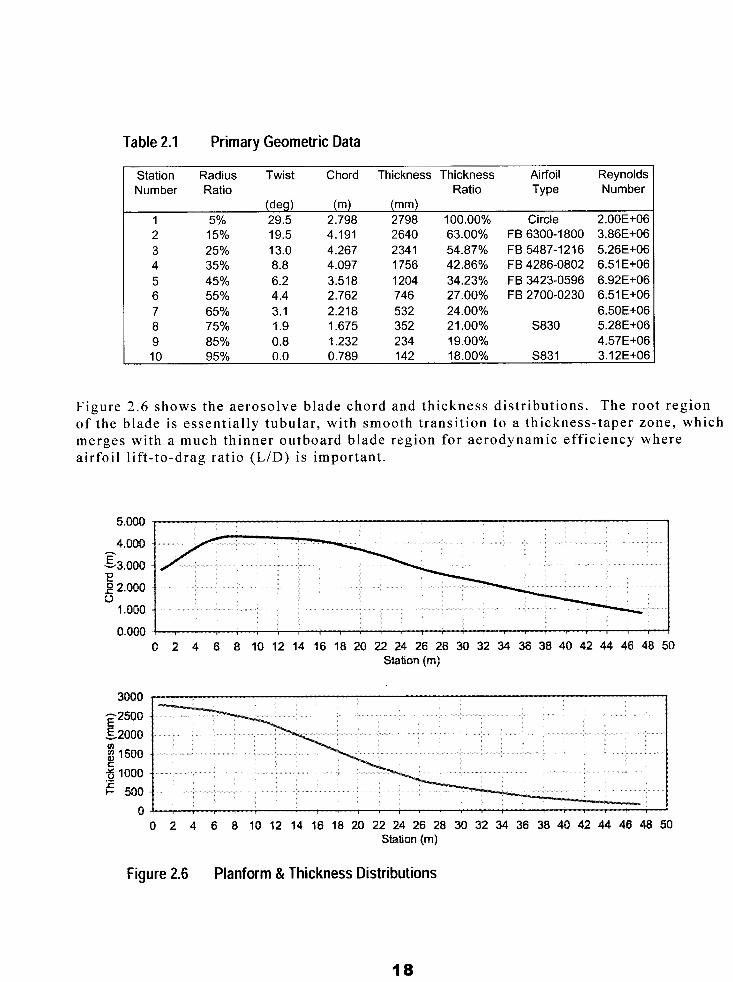
Table 2.1 Primary Geometric Data
Station Radius Twist Chord Thickness Thickness Airfoil Reynolds Number Ratio Ratio Type Number
(de4 (m) (mm) 1 5% 29.5 2.798 2798 100.00% Circle 2.00E+06 2 3 4 5 6 7 8 9 10
15% 25% 35% 45% 55% 65% 75% 85% 95%
19.5 4.191 13.0 4.267 8.8 4.097 6.2 3.518 4.4 2.762 3.1 2.218 1.9 1.675 0.8 1.232 0.0 0.789
2640 234 1 1756 1204 746 532 352 234 142
63.00% 54.87% 42.86% 34.23% 27.00% 24.00% 21 .OO% 19.00% 18.00%
FB 6300-1800 3.86E+06 FB 5487-1216 5.26E+06 FB 4286-0802 6.51 E+06 FB 3423-0596 6.92E+06 FB 2700-0230 6.51 E+06
6.50E+06 S830 5.28E+06
4.57E+06 S831 3.12E+06
Figure 2 . 6 shows the aerosolve blade chord and thickness dis t r ibut ions. The root region of the b lade is essent ia l ly tubular , wi th smooth t ransi t ion to a thickness- taper zone, which merges with a much thinner outboard blade region for aerodynamic eff ic iency where airfoil l if t- to-drag ratio (LID) is important.
5.000
4.000
-3.000 E e 0
- 2 2.000
1 .ooo 0.000
3000
0 2 4 6 8 10 12 14 16 18 20 22 24 26 28 30 32 34 36 38 40 42 44 46 48 50 Station fm]
0 2 4 6 8 10 12 14 16 18 20 22 24 26 28 30 32 34 36 38 40 42 44 46 48 50 Station (mf
Figure 2.6 Planform & Thickness Distributions
18
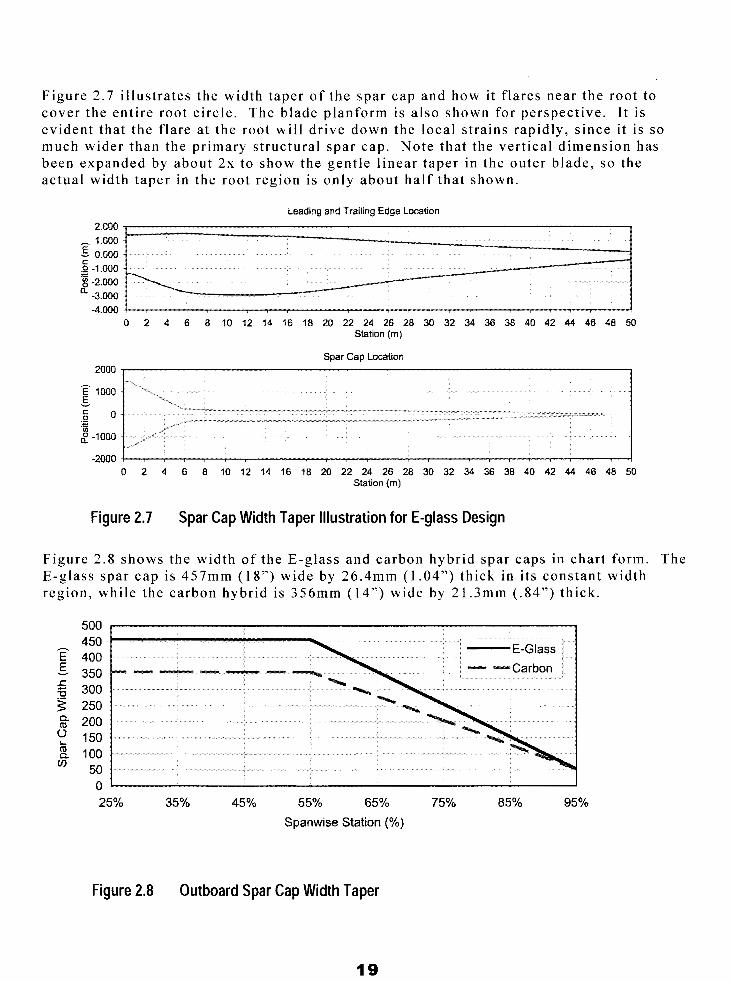
Figure 2 .7 i l lustrates the width taper of the spar cap and how i t f lares near the root to cover the ent i re root c i rc le . The blade planform is a lso shown for perspect ive. I t i s evident that the f lare a t the root wil l dr ive down the local s t ra ins rapidly, s ince i t is so much wider than the primary structural spar cap. Note that the vertical dimension has been expanded by about 2x to show the gentle linear taper i n the outer blade, so the actual width taper in the root region is only about half that shown.
Figure 2.7 Spar Cap Width Taper Illustration for E-glass Design
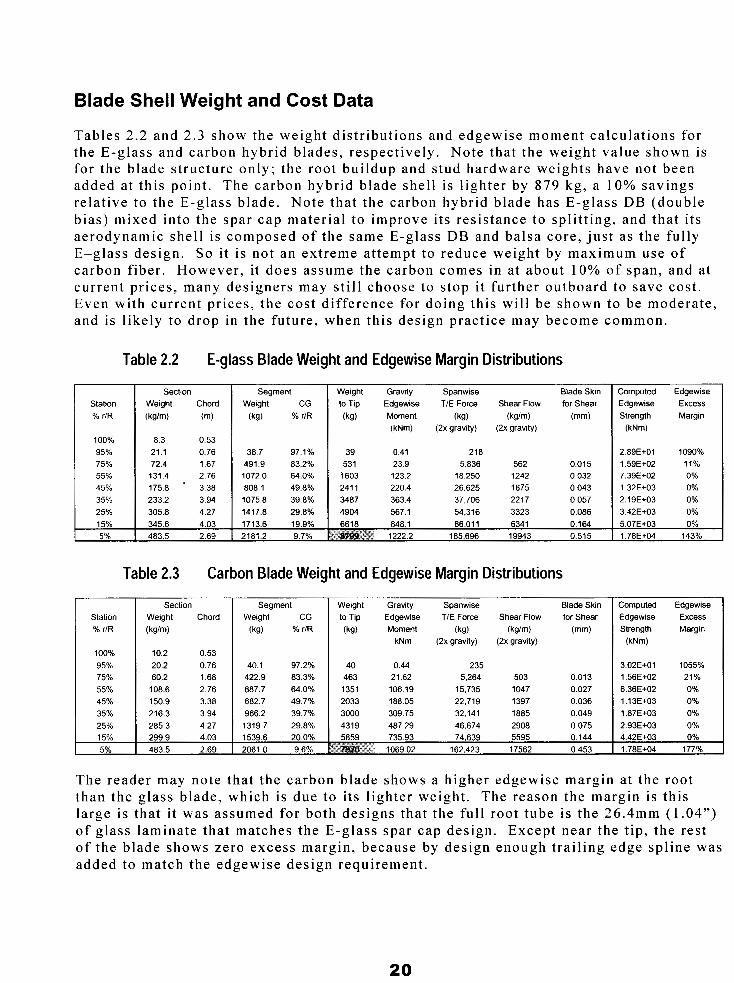
Figure 2 .8 shows the width of the E-glass and carbon hybrid spar caps i n char t form. The E-glass spar cap is 457mm (18”) wide by 26.4mm (1.04”) thick in i ts constant width region, while the carbon hybrid is 356mm (14”) wide by 21.3mm ( .84”) thick.
v
25% 35% 45% 55% 65% 75% 85% 95% Spanwise Station (%)
Figure 2.8 Outboard Spar Cap Width Taper
19
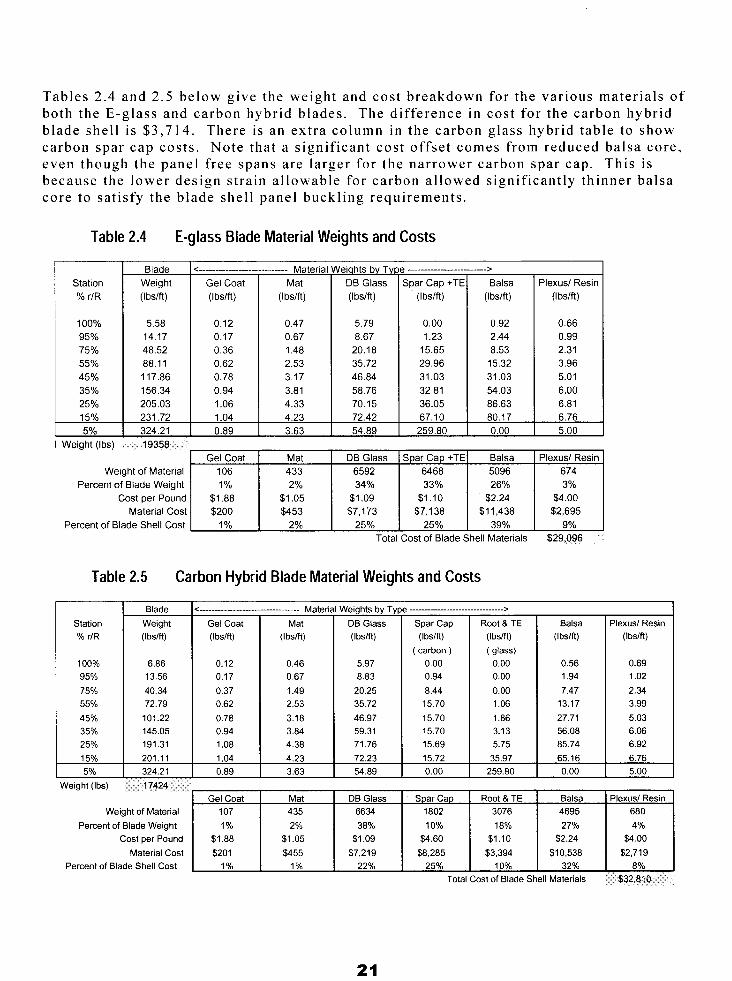
Blade Shell Weight and Cost Data
Tables 2 .2 and 2 .3 show the weight dis t r ibut ions and edgewise moment calculat ions for the E-glass and carbon hybrid blades, respect ively. Note that the weight value shown is for the blade s t ructure only; the root bui ldup and s tud hardware weights have not been added a t th i s po in t . The carbon hybr id b lade she l l i s l igh ter by 879 kg, a 10% savings relat ive to the E-glass blade. Note that the carbon hybrid blade has E-glass DB (double bias) mixed into the spar cap mater ia l to improve i ts res is tance to spl i t t ing, and that i t s aerodynamic shel l i s composed of the same E-glass DB and balsa core , jus t as the ful ly E-glass design. So it is not an extreme attempt to reduce weight by maximum use of carbon f iber. However, i t does assume the carbon comes in at about 1 0 % of span, and a t current pr ices , many designers may s t i l l choose to s top i t fur ther outboard to save cost . Even with current prices, the cost difference for doing this will be shown to be moderate, and is l ikely to drop in the future , when this design pract ice may become common.
Table 2.2 E-glass Blade Weight and Edgewise Margin Distributions
Station % r/R
100% 95% 75% 55% 45% 35% 25% 15%
8.3 0.53 21.1 0.76 72.4 1.67 131 4 2.76 175.8 3.38 233.2 3.94 305.8 4.27 345.6 4.03 483.5 2.69
Segment Weight CG
(kg) % r/R
38.7 97.1% 491.9 83.2% 1072.0 64.0% 808.1 49.8% 1075.8 39.8% 1417.8 29.8% 1713.6 19.9% 2181.2 9.7%
(kg) Moment (kNm) (2x gravity) (2x gravity)
39 0.41 218 2.89E+01 1090%
Table 2.3 Carbon Blade Weight and Edgewise Margin Distributions
% r/R
100% 95% 75% 55% 45% 35% 25% 15%
108.6 2.76 150.9 216.3 285.3 4.27 299.9 4.03 483.5 2.69
kNm (2x gravity) (2x gravity)
40.1 97.2%
Computed Edgewise Edgewise Excess Strength Margin
(kNm)
3.02E+01 1055% 1.56E+02 21% 6.36€+02 0% 1.13€+03 0% 1.87€+03 0% 2.93E+03 0% 4 42E+03 0% 1.78E+04 177%
The reader may note that the carbon blade shows a higher edgewise margin a t the root than the glass blade, which is due to i ts l ighter weight . The reason the margin is th is large is that i t was assumed for both designs that the ful l root tube is the 26.4mm (1.04”) of g lass l amina te tha t matches the E-g lass spar cap des ign . Except near the t ip , the res t o f the b lade shows zero excess margin , because by des ign enough t ra i l ing edge sp l ine was added to match the edgewise des ign requi rement .
20
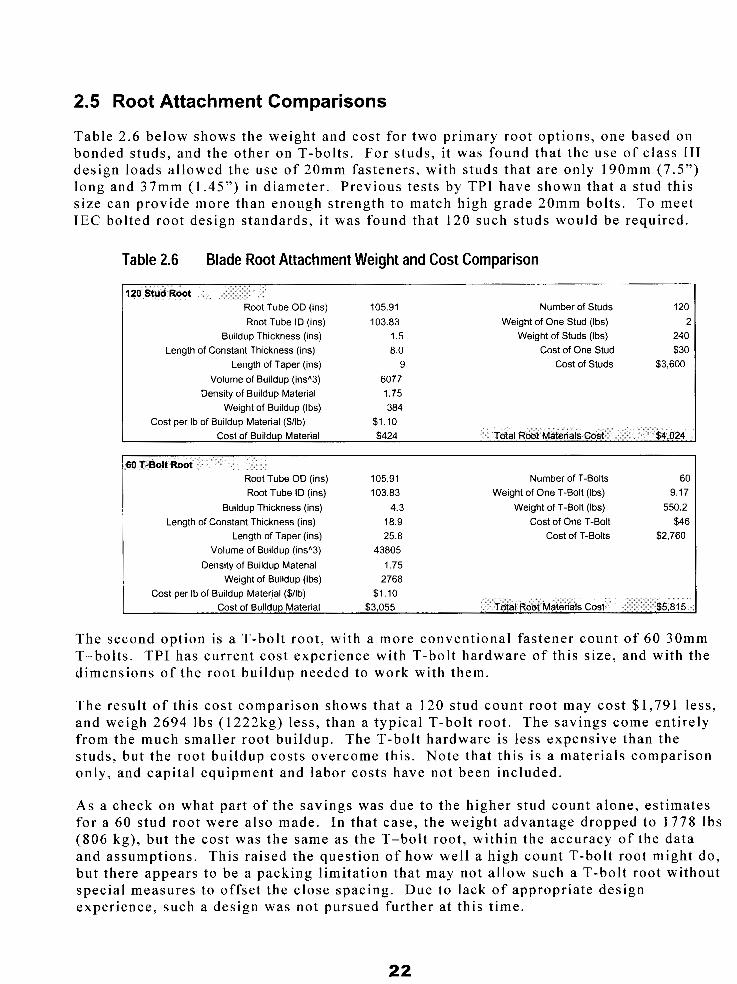
Tables 2.4 and 2.5 below give the weight and cost breakdown for the var ious mater ia ls of both the E-glass and carbon hybrid blades. The difference i n cos t for the carbon hybr id blade shel l is $3,714. There is an extra column in the carbon glass hybrid table to show carbon spar cap costs . Note that a s ignif icant cost offset comes f rom reduced balsa core , even though the panel free spans are larger for the narrower carbon spar cap. This is because the lower design s t ra in a l lowable for carbon a l lowed s ignif icant ly thinner balsa core to sat isfy the blade shel l panel buckl ing requirements .
Table 2.4 E-glass Blade Material Weights and Costs
Station % r/R
100% 95% 75% 55% 45% 35% 25% 15%
I Weight (Ibs)
Blade Weight (Ibs/ft)
5.58 14.17 48.52 88.1 1 117.86 156.34 205.03 231.72 324.21 19358
Weight of Material Percent of Blade Weight
Cost per Pound Material Cost
Percent of Blade Shell Cost
Gel Coat (I bslft)
0.12 0.17 0.36 0.62 0.78 0.94 1.06 1.04 0.89
_ _ _ _ _ _ _ Materia Mat
(Ibslft)
0.47 0.67 1.48 2.53 3.17 3.81 4.33 4.23 3.63
DB Glass (Ibs/ft)
5.79 8.67
20.18 35.72 46.84 58.76 70.15 72.42 54.89
ilei hts b T e 1 (I bs/ft) (I bs/ft)
15.65 29.96 15.32 31.03 31.03 32.81 54.03 36.05 86.63 67.10 80.17
259.80 ! >lexus/ Resin (I bs/ft )
0.66 0.99 2.31 3.96 5.01 6.00 6.81 6.76 5.00 J
Gel Coat I Mat I DB Glass I Spar Cap +TEI Balsa I Plexus/ Resin 106 433 I 6592 I 6468 I 5096 I 674 1 %
$2,695 $1 1,438 $7.1 38 $7,173 $453 $200 $4.00 $2.24 $1.10 $1.09 $1.05 $1.88
3% 26% 33% 34% 2%
1 % 2% 25% 25% 9% 39% Total Cost of Blade Shell Materials $29,096
Table 2.5 Carbon Hybrid Blade Material Weights and Costs
Station % r/R
Blade Weight (Ibslft)
100% 95% 75% 55% 45% 35% 25% 15% 5%
Weight (Ibs)
13.56
72.79 101.22 145.05 191.31
Weight of Material Percent of Blade Weight
Cost per Pound Material Cost
Percent of Blade Shell Cost
c Material Weights by Type . . . . . . . . . . . . . . . . . . . . . . . . . . . . . . . >
Gel Coat Mat DB Glass Spar Cap Root & TE (Ibs/ft) (Ibs/ft) (Ibs/ft) (Ibslft) (Ibslft)
( carbon ) ( glass) 0.12 0.46 5.97 0.00 0.00 0.1 7 0.67 8.83 0.94 0.00 0.37 1.49 20.25 8.44 0.00 0.62 2.53 35.72 15.70 1.06 0.78 3.18 46.97 15.70 1.86 0.94 3.84 59.31 15.70 3.13 1.08 4.38 71.76 15.69 5.75 1.04 4.23 72.23 15.72 35.97 0.89 3.63 54.89 0.00 259.80
Gel Coat Root & TE
38% 10% 18% $1.88 $1.05 $1.09 $4.60 $1.10 $201 $455 $7,219 $8,285 $3,394
1% 22% 25% 10% Total Cost of Blade SI
21
Balsa Plexus/ Resin (I bs/ft) (I bs/ft)
0.56 0.69 1.94 1.02 7.47 2.34
13.17 3.99 27.71 5.03 56.08 6.06 85.74 6.92 65.16 6.76 0.00 5.00
27% $2.24 $4.00
$10,538 $2,719
511 Materials $32,810 32%
2.5 Root Attachment Comparisons
Table 2 .6 below shows the weight and cost for two pr imary root opt ions, one based on bonded s tuds, and the other on T-bol ts . For s tuds, i t was found that the use of c lass I11 design loads a l lowed the use of 20mm fasteners , wi th s tuds that are only 190mm (7.5”) long and 37mm (1.45”) in diameter . Previous tes ts by TPI have shown that a s tud this size can provide more than enough strength to match high grade 20mm bolts. To meet IEC bol ted root design s tandards, i t was found that 120 such s tuds would be required.
Table 2.6 Blade Root Attachment Weight and Cost Comparison
120 Stud Root Root Tube OD (ins) 105.91 Number of Studs 120 Root Tube ID (ins) 103.83 Weight of One Stud (Ibs) i
Buildup Thickness (ins) 1.5 Weight of Studs (Ibs) 240 Length of Constant Thickness (ins) 8.0 Cost of One Stud $30
Length of Taper (ins) 9 Cost of Studs $3,600 Volume of Buildup (ins”3) 6077
Density of Buildup Material 1.75 Weight of Buildup (Ibs) 384
Cost per Ib of Buildup Material ($Ab) $1.10 Cost of Buildup Material $424 Total Root Materials Cost $4,024
Number of T-Bolts 60 Weight of One T-Bolt (Ibs) 9.17
Weight of T-Bolt (Ibs) 550.2 Cost of One T-Bolt $46
Cost of T-Bolts $2,760
Cost per Ib of Buildup Material ($lib) $1.10 Cost of Buildup Material $3,055 Total Root Materials Cost $5,815
Root Tube OD (ins) Root Tube ID (ins)
Buildup Thickness (ins)
Length of Taper (ins) Volume of Buildup (ins”3)
Length of Constant Thickness (ins)
Density of Buildup Material Weight of Buildup (Ibs)
105.91 103.83
4.3 18.9 25.8
43805 1.75
2768
The second op t ion is a T-bol t root , wi th a more convent ional fas tener count of 60 30mm T-bolts. TPI has current cost experience with T-bolt hardware of this size, and with the d imens ions o f the roo t bu i ldup needed to work wi th them.
The resu l t o f th i s cos t compar ison shows tha t a 120 stud count root may cost $1,791 less, and weigh 2694 lbs ( 1 222kg) less , than a typical T-bol t root . The savings come ent i re ly f rom the much smal le r roo t bu i ldup . The T-bol t hardware i s l ess expens ive than the s tuds, but the root bui ldup costs overcome this . Note that th is is a mater ia ls comparison only, and capital equipment and labor costs have not been included.
A s a check on what par t of the savings was due to the higher s tud count a lone, es t imates fo r a 60 s tud root were a lso made. In that case, the weight advantage dropped to 1778 lbs (806 kg) , but the cost was the same as the T-bol t root , wi thin the accuracy of the data and assumptions. This ra ised the quest ion of how wel l a high count T-bol t root might do, but there appears to be a packing l imitation that may not al low such a T-bol t root without special measures to offset the c lose spacing. Due to lack of appropriate design experience, such a design was not pursued fur ther a t th is t ime.
22
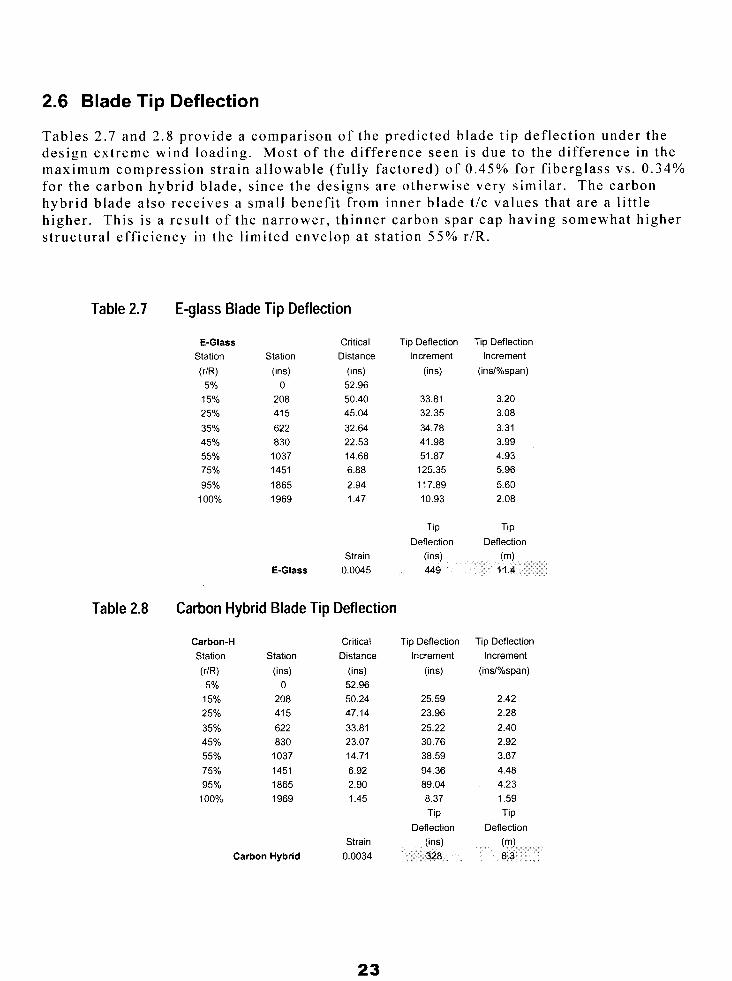
2.6 Blade Tip Deflection
Tab les 2.7 and 2.8 provide a comparison of the predicted blade t ip def lect ion under the design extreme wind loading. Most of the difference seen is due to the difference in the maximum compression s t ra in a l lowable ( ful ly factored) of 0 .45% for f iberglass vs . 0.34% for the carbon hybrid blade, s ince the designs are otherwise very s imilar . The carbon hybrid blade a lso receives a small benefit from inner blade t /c values that are a l i t t le h igher . This is a resul t of the narrower, th inner carbon spar cap having somewhat higher s t ructural eff ic iency in the l imited envelop at station 5 5 % r/R.
Table 2.7 E-glass Blade Tip Deflection
E-Glass Station
( W 5%
15% 25% 35% 45% 55% 75% 95%
100%
Station (ins)
0 208 41 5 622 830
1037 1451 1865 1969
Critical Distance
(ins) 52.96 50.40 45.04 32.64 22.53 14.68 6.88 2.94 1.47
Tip Deflection Increment
(ins)
33.81 32.35 34.78 41.98 51.87
125.35 117.89 10.93
Tip Deflection Increment
(ins/%span)
3.20 3.08 3.31 3.99 4.93 5.96 5.60 2.08
Tip Tip Deflection Deflection
Strain (ins) ( 4 €-Glass 0.0045 449 11.4
Table 2.8 Carbon Hybrid Blade Tip Deflection
Carbon-H Station Station
WR) (ins) 5 yo 0
15% 208 25% 41 5 35% 622 45% 830 55% 1037 75% 1451 95% 1865
100% 1969
Carbon Hybrid
Critical Distance
(ins) 52.96 50.24 47.14 33.81 23.07 14.71 6.92 2.90 1.45
Strain 0.0034
Tip Deflection Increment
(ins)
25.59 23.96 25.22 30.76 38.59 94.36 89.04 8.37 Tip
Deflection
Tip Deflection Increment
(ins/%span)
2.42 2.28 2.40 2.92 3.67 4.48 4.23 1.59 Tip
Deflection
23
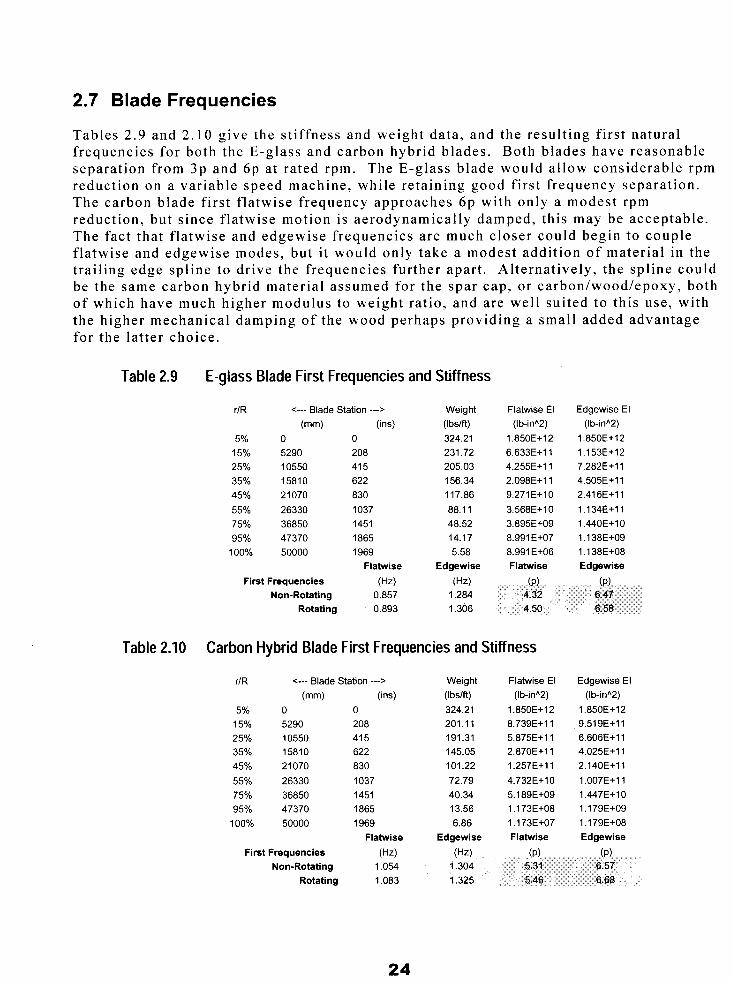
2.7 Blade Frequencies
Tables 2 .9 and 2.10 give the s t i f fness and weight data , and the resul t ing f i rs t natural f requencies for both the E-glass and carbon hybrid blades. Both blades have reasonable separa t ion f rom 3p and 6 p at rated rpm. The E-glass blade would allow considerable rpm reduct ion on a var iable speed machine, whi le re ta ining good f i rs t f requency separat ion. The carbon blade f i rs t f la twise f requency approaches 6p with only a modest rpm reduct ion, but s ince f la twise motion is aerodynamical ly damped, this may be acceptable . The fac t tha t f la twise and edgewise f requencies a re much c loser could begin to couple f la twise and edgewise modes , bu t i t would on ly t ake a modes t addi t ion o f mater ia l in the t ra i l ing edge spl ine to dr ive the f requencies fur ther apar t . Al ternat ively, the spl ine could be the same carbon hybrid mater ia l assumed for the spar cap, or carbon/wood/epoxy, both of which have much h igher modulus to weight ra t io , and a re wel l su i ted to th i s use , wi th the higher mechanical damping of the wood perhaps providing a small added advantage for the la t ter choice.
Table 2.9 E-glass Blade First Frequencies and Stiffness
rlR <--- Blade Station ---> (mm) (ins)
5% 0 0 15% 5290 208 25% 10550 41 5 35% 15810 622 45% 21070 830 55% 26330 1037 75% 36850 1451 95% 47370 1865
100% 50000 1969 Flatwise
First Frequencies (Hz) Non-Rotating 0.857
Rotating 0.893
Weight (I bslft) 324.21 231.72 205.03 156.34 117.86 88.1 1 48.52 14.17 5.58
Edgewise
(Hz) 1.284 1.306
Flatwise El (Ib-in"2)
1.850E+12 6.633E+I 1 4.255E+I 1 2.098E+lI 9.271 E+IO 3.568E+10 3.895E+09
8.991 E+06 Flatwise
8.991 E+07
(PI 4.32 4.50
Table 2.10 Carbon Hybrid Blade First Frequencies and Stiffness
5% 0 15% 5290 25% 10550 35% 15810 45% 21070 55% 26330 75% 36850 95% 47370
100% 50000
r/R c--- Blade Station ---> (mm) (ins)
0 208 41 5 622 830 1037 1451 1865 1969
Flatwise 'S (Hz)
Non-Rotating 1.054 Rotating 1.083
First Frequencie
Weight (I bslft) 324.21 201 . I 1 191.31 145.05 101.22 72.79 40.34 13.56 6.86
Edgewise
Flatwise El (Ib-in"2)
1.850E+12 8.739E+11 5.875E+11 2.870E+11 1.257E+I 1 4.732E+10
1.173E+08 5.1 89E+09
1.173E+07 Flatwise
24
3.0 AERODYNAMIC PERFORMANCE OF STRUCTURALLY OPTIMIZED BLADE CROSS-SECTIONS
3.1 Background
The aerodynamic performance character is t ics of the blade sect ion shapes introduced in the previous chapter were analyzed using several different computational f luid dynamic (CFD) methods including the previously appl ied [ 1.31 viscous-inviscid interaction method MSES [6,7]. Because of concerns regarding the accuracy of this type of methodology for very thick airfoils and i ts validity for airfoils with significant trail ing edge bluntness, the s tudy progressed to several Reynolds-averaged Navier-Stokes (RANS) methods ( INS2D [8,9], ARC2D [lo], and OVERFLOW [ 111). Standish & van Dam [ 121 present more information on these methods. Given the agreement between the solut ions of the three RANS solvers as demonstrated in [ 121, the difficult ies encountered applying TNS2D to 0- grids , and the fact that OVERFLOW requires about three t imes the computat ional resources of ARC2D because of i ts 3-D character , ARC2D was selected to provide RANS so lu t ions fo the var ious sec t ion shapes .
ARC2D was developed by T. Pul l iam and J . Steger a t the NASA Ames Research Center [ IO] . The code so lves the compress ib le , two-dimens iona l , Reynolds-averaged Navier - Stokes equat ions in s t rong conservat ion-law form. The governing equat ions in general ized curvi l inear coordinates are central d i f ferenced in s tandard second-order form and solved using the implici t Beam-Warming approximate factor izat ion scheme [13] . Art i f ic ia l d iss ipat ion terms are added for numerical s tabi l i ty with the 2”d order diss ipat ion coeff ic ient = 0.00 and the 4‘h order d i ss ipa t ion coef f ic ien t = 0.64. Computat ions can be conducted in e i ther s teady-state or t ime-accurate modes. Steady- s ta te calculat ions ut i l ize space-varying t imesteps for improved convergence ra tes , and the user is given the power to define mesh and t imestep sequencing scenarios to further enhance computat ional eff ic iency. Time-accurate solut ions can be run with a second- order accurate subi terat ion t ime-advancing scheme [14] , in which the user can specify values for parameters such as the number of subi terat ions, physical t imestep and pseudo t imestep.
ARC2D contains an assor tment of turbulence models with the one-equat ion Spalar t - Allmaras model [15] used in the present study. ARC2D also has the option to use low- Mach number precondi t ioning that i s meant to improve the solver accuracy and eff ic iency as the f low approaches incompressible condi t ions, but precondi t ioning was not ut i l ized in this s tudy. Due to the lack of any t ransi t ion predict ion models in the RANS solvers , a l l RANS free t ransi t ion resul ts in this s tudy are , in fact , results obtained with transit ion specif ied a t the locat ions predicted by using MSES. The t ransi t ion predict ion model incorporated in MSES is referred to as the “envelope method”, which is a s implif ied vers ion of the e” method.
In this s tudy, the pr imary gr id generat ion tool for the RANS methods is a program cal led OVERGRID [16] . OVERGRTD serves as a valuable tool for visual iz ing, construct ing, manipulat ing, and diagnosing many types of gr ids and geometr ies . Two different gr id types have been used in this study. C-grids (e.g. , Fig. 3.1 a and 3 . lb) have been used for the var ious a i r foi ls wi th sharp t ra i l ing edges while O-grids (e .g . , Fig. 3 . lc and 3 . ld) were
25
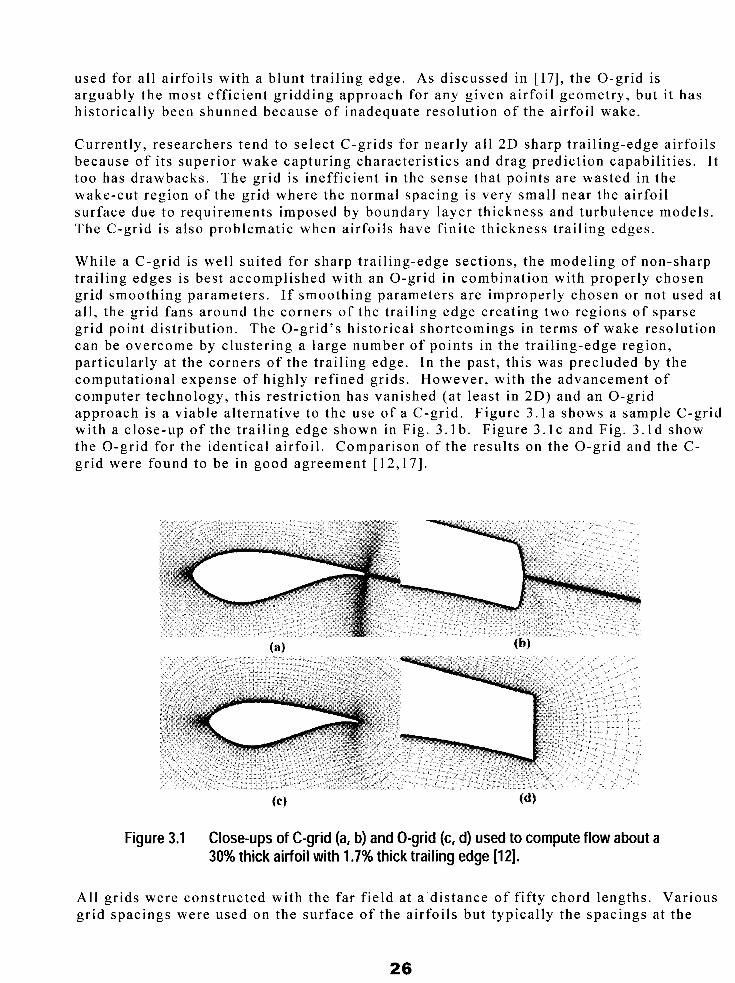
used for al l airfoils with a blunt t ra i l ing edge. As discussed in [17], the 0-grid is arguably the most eff ic ient gr idding approach for any given a i r foi l geometry, but i t has historically been shunned because of inadequate resolution of the a i r foi l wake.
Current ly , researchers tend to select C-grids for near ly a l l 2D sharp t ra i l ing-edge a i r foi ls because of i ts superior wake captur ing character is t ics and drag predict ion capabi l i t ies . I t too has drawbacks. The gr id is inefficient in the sense that points are wasted in the wake-cut region of the gr id where the normal spacing is very small near the a i r foi l sur face due to requi rements imposed by boundary l ayer th ickness and tu rbulence models . The C-grid is a lso problematic when a i r foi ls have f ini te thickness t ra i l ing edges.
While a C-grid is wel l sui ted for sharp t ra i l ing-edge sect ions, the model ing of non-sharp t ra i l ing edges is best accomplished with an 0-gr id in combinat ion with properly chosen gr id smoothing parameters . I f smoothing parameters are improperly chosen or not used a t al l , the grid fans around the corners of the trail ing edge creating two regions of sparse gr id point d is t r ibut ion. The 0-gr id’s his tor ical shortcomings in terms of wake resolut ion can be overcome by clustering a large number of points in the t ra i l ing-edge region, par t icu lar ly a t the corners o f the t ra i l ing edge . In the pas t , th i s was p rec luded by the computa t iona l expense o f h ighly re f ined gr ids . However , wi th the advancement o f computer technology, this res t r ic t ion has vanished (a t least in 2D) and an 0-gr id approach is a v iab le a l te rna t ive to the use o f a C-gr id . F igure 3 . la shows a sample C-grid with a c lose-up of the t ra i l ing edge shown in Fig. 3. l b . F igu re 3 . I C and Fig. 3 . Id show the 0 -gr id for the ident ica l a i r fo i l . Compar ison of the resu l t s on the 0 -gr id and the C- gr id were found to be in good agreement [ 12,171.
Figure 3.1 Close-ups of C-grid (a, b) and 0-grid (c, d) used to compute flow about a 30% thick airfoil with 1.7% thick trailing edge [12].
All grids were constructed with the far f ie ld a t a dis tance of f i f ty chord lengths . Various gr id spacings were used on the surface of the a i r foi ls but typical ly the spacings a t the
26
leading and t ra i l ing edge corners ranged f rom 1 x l o w 3 t o 1 x 1 0-4 based on a uni t chord. Stretching ra t ios in the range of 1 .05-1.2 were used to def ine a l l surface points in between, typical ly resul t ing in 250-450 surface points . In the case of a C-grid, 75-100 gr id points were placed on e i ther s ide of the wake cut . The ini t ia l spacing in the d i rec t ion of the ou tward normal was governed by the y+ va lue o f the tu rbulen t boundary layer . Throughout this s tudy, an outward normal spacing of 2x 1 0-6 (based on a unit chord) was used a t the sur face and cons idered suf f ic ien t . A total of 125-150 gr id points were used in the direct ion of the outward normal , wi th the f i rs t f ive points being equal ly spaced and the fol lowing being geometr ical ly s t re tched. Grid ref inement s tudies were conducted by doubl ing the gr id densi ty . The discrepancies between solut ions were found to be negl ig ib le 1121.
3.2 Inboard Flatback Airfoil Sections
As noted in Table 2.1, blunt trail ing edge airfoils or so-called f latback airfoils were used to def ine the sect ion shapes in the inboard region ( r /R 5 5 5 % ) of the blade. The f la tback airfoi ls provide several s t ructural and aerodynamic performance advantages. Structural ly , the f la tback increases the sect ional area and sect ional moment of iner t ia for a given airfoil maximum thickness 131.
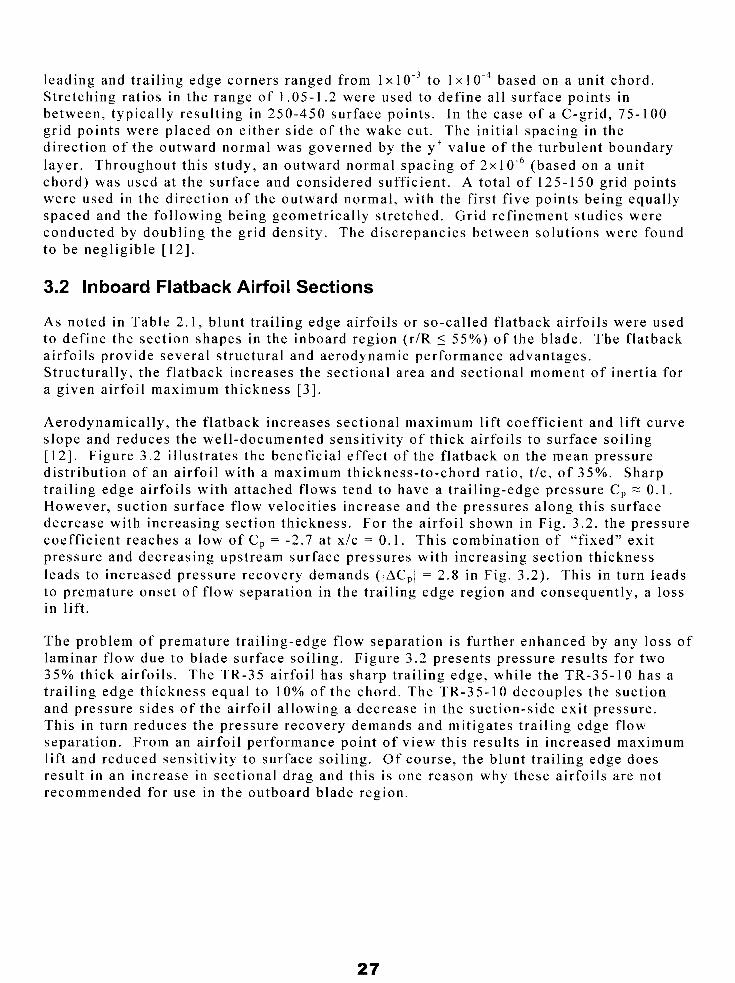
Aerodynamical ly , the f la tback increases sect ional maximum l i f t coeff ic ient and l i f t curve s lope and reduces the wel l -documented sensi t ivi ty of thick a i r foi ls to surface soi l ing 1121. Figure 3 .2 i l lustrates the beneficial effect of the f la tback on the mean pressure d is t r ibu t ion of an a i r fo i l wi th a maximum thickness- to-chord ra t io , t /c , of 35%. Sharp t ra i l ing edge a i r fo i l s wi th a t tached f lows tend to have a t ra i l ing-edge pressure C , = 0.1 . However , suct ion surface f low veloci t ies increase and the pressures a long this surface decrease with increasing sect ion thickness . For the a i r foi l shown in Fig. 3 .2 , the pressure coeff ic ient reaches a low of C, = -2.7 at x/c = 0.1. This combinat ion of “f ixed” exi t pressure and decreasing upstream surface pressures with increasing sect ion thickness leads to increased pressure recovery demands (IAC,I = 2 . 8 in Fig. 3.2). This in turn leads to premature onset of f low separat ion in the t ra i l ing edge region and consequent ly , a loss in lift.
The problem of premature t ra i l ing-edge f low separat ion is fur ther enhanced by any loss o f laminar f low due to blade surface soi l ing. Figure 3 .2 presents pressure resul ts for two 35% th ick a i r fo i l s . The TR-35 a i r fo i l has sharp t ra i l ing edge , whi le the TR-35-10 has a t ra i l ing edge thickness equal to 10% of the chord . The TR-35-10 decouples the suc t ion and pressure s ides o f the a i r fo i l a l lowing a decrease in the suction-side exit pressure. This in turn reduces the pressure recovery demands and mit igates t ra i l ing edge f low separat ion. From an a i r foi l performance point of view this resul ts in increased maximum lift and reduced sensit ivity to surface soil ing. Of course, the blunt trail ing edge does resul t in an increase in sect ional drag and this is one reason why these a i r foi ls are not recommended for use in the outboard blade region.
27
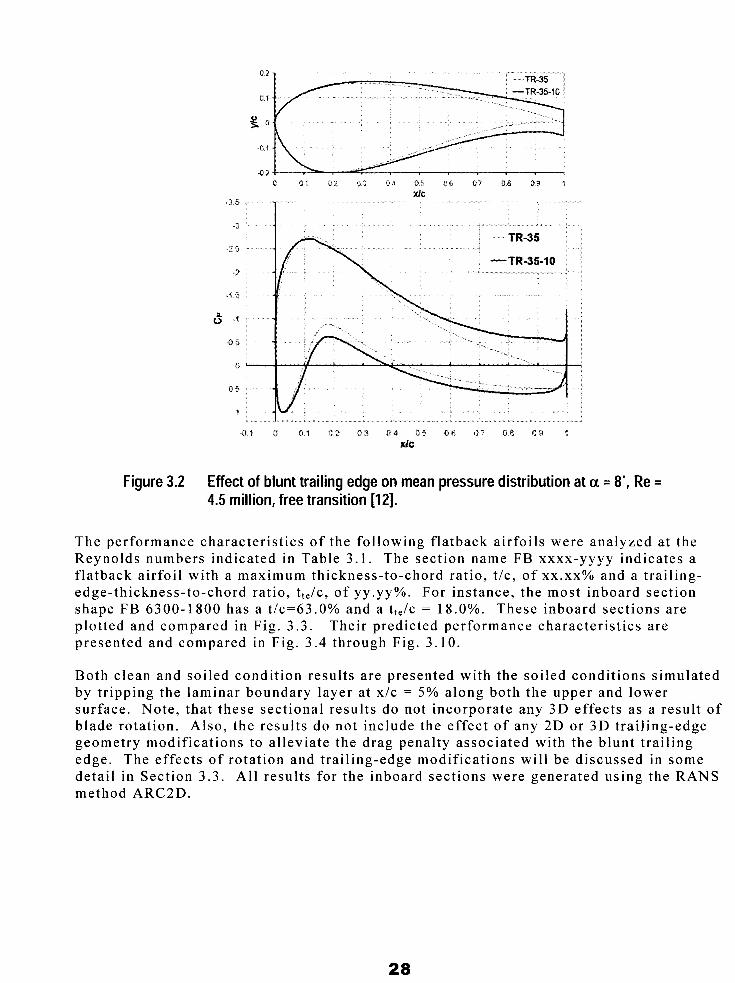
Figure 3.2 Effect of blunt trailing edge on mean pressure distribution at a = 8', Re = 4.5 million, free transition [12].
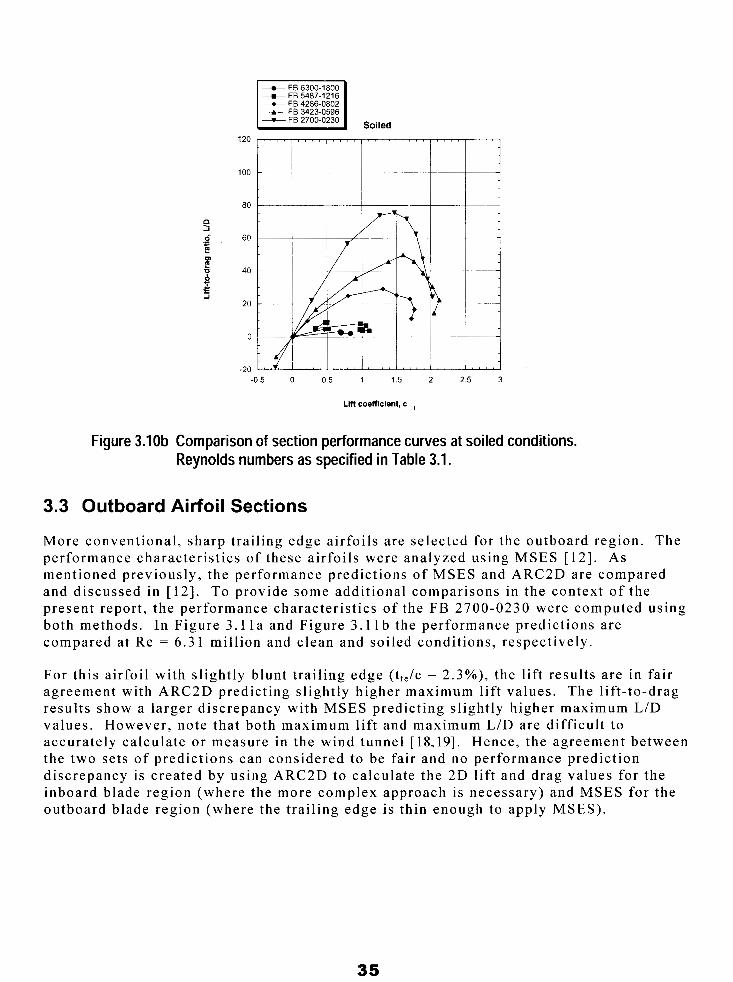
The performance character is t ics of the fol lowing f la tback a i r foi ls were analyzed a t the Reynolds numbers indicated in Table 3.1. The section name FB xxxx-yyyy indicates a f la tback a i r foi l wi th a maximum thickness-to-chord ratio, t /c, of xx.xx% and a t ra i l ing- edge-thickness- to-chord ra t io , t te /c , of yy.yy%. For instance, the most inboard sect ion shape FB 6300-1800 has a t /c=63.0% and a t,Jc = 18.0%. These inboard sections are plotted and compared in Fig. 3.3. Their predicted performance characterist ics are presented and compared in Fig. 3 .4 through Fig. 3.10.
Both c lean and soi led condi t ion resul ts are presented with the soi led condi t ions s imulated by tr ipping the laminar boundary layer at x/c = 5 % along both the upper and lower surface. Note , that these sect ional resul ts do not incorporate any 3D effects as a resu l t o f blade rotation. Also, the results do not include the effect of any 2D or 3D trail ing-edge geometry modif icat ions to a l leviate the drag penal ty associated with the blunt t ra i l ing edge. The effects of rotat ion and t ra i l ing-edge modif icat ions wil l be discussed in some detail in Section 3.3. All results for the inboard sections were generated using the RANS method ARC2D.
28
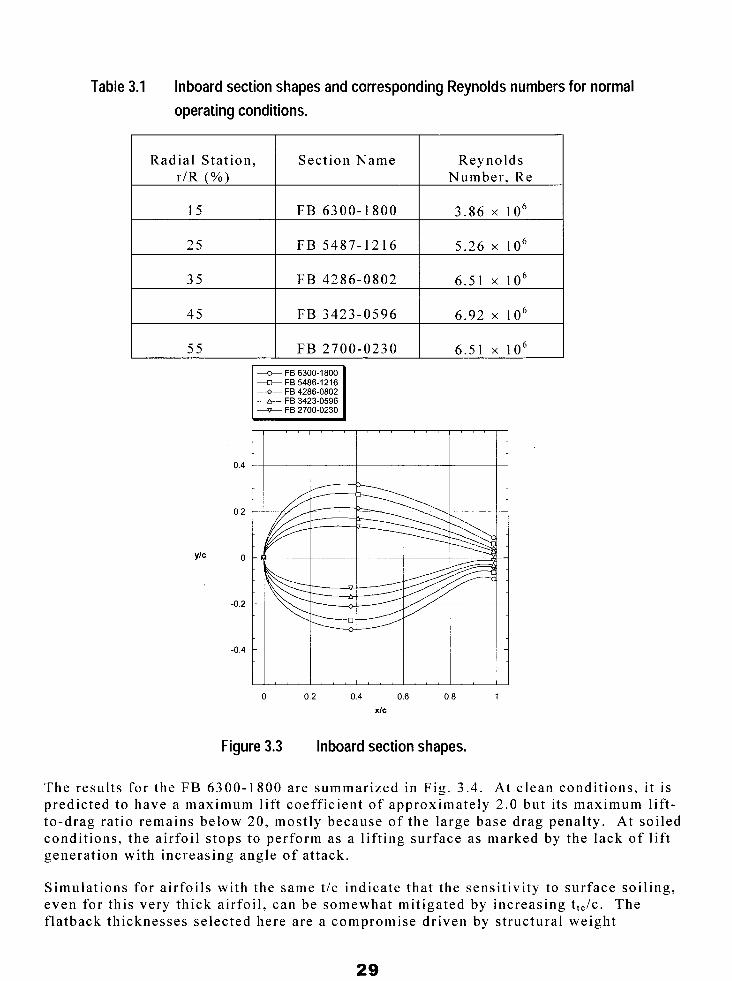
Table 3.1 Inboard section shapes and corresponding Reynolds numbers for normal operating conditions.
Radial Stat ion, Reynolds Sec t ion Name r/R (YO)
5.26 x l o 6 FB 5487-1 2 16 25
3.86 x l o 6 FB 6300- 1800 15
Number, Re
35
6.92 x l o 6 FB 3423-0596 45
6.51 x l o 6 FB 4286-0802
55 6.51 x l o 6 FB 2700-0230 FB 6300-1800 - FB 5486-1216
--o- FB 4286-0802 --&- FB 3423-0596 - FB 2700-0230
Y'C
0.2
0
-0.2
-0.4
0 0.2 0.4 0.6 0.8 1 XIC
Figure 3.3 Inboard section shapes.
The resul ts for the FB 6300-1 800 are summarized in Fig. 3.4. At clean conditions, i t is predicted to have a maximum l if t coefficient of approximately 2.0 but i ts maximum l if t- to-drag ra t io remains below 20, most ly because of the large base drag penal ty . At soi led condi t ions, the a i r foi l s tops to perform as a l i f t ing surface as marked by the lack of l i f t generation with increasing angle of at tack.
Simulat ions for a i r foi ls wi th the same t /c indicate that the sensi t ivi ty to surface soi l ing, even for this very thick a i r foi l , can be somewhat mit igated by increasing t , , /c . The f la tback thicknesses selected here are a compromise driven by structural weight
29
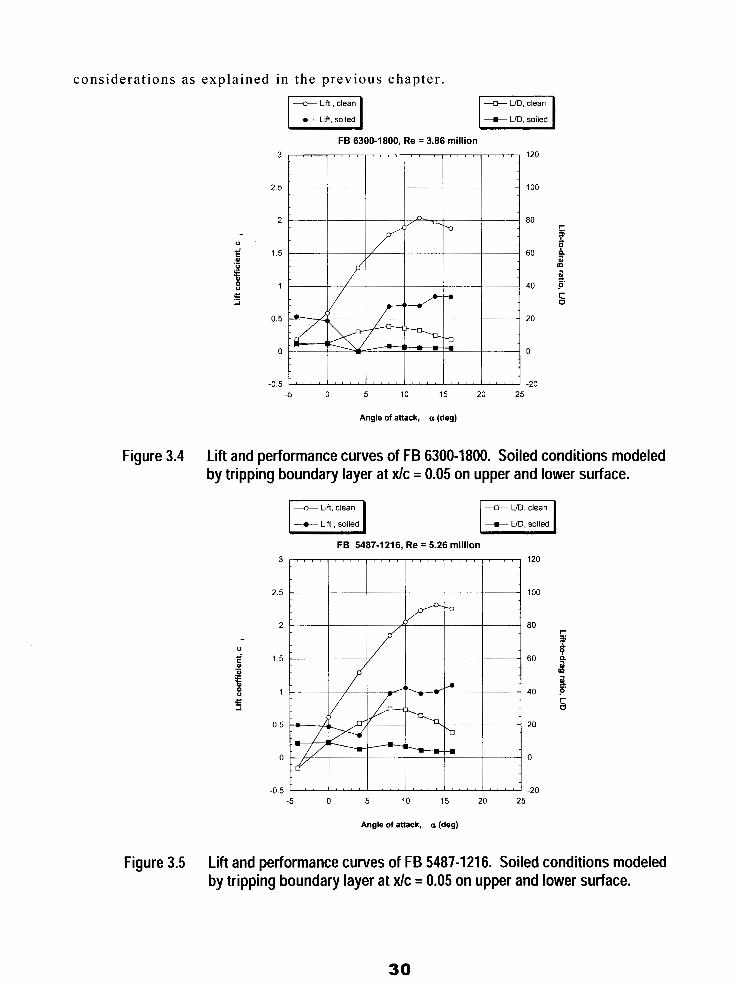
considerat ions as explained in the previous chapter .
FB 6300-1800, Re = 3.86 million
U
3
2.5
2
1.5
1
0.5
0
-0.5
120
100
80
60
40
20
0
-20
s
-5 0 5 10 15 20 25
Angle of attack, a (deg)
Figure 3.4 Lift and performance curves of FB 6300-1800. Soiled conditions modeled by tripping boundary layer at xlc = 0.05 on upper and lower surface.
FB 5487-1216, Re = 5.26 million
2.5
U
2
1.5
1
0.5
0
-0 5 -5 0 5 10 15 20 25
Angle of attack, a (dag)
s
Figure 3.5 Lift and performance curves of FB 5487-1216. Soiled conditions modeled by tripping boundary layer at xlc = 0.05 on upper and lower surface.
30
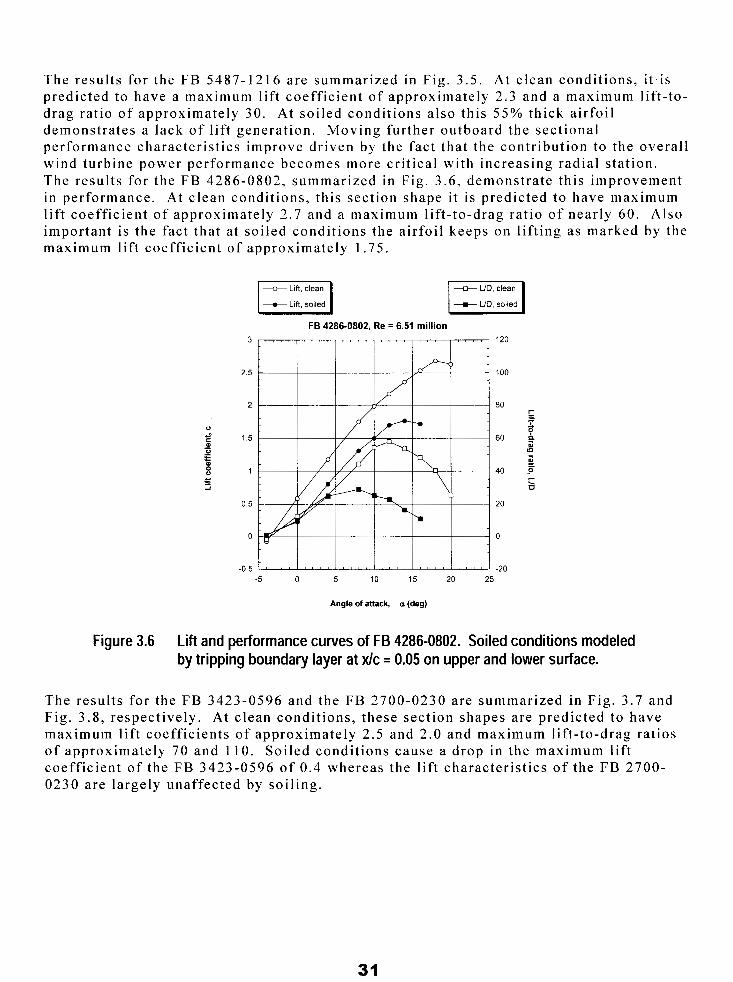
The resul ts for the FB 5487-1216 are summarized in Fig. 3 .5 . At c lean condi t ions, i t i s predicted to have a maximum l if t coefficient of approximately 2.3 and a maximum l if t- to- drag ra t io of approximately 30. At soi led condi t ions a lso this 55% thick a i r foi l demonstrates a lack of l i f t generat ion. Moving fur ther outboard the sect ional performance character is t ics improve dr iven by the fact that the contr ibut ion to the overal l wind turbine power performance becomes more cri t ical with increasing radial station. The resul ts for the FB 4286-0802, summarized in Fig. 3 .6 , demonstrate this improvement in performance. At c lean condi t ions, th is sect ion shape i t i s predicted to have maximum l i f t coeff ic ient of approximately 2 .7 and a maximum l if t- to-drag ratio of nearly 60. Also important is the fact that a t soi led condi t ions the a i r foi l keeps on l i f t ing as marked by the maximum l i f t coeff ic ient of approximately 1 .75.
3
2.5
2
1 5
1
0.5
0
-0.5
FB 42860802, Re = 6.51 million
-5 0 5 10 15 20 25
Angle of attack, a (deg)
Figure 3.6 Lift and performance curves of FB 4286-0802. Soiled conditions modeled by tripping boundary layer at Xlc = 0.05 on upper and lower surface.
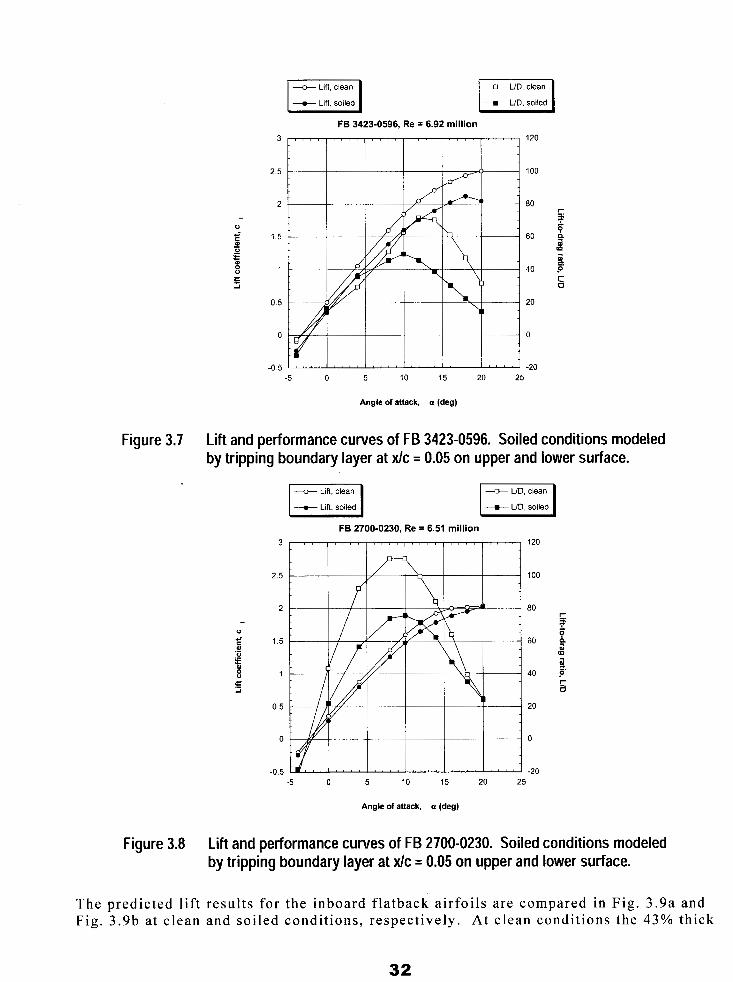
The resul ts for the FB 3423-0596 and the FB 2700-0230 are summarized in Fig. 3 .7 and Fig. 3 .8 , respect ively. At c lean condi t ions, these sect ion shapes are predicted to have maximum l i f t coeff ic ients of approximately 2 .5 and 2 .0 and maximum l i f t - to-drag ra t ios of approximate ly 70 and 1 10. Soiled condi t ions cause a drop in the maximum l if t coef f ic ien t o f the FB 3423-0596 of 0 .4 whereas the l i f t charac te r i s t ics o f the FB 2700- 0230 are largely unaffected by soi l ing.
31
FB 3423-0596, Re = 6.92 million 3
2.5
2
1.5
I
0.5
0
-0 5
r 0 T 4 m
-5 0 5 10 15 20 25
Angle of attack, a (deg)
Figure 3.7 Lift and performance curves of FB 3423-0596. Soiled conditions modeled by tripping boundary layer at Xlc = 0.05 on upper and lower surface.
FB 2700-0230, Re = 6.51 million 3 120
2.5 100
2 80 - r 0 T
1.5 60 ? .- 4 F$
2 5
-- al 0 (c1
8 9
1 p1
40 5 E
0.5 20
0 0
-0.5 -20 -5 0 5 10 15 20 25
Angle of attack, a (deg)
Figure 3.8 Lift and performance curves of FB 2700-0230. Soiled conditions modeled by tripping boundary layer at Xlc = 0.05 on upper and lower surface.
The pred ic ted l i f t resu l t s for the inboard f la tback a i r fo i l s a re compared in F ig . 3 .9a and Fig. 3 .9b a t c lean and soi led condi t ions, respect ively. At c lean condi t ions the 43% thick
32
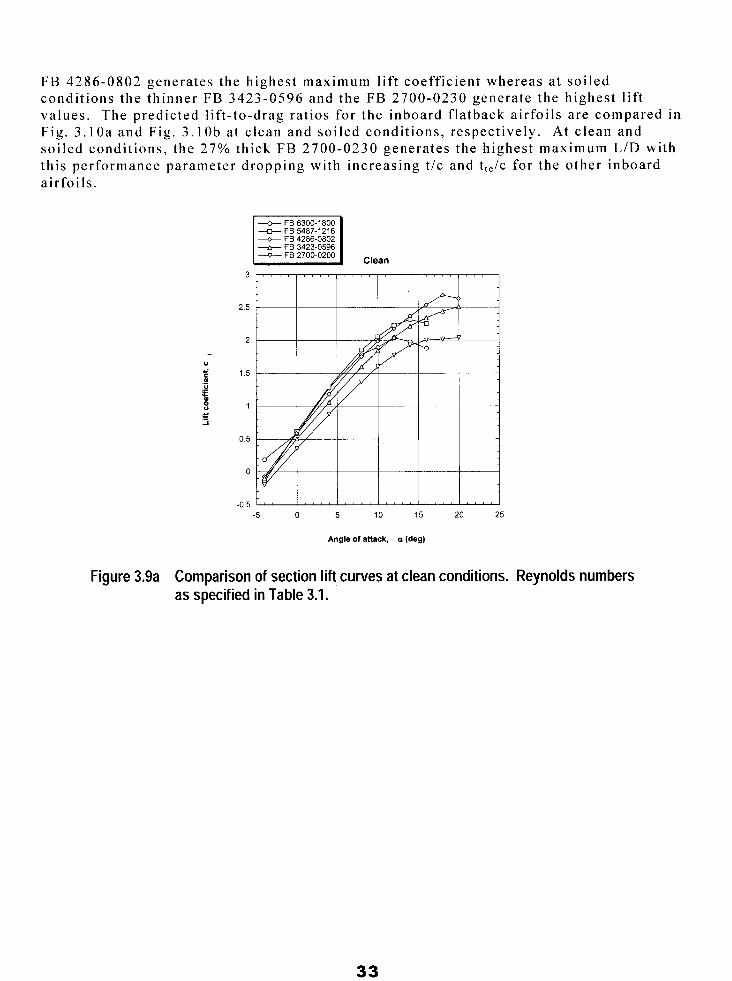
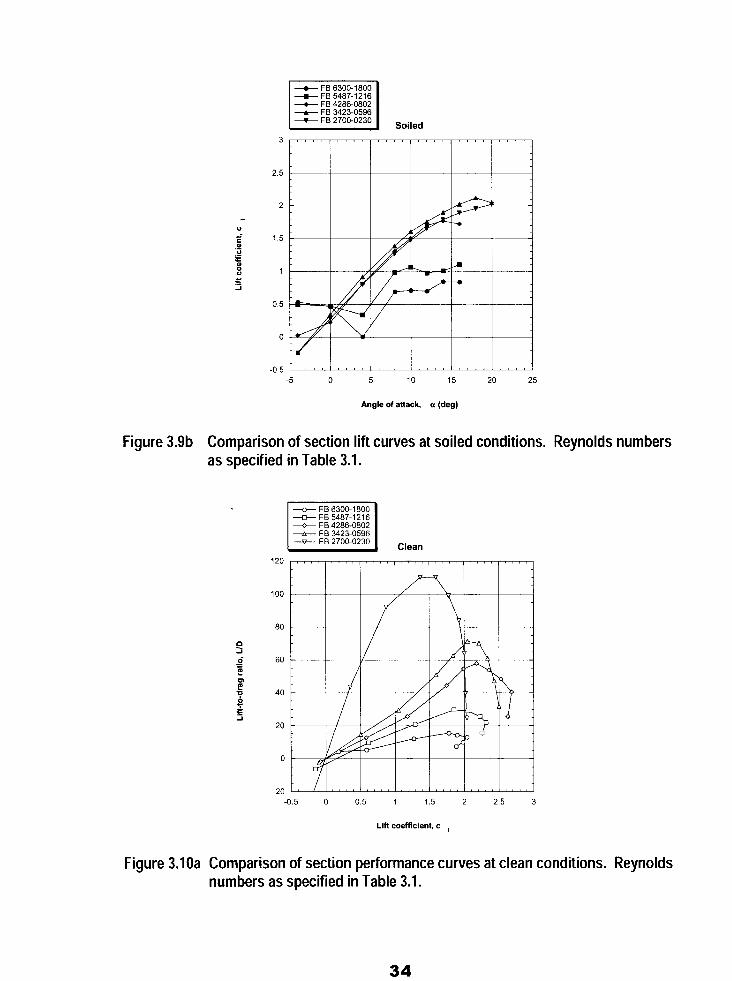
FB 4286-0802 generates the highest maximum l i f t coeff ic ient whereas a t soi led condi t ions the th inner FB 3423-0596 and the FB 2700-0230 generate the highest l i f t va lues . The pred ic ted l i f t - to -drag ra t ios for the inboard f la tback a i r fo i l s a re compared in Fig. 3.1 Oa and Fig. 3 .1 Ob at clean and soiled conditions, respectively. At clean and soi led condi t ions, the 27% thick FB 2700-0230 generates the highest maximum L/D with this performance parameter dropping with increasing t /c and t , Jc for the other inboard airfoi ls .
I, , , , , , , , , , , , , , , ,
FB 6300-1800 & FB 5487-1216 - FB 4286-0802 + FB 3423-0596
FB 2700-0200 Clean 3
2.5
2
1.5
1
0 5
0
-0.5 -5 0 5 10 15 20 25
Angle of attack, a (deg)
Figure 3.9a Comparison of section lift curves at clean conditions. Reynolds numbers as specified in Table 3.1.
33
+ FB 6300-1800 - FB 5487-1216 + FB 4286-0802 + FB 3423-0596
Soiled
2
1 5
1
0.5
0
-0.5 -5 0 5 10 15 20 25
Angle of attack, a (deg)
Figure 3.9b Comparison of section lift curves at soiled conditions. Reynolds numbers as specified in Table 3.1.
FB 6300-1800 - FB 5487-1216 FB 4286-0802
b- FB 3423-0596
Clean 120
100
80
60
40
20
0
-20 -0.5 0 0.5 1 1.5 2 2.5 3
Lift coefficient, c ,
Figure 3.10a Comparison of section performance curves at clean conditions. Reynolds numbers as specified in Table 3.1.
34
I I - FB 6300-1800 + FB 5487-1216 + FB 4286-0802 + FB 3423-0596 - FB 2700-0230 Soiled
-05 0 0 5 1 1.5 2 2 5 3
Lift coefficient, c ,
Figure 3.10b Comparison of section performance curves at soiled conditions. Reynolds numbers as specified in Table 3.1.
3.3 Outboard Airfoil Sections
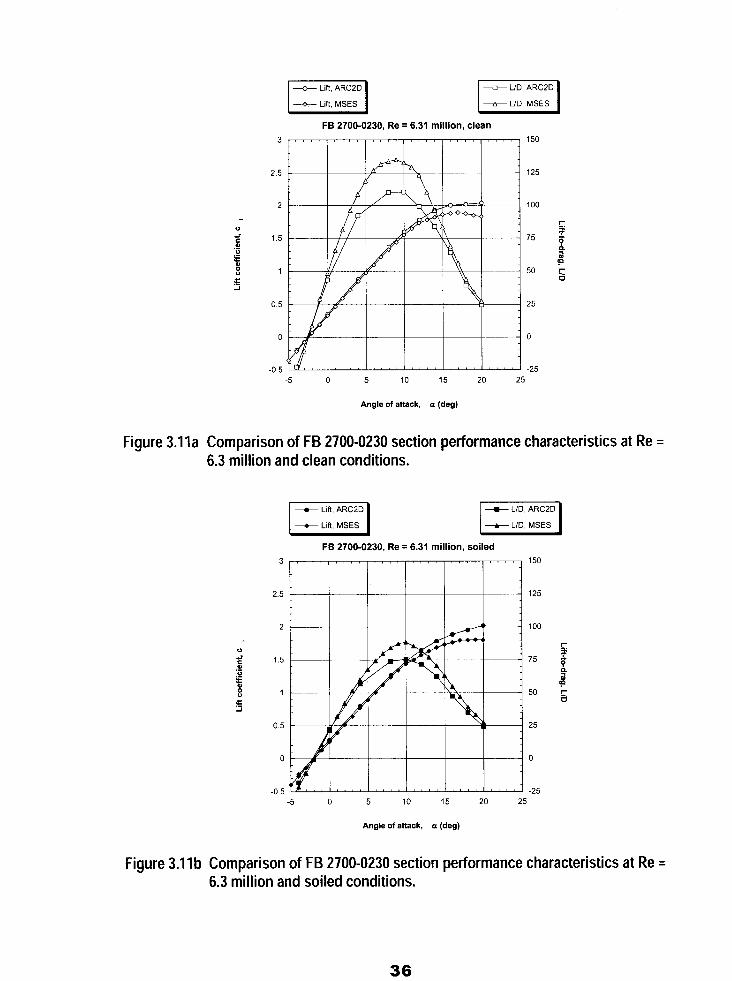
More convent ional , sharp t ra i l ing edge a i r foi ls are selected for the outboard region. The performance character is t ics of these a i r foi ls were analyzed using MSES [ 121. As mentioned previously, the performance predict ions of MSES and ARC2D are compared and discussed in [ 121. To provide some addi t ional comparisons in the context of the present report , the performance character is t ics of the FB 2700-0230 were computed using bo th me thods . In F igu re 3 .1 l a and F igu re 3 .1 l b t he pe r fo rmance p red ic t ions a r e compared a t Re = 6.31 mill ion and clean and soiled conditions, respectively.
For th i s a i r fo i l wi th s l igh t ly b lunt t ra i l ing edge ( t t e /c = 2.3%), the l if t results are in fair agreement with ARC2D predict ing s l ight ly higher maximum l i f t values . The l i f t - to-drag resul ts show a larger discrepancy with MSES predicting sl ightly higher maximum L/D values . However , note that both maximum l i f t and maximum L/D are diff icul t to accurately calculate or measure in the wind tunnel [18,19]. Hence, the agreement between the two se t s o f p red ic t ions can cons idered to be fa i r and no per formance pred ic t ion discrepancy is created by using ARC2D to calculate the 2D l i f t and drag values for the inboard blade region (where the more complex approach is necessary) and MSES for the outboard blade region (where the t ra i l ing edge is th in enough to apply MSES).
35
U
3
2.5
2
1 5
1
0.5
0
-0 5
Lift, ARC20 L/O. ARC20 I -+- Lift. MSES I I + L/O, MSES I FB 2700-0230, Re = 6.31 million, clean
-5 0 5 10 15 20 25
Angle of attack, a (deg)
Figure 3.1 l a Comparison of FB 2700-0230 section performance characteristics at Re = 6.3 million and clean conditions.
+ Lift ARCPD - L/D, ARC20
+ Lift. MSES I I --t LID. MSES I FB 2700-0230, Re = 6.31 million, soiled
3
2.5
2
1.5
1
0.5
0
-0.5 -5 0 5 10 15 20 25
Angle of attack, a (deg)
Figure 3.1 1 b Comparison of FB 2700-0230 section performance characteristics at Re = 6.3 million and soiled conditions.
36
The NREL airfoi l family for HAWTs was cal led upon to provide appropriate outboard sect ion shapes. Ini t ia l ly the S817 and S816 were selected to def ine the sect ion shapes in the t ip (95% radius) and primary outboard region (75% radius) , respect ively. These airfoi ls were designed in 1992 for blades of s ta l l - regulated wind turbines ra ted a t 0 . 4 - 1 . 0 MW [20]. The fact that these a i r foi ls were developed for s ta l l - regulated rotors led to low design maximum l if t coefficient of 1 . 1 for the S817 and 1.2 for the S816. However , the present rotor design is pitch regulated allowing for the application of section shapes that generate higher l i f t coeff ic ients .
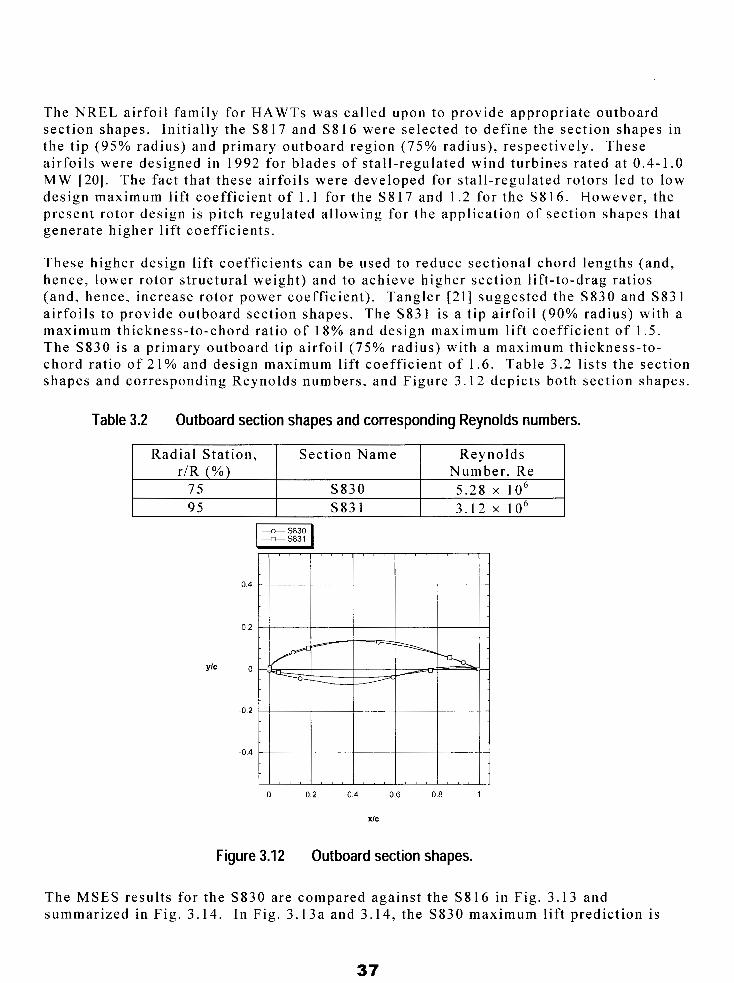
These higher design l i f t coeff ic ients can be used to reduce sect ional chord lengths (and, hence, lower rotor s t ructural weight) and to achieve higher sect ion l i f t - to-drag ra t ios (and, hence, increase rotor power coefficient) . Tangler [21] suggested the S830 and S831 airfoi ls to provide outboard sect ion shapes. The S831 is a t ip a i r foi l (90% radius) with a maximum thickness- to-chord ra t io of 18% and design maximum l i f t coeff ic ient of 1 . 5 . The S830 is a primary outboard t ip airfoil (75% radius) with a maximum thickness- to- chord ra t io o f 21% and design maximum l if t coefficient of 1.6 . Table 3 .2 l ists the section shapes and corresponding Reynolds numbers , and Figure 3 .12 depicts both section shapes.
Table 3.2 Outboard section shapes and corresponding Reynolds numbers.
Radial Stat ion, Reynolds Sec t ion Name r/R (%) Number , Re
75 3 .12 x I O 6 S83 1 95 5 .28 x I O 6 S830
0 0.2 0.4 06 0.8 1
x/c
Figure 3.12 Outboard section shapes.
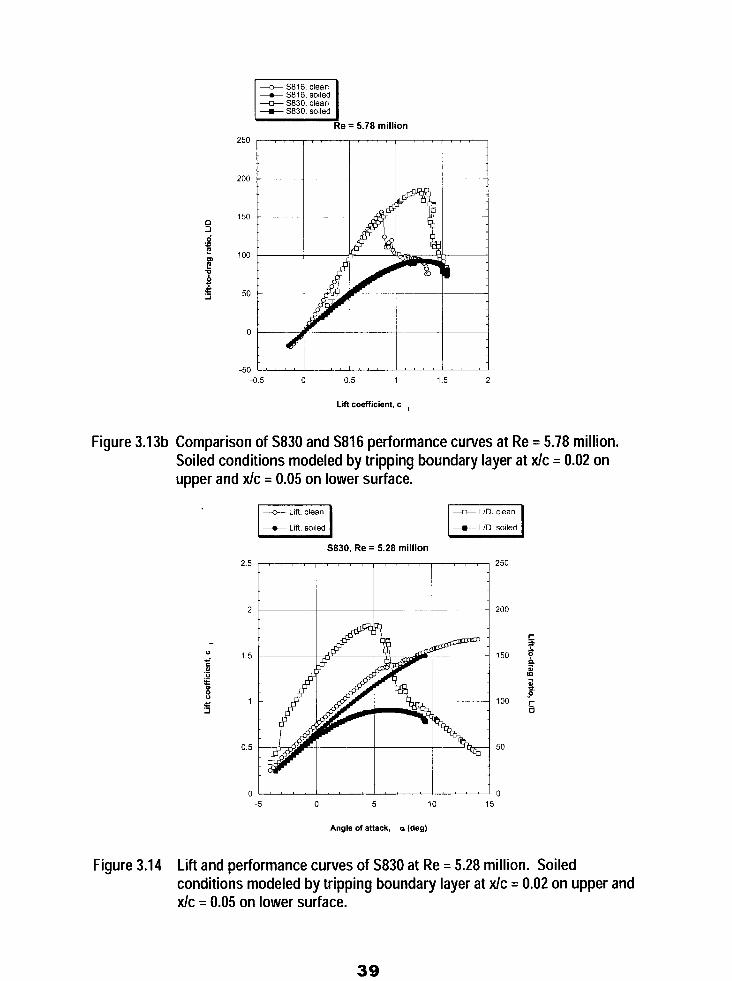
The MSES resu l t s for the S830 are compared against the S816 in Fig. 3.13 and summarized in Fig. 3 .14 . In F ig . 3 .13a and 3.14 , the S830 maximum l i f t predict ion is
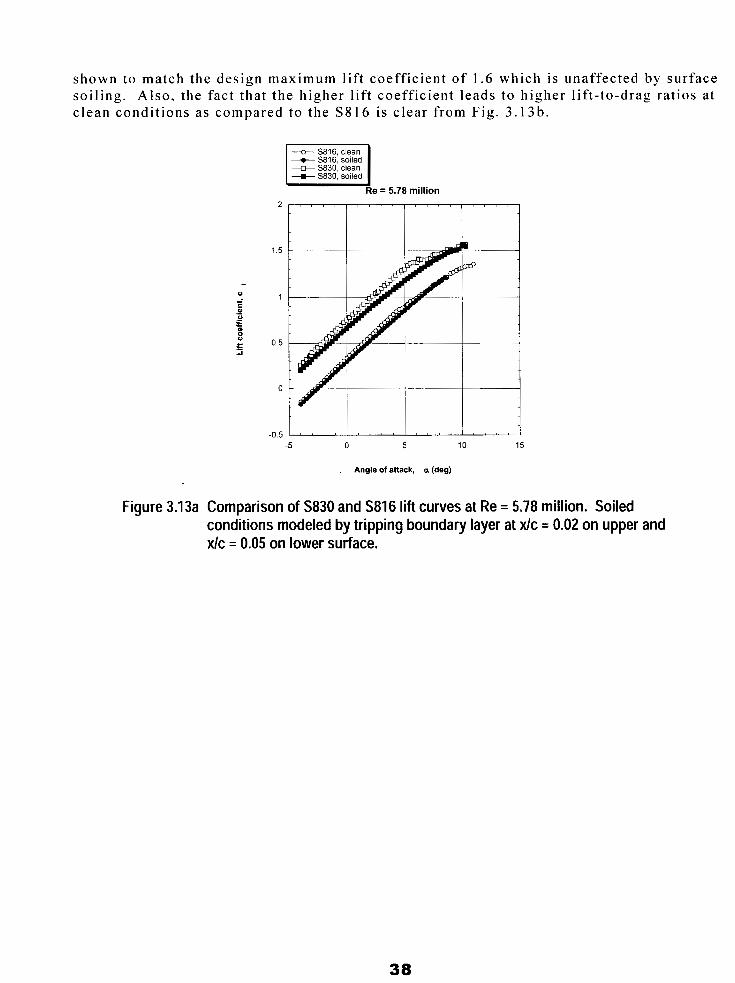
shown to match the des ign maximum l i f t coef f ic ien t o f 1.6 which is unaffected by surface so i l ing . Also , the fac t tha t the h igher l i f t coef f ic ien t l eads to h igher l i f t - to -drag ra t ios a t c lean condi t ions as compared to the S816 is clear from Fig. 3 . 1 3 b .
- S816. clean -+- S816, soiled - 5830, clean - S830, solled
Re = 5.78 million
-5 0 5 10 15
Angle of attack, a (deg)
Figure 3.13a Comparison of S830 and S816 lift curves at Re = 5.78 million. Soiled conditions modeled by tripping boundary layer at Xlc = 0.02 on upper and Xlc = 0.05 on lower surface.
38
S816, clean + S816. solled - S830, clean - S830. solled
Re = 5.78 million 250 , , , ,
200 r--- ,
150
100
50
0
-50 -0 5 0 0 5 1 1.5 2
Lift coefficient, c I
Figure 3.13b Comparison of S830 and S816 performance curves at Re = 5.78 million. Soiled conditions modeled by tripping boundary layer at Xlc = 0.02 on upper and Xlc = 0.05 on lower surface.
S830, Re = 5.28 million
O L , I , , i I , , i , , , , i , , , , l o -5 0 5 10 15
Angle of attack, a (deg)
Figure 3.14 Lift and performance curves of S830 at Re = 5.28 million. Soiled conditions modeled by tripping boundary layer at Xlc = 0.02 on upper and xlc = 0.05 on lower surface.
39
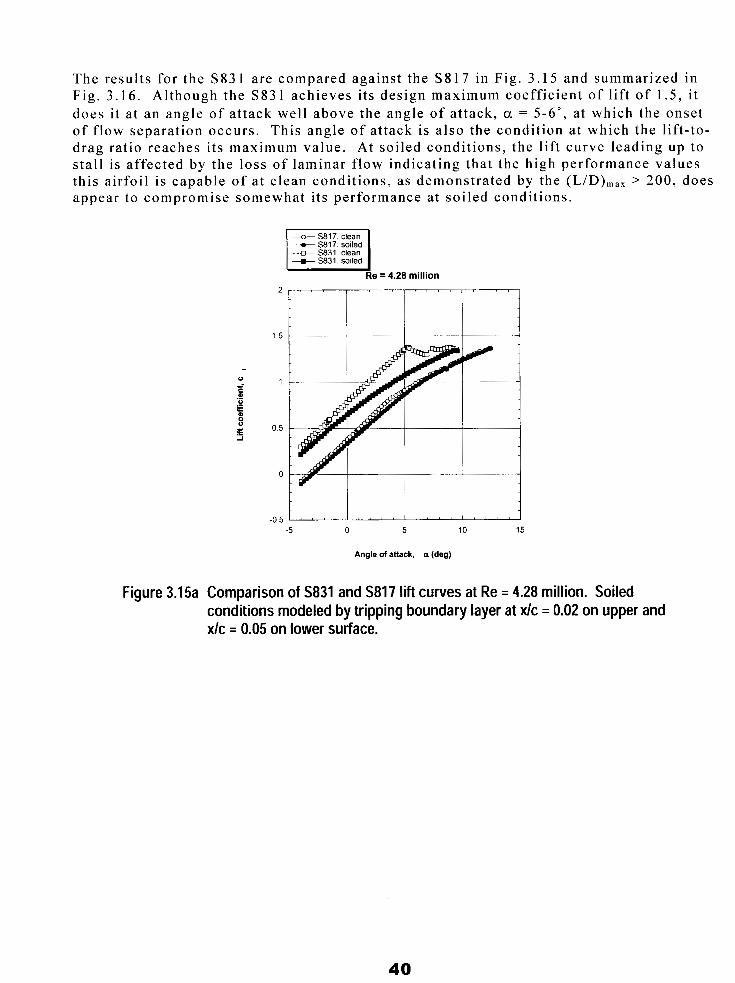
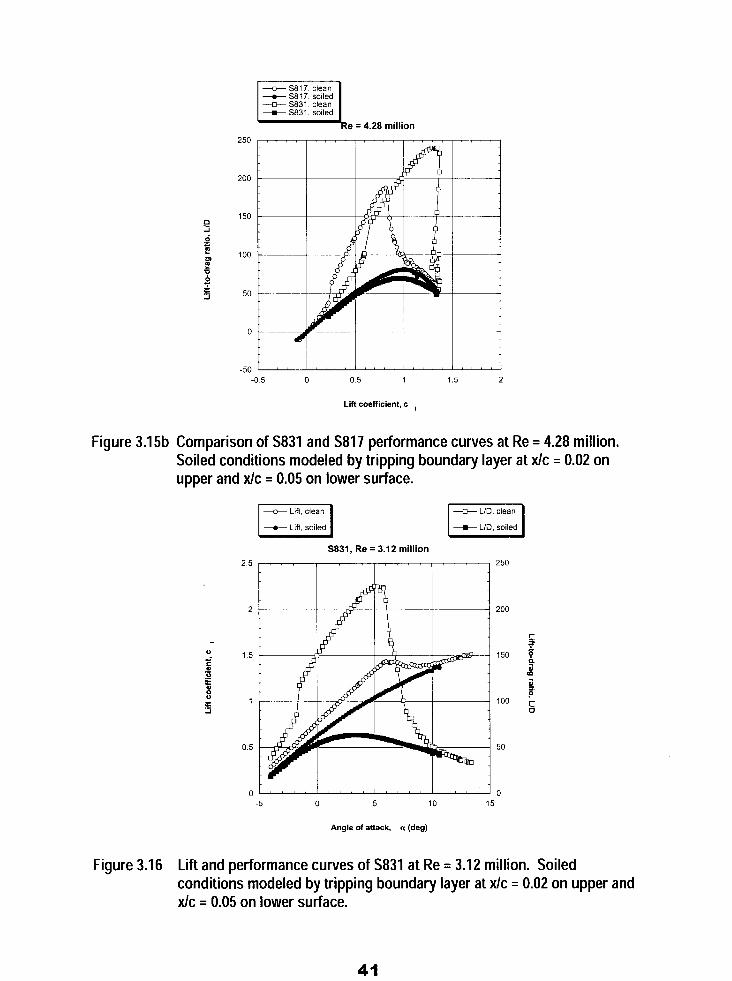
The resul ts for the S83 1 are compared against the S8 17 in Fig. 3.15 and summarized in Fig. 3.1 6 . Although the S83 1 achieves i ts design maximum coefficient of l if t of 1.5, it does i t a t an angle of a t tack wel l above the angle of a t tack, a = 5-6", a t which the onset of f low separa t ion occurs . This angle o f a t tack i s a l so the condi t ion a t which the l i f t - to -
l i f t curve leading up to igh performance values the (L/D)max > 200, does
drag ra t io reaches i t s maximum va lue . At so i led condi t ions , the stall is affected by the loss of l aminar f low ind ica t ing tha t the h this a i r foi l i s capable of a t c lean condi t ions, as demonstrated by appear to compromise somewhat i t s per formance a t so i led condi
--t S817. soiled + S831. clean -m- S831, solled
Re = 4.28 million
-5 0 5 10 15
Angle of attack, a (deg)
t ions.
Figure 3.15a Comparison of S831 and S817 lift curves at Re = 4.28 million. Soiled conditions modeled by tripping boundary layer at Xlc = 0.02 on upper and Xlc = 0.05 on lower surface.
40
---t S817, solled --D- S831, clean --t 5831, soiled
e = 4.28 million
- 5 0 1 " " 1 " " i " " i " " i ' " ' i -0 5 0 0 5 1 1.5 2
Lift coefficient, c ,
Figure 3.15b Comparison of S831 and S817 performance curves at Re = 4.28 million. Soiled conditions modeled by tripping boundary layer at Xlc = 0.02 on upper and Xlc = 0.05 on lower surface.
S831, Re = 3.12 million
2
1.5
1
0.5
Angle of attack, a (deg)
Figure 3.16 Lift and performance curves of S831 at Re = 3.12 million. Soiled conditions modeled by tripping boundary layer at xlc = 0.02 on upper and Xlc = 0.05 on lower surface.
41
3.4 Discussion of Blade Section Performance
In this design s tudy, s ignif icant a t tent ion has been paid to the inboard port ion of the blade. The inboard region of large wind turbine blades contr ibutes a relatively small port ion of the overal l torque generated by the ent i re blade due to the re la t ively small moment arm and low dynamic pressure when compared to the outboard region. However , improvements in aerodynamic performance wil l increase the overal l eff ic iency of the wind turbine 's power output . More important ly , the incorporat ion of blunt t ra i l ing edge airfoils in the inboard region will al low for thicker section shapes, providing increased s t ructural s t i f fness while a t the same t ime maintaining, i f not increasing, aerodynamic performance. Thicker sect ion shapes in the inboard blade region do not only provide the increased s t ructural s t i f fness necessary for the larger wind turbines of the future , but could a lso help to mit igate the s t ructural concerns, l imitat ions, and cost of today 's wind turbines .
Van Rooi j and Timmer [22] point out that 3D rotational effects may lead to reduced roughness sensi t ivi ty for thick sect ion shapes in the inboard region and this a l lows for the blade design in this region to be dr iven by s t ruc tura l demands . However , the ex ten t of the roughness sensi t ivi ty mit igat ion due to rotat ional effects is f ixed and governed by rotor size and rotational speed. In contrast , the incorporation of a blunt t ra i l ing edge into a blade design would give the designer even greater f reedom to address s t ructural demands while s t i l l maintaining control of the aerodynamic performance. Future effor ts should focus on 3D RANS computat ions including blade rotat ion effects .
The main goal of wind turbine aerodynamics is to produce as much torque as possible in order to genera te power whi le a t the same t ime minimiz ing the th rus t loads seen by the blades in order to reduce out-of-plane bending and s t ructural concerns. Typical ly , the aerodynamic character is t ics of a blade sect ion are considered in terms of i ts l i f t and drag. However , when cons ider ing wind tu rb ines , the impor tance o f the l i f t and drag i s secondary to that of the torque-force and thrust . For a given radial station, the l if t and drag coef f ic ien ts can be conver ted in to to rque- force , C,, and thrust , CT, coeff ic ients using the fol lowing re la t ions:
@ = a + P
C, = CL s in @ - CD cos @
C T = CL cos @ + CD s i n @
where a is the angle of a t tack and p i s the twis t angle re la t ive to the p lane o f ro ta t ion . The sum of these two angles equa tes to @, the to ta l angle o f the re la t ive wind to the ro tor plane a t a given radial station. The aforementioned angles and the force coefficients are depicted in Fig. 3 . 1 7 . As can be g leaned f rom the above equat ion for the to rque- force coeff ic ient , the twist angle a t a given radial s ta t ion plays a s ignif icant role , par t icular ly in the inboard region of the blade where twist angles are the greatest . Table 2.1 indicates tha t twis t angles for the 1 5 % - 5 5 % radial s ta t ions range f rom 19.5'-4.4". In [12] , the predicted l if t and drag results for a 35% th ick sharp t ra i l ing edge a i r fo i l (TR-35) and an ident ical th ickness f la tback a i r foi l wi th a t ra i l ing-edge thickness of 10% (TR-35-10) were converted into torque-force and thrust coeff ic ients to i l lustrate the secondary effect of d r a g o n C, for a twist se t t ing of 1 5 " . The change in the torque-force coeff ic ient ,
42
~ ~~ ~~
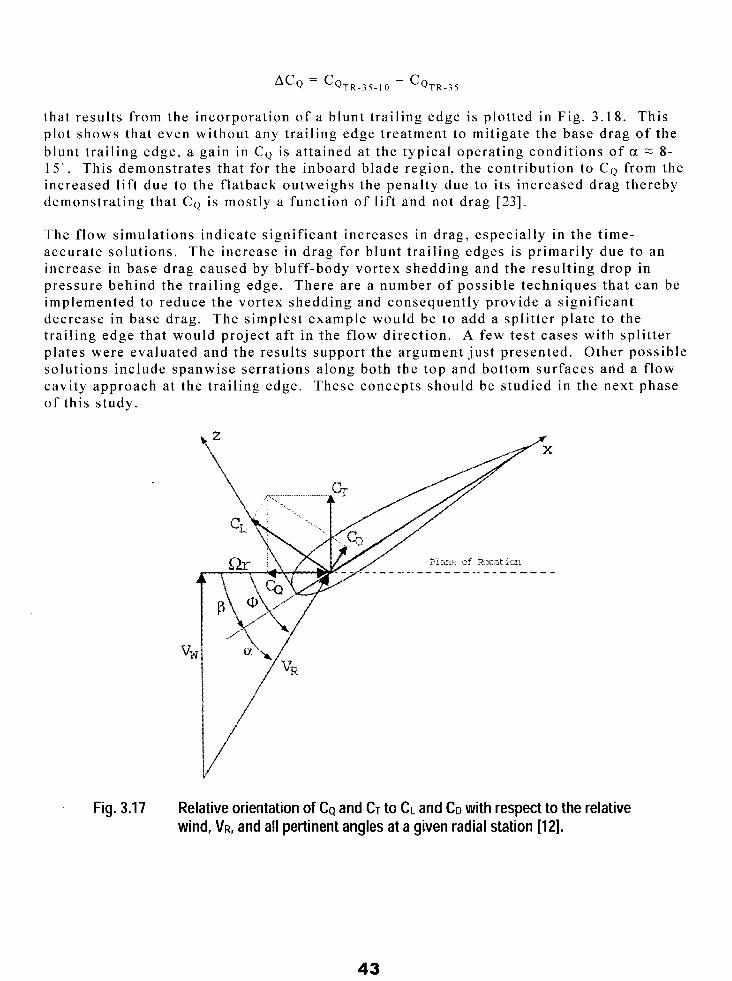
that resul ts f rom the incorporat ion of a blunt t ra i l ing edge is p lot ted in Fig. 3.18. Th i s plot shows that even without any t ra i l ing edge t reatment to mit igate the base drag of the blunt t ra i l ing edge, a gain in CQ is a t ta ined a t the typical operat ing condi t ions of a =: 8- 1 5 ” . This demonst ra tes tha t for the inboard b lade reg ion , the cont r ibu t ion to CQ from the increased l i f t due to the f la tback outweighs the penal ty due to i ts increased drag thereby demonst ra t ing tha t CQ is mostly a funct ion of l i f t and not drag [23].
The f low s imulat ions indicate s ignif icant increases in drag, especial ly in the t ime- accurate solut ions. The increase in drag for blunt t ra i l ing edges is pr imar i ly due to an increase in base drag caused by bluff-body vortex shedding and the result ing drop in pressure behind the trail ing edge. There are a number of possible techniques that can be implemented to reduce the vortex shedding and consequently provide a s ignif icant decrease in base drag. The simplest example would be to add a sp l i t t e r p la te to the t ra i l ing edge tha t would p ro jec t a f t in the f low d i rec t ion . A few test cases with spli t ter plates were evaluated and the results support the argument just presented. Other possible solut ions include spanwise serrat ions a long both the top and bot tom surfaces and a f low cavi ty approach a t the t ra i l ing edge. These concepts should be s tudied in the next phase o f t h i s s tudy.
Fig. 3.17 Relative orientation of CQ and CT to CL and CD with respect to the relative wind, VR, and all pertinent angles at a given radial station 1121.
43
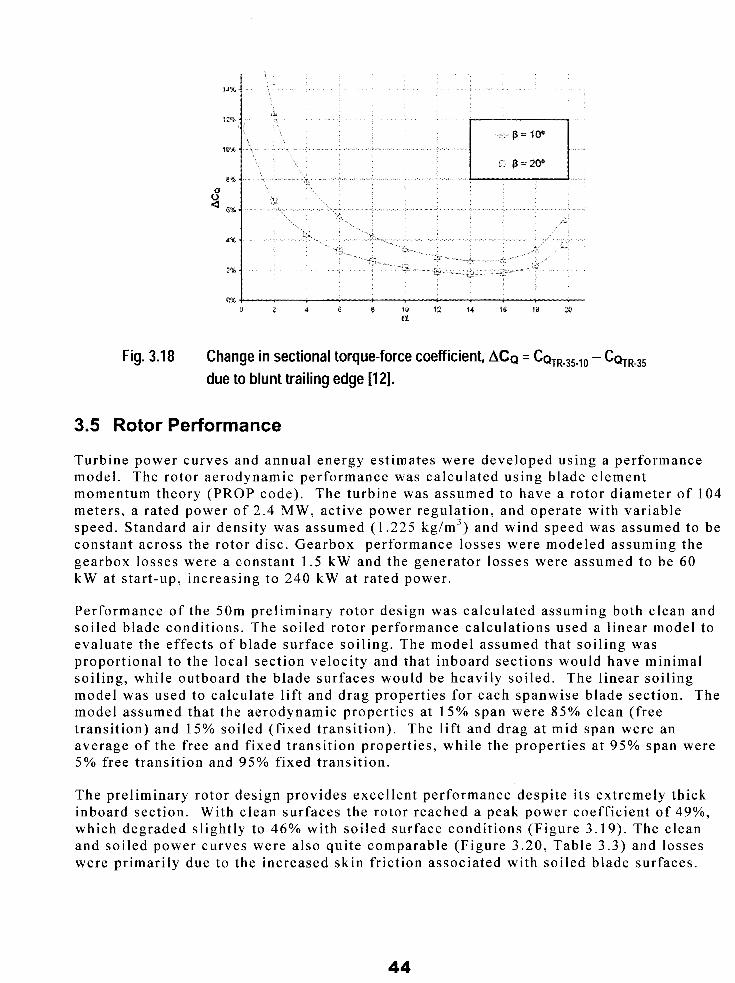
Fig. 3.18 Change in sectional torque-force coefficient, ACQ = C Q ~ ~ - ~ ~ - , ~ - C Q ~ ~ - ~ ~ due to blunt trailing edge [12].
3.5 Rotor Performance
Turbine power curves and annual energy es t imates were developed using a performance model . The rotor aerodynamic performance was calculated using blade e lement momentum theory (PROP code) . The turbine was assumed to have a rotor diameter of 104 meters , a rated power of 2 .4 MW, act ive power regulat ion, and operate with var iable speed. Standard a i r densi ty was assumed (1 .225 kg/m3) and wind speed was assumed to be constant across the rotor disc . Gearbox performance losses were modeled assuming the gearbox losses were a constant 1 .5 kW and the generator losses were assumed to be 60 kW a t s ta r t -up , increas ing to 240 k W at ra ted power.
Per formance of the 50m prel iminary rotor design was calculated assuming both c lean and soiled blade conditions. The soiled rotor performance calculations used a l inear model to eva lua te the e f fec ts o f b lade sur face so i l ing . The model assumed tha t so i l ing was propor t iona l to the loca l sec t ion ve loc i ty and tha t inboard sec t ions would have min imal soi l ing, while outboard the blade surfaces would be heavi ly soi led. The l inear soi l ing model was used to calculate l i f t and drag propert ies for each spanwise blade sect ion. The model assumed that the aerodynamic propert ies a t 15% span were 8 5 % clean ( f ree t ransi t ion) and 15% soi led ( f ixed t ransi t ion) . The l i f t and drag a t mid span were an average o f the f ree and f ixed t rans i t ion p roper t ies , whi le the p roper t ies a t 95% span were 5% free t ransi t ion and 95% f ixed t ransi t ion.
The prel iminary rotor design provides excel lent performance despi te i ts extremely thick inboard section. With clean surfaces the rotor reached a peak power coeff ic ient of 49%, which degraded s l ight ly to 46% with soi led surface condi t ions (Figure 3 .19) . The c lean and soiled power curves were also quite comparable (Figure 3.20, Table 3.3) and losses were pr imari ly due to the increased skin f r ic t ion associated with soi led blade surfaces .
44
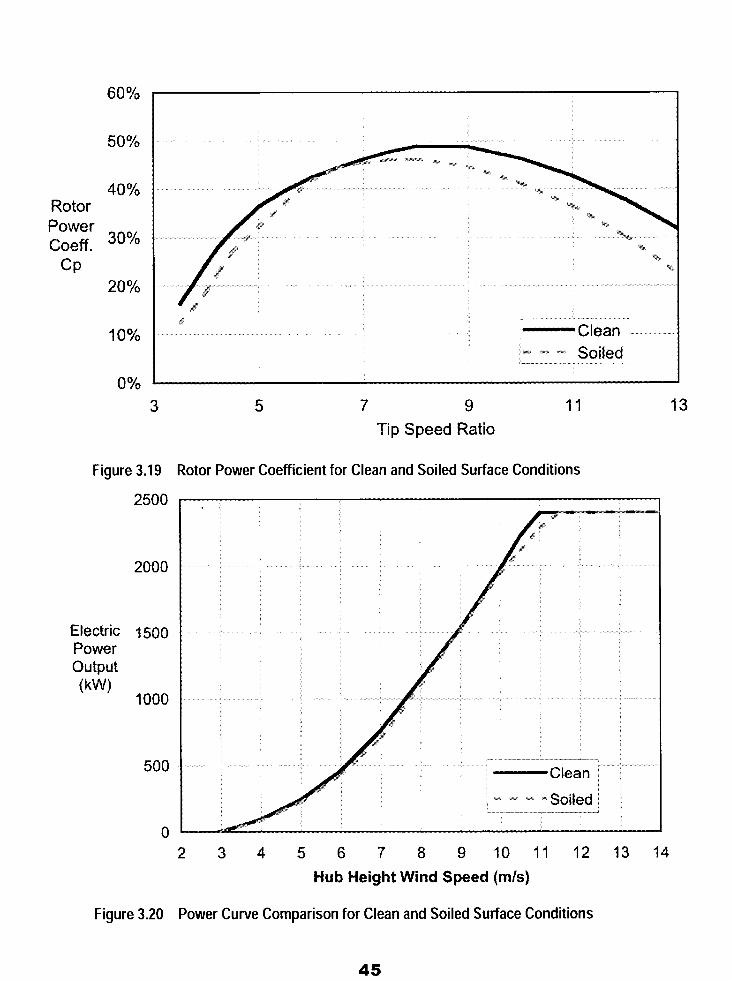
50 %
40 % Rotor Power Coeff. 30%
CP 20%
10% I Clean ~
........... " Soiled ' w, m_
.... ."
3 5 7 9 I 1 Tip Speed Ratio
13
Figure 3.19 Rotor Power Coefficient for Clean and Soiled Surface Conditions
2500
2000
500
0
c
2 3 4 5 6 7 8 9 1 0 1 1 1 2 1 3 1 4 Hub Height Wind Speed (mk)
Figure 3.20 Power Curve Comparison for Clean and Soiled Surface Conditions
45
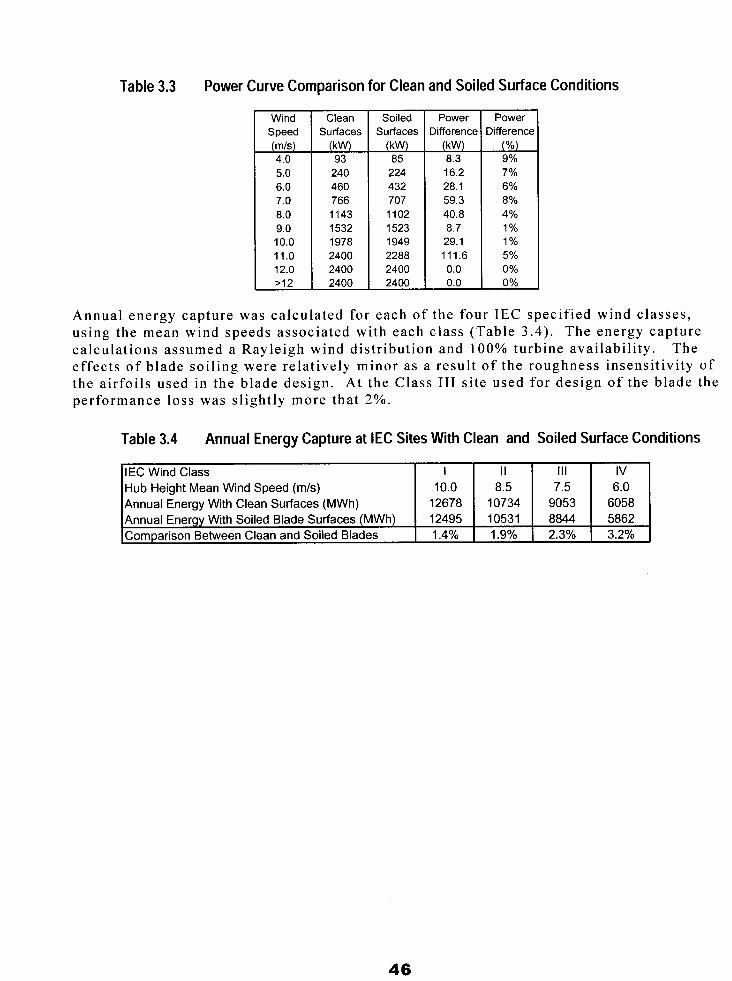
Table 3.3 Power Curve Comparison for Clean and Soiled Surface Conditions
-J-z= Surfaces
460 766 1143 1532
10.0 1978 11.0 2400 12.0 2400 >12 2400
Soiled Surfaces 0
85 224 432 707 1102 1523 1949 2288 2400 2400
Power Difference 0
8.3 16.2 28.1 59.3 40.8 8.7 29.1 111.6 0.0 0.0
Power Difference
(%) 9% 7% 6% 8%
1% 1% 5% 0% 0 Yo
4 Yo
Annual energy capture was calculated for each of the four IEC specif ied wind c lasses , using the mean wind speeds associated with each c lass (Table 3 .4) . The energy capture calculat ions assumed a Rayleigh wind dis t r ibut ion and 100% turbine avai labi l i ty . The e f fec ts o f b lade so i l ing were re la t ive ly minor as a resul t of the roughness insensi t ivi ty of the airfoils used in the blade design. At the Class I11 s i te used for des ign of the b lade the performance loss was s l ight ly more that 2%.
Table 3.4 Annual Energy Capture at IEC Sites With Clean and Soiled Surface Conditions
IEC Wind Class I
3.2% 2.3% 1.9% 1.4% Comparison Between Clean and Soiled Blades 5862 8844 10531 12495 Annual Energy With Soiled Blade Surfaces (MWh) 6058 9053 10734 12678 Annual Energy With Clean Surfaces (MWh) 6.0 7.5 8.5 10.0 Hub Height Mean Wind Speed (m/s) IV Ill II
46
4.0 CONCLUSIONS AND RECOMMENDATIONS
4.1 Summary of Key Design Impacts
4.1.1 Blade Cross-Sections
The resu l t s o f th i s e f for t have shown tha t des igning wi th th ick b lade c ross -sec t ions can provide a large reduction in blade weight, without compromising aerodynamic efficiency. Increasing blade thickness for inboard sect ions is a key method for improving s t ructural e f f ic iency and reducing b lade weight . The f la tback a i r fo i l s and the aerosolve des ign process were found to resul t in a blade design which had excellent power performance character is t ics , especial ly with soi led surface condi t ions.
4.1.2 Alternative Materials
Carbon/glass hybrid blades were found to provide good improvements in blade weight, s t i f fness , and def lect ion when used in the main s t ructural e lements of the blade. The addi t ion of carbon resul ted in cost increases that were re la t ively modest , even a t current pr ic ing levels . Other mater ia l choices , such as S-glass and zebrawood (carbon/wood hybrid) are a lso worthy of addi t ional s tudy and offer potent ia l benefi ts for weight and s t i f fness .
4.1.3 Blade Design Class
The changes between blades designed for a given IEC Design Class are s ignif icant and that may have implicat ions of many sor ts on how an “opt imized” blade wil l be designed. Reduct ions in blade weight occur due to changes in design loads for the spar cap, t ra i l ing edge sp l ine , and pane l cor ing mater ia l s . The re la t ive weight o f a C las s 111 blade was determined to be approximately 70% o f a C las s I design.
4.1.4 Root Attachment
This e f for t has shown tha t a grea t dea l o f the b lade weight i s t i ed up in the roo t bu i ldup and metal hardware for typical root designs. A weight savings as large or larger than that avai lable by shif t ing f rom E-glass to carbon hybrid spar caps may be avai lable s imply by moving to h igh count roo t s tud sys tems, o r h igh count T-bol t s i f the i r c lose spac ing i ssues a re reasonable to overcome. I t s c lear tha t a high part count would favor a s ingle infusion operat ion for a l l the s tuds a t once, so process innovat ion may be required before these gains can be a t ta ined eff ic ient ly and economical ly , but the weight savings does appear technical ly feasible .
4.2 Conclusions
The use of high thickness f la tback a i r foi ls in the inner blade, combined with the use of IEC Class I11 design loads, has lead to a large reduction in the amount of pr imary blade s t ruc ture . This i s d ramat ica l ly i l lus t ra ted by the fac t tha t ba lsa cor ing i s now the s ing le largest mater ia l cost category. Blade costs have shif ted toward being dominated by the aerodynamic shel l to a somewhat remarkable extent , consider ing the s ize of the blades.
47
A comparison of blade set weight between the four prel iminary blade designs (glasds. hybrid/s tud, g lass/T-bol t , and hybrid/T-bol t ) and industry t rends is provided in Figure 4 .1 . This graph uses data publ ished by Windstats [24] in 2002 to show blade weight t rends both for ear l ier designs and the la tes t wind turbine equipment . The present bla designs are s ignif icant ly l ighter in weight than the latest designs in the marketplace. This is par t ia l ly the resul t of designing to I E C Clas s I11 design loads ra ther than Clas: but is also a resul t of improvements in the s t ruc tura l e f f ic iency deve loped by the aerosolve design process employed in this work.
25000
20000
c
f 15000 .- m
P 10000
zjij tu
5000
0
e 4 Preliminary Designs From This Work Earlier Designs From Windstats
A Latest Designs From Windstats ” - * Power ( Earlier Designs From WindStats) - -Power ( Latest Designs From WindStats)
f
A
I
0 20 40 60 80 100 120 Rotor Diameter (m)
Figure 4.1 Comparison of Weight Trends to Between Preliminary Designs and Windstats Published Data
The ab i l i ty o f the aerosolve des ign process to y ie ld cons tan t th ickness spar caps tha t a lmost f rom root to t ip extends the possibi l i ty of using preformed mater ia ls (pul t rusic dry preforms, etc.) as major spar cap consti tuents. Pultrusions may provide an efficit way to address f iber s t ra ightness , which has a s t rong e f fec t on compress ion s t rength . They may also be a prac t ica l , cos t e f fec t ive way to ach ieve sweep/ twis t coupl ing [25] Even i f o ther mater ia l forms are not employed, this design process offers f reedom fro ply drops, and s implif ied cut t ing and placement , wi th very low mater ia l wastage. FOI h igher cos t mater ia l such as carbon f iber , th i s could be a s ignif icant advantage no ma what form the carbon mater ia l takes .
48
5.0 REFERENCES
I
2
3
4
5
6
7
8
9
10
11
12
13
TPI Composi tes , “Parametr ic Study for Large Wind Turbine Blades”, SAND2002-25 19, August 2002.
TPI Composi tes , “Cost Study for Large Wind Turbine Blades”, SAND2003-1428, May 2003.
TPI Composi tes , “Innovat ive Design Approaches for Large Wind Turbine Blades”, SAND2003-0723, March 2003.
Systematic Calculat ion of High Duty Bol ted Joints , Verein Deutscher Ingenieure, VDI 2230, Aug. 1988.
Mandel l , J .F. , e t a l . , “Fat igue of Composi te Mater ia ls and Substructures for Wind Turbine Blades”, SAND2002-0771, 2002.
Drela , M. , “Newton Solut ion of Coupled Viscous/Inviscid Mult Flows”, AIAA Paper 90- 1470, June 1990.
ie lement Airfoi l
Dre l a , M . , “Integral Boundary Layer Formulat ion for Blunt Tra AIAA Paper 89-2 166, 1989.
i l ing Edges,”
Rogers , S . E. , and Kwak, D. , “An Upwind Differencing Scheme for the Time Accurate Incompressible Navier-Stokes Equat ions”, AIAA Journal , 28(2) , 1990, pp. 253-262.
Rogers , S . E., and Kwak, D., “An Upwind Differencing Scheme for the Steady- s ta te Incompressible Navier-Stokes Equat ions”, Journal of Applied Numerical Mathematics , 8(1) , 1991, pp. 43-64.
Pulliam, T.H., “Efficient Solution Methods for the Navier-Stokes Equations”, Lec ture Notes for the Von Karman Ins t i tu te for F lu id Dynamics Lec ture Ser ies : Numerica l Techniques for V iscous Flow Computation in Turbomachinery Bladings , Von Karman Inst i tute , Rhode-St-Genese, Belgium, 1985.
Buning, P.G. , Jespersen, D.C. , Pul l iam, T.H., Chan, W.M., Slotnick, J .P. , Kris t , S .E. , and Renze, K.J . , “Overf low User’s Manual 1 .8s”, NASA Langley Research Center , Hampton, VA, 2000.
Standish, K.J . , and van Dam, C.P. , “Aerodynamic Analysis of Blunt Trai l ing Edge Ai r fo i l s” , Journa l o f Solar Energy Engineer ing , Nov. 2003 ( in p ress ) .
Beam, R., and Warming, R.F., “An Implicit Finite-Difference Algorithm for Hyperbol ic Systems in Conservat ion Law Form”, Journal of Computat ional Physics, 22, 1976, pp. 87- 1 10.
49
14
15
16
17
18
19
20
21
22
23
24
25
Pul l iam, T.H. , “Time Accuracy and the Use of Implici t Methods”, AIAA Paper 93-3360, July 1993.
Spalar t , P .R. , and Allmaras , S .R. , “A One-Equat ion Turbulence Model for Aerodynamic F lows” , La Recherche Aerospa t ia le , ( l ) , 1994, pp . 5 -21 .
Chan, W.M., “The Overgrid Interface for Computational Simulations on Overset Grids”, AIAA Paper 2002-3 188, 2002.
Mayda, E.A. , “A CFD-Based Methodology to Automate the Generat ion of C-81 Airfoi l Performance Tables”, MS Thes is , Mechanica l and Aeronaut ica l Engineer ing, Universi ty of Cal i fornia , Davis , Aug. 2003.
Van Dam, C.P. , “Recent Experience with Different Methods of Drag Predict ion”, Progress in Aerospace Sciences, Vol . 35, No. 8, 1999, pp. 751-798.
Van Dam, C.P. , “On the Aerodynamic Design of Mult i -Element High-Lif t Systems”, Progress in Aerospace Sciences, Vol . 38, No. 2 , 2002, pp. 101-144.
Tangler, J .L. , and Somers, D.M., “NREL Airfoil Families for HAWTs”, NREL/TP-442-7 109, Jan. 1995.
Tangler , J .W., Personal Communicat ion, Feb. 2003.
Van Rooi j , R.P.J .O.M, and Timmer, W.A. , “Roughness Sensi t ivi ty Considerat ions for Thick Rotor Blade Airfoi ls” , AIAA Paper 2003-0350, 2003.
Law, S.P. and Gregorek, G.M., “Wind Tunnel Evaluat ion of a Truncated NACA 64-621 Airfoi l for Wind Turbine Applicat ions”, NASA CR-180803, 1987.
De Vries , E. , “Mult i -Megawatt Turbine Taking Hold”, Windstats Newslet ter , Vol . 15, No. 4, Autumn 2002.
Zuteck, M.D. , “Adapt ive Blade Concept Assessment: Curved Planform Induced Twist Invest igat ion”, SAND2002-2996, Oct . 2002.
50

J. Ahlgrimm Office of Wind and Hydro Technology
U.S. Department of Energy 1000 Independence Avenue SW Washington, DC 20585
EE-12
C. Arendt HITCO Carbon Composites, Inc. 1600 West 135'h St. Gardena, CA 90249
H. Ashley Dept. of Aeronautics and
Stanford University Stanford, CA 94305
Astronautics Mechanical Engr.
K. Bennett U.S. Department of Energy GFOiOffice of Project Management 16 17 Cole Blvd. Golden, CO 80401
K. Bergey University of Oklahoma Aero Engineering Department Norman, OK 73069
D. Berry (5) TPI Composites Inc. 373 Market Street Warren, RI 02885
R. Blakemore GE Wind 13681 Chantico Road Tehachapi, CA 93561
C. P. Butterfield NREL 16 17 Cole Boulevard Golden, CO 80401
G. Bywaters Northern Power Systems Box 999 Waitsfield,VT 05673
J. Cadogan Office of Wind and Hydro Technology
U.S. Department of Energy 1000 Independence Avenue SW Washington, DC 20585
EE- 12
D. Cairns Montana State University Mechanical & Industrial Engineering Dept. 220 Roberts Hall Bozeman, MT 597 17
S. Calvert Office of Wind and Hydro Technology
U.S. Department of Energy 1000 Independence Avenue SW Washington, DC 20585
EE- I2
J. Chapman OEM Development Corp. 840 Summer St. Boston. MA 02127-1533
Kip Cheney PO Box 456 Middlebury, CT 06762
C. Christensen, Vice President GE Wind 1368 1 Chantico Road Tehachapi, CA 93561
R. N. Clark USDA Agricultural Research Service P.O. Drawer 10 Bushland, TX 790 12
C. Cohee Foam Matrix, Inc. 1123 East Redondo Blvd. Inglewood, CA 90302
J. Cohen Princeton Economic Research, Inc. 1700 Rockville Pike Suite 550 Rockville, MD 20852
C. Coleman Northern Power Systems Box 999 Waitsfield, VT 05673
K. J. Deering The Wind Turbine Company 126 1 1 20th Ave. NE Bellevue, WA 98005
A. J. Eggers, Jr. RANN, Inc. 744 San Antonio Road, Ste. 26 Palo Alto, CA 94303
S. Finn GE Global Research One Research Circle Niskayuna, NY 12309
P. Finnegan GE Global Research One Research Circle Niskayuna, NY 12309
P. R. Goldman Director Office of Wind and Hydro Technology
U.S. Department of Energy 1000 Independence Avenue S W Washington, DC 20585
EE- 12
R. Gopalakrishnan GE Wind Energy GTTC, 300 Garlington Road Greenville, SC 29602
D. Griffin GEC 5729 Lakeview Drive NE, Ste. 100 Kirkland, WA 98033
C. Hansen Windward Engineering 466 1 Holly Lane Salt Lake City, UT 841 17
T. Hermann Wetzel Engineering, Inc. P.O. Box 4153 Lawrence, KS 66046- 1 153
D. Hodges Georgia Institute of Technology 270 Ferst Drive Atlanta, GA 30332
W. Holley GE Wind Energy GTTC, 300 Garlington Road Greenville, SC 29602
S. Hughes NREL 161 7 Cole Boulevard Golden, CO 80401
K. Jackson Dynamic Design 123 C Street Davis, CA 956 16
E. Jacobsen GE Wind Energy GTTC, 300 Garlington Road Greenville, SC 29602
G. James Structures & Dynamics Branch, Mail Code ES2 NASA Johnson Space Center 2101 NASA Rd 1 Houston, TX 77058
G. Kanaby Knight & Carver Yacht Center 13 13 Bay Marina Drive National City, CA 91950
D. Kasperski GE Wind Energy GTTC, 300 Garlington Road Greenville, SC 29602
M. Kramer Foam Matrix, Inc. PO Box 6394 Malibu CA 90264
A. Laxson NREL 16 17 Cole Boulevard Golden, CO 80401
Bill Leighty Alaska Applied Sciences, Inc. P.O. Box 020993 Juneau, AK 99802
Wendy Lin GE Global Research One Research Circle Niskayuna, NY 12309
S. Lockard TPI Composites Inc. 373 Market Street Warren, RI 02885
J. Locke, Associate Professor Wichita State University 207 Wallace Hall, Box 44 Wichita, KS 67620-0044
D. Malcolm GEC 5729 Lakeview Drive NE, Ste. 100 Kirkland, WA 98033
J. F. Mandell Montana State University 302 Cableigh Hall Bozemdn. MT 597 17
T. McCoy GEC 5729 Lakeview Drive NE, Ste. 100 Kirkland, WA 98033
L. McKittrick Montana State University Mechanical & Industrial Engineering Dept. 220 Roberts Hall Bozeman, MT 5971 7
P. Migliore NREL 16 17 Cole Boulevard Golden, CO 80401
A. Mikhail Clipper Windpower Technology, Inc. 7985 Armas Canyon Road Goleta, CA 93 1 17
W. Musial NREL 16 17 Cole Boulevard Golden, CO 80401
NWTC Library ( 5 ) NREL 16 17 Cole Boulevard Golden, CO 80401
B. Neal USDA Agricultural Research Service P.O. Drawer 10 Bushland, TX 790 12
T. Olsen Tim Olsen Consulting 1428 S. Humboldt St. Denver, CO 80210
R. Z. Poore Global Energy Concepts, Inc. 5729 Lakeview Drive NE Suite 100 Kirkland, WA 98033
J. Richmond MDEC 3368 Mountain Trail Ave. Newbury Park, CA 91320
Michael Robinson NREL 16 17 Cole Boulevard Golden, CO 80401
D. Sanchez U.S. Dept. of Energy Albuquerque Operations Office P.O. Box 5400 Albuquerque, NM 87 185
R. Santos NREL 16 17 Cole Boulevard Golden, CO 80401
S. Schreck NREL 16 17 Cole Boulevard Golden, CO 80401
Brian Smith NREL 16 17 Cole Boulevard Golden. CO 80401
J. Sommer Molded Fiber Glass CompaniesIWest 9400 Holly Road Adelanto, CA 93201
K. Starcher AEI West Texas State University P.O. Box 248 Canyon, TX 7901 6
A. Swift University of Texas at El Paso 320 Kent Ave. El Paso, TX 79922
J. Thompson ATK Composite Structures PO Box 160433 MS YC14 Clearfield, UT 840 16-0433
R. W. Thresher NREL 16 17 Cole Boulevard Golden, CO 80401
S. Tsai Stanford University Aeronautics & Astronautics Durand Bldg. Room 381 Stanford, CA 94305-4035
W. A. Vachon W. A. Vachon & Associates P.O. Box 149 Manchester, MA 0 1944
B. Vick USDA, Agricultural Research Service P.O. Drawer 10 Bushland, TX 79012
K. Wetzel Wetzel Engineering, Inc. PO Box 4153 4 108 Spring Hill Drive Lawrence, KS 66046- 1 1 53
R. E. Wilson Mechanical Engineering Dept. Oregon State University Corvallis,' OR 9733 1
M. Zuteck MDZ Consulting 601 Clear Lake Road Clear Lake Shores, TX 77565
M.S. 0557 M.S. 0557 M.S. 0708 M.S. 0708 M.S. 0708 M.S. 0708 M.S. 0708 M.S. 0708 M.S. 0708 M.S. 0708 M.S. 0708 M.S. 0708 M.S. 0847 M.S. 0958 MS. 1490 M.S. 0899 M.S. 9018
T. J. Baca, 9125 T. G. Carne, 9124 P. S. Veers, 6214 (20) T. D. Ashwill, 6214 (10) S. Begay-Campbell, 6214 D. E. Berg, 6214 P. L. Jones 6214 D. L. Laird, 6214 D. W. Lobitz, 6214 M. A. Rumsey, 6214 H. J. Sutherland, 6214 J. Zayas, 62 14 K. E. Metzinger, 9126 M. Donnelly, 14172 A. M. Lucero, 12660 Technical Library, 9616 (2) Central Technical Files, 8945-1
C. P. van Dam Dept of Mech and Aero Eng. University of California, Davis One Shields Avenue Davis, CA 95616-5294