
Innovations in Waste and Energy Case Studies from · PDF fileInnovations in Waste and Energy...
35
Innovations in Waste and Energy – Case Studies from AECOM 28 November 2013 | 9.30am | SEI Training Room 1 Dr Thomas Tang Director, Corporate Sustainability, AECOM Asia Company Limited
Transcript of Innovations in Waste and Energy Case Studies from · PDF fileInnovations in Waste and Energy...

Innovations in Waste and Energy – Case
Studies from AECOM 28 November 2013 | 9.30am | SEI Training Room 1
Dr Thomas Tang Director, Corporate Sustainability,
AECOM Asia Company Limited
Client logo
Professional Sharing Series
Dr. Thomas SK Tang
November 28, 2013

Client logo November 28, 2013 Professional Sharing Series Page 3
Outline
Background
Sustainable Cities
Energy
Waste
Pulling it together
Conclusions

Client logo
Background • What is a city?
– The essence of city life is a non-agricultural community that obtains most of its food by trading with the rural countryside or that extracts food from the countryside in a coercive manner (e.g. taxation, slaveholding, tribute).
– Where agricultural food sources and supply chains exist to provide for the needs of urban populations, activities such as manufacturing and services flourish as a function of urban density.
Sachs, J., Economics for a Crowded Planet (2008)
0
100
200
300
400
500
600
1975 1980 1985 1990 1995 2000 2005 2010 2015
Growth of Cities
10 million or more 5 to 10 million
1 to 5 million 500 000 to 1 million
Page 4 Page 4 Professional Sharing Series November 28, 2013

Client logo
Cities versus countryside
• The advantages of urbanization are:
– Specialization and division of labor leading to advances in technology, science and productivity
– Lower costs per person in providing power, water, housing, education etc. due to urban densities
• The disadvantages are:
– Neglect of the rural communities forcing the latter to migrate into cities in search of employment and job opportunities
– Concentration of pollution in urban areas
– Risk of spread of infection due to concentrated populations
– Higher impacts from natural disasters (e.g. earthquakes, floods, landslides)
Page 5 Page 5 November 28, 2013 Professional Sharing Series

Client logo Page 6
Emerging Challenges • Growing urban populations
– Share of urbanization: 29% in 1950 50% in 2007.
– Today, developed world has 75% share (c.f. developing world’s share of 44%)
– By 2030, world is expected to reach 60:40 split between urban and rural populations.
• Changing demographics
– Need to re-design more facilities for ageing populations, as longevity of citizens increases due to better healthcare and living conditions
• Division of economic sub-groups
– Increasing disparities in wealth, exacerbated by divisions in housing standards with class-oriented buildings.
Page 6
But the biggest challenge will be that of climate adaptation.
Page 6 Page 6 November 28, 2013 Professional Sharing Series

Client logo
Sustainable Cities
• Mobility - extensive use of public transport systems and pedestrianized areas, integrated zones for residential, industrial and commercial use
• Optimal building density – compact liveable spaces
• Greater adoption of renewable energy
• Urban water demand management - an integrated approach for safeguarding of supply sources and maintaining efficient delivery and disposal systems
• Large park systems and open spaces with extensive greenery and natural ventilation systems
• Smart growth – reduced urban sprawl and construction of green buildings or green retro-fitting
Modern and environmentally friendly approaches must be
adopted for urban design, city planning, public transit, energy
and buildings
Page 7 Page 7 November 28, 2013 Professional Sharing Series

Client logo
Energy

Client logo November 28, 2013 Presentation Title Page 9
Energy and Cities
“… you can see China’s middle class rising right before your eyes, and it is going to have enormous energy and environment spillover. The Great Chinese Dream, like the Great Indian Dream, the Great Russian Dream and the Great American Dream is built around a high energy, high-electricity, high-bent-metal lifestyle.”
Friedman, T., “The World is Flat” (2005)
According to the Clinton Climate Initiative, cities worldwide consume
some 75 per cent of the world's energy and are responsible for up to 75 per cent
of the greenhouse gas emissions that are linked to climate change.
The IPCC expects that by 2020, electricity use globally will have grown by 76 percent
based on 2005 levels.

Client logo November 28, 2013 Presentation Title Page 10
Buildings
Residential 26%
Commercial 66%
Industrial 6%
Transport 2%
Electricity Usage by Sector
Space Conditioning
54% Lighting 24%
Refrigeration 10%
Industrial Process
Equipment 12%
Electricity End Uses
Buildings are responsible for 63% of overall energy usage and 92% of electricity
usage.
54% of electricity is consumed by space cooling and 24% by lighting
Hong Kong data

Client logo November 28, 2013 Presentation Title Page 11
World Financial Centre,
Beijing
• Most technologically advanced, energy
efficient and sustainable Grade A office
building in the region, obtaining Platinum in
both LEED & BEAM
• Computational Fluid Dynamics (CFD) used to
simulate the interactions between
temperature, heat flow, buoyancy and air flow
in and around the building. Information from
CFD model useful for analysis of building
orientation and distribution of buildings in
design stage, thus optimizing the master
planning.
• Daylight analysis conducted to analyze
daylight level at indoor space, assisting
designers and architects in optimizing the use
of natural daylight for energy efficiency and
visual comfort.
• Energy Simulation conducted to simulate the
annual energy use of the building, assisting in
the evaluation of energy efficiency of the
design.

Client logo November 28, 2013 Presentation Title Page 12
Zero Carbon Building,
Hong Kong
• Overall target < 100 kWh/sq m/year
• Passive strategies
• Minimizing heat gain - glazing and window
optimization
• Natural ventilation - windows and layout
optimization, eco-tower wind catchers
• Daylighting - enhanced layout, light pipes
• Active systems
• Energy recovery - heat wheel, desiccant
dehumidification
• Efficiency space conditioning - radiant
cooling, under floor air supply
• Smart systems - low energy lighting,
occupancy and condition sensors
• Renewable energy
• Photovoltaic
• CHP

Client logo November 28, 2013 Page 13
Swire Coca-Cola Plant, China
13
Solar Light Tube
Skylights
Low-e glass
Solar Hot water system
High-Albedo Painting
Greywater storage tank
Wind and PV hybrid
streetlights
Solar Shading
Lifecycle carbon footprint studied from construction, operation, and the production. Building operation carbon footprint reduced by 15% compared to other similar in China Total embodied carbon footprint per Liter of Coca-Cola Bottling Production reduced from 64.9gCO2 to 61.4gCO2. Reduction ratio is 5.4%.
Computer simulation used to model the building orientation, envelope, HAVC, lighting, mechanical equipments and domestic hot water for the whole project. The final electricity reduction is 24%, steam reduced by 42%, and water use for irrigation and toilet saved by more than 90%.
Energy
consumption
(kWh/year)
Steam
Consumption
(Tons/year)
Water
Consumption
(L/year)
ASHRAE 90.1-
2007standards
23,157 25,479 406,293
Swire Coca-Cola Luohe
project
17,611 14,753 11,500
Energy and Water Savings 23.9% 42.1% 97.1%
Professional Sharing Series

Client logo November 28, 2013 Presentation Title Page 14
Novartis Shanghai
Pharmaceutical Campus • During the early stages of schematic design particular attention
was given to Air Conditioning solutions focusing on a comparison
of overhead and under-floor solutions in regard to comfort and
energy.
• Target of 624 MJ/m2. Developed design resulted in an energy
consumption of 511.4MJ/m2 –18% reduction on target.
• Additional energy saving approaches: Variable speed variable
volume HVAC, fresh air monitoring and control, high efficiency
pumps, rainwater harvesting, intelligent lighting control, LED
lighting and intelligent B.M.S.
Building 501 - Office
Building 503 - Office
Building 502 - Laboratory
Heating/Cooling Design Operation Conditions Comparison of solutions
Recommendations
proved through
analysis

Client logo November 28, 2013 Presentation Title Page 15
Asia Square, Singapore
• Estimated energy savings: 5,840,460 kWh/yr
and water savings: 40,982 m3/yr.
• Passive low energy design for building façade
to achieve ETTV of 35.1 W/m2. Natural
ventilated citi room instead of by means of
active system.
• Enthalpy heat recovery wheel to recover
cooled exhausted air for fresh air pre-cooling
at PAHU.
• Integrated heatpipes design for cooling coil at
PAHU for efficient dehumification and
temperature control.
• Sunpipes to harvest daylighting into carpark
podium and roof stairs.
• Incorporated 192 kWp of Solar Photovoltaic
panel to harvest solar energy for electricity
production of roof.
• Singapore’s first on-site bio diesel plant to
convert waste cooking oil for bio diesel
production.

Client logo
Urban Land Institute
Pause for thought ….

Client logo
Waste

Client logo
Waste and Cities
If most the world’s 6 billion people today were in cryogenic storage and neither eating, breathing, nor metabolizing that large population would cause no environmental problems. Instead our numbers pose problems in sofar as we consume resources and generate wastes. That per-capita impact varies greatly around the world, being highest in the First World and lowest in the Third World. On average, each citizen of the U.S. western Europe and Japan consumes 32 times more resources such as fossil fuels and puts out 32 times more wastes than do inhabitants of the Third World.
Diamond, J., “Collapse. How Societies Choose to Fail or Survive” (2005)

Client logo
Managing Waste Problems
• As cities expand so do the challenges of urban solid waste management
• Consumption lifestyles based on one-trip products and inducements to consume more than needed
• Mixture of infrastructure and policy measures needed to keep costs of solid waste management down
• Public behavior is crucial for successful solid waste management strategies
• How do we integrate solid waste management as part of the planning process?

Client logo
Waste Hierarchy
• The Waste Hierarchy is a standard approach for most cities
• Availability of highly adept technologies for collecting, sorting and disposal of waste
• Polluter pays principle now widely applied in many cities by various means
• Producer responsibility places onus on manufacturers and the supply chain; examples are used product take-back, deposit return etc.
• Manufacturers applying design for environment (DfE) principles to value-added good e.g. photocopiers
• Recycling industry needs to move to more eco-efficient configuration

Client logo
The Circular Economy Model
Page 21 November 28, 2013
Entry
Mid-Stream
Value-Added Processing
Eco-Efficiency
Secondary Manufacturing
Market Re-Entry
Efficient supply chains move used products waste from collection points to secondary manufacturers and ship back remanufactured/reconditioned
or recycled products
Recycling companies and processes are organized to match the types of wastes shipped out and the recycled
goods shipped back into society
Support from management and technology practices to ensure energy efficiency and pollution
prevention
Products designed for disassembly and recovery so that materials can be re-used or recycled into primary
and secondary processes respectively
Demand for remanufactured/reconditioned or recycled goods over virgin goods through incentives or penalties for
consumers
Used products are sorted and enter the circular economy through take
back schemes or Producer Responsibility Schemes
Source: A Model for the Circular Economy in
the Pearl River Delta
Professional Sharing Series

Client logo
Integrated Waste Management
Facility (Hong Kong)
• Treatment capacity of 3,000 tonnes each day using moving grate incineration as the core treatment technology
• Demonstration sorting and recycling plant with a treatment capacity of 200 tonnes per day to test the operational viability and cost effectiveness of recovering the recyclables from the MSW prior to the incineration process.
• MSW received at existing transfer stations will be compacted in tightly sealed containers and delivered to the IWMF by dedicated container vessels.
• The EIA Studies estimate 480 MWh electricity (amounts to about 1% of the total electricity consumption in Hong Kong) will be generated.
November 28, 2013 Professional Sharing Series

Client logo
Organic Waste Management
Facility, Hong Kong
• In 2007, organic waste including food waste made up approximately 39.4% of the total Municipal Solid Waste (MSW) generated in Hong Kong.
• OWTF proposed to treat 200 tonnes of source-separated organic waste per day and generate 7.9 million m3 surplus biogas for off-site utilization.
• Feasible options and waste generators identified for the collection of targeted organic waste.
• Resources recovered in the process, like biogas and compost, investigated for marketability, potential outlets and electricity generation.

Client logo
Glass Recycling
• Introduction of glass bottle levy - Government to impose a monetary tax on each bottle sold in Hong Kong (either imported or manufactured locally).
• Money collected to form a fund from which the Government could subsidise the collection and transportation of waste glass, as well as fund local recycling facilities.
• Levy to cover 100% of the beverage producers and companies dealing with products that use glass bottles in Hong Kong.
• Amount of the levy to cover the costs incurred by the Government in collecting and transporting glass bottles, including all labour costs and expenses of maintaining and operating the required facilities.
• Industry to share burden of collection through costs of implementation of producer responsibility scheme.

Client logo
Sustainable Design – Case Study
November 28, 2013 Professional Sharing Series

Client logo
Case Study - Waste Background
• The aim of the waste management strategy is to develop a zero-landfill district by reducing the amount of waste generated and finding ways to reuse and recycle as much as possible, before finally looking at ways of dealing with the resulting waste generated from incineration before that is sent to landfill.
• The key waste streams include residential waste, non-residential waste, food waste from commercial outlets, horticultural waste, and construction and demolition waste. There is a Pneumatic Refuse Collection System (PRCS), planned to be implemented.
• Key Performance Indicators are: – Project-wide Waste Recycling Rate
– Landfill Diversion and Reduction Rate i.e. IBA sent to the landfill
• To determine the effect on the KPIs, a series of potential recycling measures were identified and analyzed with respect to its effectiveness, cost and benefit based on a range of implementation options.
Client logo
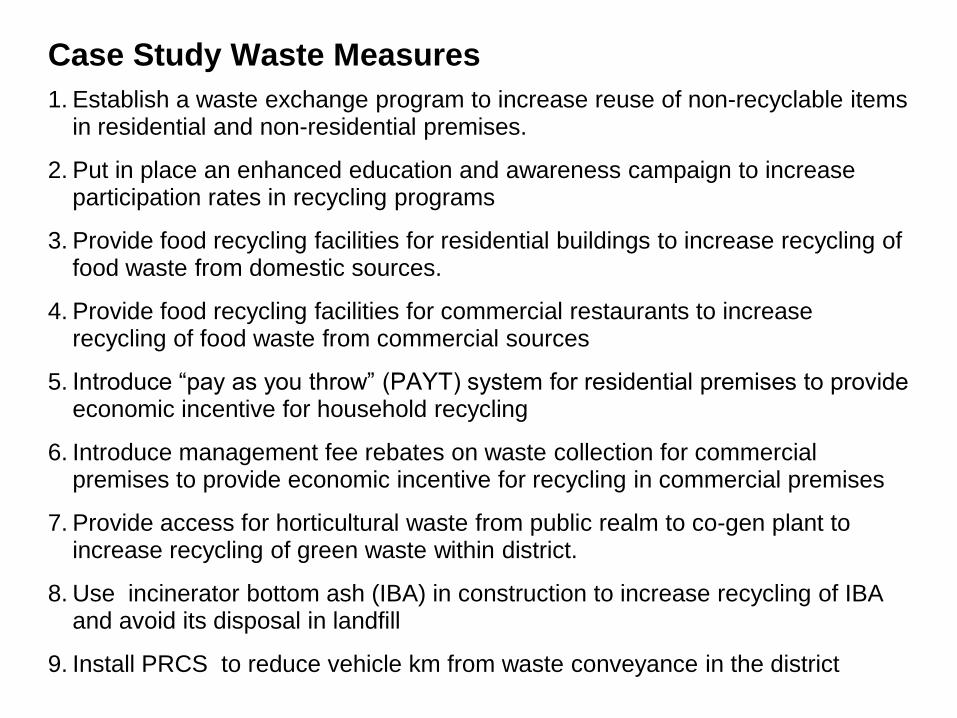
Case Study Waste Measures
1. Establish a waste exchange program to increase reuse of non-recyclable items in residential and non-residential premises.
2. Put in place an enhanced education and awareness campaign to increase participation rates in recycling programs
3. Provide food recycling facilities for residential buildings to increase recycling of food waste from domestic sources.
4. Provide food recycling facilities for commercial restaurants to increase recycling of food waste from commercial sources
5. Introduce “pay as you throw” (PAYT) system for residential premises to provide economic incentive for household recycling
6. Introduce management fee rebates on waste collection for commercial premises to provide economic incentive for recycling in commercial premises
7. Provide access for horticultural waste from public realm to co-gen plant to increase recycling of green waste within district.
8. Use incinerator bottom ash (IBA) in construction to increase recycling of IBA and avoid its disposal in landfill
9. Install PRCS to reduce vehicle km from waste conveyance in the district

Client logo

Client logo
Selection of Package
• Based on AECOM’s SSIM analysis and discussions with the client, the recommended package for implementation for sustainable waste management out of the proposed eight packages would be Package 5.
• The focus of Package 5 is on food waste recycling within the district with measures including establishing an online waste exchange program providing food waste recycling facilities in commercial restaurants and recycling of horticultural waste.
• Package 5 can help in achieving Project Wide Recycling Rate of 78%. It is recommended for implementation in MB-GSW due to its compliance with the following objectives for sustainable waste management in the district:
– Achieve target KPIs and high landfill diversion rate for lower Capital Expenditure and Operational Expenditure compared to other packages that achieve similar rates;
– Incorporate food recycling as way of achieving higher recycling rates;
– Focus on retail food recycling to avoid costs and implementation
– issues in introducing food recycling in residential buildings; and
– Limit costs to private developer.

Client logo Page 30 Page 30 Page 30 Page 30 Page 30 November 28, 2013 Professional Sharing Series
Pause for thought ….

Pulling it together
Client logo
Integrated planning and
design
ICT platforms
Community engagement
Political leadership
Strategic economic modeling
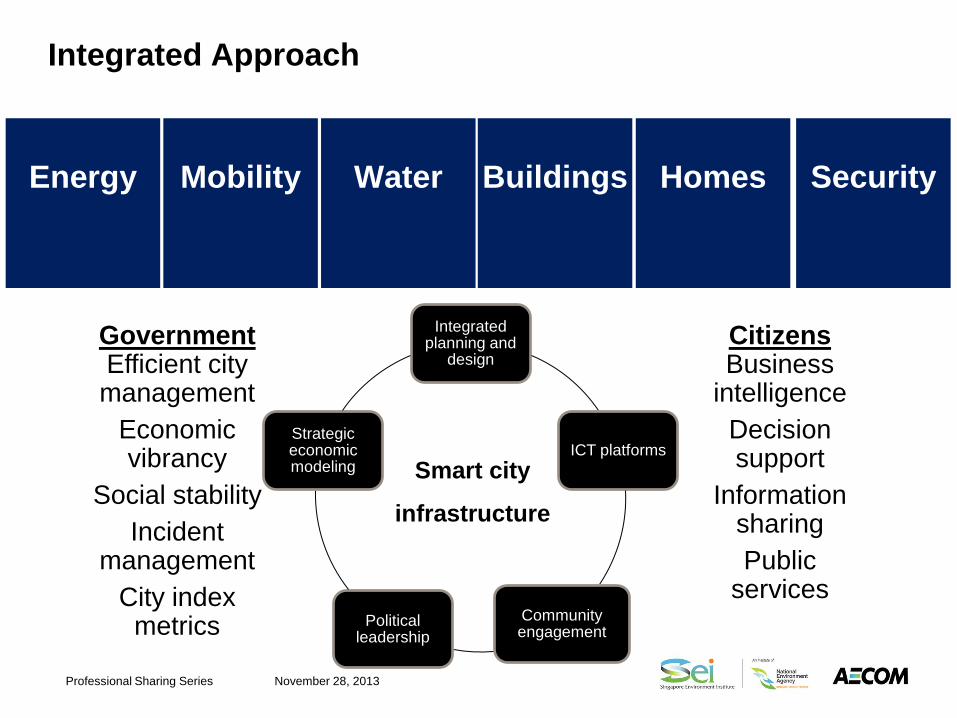
Integrated Approach
Energy
Water
Buildings
Homes
Security
Mobility
Smart city
infrastructure
Government Efficient city management
Economic vibrancy
Social stability
Incident management
City index metrics
Citizens Business
intelligence
Decision support
Information sharing
Public services
November 28, 2013 Professional Sharing Series
Client logo
Smartness or Wisdom?
• “We do a lot of analytics. When we crunch the numbers, cities get tired of hearing about ‘smart.’ Where is the wisdom? What is the outcome? Who are you today really? What kinds of problems are you having with poverty alleviation, for example? Who are you trying to become? What is the city you are trying to govern?” Truly, where we should be moving is from ”smart” cities to ”wise” cities.
Gary Lawrence, Chief Sustainability Officer, AECOM
November 28, 2013 Professional Sharing Series

Safeguard • Nurture • Cherish